Back to Journals » Clinical Epidemiology » Volume 12
Validity of Claims Diagnosis Codes for Cardiovascular Diseases in Diabetes Patients in Japanese Administrative Database
Authors Ono Y ![]() , Taneda Y, Takeshima T, Iwasaki K, Yasui A
, Taneda Y, Takeshima T, Iwasaki K, Yasui A
Received 10 January 2020
Accepted for publication 20 March 2020
Published 8 April 2020 Volume 2020:12 Pages 367—375
DOI https://doi.org/10.2147/CLEP.S245555
Checked for plagiarism Yes
Review by Single anonymous peer review
Peer reviewer comments 3
Editor who approved publication: Professor Henrik Toft Sørensen
Yasuhisa Ono,1 Yusuke Taneda,1 Tomomi Takeshima,2 Kosuke Iwasaki,2 Atsutaka Yasui1
1Medical Department, Nippon Boehringer Ingelheim, Tokyo, Japan; 2Milliman Inc., Tokyo, Japan
Correspondence: Yasuhisa Ono
Nippon Boehringer Ingelheim, 2-1-1 Osaki, Shinagawa-ku, Tokyo 141-6017, Japan
Tel +81-3-6417-2612
Fax +81-3-5435-2918
Email [email protected]
Background: Observational studies using large claims databases for diabetes patients have been increasingly conducted. While validation of outcomes is important in such studies, validation studies from Japan are still scarce and small in scale with questions remaining on the representativeness of their findings. We examined the positive predictive value (PPV) of outcomes that often develop in type 2 diabetes patients: cardiovascular outcomes including congestive heart failure (CHF), myocardial infarction (MI), stroke-related diseases, and renal outcomes including end stage renal disease (ESRD), and death using a large Japanese database containing administrative claims and electronic medical record (EMR) data.
Patients and Methods: We used patient-level administrative claims data from 2003 and EMR data from 1985 to the most recent data up to December 2018 provided by Real World Data Co., Ltd. The database consisted of data from over 200 hospitals including ≥ 12 million uniquely identifiable patients. Among patients who had ≥ 1 type 2 diabetes diagnosis in the EMR, those who had administrative claims for each outcome were identified, and then the PPV was calculated for each outcome using the EMR as the gold standard.
Results: The numbers of patients identified for each outcome were 1,700 for MI, 2,027 for hemorrhagic stroke, 3,722 for ESRD, 4,723 for ischemic stroke, 5,404 for CHF, 6,678 for any type of stroke, and 10,815 for death. PPVs ranged from 67.4% for ESRD, 78.7% for MI, 80.3% for death, 85.7% for ischemic stroke, 88.9% for any type of stroke, 89.9% for hemorrhagic stroke, and 95.7% for CHF. A post hoc analysis showed PPV for ESRD as 83.8%.
Conclusion: This large-scale validation study on diagnosis in administrative claims showed reasonable PPVs for the outcomes. We believe that the definitions of outcomes can be considered to be appropriate for future studies using Japanese administrative claims data.
Keywords: ESRD, stroke, myocardial infarction, CHF, PPV, outcomes definition
Introduction
Administrative healthcare databases have been increasingly used for studies to investigate treatment patterns, patient demographics, healthcare resource use, and treatment cost, as well as to estimate the effectiveness and safety of medicinal products in the real world clinical setting.1–6 In Japan, claims databases became available for commercial use in the early 2000s,7 and the government has constructed a database containing administrative claims from the entire Japanese population, and these data are currently provided to academia on request.4,5
Hospitals are adopting the diagnostic procedure combination/per-diem payment system (DPC/PDPS) in Japan.8 Known as DPC hospitals, these facilities issue both DPC claims that include particular kinds of treatment conducted within hospitalization, and fee-for-service claims. DPC hospitals are obliged to make and submit the DPC data to MHLW. DPC data is generated by hospital clerks to the format designated by MHLW. The other hospitals are called as non-DPC hospitals. All the hospitals have to make claims data for re-imbursement. Hospital EMR system contains patient demographic data, medical history, progress notes in both in and outpatient setting, prescription, laboratory and imaging data, operative notes, various reports by specialists, physician diagnosis contained in the ordering system, and nursing records. Hospitals submit to HCEI (Health, Clinic, and Education Information Evaluation Institute) anonymized data on patient demographics, prescription, laboratory data, and physician diagnosis in the ordering system from their EMR system. Databases consisting of claims data from these DPC hospitals are commercially available, and have been used for various clinical studies.1–3,6
In the field of diabetes treatment, several real-world evidence studies have been published using these large claims databases, including Japanese data from DPC hospitals. These studies typically evaluate the effectiveness of diabetes drugs in reducing the occurrence of cardiovascular outcomes such as hospitalized heart failure, stroke, myocardial infarction and cardiovascular and all cause death.3,6,9
The validity of these study outcomes defined using claims codes is crucial when assessing results from database analysis in order to reduce misclassification bias. Yamana et al conducted a validation study of 16 disease codes for the Charlson Co-morbidity Index in DPC data against electronic medical record (EMR) chart reviews as the gold standard.10 In another validation study, Ando et al evaluated the validity of claims code with International Classification of Diseases, 10th Revision (ICD-10) for acute MI in both DPC and non-DPC claims from a single hospital. This study selected a 200 patient random sample from the DPC claims and compared this with a cardiologist confirmed diagnosis of MI as the study gold standard.11 Since Yamana’s study was conducted with data from only four hospitals and Ando’s at a single center, the generalizability of the studies is considered to be limited. To the best of our knowledge, no validation study for outcome of renal diseases has been conducted yet in Japan.
The purpose of this study is to evaluate the PPV of cardiovascular outcomes (congestive heart failure [CHF], MI, and stroke-related diseases), renal outcomes (mild or moderate chronic kidney disease [CKD] and end stage renal disease [ESRD]), and death for patients with type 2 diabetes defined by administrative claims using a large nationwide database with physician order diagnosis in EMR as the gold standard.
Patients and Methods
Study Design and Data Source
This is a validation study of outcomes defined by administrative claims data using EMR as the gold standard. EMR diagnosis as the gold standard was adopted for this study because EMR diagnosis in the physician ordering system reflects directly the judgment of the physician taking care of the patient except in the case of death diagnosis. We considered that the EMR diagnosis more accurately reflects the clinical reality of the patient in question.
We used a commercial database maintained by Health, Clinic, and Education Information Evaluation Institute (HCEI: Kyoto, Japan)—a not-for-profit research service foundation, with support from Real World Data Co, Ltd (Kyoto, Japan). The database consisted of records from over 12 million uniquely identifiable patients who were treated in approximately 200 hospitals which agreed to provide the data to RWD company. The hospitals include various types of hospitals, private and public, from large medical centers (bed number >1,000) to clinics, from Hokkaido to Okinawa geographically. The database contained anonymized EMR data from January 1985 to December 2018 and included information on demographics, physician ordering diagnosis, prescriptions, and laboratory results from both outpatient and in-patient services. The patient-level EMR/claims data are linked with unique identifier and anonymized at each hospital in compliance with the Japanese Guideline on Anonymization Method based on the Japanese Private Information Protection Act. HCEI obtains the linked claims and EMR data after anonymization at the hospitals which agree to provide the data to HCEI. The EMR diagnosis data are from both in and out-patient setting, and even if physician diagnosis is entered as free text by physicians, RWD company converts free text information into the standard disease coding system. The administrative claims data can be categorized into three groups, namely those from non-DPC hospitals, from DPC hospitals, and if it involves hospitalization at DPC hospitals, additional Form 1 data with DPC admission diagnosis is included. In addition to the EMR data, the database contained DPC claims data between November 2006 and October 2018 and included procedure claims as well as discharge summary diagnoses for seven types of conditions: 1) greatest-resource consuming condition, 2) trigger-for-hospitalization condition, 3) main condition, 4) other condition, 5) second greatest-resource consuming condition, 6) comorbidities at the time of admission, and 7) conditions occurring during the hospitalization. The diagnosis in claims side is entered by the clerical staff at each hospital after reviewing the outpatient and in-hospital discharge summary prepared by physicians for the purpose of insurance reimbursement by the Japanese Ministry of Health. The study period, November 2006—October 2018, was set later than 2003 when DPC/PDPS was first adopted in Japan.
This study was approved by the ethics committee at the Research Institute of Healthcare Data Science (Tokyo, Japan) (RI2019003).
Study Population
A dataset used in this study included patients who had at least one claim with diagnosis of diabetes (coded as E10-E14 by ICD-10) in either EMR or administrative claims. We then extracted patients having at least one diagnosis of type 2 diabetes (coded as E11 or E14 by ICD-10) in EMR from the dataset. Among them, the patients having at least one of any administrative claim were identified as the study population.
Variables and Outcomes
We evaluated the validity of outcomes that often develop in patients with type 2 diabetes. We then classified the outcomes which are usually associated with hospitalization to be primary outcomes: 1) CHF, 2) ischemic stroke, 3) hemorrhagic stroke, 4) any type of stroke, 5) ESRD, 6) MI, and 7) death. An outcome usually not associated with hospitalization was classified as a secondary outcome: mild or moderate CKD. For the primary outcomes, we used DPC claims as the administrative claims. DPC claims are the claims issued in DPC hospitals, and include discharge summary data and procedure data conducted within hospitalization. Diagnosis of the DPC claims is defined as that in any one of 1) greatest-resource consuming condition, 2) trigger-for-hospitalization condition, or 3) main condition. Table 1 shows a definition of each outcome for administrative claims and EMR.
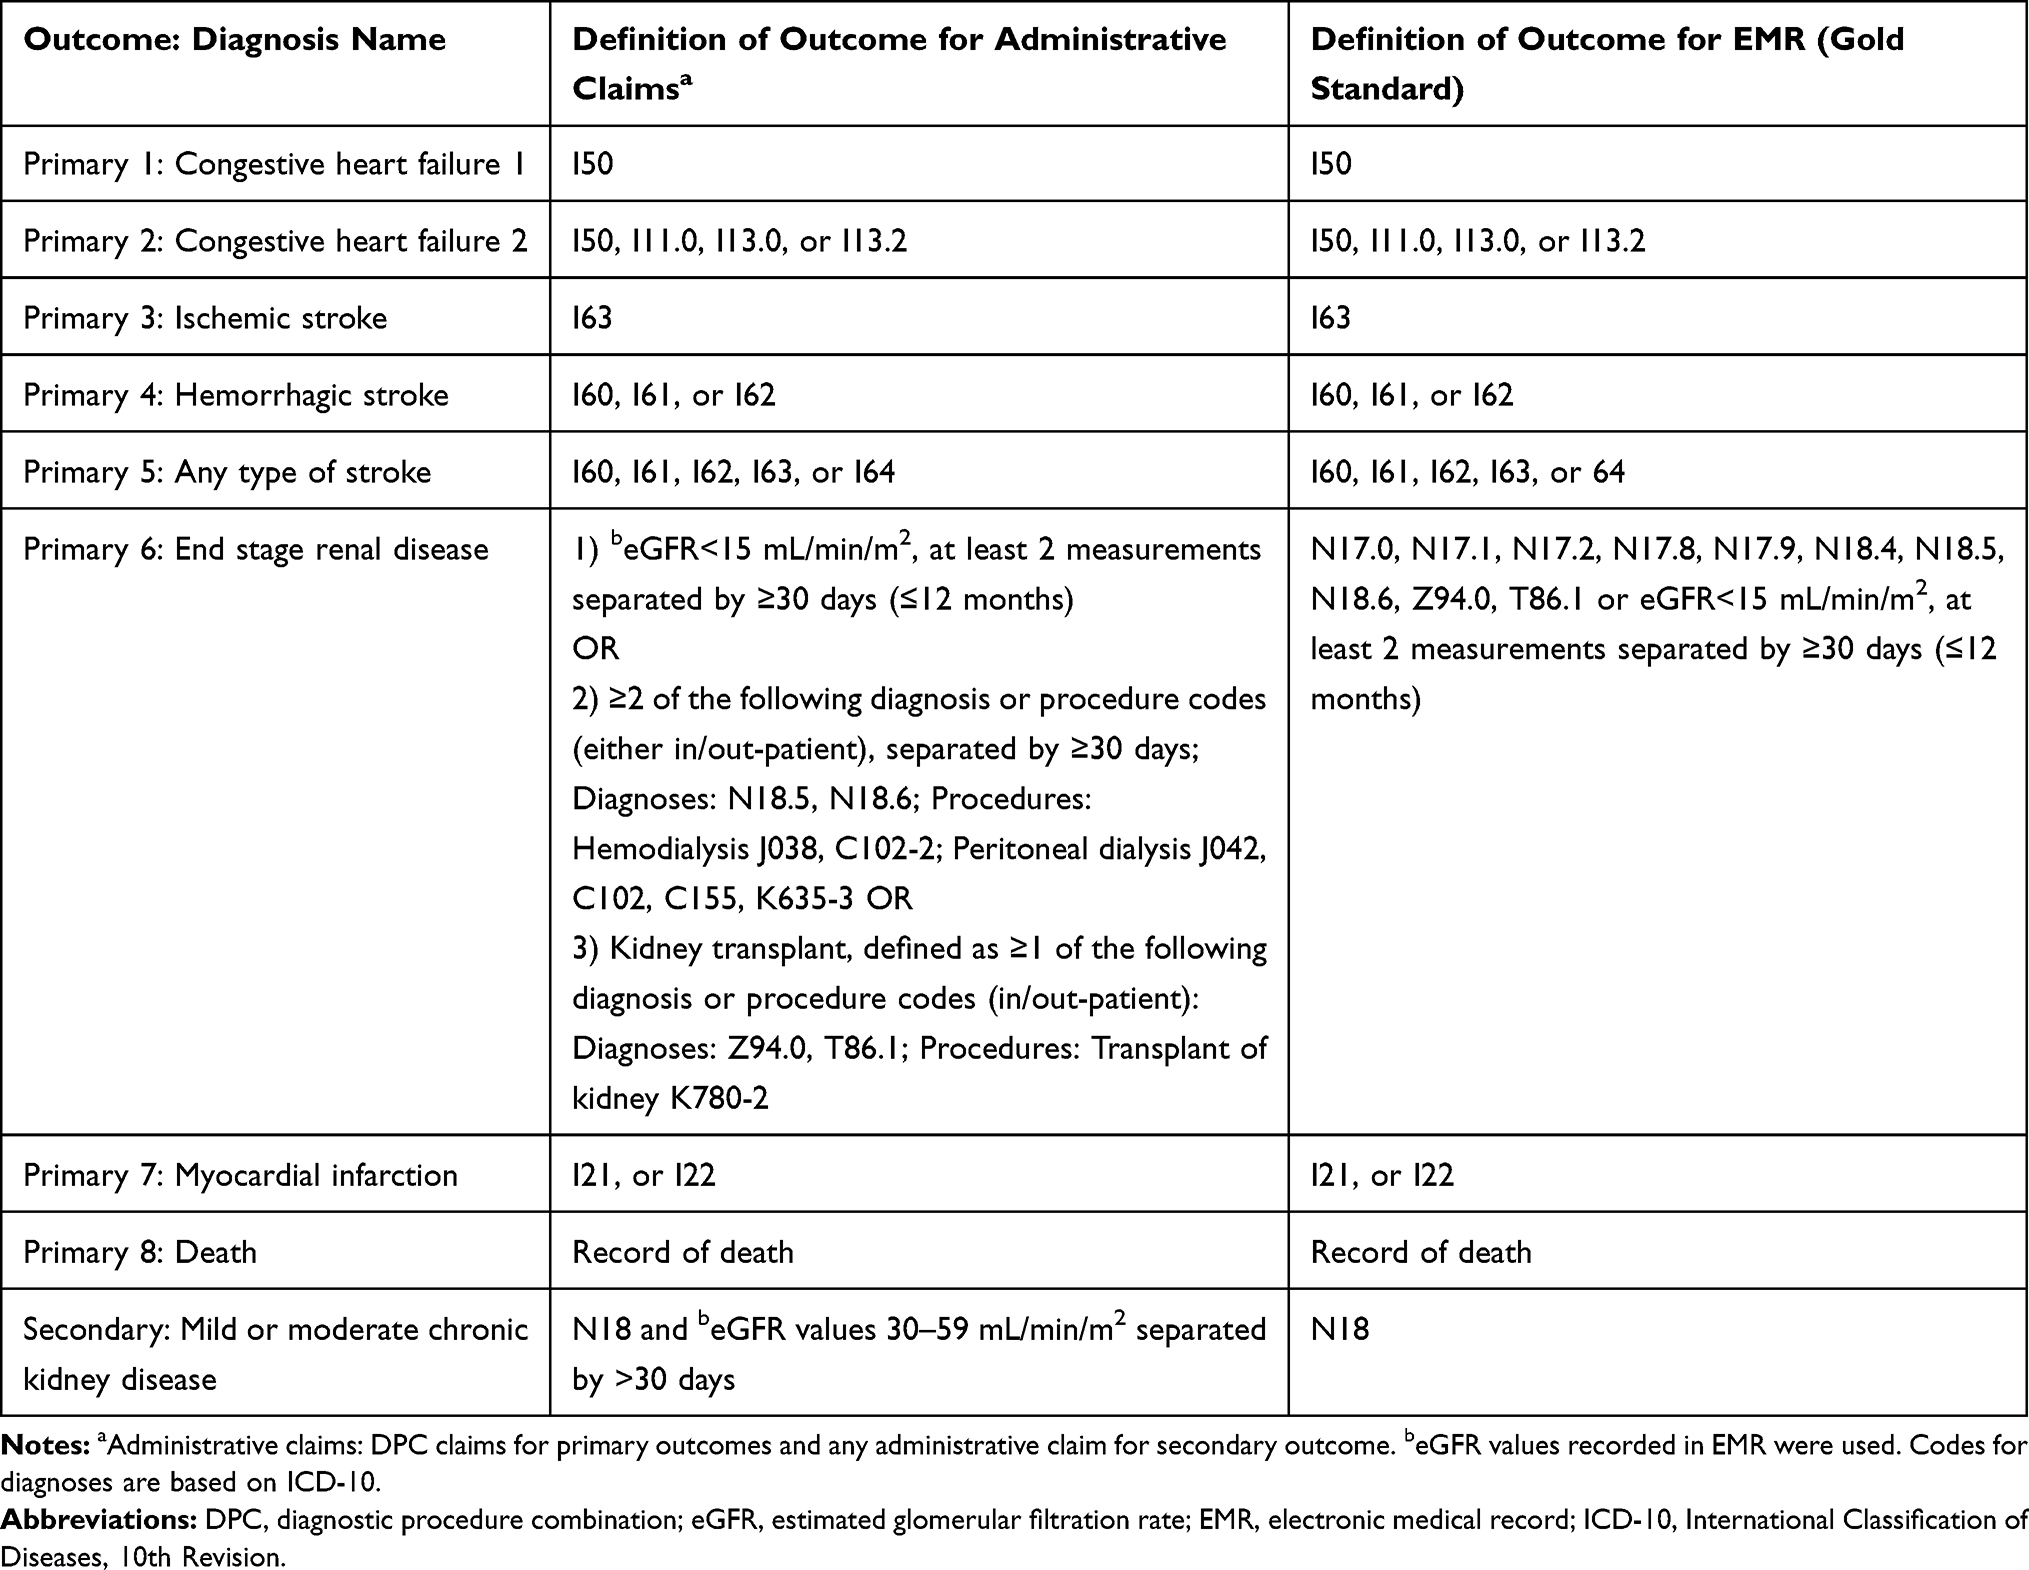 |
Table 1 Definition of Primary and Secondary Outcomes for Administrative Claims and EMR |
In order to explore the reason for relatively low PPV of ESRD, we conducted a post hoc analysis to investigate the distribution of ICD-10 codes for patients with <15 mL/min/m2 of estimated glomerular filtration rate (eGFR), which was considered as ESRD. Based on the result, we added N18.0 to the definition for both administrative claims and EMR.
Statistical Methods
The PPV (%) was calculated for each outcome as below:
- For primary outcomes 1–5 and 7, we identified “potential outcomes” in DPC in the denominator to see how many of those qualify as an appropriate event in the EMR in the numerator, to calculate the PPVs for each outcome.
- Denominator: cumulative number of hospitalizations for the outcome in question defined by administrative claims. If a patient experiences more than one outcome, the total, or cumulative, number of outcomes is included in the denominator.
- Numerator: cumulative number of hospitalizations included in the denominator which was also captured in the EMR as an appropriate outcome during the same time period in each patient.
- For primary outcomes 6 and 8, and secondary outcome
- Denominator: number of patients for the outcome defined by administrative claims.
- Numerator: number of patients defined for the outcome by EMR among those counted as denominator.
Descriptive statistics on patients’ demographics (average and standard deviation [SD] of female percentage and birth year or age) was conducted for patients in each step to identify study population and those identified for each outcome.
Prior to conducting our study, a feasibility assessment was conducted on the sample size and precision of PPV estimates. 900,451 patients were found to have demographic patient-level data as well as the disease data in both EMR and claims files. It was expected that PPV is calculated with data from more than 10,000 patients with outcome of interest based on the DPC hospitalization diagnosis code or non-DPC claims diagnosis code. With the assumption of sample size of 10, 000 and estimated PPV ranging from 60% to 90%, the precision of the estimates (width of 95% confidence interval) were 60% (1.9%), 70% (1.8%), 80% (1.6%), 90% (1.2%). Thus, sample size in this study was considered large enough.
SAS version 9.4 and Microsoft Excel 2010 were used for statistics.
Results
Patients
Figure 1 shows the flow diagram to identify the study population, and the number of patients and their demographics in each step. The total number of patients included in the study population was 312,213. Their average birth year was 1947 (SD: 15.7), and percentage female was 45.3%. This was similar to the excluded patients.
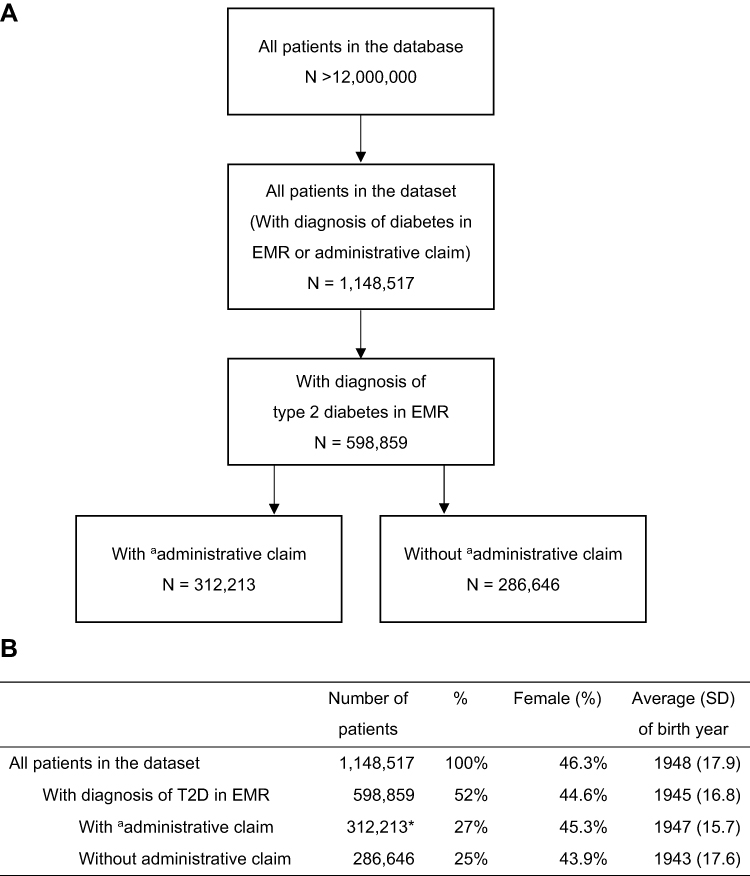 |
Figure 1 Flow diagram (A) and demographics (B) for identification of study population. Notes: aAdministrative claim, any of administrative claim at least one. *Indicates study population. Abbreviations: EMR, electronic medical record; SD, standard deviation; T2D, type 2 diabetes. |
The number of patients identified for each outcome based on the administrative claims is shown in Table 2 with their demographics. Patients who had a record of death were the largest group at 10,815. MI was the smallest at 1,700. Patients diagnosed with ESRD were the youngest (69.6 years), and CHF (both definitions) the oldest (79.1 years).
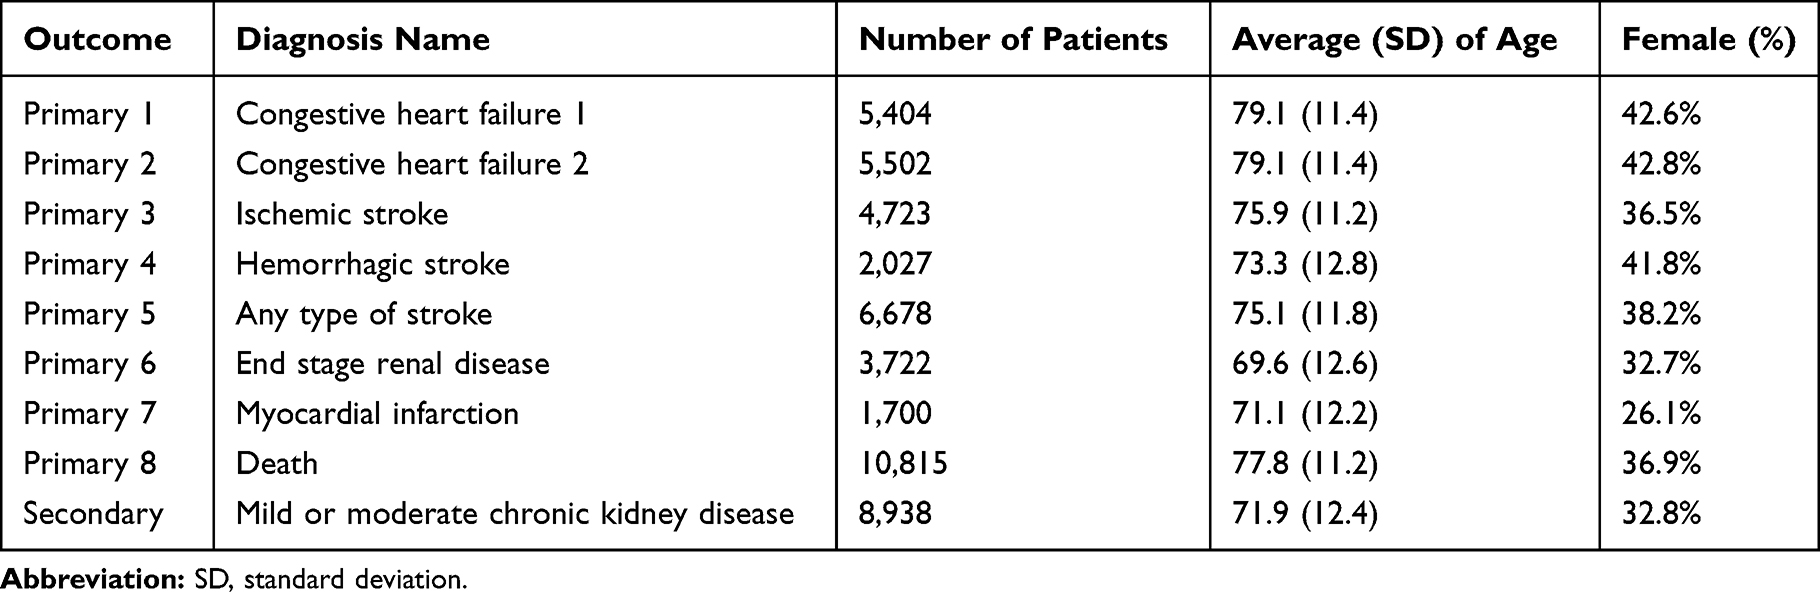 |
Table 2 Number and Demographics of Patients for Each Outcome Based on the Definition for Administrative Claims |
Positive Predictive Value for Each Outcome
Table 3 describes the PPV with 95% confidence interval (CI) for each outcome. CHF2 had the highest average PPV, 95.7%, followed by CHF1, 95.6%, mild or moderate CKD, 93.0%, hemorrhagic stroke, 89.9%, any type of stroke, 88.9%, ischemic stroke, 85.7%, death, 80.3%, MI, 78.7%, and ESRD, 67.4%.
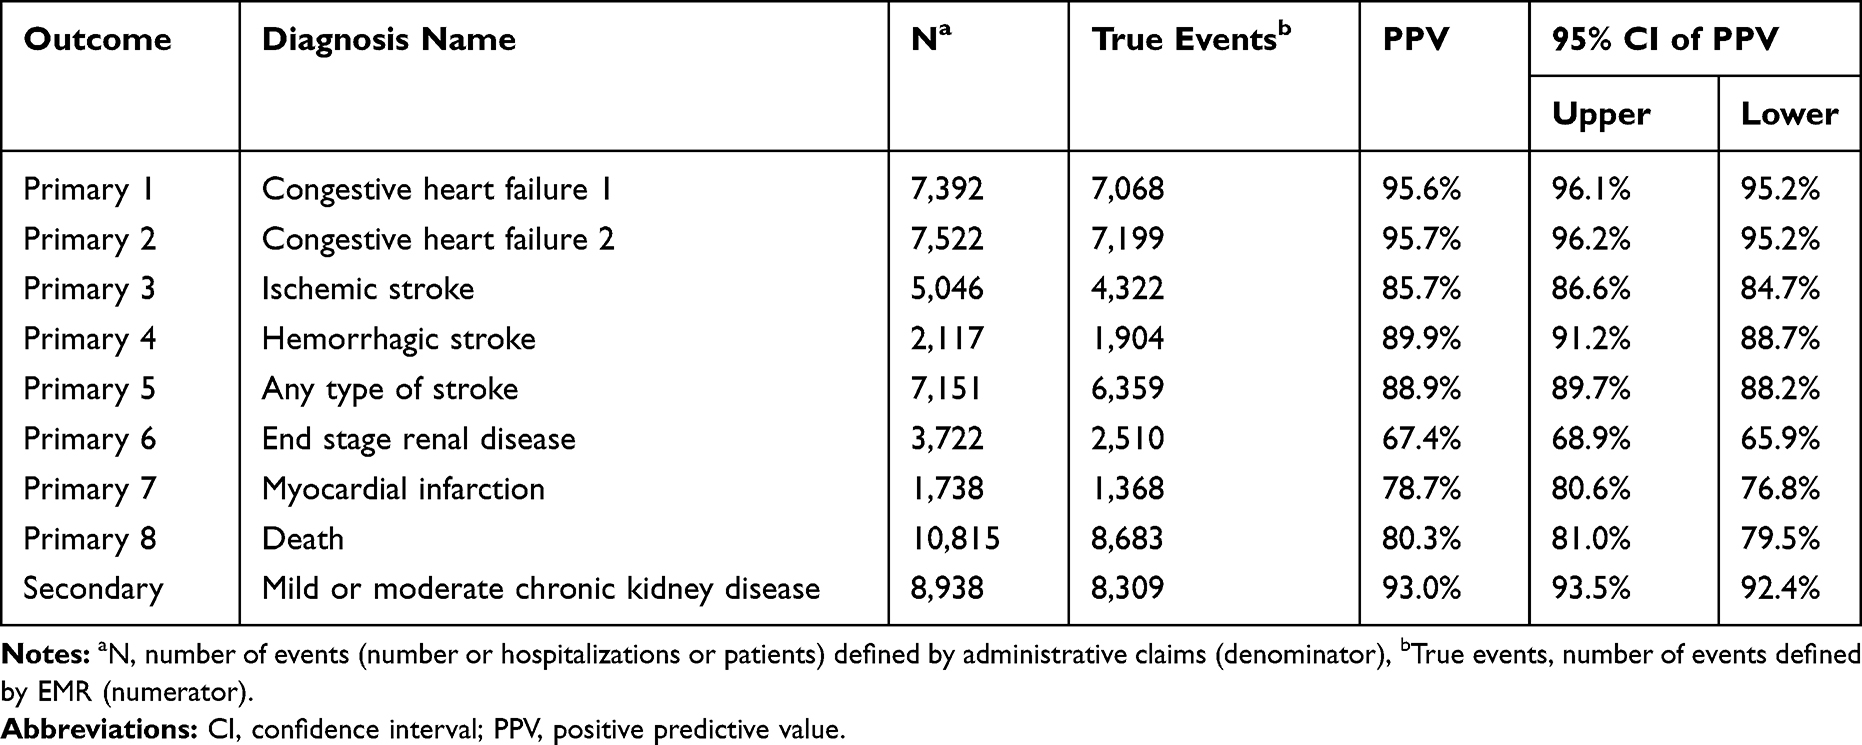 |
Table 3 PPV for Definition of Each Outcome |
The post hoc analysis showed that a number of patients with <15 mL/min/m2 of eGFR were given N18.0 with disease name of “end stage renal failure”, “chronic kidney disease stage G5”, or “chronic kidney disease stage G5D.” PPV was calculated as 83.8% (95%CI: 82.7–85.0%) when N18.0 was included in the definition of ESRD.
Discussion
Our findings show that most of the outcomes in this study had a high PPV including three outcomes with more than 90%. However, MI and ESRD had an average PPV that was less than 80%.
PPVs of two definitions of CHF were above 95%. Similarly, the three types of stroke-related outcomes (ischemic stroke, hemorrhagic stroke, and any type of stroke) scored higher than 85% PPV.
MI, on the other hand, showed a PPV less than 80%. This result contrasts with previously reported studies evaluating PPVs of MI. Yamana et al reported a much higher PPV of 92.3%10 and Ando et al reported 89.3%.11 The definition of claims based MI diagnosis was similar to the present study with Yamana et al using ICD-10 codes I21.x, I22.x, and I25.210 and I21.x by Ando et al.11 It is likely due to the difference between the gold standard in our study datasets and the data used by Yamana et al and Ando et al, not due to the definition of MI. The gold standard in these previous studies was confirmed diagnosis after chart review by cardiologists as opposed to the physician ordering system without chart review or cardiologist confirmation in our study, which is a major limitation. Further additional criteria for procedures specific to MI such as catheterization may improve the PPV.
The PPV of death was around 80%. EMR record of death may have been less accurate since, in the present study, 20% of the patients recorded as “dead” in DPC was not captured in the EMR. This may have been because physicians do not have any incentive to order treatment or lab tests for expired patients. The ideal gold standard for death would have been data from death registry or insurance enrolment data; however, we had access to neither in the present study. Accuracy of the death records in the claims data was supported by Ooba et al’s study that reported a PPV of 95.6% for death in the health insurance claims database including DPC claims when it was defined as “dead” on the claim and used death information from an enrolment file as the gold standard.12 In conclusion, DPC record of death was perhaps a more reliable outcome than the EMR death record.
While mild or moderate CKD had PPV higher than 90%, ESRD showed PPV lower than 70%. In order to explore the reason for the low PPV of ESRD, we conducted a post hoc analysis to evaluate the distribution of ICD-10 diagnosis codes attributed to patients who could be categorized as ESRD based on eGFR. Contrary to our expectation, we found that no cases were mapped to N18.5 which conventionally converts to ESRD in the standard disease mapping system in Japan.13 In the database of the current study, most of these severely reduced eGFR cases were mapped to N18.0, which was not included in our definition of ESRD with the ICD-10 code because the code was not available in the Japanese ICD-10 code. The PPV including N18.0 in the definition was higher than the original one at 83.8%. This mapping method for the ESRD patients is different from other large commercially available Japanese claims databases provided by Medical Data Vision Co, Ltd and JMDC Inc. This result suggests that the definition of outcome should be developed after confirming the mapping method used to convert disease names in claims to ICD-10 codes by each database company to more adequately identify the population under study, and to adjust the algorithm of the definition accordingly.
A comprehensive review previously reported that validation studies of claims were limited in the Asia-pacific region.14 The review indicated that the medical record was most often used as the gold standard in 18 of 43 studies. When we compared our results to similar outcomes found in the review, the accuracy of ischemic stroke diagnosis in the National Health Insurance Research Database in Taiwan, sensitivity: 97.3%, PPV: 88.4%15 was reported to be high. A Korean study indicated PPV for intracranial haemorrhage, ischemic stroke, and subarachnoid haemorrhage ranged 82–95%, 78–92%, and 78–91%, respectively, depending on the algorithm for the diagnosis and data set, and was considered to have roughly consistent findings with the present study.16 PPV for coronary heart disease (ICD-10-AM I20-I25) was high, 96.0% as index admission, and decreased with an increase in the lookback period, contrary to an increase in sensitivity and negative predictive value.17 PPVs for many outcomes in our study are in a similar range as the previous studies.
Strengths and Limitations
The major strength of this study comes from the feature of the large database, including both EMR and administrative claims data. It allowed us to conduct this large-scaled validation study including patients from more than 200 hospitals. Since linkage of multiple databases is not allowed in Japan, the database including EMR and administrative claims data is useful for such large-scaled validation studies.
Several limitations should be noted in this study. First, we only assessed DPC hospitalized claims diagnosis for primary outcomes, and did not evaluate any of the outpatient diagnosis or those associated with fee for service in the database. Although we considered the outcomes to be associated with hospitalization, the frequency of outcomes can be underestimated in studies using the definition of outcome if it is often associated with outpatient alone. Second, since we did not evaluate the data from hospitals and clinics aside from DPC hospitals, the generalizability of our findings to databases including data from other types of settings will be limited. However, our findings can be applicable to other databases which collect data from DPC hospitals. Third, we only calculated the PPV for the diabetic patients, who should have higher prevalence of cardiovascular and renal comorbidities. Therefore, the PPV may be different from the PPV for the overall population in the database. Fourth, we did not calculate the sensitivity, specificity or negative predictive value since we could not find an appropriate population within the database who seem to always have a claim diagnosis for a corresponding EMR diagnosis, as approximately half of the patients were missing claims diagnosis. When a hospitalized patient is missing a claims diagnosis, we could not tell if the claims code is missing due to data coming from non-DPC hospital or the hospital did not provide the data to RWD company, and we did not feel these cases should be categorized as a “false negative” case. Finally, EMR disease data based on the physician ordering database was used as the gold standard diagnosis in this study, which may not always reflect the confirmed final physician diagnosis, and may lead to potential misclassification bias and imprecise estimates. In particular, the death registry data are preferable as the gold standard of death; however, we had no access to them. Despite these limitations, findings from this study may provide some insights into future outcome studies using the claims defined outcomes definition in Japan.
Conclusions
We performed a validation study for administrative claims data using the EMR as the gold standard in patients with type 2 diabetes. We assessed definitions of several cardiovascular and renal outcomes frequently diagnosed for the patients with type 2 diabetes and death based on PPV. Most of the outcomes including several cardiovascular diseases and mild and moderate CKD showed high PPV, more than 80%, while the PPVs of MI and ESRD were lower than 80%. Post-hoc analysis suggesting methods to correctly identify the population using lab values in the database increased the PPV of ESRD to above 80%. Future studies using a large claims database with specialist confirmed chart review diagnosis as the gold standard are awaited in Japan. Even so, our study demonstrates high PPVs for our definition of cardiovascular and renal outcomes in patients with type 2 diabetes. The definitions proposed in this study should be useful for future studies using the DPC database.
Abbreviations
CHF, congestive heart failure; CI, confidence interval; CKD, chronic kidney disease; DPC, diagnostic procedure combination; eGFR, estimated glomerular filtration rate; EMPRISE, EMPagliflozin compaRative effectIveness and SafEty; EMR, electronic medical record; ESRD, end stage renal disease; ESRD, end stage renal disease; HCEI, Health, Clinic, and Education Information Evaluation Institute; ICD-10, International Classification of Diseases, 10th Revision; MI, myocardial infarction; PDPS, per-diem payment system; PPV, positive predictive value; SD, standard deviation; T2D, type 2 diabetes.
Ethics and Consent Statement
This study is approved by the ethic committee at the Research Institute of Healthcare Data Science (Tokyo, Japan) (RI2019003).
Data Sharing Statement
The individual de-identified participant data (including data dictionaries) will not be shared.
Acknowledgments
We thank Health, Clinic, and Education Information Evaluation Institute (HCEI: Kyoto, Japan) and Real World Data Co, Ltd (Kyoto, Japan) for providing the dataset and critical scientific review comments on the manuscript. We also thank Kimiko Mitani for providing support on publication management.
Author Contributions
All authors contributed to data analysis, drafting or revising the article, gave final approval of the version to be published, and agree to be accountable for all aspects of the work.
Funding
Funding for this study was provided by Nippon Boehringer Ingelheim. The sponsor was involved in study design, analysis and interpretation of the data, and the writing and submission of this report. Nippon Boehringer Ingelheim paid for professional medical writing and editing assistance, which was provided by Milliman.
Disclosure
YO, YT and AY are employees of Nippon Boehringer Ingelheim. KI and TT are employees of MIlliman, Inc., which has received consultancy fees from Nippon Boehringer Ingelheim. The authors report no other conflicts of interest in this work.
References
1. Kohsaka S, Katada J, Saito K, Terayama Y. Safety and effectiveness of apixaban in comparison to warfarin in patients with nonvalvular atrial fibrillation: a propensity-matched analysis from Japanese administrative claims data. Curr Med Res Opin. 2018;34(9):1627–1634. doi:10.1080/03007995.2018.1478282
2. Koretsune Y, Yamashita T, Yasaka M, et al. Comparative effectiveness and safety of warfarin and dabigatran in patients with non-valvular atrial fibrillation in Japan: a claims database analysis. J Cardiol. 2019;73(3):204–209. doi:10.1016/j.jjcc.2018.09.004
3. Urushihara H, Taketsuna M, Liu Y, et al. Increased risk of acute pancreatitis in patients with type 2 diabetes: an observational study using a Japanese hospital database. PLoS One. 2012;7(12):e53224. doi:10.1371/journal.pone.0053224
4. Kitazawa T, Matsumoto K, Fujita S, Seto K, Hasegawa T. Cost analysis of transplantation in Japan, performed with the use of the national database. Transplant Proc. 2017;49(1):4–9. doi:10.1016/j.transproceed.2016.10.007
5. Hayashi S, Noda T, Kubo S, et al. Variation in fracture risk by season and weather: a comprehensive analysis across age and fracture site using a National Database of Health Insurance claims in Japan. Bone. 2019;120:512–518. doi:10.1016/j.bone.2018.12.014
6. Kosiborod M, Lam CSP, Kohsaka S, et al. Cardiovascular events associated with SGLT-2 inhibitors versus other glucose-lowering drugs: the CVD-REAL 2 study. J Am Coll Cardiol. 2018;71(23):2628–2639. doi:10.1016/j.jacc.2018.03.009
7. Kimura S, Sato T, Ikeda S, Noda M, Nakayama T. Development of a database of health insurance claims: standardization of disease classifications and anonymous record linkage. J Epidemiol. 2010;20(5):413–419. doi:10.2188/jea.JE20090066
8. Ishii M. DRG/PPS and DPC/PDPS as prospective payment systems. Japan Med Assoc J. 2012;55(4):279–291.
9. Seino Y, Yabe D, Yasui A et al. EMPagliflozin compaRative effectIveness and safety (emprise) program; study design in Japan. paper presented at: the Japan Society of Diabetic Complications.
10. Yamana H, Moriwaki M, Horiguchi H, Kodan M, Fushimi K, Yasunaga H. Validity of diagnoses, procedures, and laboratory data in Japanese administrative data. J Epidemiol. 2017;27(10):476–482. doi:10.1016/j.je.2016.09.009
11. Ando T, Ooba N, Mochizuki M, et al. Positive predictive value of ICD-10 codes for acute myocardial infarction in Japan: a validation study at a single center. BMC Health Serv Res. 2018;18(1):895. doi:10.1186/s12913-018-3727-0
12. Ooba N, Setoguchi S, Ando T, et al. Claims-based definition of death in Japanese claims database: validity and implications. PLoS One. 2013;8(5):e66116. doi:10.1371/journal.pone.0066116
13. Medical Information System Development Center [homepage on the Internet]. [Standard disease name master for ICD-10]. Available from: http://www2.medis.or.jp/stdcd/byomei/index.html.
14. Koram N, Delgado M, Stark JH, Setoguchi S, de Luise C. Validation studies of claims data in the Asia-Pacific region: a comprehensive review. Pharmacoepidemiol Drug Saf. 2019;28(2):156–170. doi:10.1002/pds.v28.2
15. Cheng CL, Kao YH, Lin SJ, Lee CH, Lai ML. Validation of the National Health Insurance Research Database with ischemic stroke cases in Taiwan. Pharmacoepidemiol Drug Saf. 2011;20(3):236–242. doi:10.1002/pds.2087
16. Park TH, Choi JC. Validation of stroke and thrombolytic therapy in Korean National Health Insurance claim data. J Clin Neurol. 2016;12(1):42–48. doi:10.3988/jcn.2016.12.1.42
17. Nedkoff L, Knuiman M, Hung J, Sanfilippo FM, Katzenellenbogen JM, Briffa TG. Concordance between administrative health data and medical records for diabetes status in coronary heart disease patients: a retrospective linked data study. BMC Med Res Methodol. 2013;13(1):121. doi:10.1186/1471-2288-13-121
 © 2020 The Author(s). This work is published and licensed by Dove Medical Press Limited. The
full terms of this license are available at https://www.dovepress.com/terms
and incorporate the Creative Commons Attribution
- Non Commercial (unported, 3.0) License.
By accessing the work you hereby accept the Terms. Non-commercial uses of the work are permitted
without any further permission from Dove Medical Press Limited, provided the work is properly
attributed. For permission for commercial use of this work, please see paragraphs 4.2 and 5 of our Terms.
© 2020 The Author(s). This work is published and licensed by Dove Medical Press Limited. The
full terms of this license are available at https://www.dovepress.com/terms
and incorporate the Creative Commons Attribution
- Non Commercial (unported, 3.0) License.
By accessing the work you hereby accept the Terms. Non-commercial uses of the work are permitted
without any further permission from Dove Medical Press Limited, provided the work is properly
attributed. For permission for commercial use of this work, please see paragraphs 4.2 and 5 of our Terms.