Back to Journals » Drug, Healthcare and Patient Safety » Volume 15
Validation of the Safety Attitudes Questionnaire for Assessing Patient Safety Culture in Critical Care Settings of Three Selected Ugandan Hospitals
Authors Atukwatse J, Niyonzima V ![]() , Asher Aliga C
, Asher Aliga C ![]() , Nakandi Serwadda J, Nankunda R, Nakiganda C, Komugabe P, Nantongo H
, Nakandi Serwadda J, Nankunda R, Nakiganda C, Komugabe P, Nantongo H ![]()
Received 23 September 2022
Accepted for publication 18 January 2023
Published 26 January 2023 Volume 2023:15 Pages 13—23
DOI https://doi.org/10.2147/DHPS.S389978
Checked for plagiarism Yes
Review by Single anonymous peer review
Peer reviewer comments 3
Editor who approved publication: Dr Rajender Aparasu
Joseph Atukwatse,1 Vallence Niyonzima,2 Cliff Asher Aliga,1 Jalia Nakandi Serwadda,3 Rosemary Nankunda,1 Catherine Nakiganda,3 Peninah Komugabe,4 Hanifah Nantongo2
1School of Nursing and Midwifery, Aga Khan University Uganda, Kampala, Uganda; 2Department of Nursing, Mbarara University of Science and Technology, Mbarara, Uganda; 3Department of Surgery and Specialized Areas, Mulago National Referral Hospital, Kampala, Uganda; 4Department of Nursing, Uganda Heart Institute, Kampala, Uganda
Correspondence: Vallence Niyonzima, Tel +256777842830, Email [email protected]
Background: The safety attitudes questionnaire (SAQ) short form (2006) is important for assessing patient safety culture in clinical environments. However, little is known about its validity and applicability in Uganda. This study validated the SAQ short form (2006) for use in assessing patient safety culture in critical care settings of hospitals in the Ugandan context.
Methods: Using a sequential exploratory mixed-methods research design, the face, content and construct validity for the SAQ short form (2006) was assessed in a multi-phased approach. A panel of eight (8) purposively selected experts assessed the face and content validity in rounds 1 and 2, respectively, while construct validity was assessed in round 3 using data from a cross-sectional survey of 256 frontline health workers in critical care settings of the selected hospitals. Analysis of survey data followed confirmatory factor analysis. Cronbach’s alpha examined internal reliability.
Results: Of the 36 items in the tool’s original version, 33 were rated clear, with a score of 100% on face validity. The use of contextual vocabulary and formatting issues arose as concerns. The S-CVI/Ave was 100%, and S-CVI/UA was 86.1%. Four new items added on effective communication as another dimension of patient safety culture. The survey had KMO=0.8605, the a priori-based model had a scale Cronbach’s alpha=0.8881, with unsatisfactory goodness of fit (RMSEA=0.051, 90% CI: 0.044– 0.057, pclose=0.427; chi-square=694.28, p < 0.001; CFI=0.884, TLI=0.871). The modified final model had a scale Cronbach’s alpha =0.8967 and satisfactory goodness of fit (RMSEA=0.030, 90% CI: 0.019– 0.039, pclose=1.000; chi-square=424.98, p=0.002; CFI=0.966, TLI=0.960).
Conclusion: In the tool’s original form, the face validity was lacking despite satisfactory scores on item clarity. Content validity was adequate, while construct validity required modifications in construct specifications. Reliability was adequate before and after specification modifications. The modified version has adequate psychometric properties for Uganda.
Keywords: patient safety culture, SAQ, tool validation, validity, Ugandan context
Introduction
The World Health Organization estimates that patient safety-related harm ranks 14th among the leading causes of the global disease burden, causing morbidity and mortality, comparable to tuberculosis and malaria.1 It is further argued that industries with a perceived higher risk such as the aviation and nuclear industries have a much better safety record than healthcare. Evidence shows that there is a 1-in-300 chance of a patient being harmed during healthcare compared to a 1-in-a-million chance of a traveller being harmed by a plane worldwide.1 Patient safety issues only get worse when it comes to resource-limited settings. A patient safety-related study done in Nigeria revealed that nurses who cared for more than 20 patients had higher percentages of poor or fair patient safety.2 This implies a high risk of patient harm due to the common challenge of shortage of human resource for health in resource-limited settings. Whereas there is paucity of published data on patient safety-related incidents in Uganda, the fact that the country counts among resource-limited settings makes the patients vulnerable to the burden. Patients in critical care settings are even more vulnerable owing to the nature of the demanding clinical environment itself.
In an effort to understand patient safety culture scores and guide improvement strategies in intensive care units, researchers around the globe have validated and adapted the HSOPS and SAQ tools to fit their cultural settings. In Uganda, however, there is a paucity of published evidence that such tools have ever been contextualized for utilization in critical care settings. In addition, Uganda, like other developing countries, is struggling with poor patient outcomes partly because of the low critical care access indicators;3 however, it could possibly also be because the patient safety culture in the critical care settings could be wanting and we do not know. The safety attitudes questionnaire is a widely used tool in assessing patient safety culture in clinical settings, including critical care settings, to guide necessary improvements.4–8 As such, this study aimed at validating the short form of the safety attitudes questionnaire for the Ugandan critical care settings. The validated tool is to help in evaluating patient safety culture in the local critical care settings for quality improvement strategies.
Whereas the SAQ has got both the full form and short form (2006), the short form is the most utilized and is preferred to the full form because of its user friendliness. The tool authors came up with a short form because many items in the full form are closely related to each other, under each given construct for which the short form items are sufficient to represent in a survey.9 Particularly, the short form takes a much shorter time for the respondent to complete than does the full form, yet the results remain informative enough to guide appropriate interventions for improvement. In this study, therefore, we chose to validate the short form (2006) of the SAQ for the Ugandan context.
Methodology
Study Design
This was a sequential exploratory mixed-methods research design to achieve the different study objectives in three3 successive phases. While the 1st and 2nd phases (or rounds) were dedicated to assessing the face and content validity of the tool, respectively, round 3 was to establish the tool’s construct validity. In assessing both face and content validity, the item-level and tool-level face and content validity data were quantified using established methods during data analysis.10,11 Additionally, the tool reviewers had no limit on input in terms of comments and suggestions so as to make the tool more suitable for the Ugandan context. These comments and suggestions were treated verbatim and guided changes made in the tool. Thereafter, a cross-sectional study design was utilized for construct validation in the form of a survey, using the modified questionnaire as a self-administered tool for data collection.
Study Site
The study was carried out in critical care settings of three selected hospitals which were purposively selected to represent the few hospitals in Uganda, both public and private, that have well-established ICUs – one of the key categories of critical care units targeted for this study. Thus, they include a public hospital, a private-not-for-profit hospital, and a private-for-profit hospital. For this study, a critical care setting was operationally defined as a clinical area or unit of a given hospital that is dedicated to providing care to critically ill patients. Specifically, therefore, round 3 of this study (for construct validity) was conduct with frontline healthcare personnel working in intensive care units (ICUs), high dependency units (HDUs) including special care units for new-borns and premature babies, operating theatres, and medical/surgical emergency units or departments for each of the three3 hospitals.
Study Population
The experts panel comprised of critical care specialists, research experts and critical care practice experts, as well as the frontline critical care personnel in the survey. The target population for the survey were staff nurses, medical doctors, and other health professionals who provide direct patient care regularly in the critical care units following at least one month’s duration in their respective units of deployment.
Exclusion Criteria
Frontline healthcare providers who were newly deployed to work in a given critical care unit, particularly those who had worked in the critical care unit for less than one month, were excluded. This is because such individuals may still be lacking reasonable understanding of some of the questionnaire items in relation to behaviours and practices in their respective units of deployment. Also, this study excluded the personnel who had been away on leave for periods lasting longer than one month because there could be new changes (improvements or declines) regarding patient safety in their respective units that the person may not be aware of. Nursing, medical and other health science students were considered as health workers to be part of the survey during data collection for construct validity.
Sample Size and Sampling Methods
Eight8 participants were enrolled as a panel of experts in rounds 1 and 2. These were purposively selected based on one’s professional training background and experience in critical care delivery and conducting health research. In the survey, a total of 256 frontline health workers participated. Participant selection for the survey was by population sampling method whereby everyone who met the inclusion criteria was considered a potential participant in the study, as borrowed from previous similar studies.12,13
Data Collection Process
For the face and content validation, the experts were provided with adequate information regarding the study and its purpose, as well as instructions to guide them in rating the tool items. For construct validity, the appropriately modified tool following the first two rounds of the study was administered to the targeted respondents in a survey. Given that the study was conducted among health workers and that English is the official language for Uganda,14,15 all data collection instruments were administered in the English language only.
Statistical Analysis
Face Validity
A complete decision rule was used. In a procedure similar to that of Zaichkowsky16 and Zamanzadeh et al,11 only items that were rated as completely or somewhat clear by at least 80% of the experts were retained. Two items fell below this cut-off mark in this study but were retained following rephrasing as suggested by the experts.
Content Validity
Content Validity Index (CVI) was assigned to the cumulative average of the level of agreement among the participants.11 The CVI refers to the proportion of items of an instrument that achieves a relevant rating by the panel expert participants.17,18 The rating scale was dichotomized as “relevant” (score of 2 or 3) and “not relevant” (score of 1). The CVI for both item level (I-CVI) and scale level (S-CVI) was calculated. I-CVI was computed as the number of experts giving a score of 2 or 3 for relevance of each item, divided by the total number of experts for that item. The I-CVI gives the proportion of agreement on relevance of each item, while the S-CVI is the proportion of items on an instrument whose content achieved a score of 2 or 3 by experts.11 Each item would be judged as follows: appropriate if its I-CVI is >79%, needs revision if the I-CVI is 70–79%, and to be eliminated if <70%.
S-CVI was calculated using both the universal agreement among expert participants (S-CVI/UA) approach and the averages of item-level CVIs (S-CVI/Ave) approach. In the S-CVI/UA approach, the number of items considered relevant by all the judges (or number of items with CVI equal to 1 [100%]) was divided by the total number of items; while the S-CVI/Ave approach utilized the average scores of item-level CVIs after dichotomizing the responses.11
A CVI of greater than 80% was considered high enough to confer a high level of agreement (majority of the panel members agreeing that items are relevant to concepts being investigated).17,19 The same authors contend that 80% of the participants must agree in order to retain an item in the tool.
Construct Validity
For the tool items rated on a Likert scale, ie items 1–40, each response was assigned a score as follows: strongly disagree=0, disagree=25, neutral=50, agree=75, strongly agree=100. The negatively worded items (ie items 2, 11, and 36) were reverse coded for meaningful scoring as guided by the tool’s authors.9,20 Mean scores for each item were then computed. Construct validity of the tool was analysed using structural equation modelling in confirmatory factor analysis (CFA), based on the previously identified constructs by the authors and other users of the tool in their population settings.20 Accordingly, principal component analysis (PCA) and/or exploratory factor analysis (EFA) were bypassed. All the CFA work was done using Stata/MP version 14.0. The first model was fitted with specifications based on the previously known construct compositions. Model fitting estimations were executed using the maximum likelihood with missing values (MLV) method to cater for a few items that had missing data. The model’s overall goodness of fit parameters, the corresponding modification indices (chi-square >3.84), factor loadings and corresponding error terms, as well as practical plausibility were put into consideration in order to identify which modifications to make in the model. Desirable parameters included an RMSEA <0.05, pclose >0.05, CFI and TLI values >0.95, a small chi-square value with a corresponding p >0.05, as well as factor loadings above 40%, particularly for the items loading on single constructs in the model. All these evaluations and modifications were done in a series of back-and-forth steps until a model with satisfactory goodness of fit indicators was attained as final. The final model was then tested for internal reliability by calculating the Cronbach’s alpha coefficient both at the overall scale level and individual construct scale level.
Ethical Considerations
We obtained IRB approval from Mbarara University of Science and Technology Research Ethics Committee (MUST-REC) under registration number 04/07-20, and subsequently secured administrative clearance from each of the study sites ahead of commencing the data collection field exercise. Further, written informed consent was individually obtained from every participant before completing the questionnaire. All participants were compensated for their time taken to participate in the study.
Results
Face Validation
All the core items of the toll were rated by the experts as at least somewhat clear, except items 27 and 29. Based on these ratings alone, therefore, items 27 and 29 were to be modified and the rest to be retained as they were. However, the experts pointed out quite a number of areas to address in order to improve the tool’s face validity for the Ugandan context, as detailed in Table 1 and addressed accordingly.
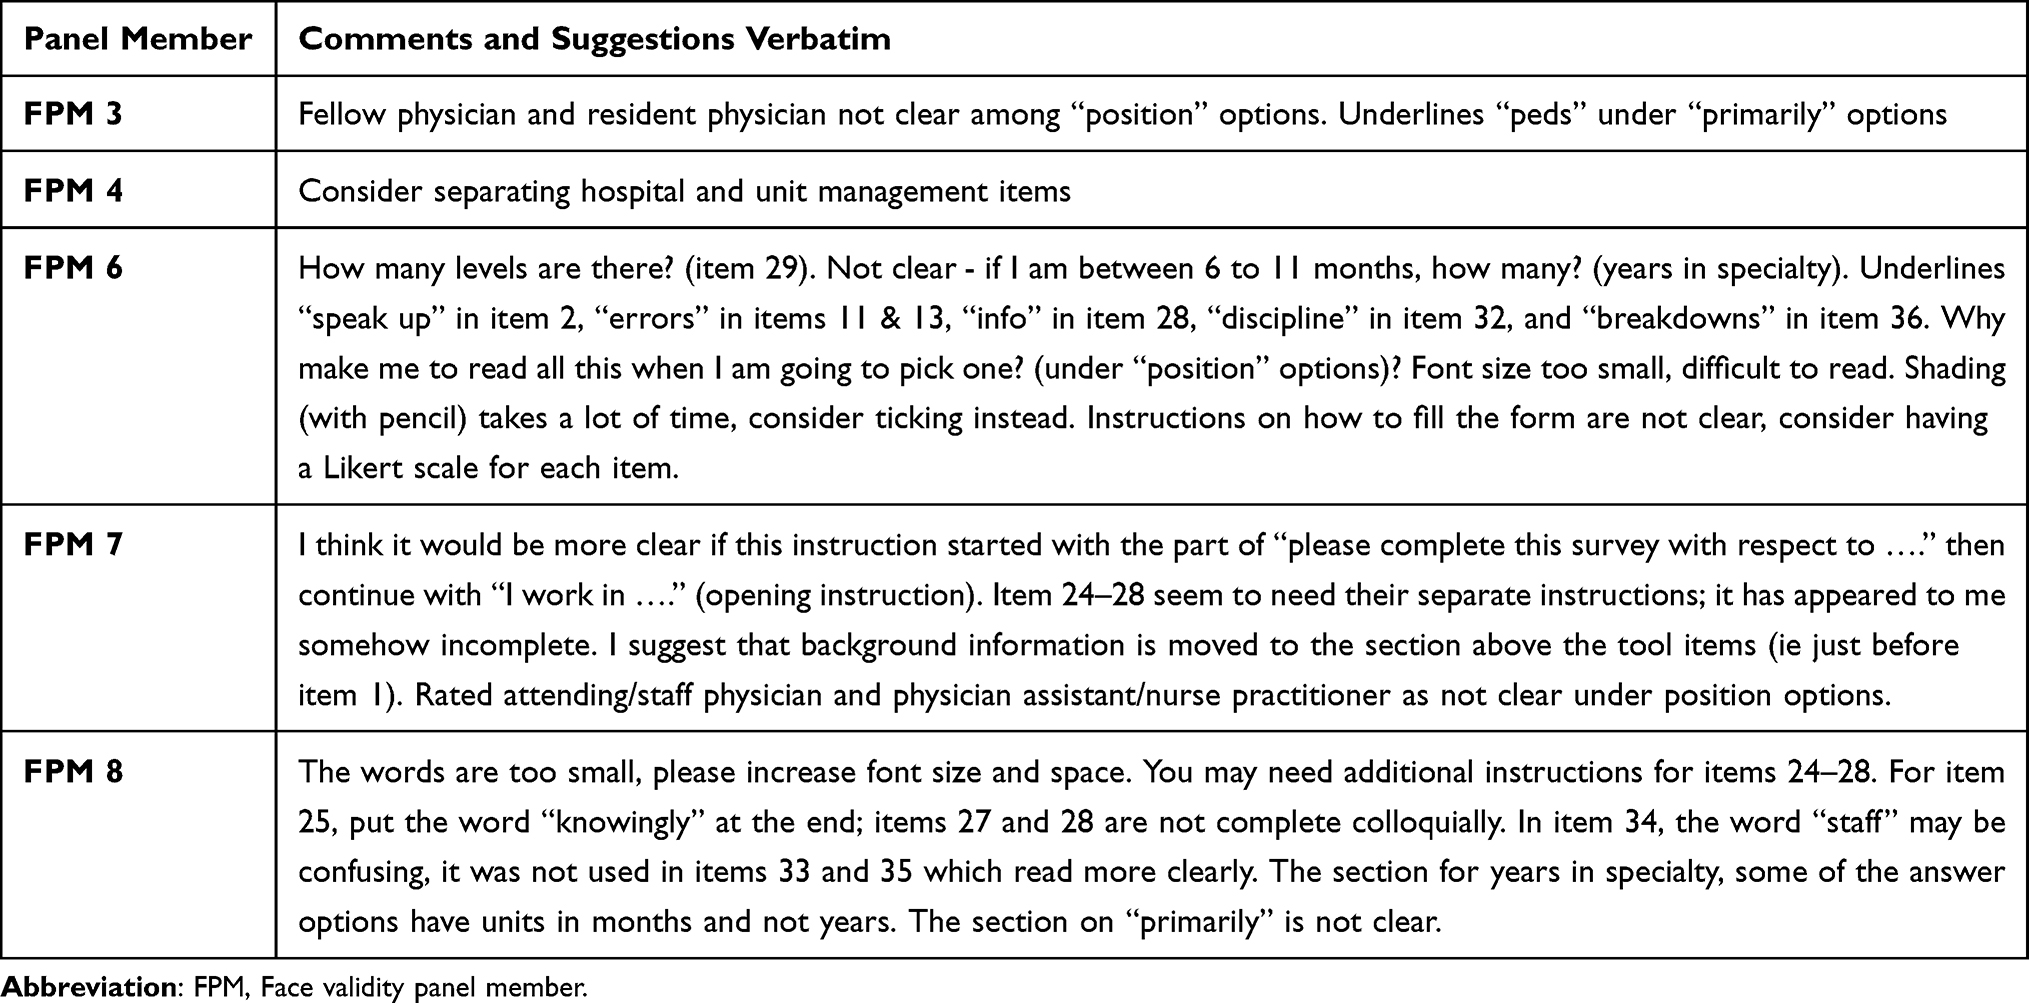 |
Table 1 Verbatim Comments and Suggestions by the Experts in Face Validation of the Tool and Actions Taken to Address the Comments |
Content Validation
All items attained satisfactory item-level content validity (I-CVI) of at least 89% after dichotomizing the ratings, giving an overall S-CVI/Ave of 100%. Notably, 31 out of the 36 items were rated as relevant by all the experts (I-CVI = 100%), giving a S-CVI/UA of 86.1%. Since all 36 items acquired an I-CVI above the threshold (>79%) for retention,11 they were all retained in the tool. However, some changes were still made in the tool at this stage upon comments and recommendations but which also related to clarity issues. Four new items were suggested for addition to the 36-item tool regarding effective communication as another dimension of patient safety culture, as follows: item (37) Documentation of all aspects of patient care is a priority in this unit; (38) Patients are encouraged to communicate their feelings about the care provided in this unit; (39) Clear guidelines exist to notify patients when some resources and drugs are required for the patients; and (40) Clear guidelines exist for patients to express their views about the care provided here (eg customer care personnel, social worker and public health personnel communicate to patients).
Construct Validation
The respondents mostly agreed with item 15, which states “I like my job”, giving it a mean score of 91.2(±16.3) out of 100. This was followed by item 6, which relates to teamwork climate between nurses and medical doctors in the clinical units, with a mean score of 85.0(±21.1). Conversely, items 29 and 36, which respectively relate to staff–patient ratio and episodes of communication breakdown in the clinical unit, scored the least. They received mean scores of 52.5(±33.9) and 52.6(±28.1), respectively (Figure 1).
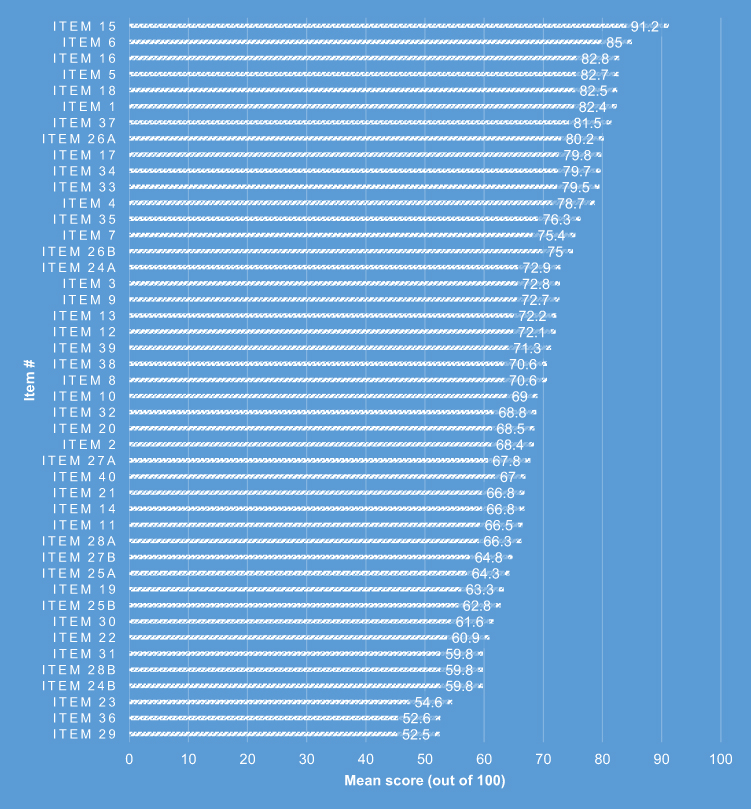 |
Figure 1 Graphic display of the mean scores by tool item. |
Part (b) of items 24–28, which relate to perceptions of hospital-level management, registered the highest frequency of missing data across all items ranging from 15(5.9%) for item 28b to 18(7.0%) for item 24b. Figure 2 graphically depicts this contrast. Owing to this high frequency of missing data distinctly observed to affect only hospital-level management, the subsequent structural model building utilized only unit management-related items for analysis under the dimension of “perceptions of management” in the model.
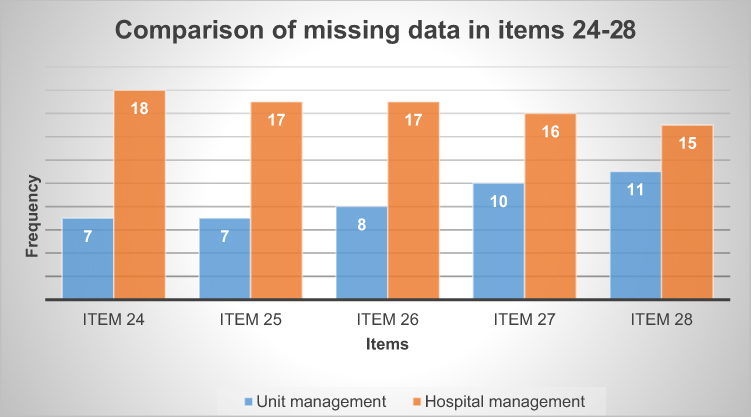 |
Figure 2 Comparison of frequency of missing data between unit-level and hospital-level management-related items. |
Construct Validity Model
The structural equation model (SEM) as first fitted based on the original construct compositions yielded acceptable parameters on the root mean squared error of approximation (RMSEA), with a value of 0.051 (90% CI: 0.044–0.057, pclose=0.427). But the other parameters for the model’s overall goodness of fit were indicative of a poorly fitting model. These included a low CFI of 0.884 and a low TLI of 0.871. The corresponding internal reliability indicators were also satisfactory, with an overall scale Cronbach’s alpha of 0.8881 and the dimension level Cronbach’s alpha values ranging from 0.6187 for the teamwork climate to 0.8106 for stress recognition. In the final model, the parameters were indicative of a perfectly fitting model with an RMSEA value of 0.030 (90% CI: 0.019–0.039; pclose=1.000), CFI=0.966, and TLI=0960. Similarly, the internal reliability indicators were even better, at Cronbach’s alpha 0.8967 for the overall scale, and the construct level Cronbach’s alpha values ranged from 0.6397 to 0.8151.
Discussion
Face Validity
A number of issues were raised about the face validity of the SAQ short form (2006) in its original version for the Ugandan context. The small font size and single line spacing through all items in the original tool version would be one of its face validity strengths since everything fits on one page thereby motivating the potential respondent to seemingly undertake a short questionnaire.21,22 However, some of the experts found the tool difficult to read because the words seemed too small and compacted thereby suggesting change. Even though Uganda’s official language is English,14,15 some of the experts anticipated that certain short forms and vocabulary used in the original tool version would not be familiar to the intended participants in a self-administered questionnaire. This is in line with the established knowledge that even when people use the same language as a medium of communication, there may be differences in familiarity, use and choice of certain vocabulary and phrases across different communities.23,24 Consequently, changes made in the affected items included writing the short forms in full as well as paraphrasing while keeping the original meaning intact. This finding of issues with vocabulary or terminology necessitating changes in the SAQ is similar to what was done during validation of the Portuguese version,25 among other studies with similar findings and actions on face validity.
The feasibility, logic and clarity of some of the instructions to the respondents also became an area of concern to some of the reviewing experts. For instance, shading with use of pencil to select an appropriate response was foreseen to be cumbersome to the respondents owning to the fact that most people use pens instead of pencils while at work. Intuitively, questionnaire instructions that are interpreted by potential respondents as too demanding discourage participation. This instruction was thus changed to circling the chosen response option in order to minimize non-responses. Shading the response option to reduce ambiguity in the instructions was another change made in response to the panel experts’ comments and recommendations, as shown in Table 1.11,16
Content Validity
The tool attained very good content validity, with an S-CVI of 100% on average agreement and 86.1% on universal agreement by the expert panel members. With 31 of the 36 items in original tool version receiving a CVI of 100% and the least receiving a CVI of 86%, it is clear that the tool reviewing experts perceived all items in the tool as being at least moderately relevant regarding assessment of patient safety culture in critical care settings in Ugandan hospitals. High content validity of the SAQ short form (2006) is a similar finding in a variety of other studies that have validated the tool.8,26 Partly because of this observation, the option “not applicable” was struck off among the expected responses from the targeted respondents. This is somewhat contrary to the recommendations from a similar study in Norway.26 This decision was also supported by the anticipation that some respondents in a self-administered questionnaire tend to think that an item does not apply to them whenever they do not seem to understand its content and thereby inappropriately select the option “not applicable”. Even though each of the newly added items would demonstrate optimal factor loadings above 0.4, the whole set was left out in construct validation of the tool in this study since it could not fit the assumption of a priori existence as required for the type of structural equation modelling used for data analysis.
Construct Validity
The data fulfilled the requirements for factor analysis. The Kaiser–Meyer–Olkin (KMO) value was 0.8605, which is way above the minimum value recommended for sampling adequacy in factor analysis, ie 0.5027 or 0.60 as reported in some studies.28 Inter-item correlations also existed and were substantially stronger among items assumed to be compositions of the same constructs based on the a priori model by the tool’s authors.9,20 The assumption of multivariate normal distribution too was fulfilled in this survey’s data ahead of factor analysis (Figure 1). The assumption of a priori existence as required specifically for the confirmatory factor analysis (CFA) applied in the study was based on the scale for calculating the dimension-level mean scores as provided by the University of Texas Health Science Center at Houston (UTHealth).20
Despite the modifications made to the tool’s instructions following face validity in an effort to improve clarity of the instructions on how to complete items 24–28 (items related to perceptions of management), a reasonable number of the respondents still probably experienced confusion on this part and consequently left the items blank. Since part (a) of these items appeared first in the tool sequence, it is possible that it was the most noted part for the respondents. On the other hand, it is also possible that respondents were only concerned with management of their respective units and probably thought that hospital-level management was not applicable to them. But in comparison with a similar previous study in Denmark, even when the items on perceptions of management were not split, and were left as simply “perceptions of unit management”, items of this construct still received the highest rate of missing data.29 As a result, and to minimize influence of missing data, only the unit-level management parts of items 24–28 were considered for data analysis in construct composition of the construct “perceptions of management” in this study.
Similarly, item 15, which states that “I like my job”, did exhibit weak factor loading with a high error term whose removal from the construct “job satisfaction” improved the goodness of fit indicators. Whereas this item attained the highest overall mean score at item level, it appears to seek an individual’s inner feelings about their work independent of where they work. For example, an individual could be proud of their job as a healthcare provider in their respective profession but when they are dissatisfied with the unit where they work and other aspects of the job as measured by the other items16–19 that constitutes the construct “job satisfaction”. This is in line with the knowledge that self-efficacy alone does not determine job satisfaction as there are several other factors that influence an individual’s job satisfaction, such as clarity of role, working conditions, and interpersonal relationships in the work place, among others.30
The final model exhibited generally good indicators for internal reliability. The overall Cronbach’s alpha was 0.8967 and, apart from the construct “teamwork climate” which had a Cronbach’s alpha of 0.6397, the rest of the constructs had Cronbach’s alphas above 0.75 (Table 2). These statistics do not distinctly differ from those exhibited by the original version of the SAQ short form (2006).9,31 Additionally, although Cronbach’s alphas that are at least 0.75 are desirable for reliability of a tool, values above 0.6 are acceptable.31 Overall, these psychometric properties are satisfactory and comparable to those registered from other validation studies on the same tool in other parts of the world.26,29,32–36
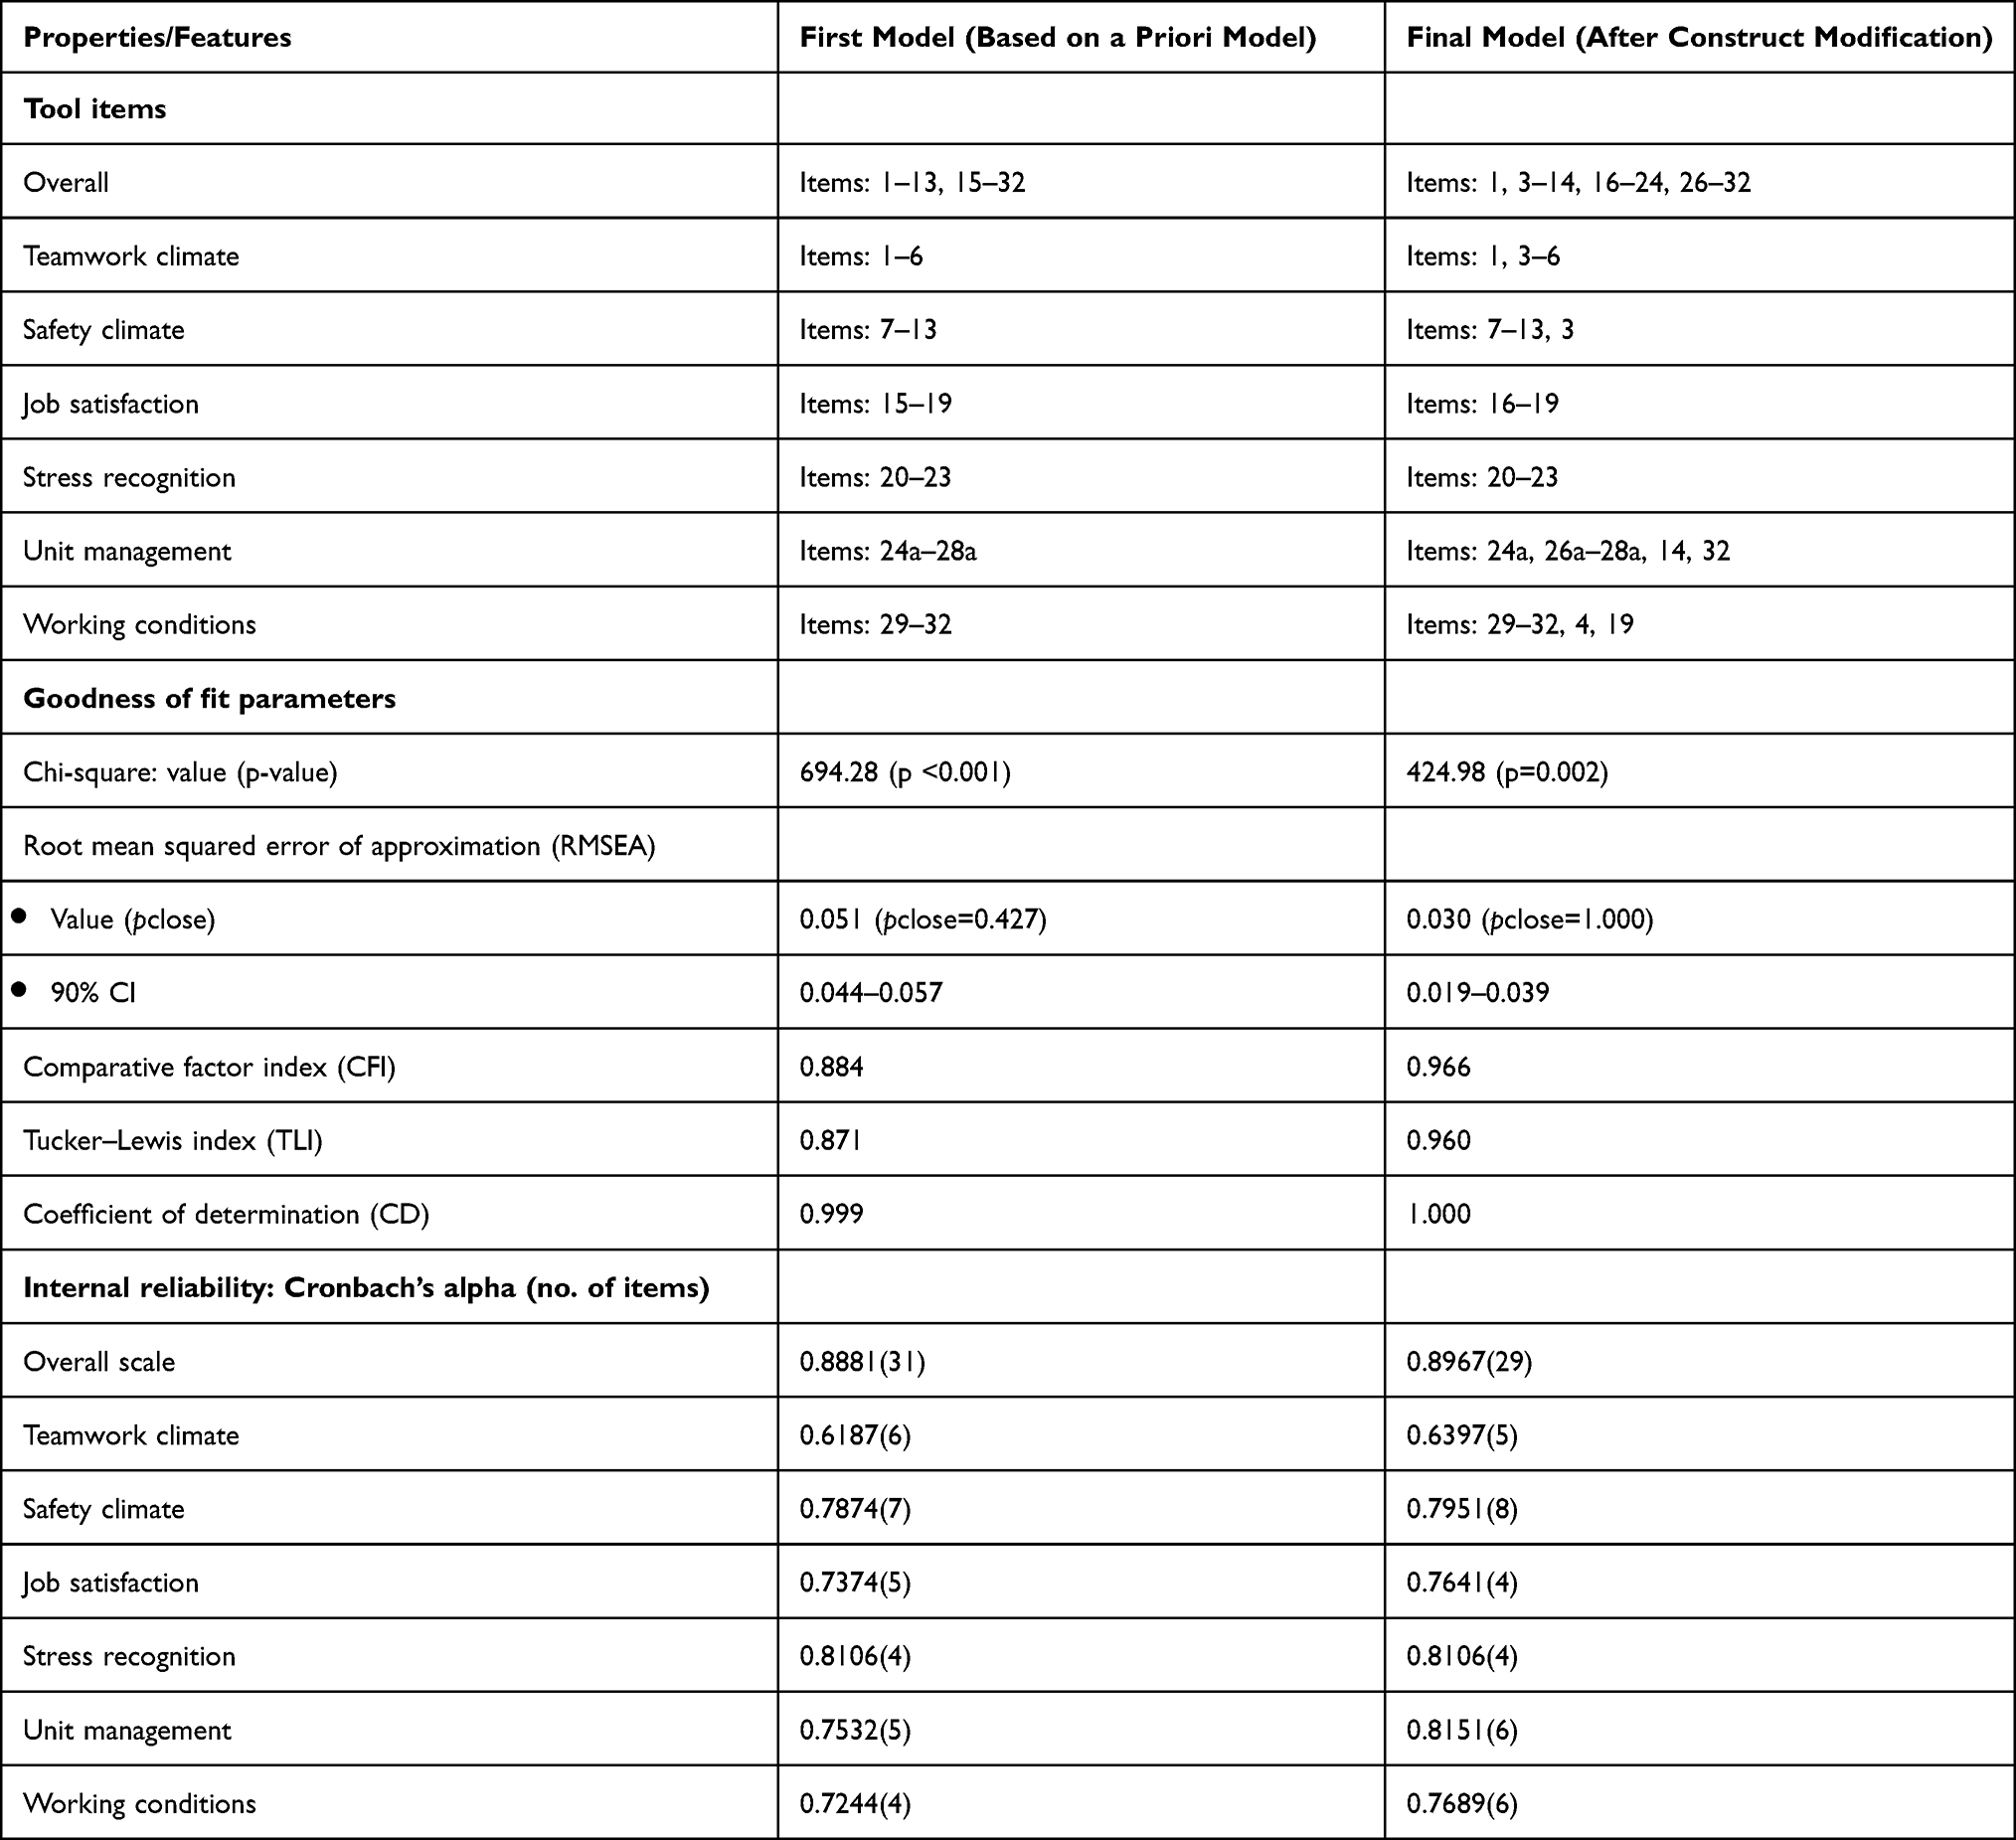 |
Table 2 The Construct Validity Model from Confirmatory Factor Analysis: Specifications, Goodness of Fit Indicators, and Internal Reliability Coefficients |
Limitations
This representation may not be sufficient to generalize the findings to the entire country since all the survey respondents were drawn from only three hospitals. Utilising only unit-level management-related items under the “perceptions of management” construct in the model could have influenced the model estimate outputs.
Conclusion
These findings show that the safety attitudes questionnaire short form (2006) in its original version had less than satisfactory face validity in the context of Uganda. Although 33 of the 36 items were rated by the experts as being at least somewhat clear, the comments and suggestions necessitated a number of changes. The content validity was quite adequate in the tool’s original form. On construct validity, the tool maintained the same constructs but with necessary changes in the constituent item sets from the original. The overall scale reliability and construct-level reliability were adequate both before and after construct specification modifications. The final model has not only good reliability of the overall scale and constructs, but also satisfactory goodness of fit indicators. This followed satisfactory sampling adequacy in the survey, with a KMO value of 0.8605.
Abbreviations
CFA, Confirmatory factor analysis; CFI, Comparative factor index; CI, Confidence interval; CVI, Content Validity index; EFA, Exploratory factor analysis; ICU, Intensive care Unit; I-CVI, Item Validity content index; IRB, Institutional review board; MLV, Maximum likelihood with missing values; MUST, Mbarara University of Science and Technology; PCA, Principal component analysis; REC, Research ethics committee; RMSEA, Root mean squared error of approximation; SAQ, Safety Attitude Questionnaire; S-CVI, Scale level content validity index; SEM, Structural equation model; TLI, Tucker–Lewis Index.
Data Sharing Statement
The datasets generated and analyzed during the study are available from the corresponding author on request.
Acknowledgments
We acknowledge first mile program for the financial support in this study. To the hospital managers, hospital RECs and unit in-charges in the three participating hospitals, we are very grateful for administrative clearance and support. To all the noble men and women who voluntarily participated in each of the three rounds of this study, all efforts would have been futile without you.
Funding
Research reported in this publication was supported by the first Mile project. The content is solely the responsibility of the authors and does not necessarily represent the official views of the first mile project.
Disclosure
The authors report no potential conflicts of interest in this work.
References
1. World Health Organization. Patient safety. World Health Organization; 2019. Available from: https://www.who.int/news-room/facts-in-pictures/detail/patient-safety.
2. Ogbolu Y, Johantgen ME, Zhu S, Johnson JV. Nurse reported patient safety in low-resource settings: a cross-sectional study of MNCH nurses in Nigeria. Appl Nurs Res. 2015;28(4):341–346. doi:10.1016/j.apnr.2015.02.006
3. Ttendo SS, Was A, Preston MA, Munyarugero E, Kerry VB, Firth PG. Retrospective descriptive study of an intensive care unit at a Ugandan regional referral hospital. World J Surg. 2016;40(12):2847–2856. doi:10.1007/s00268-016-3644-5
4. Alqahtani AS, Evley R. Application of Safety Attitudes Questionnaire (SAQ) in adult intensive care units: a cross-sectional study. medRxiv. 2020. doi:10.1101/2020.07.07.20114918
5. Dunstan E, Coyer F. Safety culture in two metropolitan Australian tertiary hospital intensive care units: a cross-sectional survey. Aust Crit Care. 2020;33(1):4–11. doi:10.1016/j.aucc.2018.11.069
6. Carvalho DE, Bernardes CA, Sousa TP, et al. Factors influencing the patient safety climate in intensive care units: cross-sectional study. BMC Nurs. 2021;20(1):1–8. doi:10.1186/s12912-020-00515-w
7. Edgar D, Middleton R, Kalchbauer S, Wilson V, Hinder C. Safety attitudes build safety culture: nurse/midwife leaders improving health care using quantitative data. J Nurs Manag. 2021;29(8):2433–2443. doi:10.1111/jonm.13444
8. Devriendt E, Van den Heede K, Coussement J, et al. Content validity and internal consistency of the Dutch translation of the safety attitudes questionnaire: an observational study. Int J Nurs Stud. 2012;49(3):327–337. doi:10.1016/j.ijnurstu.2011.10.002
9. Sexton JB, Helmreich RL, Neilands TB, et al. The safety attitudes questionnaire: psychometric properties, benchmarking data, and emerging research. BMC Health Serv Res. 2006;6(1):44. doi:10.1186/1472-6963-6-44
10. Hardesty DM, Bearden WO. The use of expert judges in scale development: implications for improving face validity of measures of unobservable constructs. J Bus Res. 2004;57(2):98–107. doi:10.1016/S0148-2963(01)00295-8
11. Zamanzadeh V, Ghahramanian A, Rassouli M, Abbaszadeh A, Alavi-Majd H, Nikanfar A-R. Design and implementation content validity study: development of an instrument for measuring patient-centered communication. J Caring Sci. 2015;4(2):165. doi:10.15171/jcs.2015.017
12. Coetzee SK, Klopper HC, Ellis SM, Aiken LH. A tale of two systems—Nurses practice environment, well being, perceived quality of care and patient safety in private and public hospitals in South Africa: a questionnaire survey. Int J Nurs Stud. 2013;50(2):162–173. doi:10.1016/j.ijnurstu.2012.11.002
13. Huang DT, Clermont G, Sexton BJ, et al. Perceptions of safety culture vary across the intensive care units of a single institution. Crit Care Med. 2007;35(1):165–176. doi:10.1097/01.CCM.0000251505.76026.CF
14. Soi I. From Trade to Regional Integration: the Checkered History of Kiswahili in Uganda. In: Handbook of the Changing World Language Map. Springer; 2020:1267–1279.
15. Ssentanda ME, Nakayiza J. “Without English There Is No Future”: the Case of Language Attitudes and Ideologies in Uganda. In: Sociolinguistics in African Contexts. Springer; 2017:107–126.
16. Zaichkowsky JL. Measuring the involvement construct. J Consum Res. 1985;12:341–352. doi:10.1086/208520
17. Polit DF, Beck CT. The content validity index: are you sure you know what’s being reported? Critique and recommendations. Res Nurs Health. 2006;29(5):489–497. doi:10.1002/nur.20147
18. Rubio DM, Berg-Weger M, Tebb SS, Lee ES, Rauch S. Objectifying content validity: conducting a content validity study in social work research. Soc Work Res. 2003;27(2):94–104. doi:10.1093/swr/27.2.94
19. Davis LL. Instrument review: getting the most from a panel of experts. Appl Nurs Res. 1992;5(4):194–197. doi:10.1016/S0897-1897(05)80008-4
20. The University of Texas Health Science Center at Houston [UTHealth]. Center for healthcare quality and safety: generating knowledge to improve patient care Texas. University of Texas; 2008. Available from: https://med.uth.edu/chqs/survey/.
21. Brower CK. Too long and too boring: the effects of survey length and interest on careless responding; 2018.
22. Morii M, Sakagami T, Masuda S, Okubo S, Tamari Y. How does response bias emerge in lengthy sequential preference judgments? Behaviormetrika. 2017;44(2):575–591. doi:10.1007/s41237-017-0036-6
23. Lucy L, Mendelsohn J. Using sentiment induction to understand variation in gendered online communities. arXiv preprint arXiv. 2018;2018:181107061.
24. Tredici MD. Linguistic Variation in Online Communities: A Computational Perspective. University of Amsterdam; 2020.
25. Pinheiro JPA, de Sousa Uva A. Safety climate in the operating room: translation, validation and application of the safety attitudes questionnaire. Rev Port de Saude Publica. 2016;34(2):107–116. doi:10.1016/j.rpsp.2015.07.006
26. Deilkås ET, Hofoss D. Psychometric properties of the Norwegian version of the Safety Attitudes Questionnaire (SAQ), generic version (short form 2006). BMC Health Serv Res. 2008;8(1):191. doi:10.1186/1472-6963-8-191
27. Zygmont C, Smith MR. Robust factor analysis in the presence of normality violations, missing data, and outliers: empirical questions and possible solutions. Quant Meth Psych. 2014;10(1):40–55. doi:10.20982/tqmp.10.1.p040
28. Burton D, King A, Bartley J, Petrie KJ, Broadbent E. The surgical anxiety questionnaire (SAQ): development and validation. Psychol Health. 2019;34(2):129–146. doi:10.1080/08870446.2018.1502770
29. Kristensen S, Sabroe S, Bartels P, Mainz J, Christensen KB. Adaption and validation of the safety attitudes questionnaire for the Danish hospital setting. Clin Epidemiol. 2015;7:149. doi:10.2147/CLEP.S75560
30. Gkolia A, Belias D, Koustelios A. Teacher’s job satisfaction and selfefficacy: a review. Eur Sci J. 2014;10:22.
31. Águas R, Araújo C, Soares S. Safety Attitudes Questionnaire–intensive care unit version: adaptation and validation for the Portuguese population. Rev Enferm Ref. 2017;4(15):101–108. doi:10.12707/RIV17041
32. Cui Y, Xi X, Zhang J, et al. The safety attitudes questionnaire in Chinese: psychometric properties and benchmarking data of the safety culture in Beijing hospitals. BMC Health Serv Res. 2017;17(1):590. doi:10.1186/s12913-017-2543-2
33. De Carvalho R, Cassiani S. Cross-cultural adaptation of the safety attitudes questionnaire-short form 2006 for Brazil. Rev Lat Am Enfermagem. 2012;20(3):575–582. doi:10.1590/S0104-11692012000300020
34. Hamid HSA, Kar CSC, Murad NS. Adaptation and Validation of the Safety Attitude Questionnaire (SAQ) in Malaysian healthcare setting. J Psikol Malays. 2016;30:1.
35. Nguyen G, Gambashidze N, Ilyas SA, Pascu D. Validation of the safety attitudes questionnaire (short form 2006) in Italian in hospitals in the northeast of Italy. BMC Health Serv Res. 2015;15(1):284. doi:10.1186/s12913-015-0951-8
36. Saraiva D, De Almeida A. Validation of the safety attitudes questionnaire-short form 2006 to Portugal. Int J Nurs. 2015;2(1):103–112.
 © 2023 The Author(s). This work is published and licensed by Dove Medical Press Limited. The
full terms of this license are available at https://www.dovepress.com/terms
and incorporate the Creative Commons Attribution
- Non Commercial (unported, 3.0) License.
By accessing the work you hereby accept the Terms. Non-commercial uses of the work are permitted
without any further permission from Dove Medical Press Limited, provided the work is properly
attributed. For permission for commercial use of this work, please see paragraphs 4.2 and 5 of our Terms.
© 2023 The Author(s). This work is published and licensed by Dove Medical Press Limited. The
full terms of this license are available at https://www.dovepress.com/terms
and incorporate the Creative Commons Attribution
- Non Commercial (unported, 3.0) License.
By accessing the work you hereby accept the Terms. Non-commercial uses of the work are permitted
without any further permission from Dove Medical Press Limited, provided the work is properly
attributed. For permission for commercial use of this work, please see paragraphs 4.2 and 5 of our Terms.
Recommended articles
Patient Safety Climate in Danish Primary Care: Adaption and Validation of the Danish Safety Attitudes Questionnaire (SAQ-DK-PRIM)
Juhl MH, Olesen AE, Deilkås ET, Bruun NH, Obling KH, Rytter N, Larsen MD, Kristensen S
Clinical Epidemiology 2024, 16:533-547
Published Date: 27 August 2024