Back to Journals » Journal of Pain Research » Volume 10
Validation of the Norwegian Pain Sensitivity Questionnaire
Authors Valeberg BT, Pedersen LM, Girotto V, Christensen VL ![]() , Stubhaug A
, Stubhaug A
Received 6 December 2016
Accepted for publication 27 February 2017
Published 12 May 2017 Volume 2017:10 Pages 1137—1142
DOI https://doi.org/10.2147/JPR.S129540
Checked for plagiarism Yes
Review by Single anonymous peer review
Peer reviewer comments 3
Editor who approved publication: Dr Michael Schatman
Berit Taraldsen Valeberg,1 Linda Margareth Pedersen,2,3 Valentina Girotto,3,4 Vivi Lycke Christensen,5 Audun Stubhaug3,6
1Department of Nursing and Health promotion, Oslo and Akershus University College of Applied Sciences, 2Research and communication unit for musculoskeletal health (FORMI), 3Department of Pain Management and Research, Oslo University Hospital, Oslo, Norway; 4Faculty of Medicine and Surgery, University of Turin, Turin, Italy; 5Division of Emergencies and Critical Care, Department of Research and Development, Oslo University Hospital, 6Institute of Clinical Medicine, Faculty of Medicine, University of Oslo, Oslo, Norway
Background and purpose: There is a large variation in people’s reactions to painful stimuli. Although some conditions are more painful, the variation between people is larger than the reaction to pain across conditions. Induced experimental pain is one way to assess some aspects of these differences in pain perception. Experimental nociceptive testing is time consuming and not always feasible in a clinical setting. In order to overcome the obstacles of assessing pain sensitivity using experimental stimulation, the Pain Sensitivity Questionnaire (PSQ) was developed. The purpose of this study is to validate the Norwegian version of the PSQ.
Methods: Construct validity was examined through an exploratory principal component factor analysis with varimax rotation. Internal consistency was measured by Cronbach’s alpha reliability for subscales and the total PSQ. As confounding variables such as age and gender may contribute to the experience of pain, a regression analysis was performed with demographic variables and PSQ scores as independent variables and the experimental measures of pain as the dependent variable.
Results: The factor analysis yielded at two factor solution, with an eigenvalue greater than one, explain 58% of the variance. Cronbach’s alpha for the PSQ was 0.92. In the regression analysis, only PSQ scores contributed to explain the experimental pain intensity and tolerance. Gender only influenced the experimental pain threshold, as men had statistically significant higher heat pain threshold than women.
Conclusion: This study shows that PSQ is a valid and reliable questionnaire and might be a promising instrument for assessing pain sensitivity in Norwegian clinical settings. Further studies are needed to examine whether the PSQ can be used in clinical settings to predict postoperative pain and the development of chronic pain.
Keywords: experimental pain, pain sensitivity questionnaire, factor analysis, gender
Introduction
There is a huge variation between subjects in reported pain after standardized stimuli. Although some conditions in general are more painful than other conditions, the variation between people is larger than the variation in pain across conditions.1 Induced experimental pain is one way to assess some aspects of these differences in pain perception. Experimental assessment of pain sensitivity can be performed by different stimulation modalities such as thermal, mechanical, ischemic or electrical stimulation. There is a growing awareness of the correlation between experimental pain sensitivity and postoperative pain2,3 and the risk of chronic pain.4,5 Furthermore, chronic pain patients who have higher experimental pain sensitivity respond less favorably to treatment, compared to chronic pain patients who have lower pain sensitivity.6–8
Experimental nociceptive testing is time consuming and not always feasible in a clinical setting. The procedures may also be aversive for the patients. In order to overcome the obstacles of assessing pain sensitivity using experimental stimulation, Ruscheweyh et al9 developed the “Pain Sensitivity Questionnaire” (PSQ). The PSQ is based on pain intensity rating of imagined painful situations occurring in daily life and has demonstrated promising results. In a study with healthy adults, they found a statistically significant correlation between the PSQ and experimental pain intensity.9 In a more recent study, a statistically significant correlation between PSQ and experimental pain intensity and threshold measured by pressure and heat was found in chronic pain patients.10 Correlation between PSQ and clinical pain ratings is also found.11,12
PSQ may therefore be a useful tool to screen patients’ pain sensitivity in a clinical setting. This could potentially identify patients in danger of experiencing more severe postoperative pain, of developing chronic pain and patients responding less favorably to pain treatment. The purpose of this study is to validate the Norwegian version of the PSQ.
Methods
Setting and participants
For the item analysis and reliability test, 331 healthy volunteers participated: 48 persons were recruited from Oslo University Hospital and 283 from Oslo and Akershus University College. All participants were >18 years old and had sufficient knowledge of Norwegian. All participants received written information about the study. The participants from Oslo University Hospital gave a written informed consent on a consent form and the participants from the University College gave their consent by filling in the PSQ. The study was approved by the University College and the Regional Committee for Medical and Health Research Ethics (REK, no. 2011/2484).
In the analysis of correlations between experimental pain and PSQ, only data from the cohort from Oslo university hospital were included.
Measurements
Pain sensitivity questionnaire
The PSQ is based on pain intensity rating of imagined painful situations occurring in daily life. It consists of 17 items, describing different daily life situations with a scoring from 0 (not painful) to 10 (worst pain imaginable) on a numeric rating scale. Fourteen items are directed toward situations that are considered painful by the majority of healthy subjects and three items are directed toward nonpainful situations as perceived by most people. These three items are meant to serve as a nonpainful sensory reference for the participants and are not used in the final score. The painful items represent diverse types of pain such as hot, cold, sharp and blunt and different body sites such as head, upper and lower extremity. The PSQ can be summed in a total, a PSQ minor and PSQ moderate score.9 Internal consistency measured by Cronbach’s alpha showed 0.92 for the PSQ total, 0.81 for PSQ minor and 0.91 for PSQ moderate.9
The PSQ was translated from German into Norwegian in accordance with international guidelines.13 First, independently, two medically educated, bilingual, native German-speaking people translated the PSQ from German into Norwegian. The two translated versions were compared and combined into one Norwegian version. This Norwegian version was then back translated into German by a third bilingual German person. The back-translated German version was then sent to the author of the original German questionnaire for comments, and small adjustments were made. The back and forth translation procedures were repeated until the translated Norwegian version was found to be congruent with the original questionnaire. A pilot test was conducted with five healthy volunteers and they were interviewed to detect any ambiguities or difficulties answering the questionnaire or any grammatical issues, and the cultural relevance was evaluated. No adjustments were needed after the pilot test. Experimental pain testing was performed with different modalities (heat and cold) and different measures (pain threshold, pain intensity and pain tolerance) on the cohort from Oslo University Hospital.
Heat pain threshold test
The heat pain threshold was measured using a 3×3 cm thermal thermode (Pathway ATS; Medoc Ltd, Ramat Yishai, Israel). Stimuli were applied to the volar surface of the participants’ nondominant forearm. The stimulation started at a neutral temperature (32°C) and increased with 1°C/second. The safety limit was set to a maximum of 50°C. The participants were instructed to press a button when the sensation changed from warmth to pain. When the button was pressed, the temperature was registered and the thermode temperature was reduced with 8°C/second back to 32°C. The procedure was repeated three times for each subject. The mean of the three tests served as the heat pain threshold measure.
Cold pressor test
Pain sensitivity and pain tolerance were measured by a cold pressor test. The participants were asked to submerge their dominant hand and wrist in circulating cold water and keep it immerged as long as they were able to, up to a maximum of 120 seconds. The water bath (Julabo PF40-HE; Julabo Labortechnik GmbH, Seelbach, Germany) was connected to a 13 L external plexi-glass container, with calibrated water temperature of 3.0°C and a flow rate of 22 L/min. During the stimulus, the subjects rated their pain intensity on a custom-made electronic visual analog scale (VAS): 100 mm VAS with the endpoints from 0 (no pain) to 100 (worst pain imaginable). The psychometric properties of the VAS are supported.14 The first VAS rating was obtained after 5 seconds, and thereafter every 10 seconds. The mean VAS served as the pain intensity measure. Time to withdrawal of the hand from the cold water was registered by a technician in the custom-made electronic data program. The time was measured and stored automatically. Time to withdrawal served as a measure of pain tolerance. Missing pain ratings after withdrawal were replaced by the VAS score 100 corresponding to worst pain imaginable.15–17
Statistical analysis
Data were analyzed using Statistical Package for the Social Sciences version 20.0 (IBM Corporation, Armonk, NY, USA). The data were examined for normality, and normal distribution was supported by the normal Q–Q plot with no clustering of points, with most collecting around the zero line.
Descriptive statistics were performed on the demographic variables. Construct validity was examined by an exploratory principal component factor analysis with varimax rotation. A sample size of over 300 is considered to be appropriate.18 Furthermore, construct validity was evaluated by examining the correlations between the PSQ and the experimental pain measures using Pearson product moment. Reliability was examined by internal consistency using Cronbach’s alpha for each subscale and the total PSQ. For all tests, p value <0.05 was considered statistically significant. As confounding variables may contribute to the experience of pain, a regression analysis was performed with demographic variables and PSQ scores as the independent variables and the experimental measures of pain as the dependent variable.
Results
The majority of the total cohort were female (76%) and the majority of the participants were younger than 60 years (90%). In the cohort (n=48) used to evaluate the validity of the PSQ by examining the correlations between experimental pain and PSQ, 56% were male and 44% female and they had a median age of 27.5 years (range from 21 to 54 years).
The factor analysis yielded at two factor solution with an eigenvalue greater than one, explaining 58% of the variance. The factor loading of an item should be above 0.4 and the higher loading on the factor the better (Table 1). All items in factor 1 (PSQ moderate) had a mean score from 5.0 (standard deviation [SD] 2.2) to 6.5 (SD 2.4). All items in factor 2 (PSQ minor) had a mean score from 2.1 (SD 1.6) to 4.1 (SD 2.4). The mean score for PSQ total was 4.5 (SD 1.5), for PSQ moderate was 5.9 (SD 1.8) and for PSQ minor was 3.1 (SD 1.3).
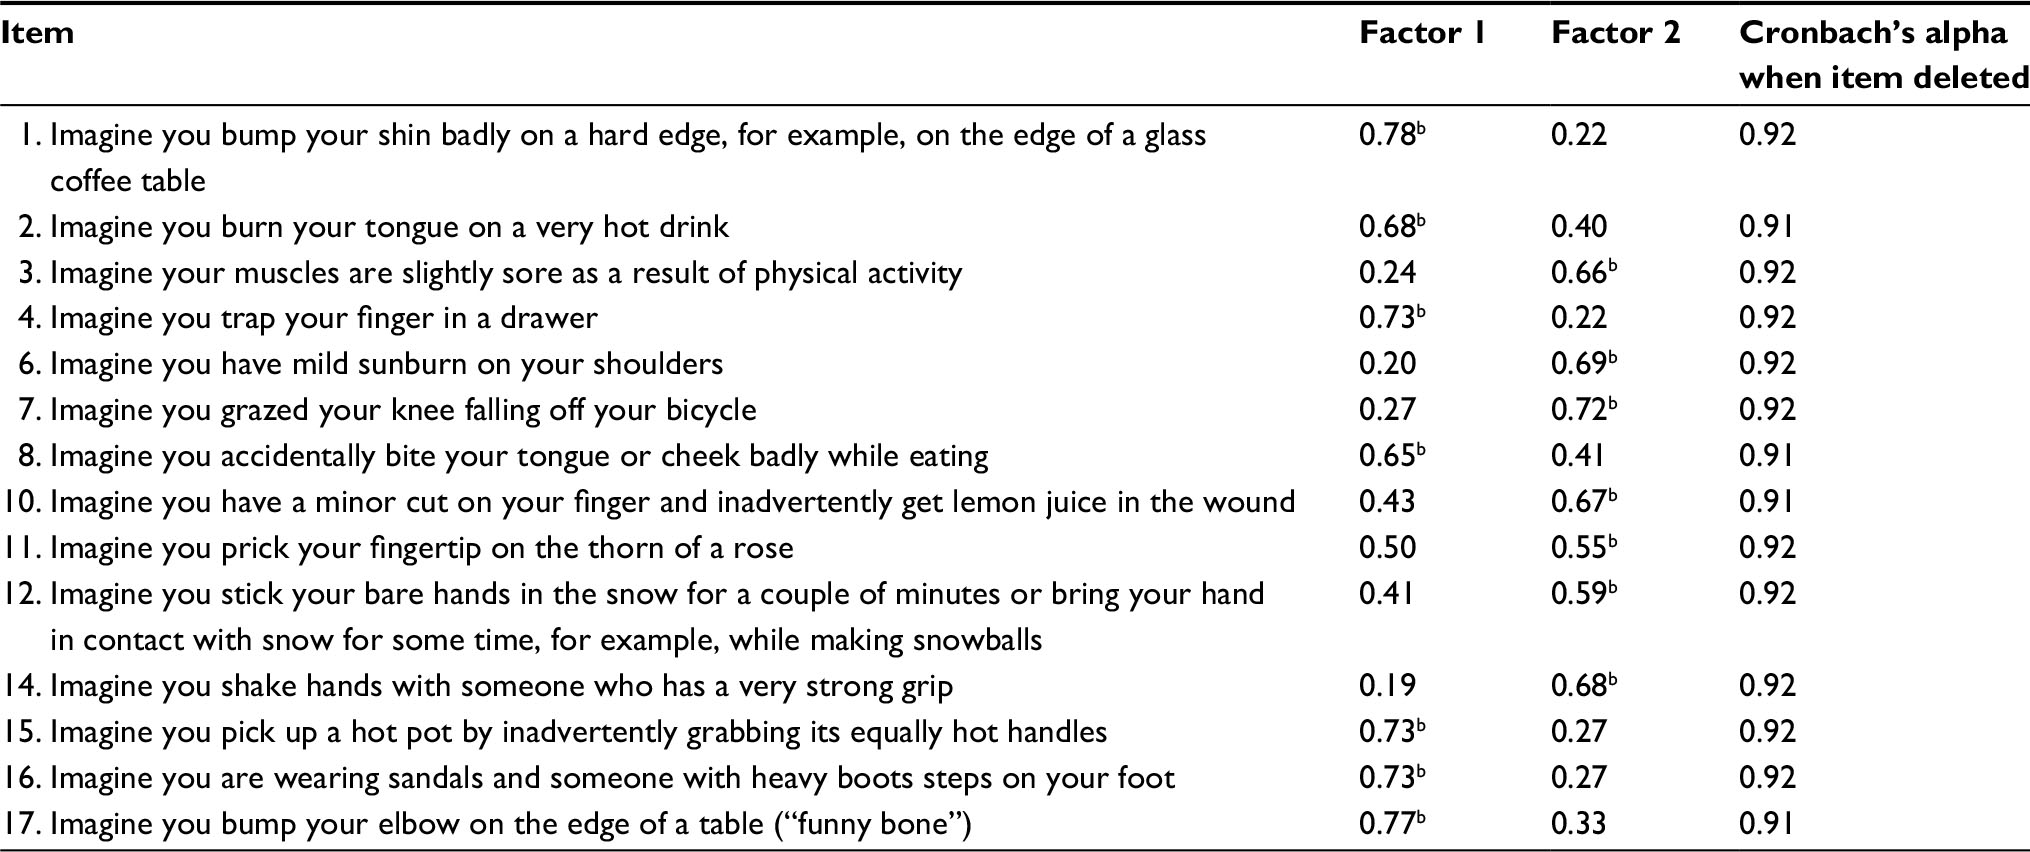 | Table 1 Factor analysis of the pain sensitivity questionnaire (N=331)a Notes: aExtraction method: principal component. Rotation method: varimax with Kaiser normalization. A rotation converged in three iterations. bThese values have the highest loading. |
Reliability was measured by internal consistencies. Cronbach’s alpha was 0.92 for PSQ total, 0.90 for PSQ moderate and 0.85 for PSQ minor.
In the experimental assessment of pain sensitivity, 79% of the subjects tolerated the cold pressor test for 2 minutes, with a range in tolerance time from 26 to 120 seconds. Patients’ mean pain intensity varied from 7.5 to 100 on a scale from 0 to 100. The mean pain intensity was 62.2 (SD 22.5). Patients’ mean heat pain threshold was 44.8°C (SD 2.8).
As shown in Table 2, no correlation was found between experimental pain threshold measured by heat stimulation and any of the PSQ scales. However, statistically significant correlations were found both between all the PSQ scores and the experimental scores of pain intensity during cold pressor test, and between the PSQ total and PSQ minor and the pain tolerance measured by cold pressor test.
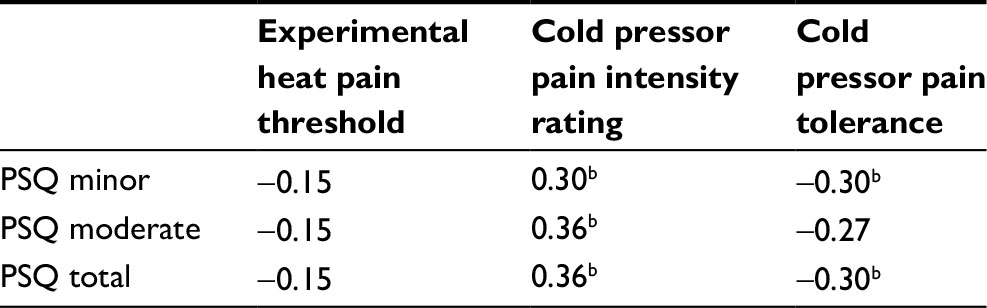 | Table 2 Correlationsa between healthy subjects’ PSQ and experimental pain sensitivity (n=48) Notes: aPearson product moment. bSignificant at p≤0.05 level. Abbreviation: PSQ, Pain Sensitivity Questionnaire. |
As confounding variables also may contribute to the experience of pain, a regression analysis was performed with the three experimental measures of pain used as dependent variable. As shown in Table 3, only gender influenced the experimental pain threshold as the male participants had statistically significant higher heat pain threshold than women. Only PSQ contributed to explain the experimental pain intensity and pain tolerance.
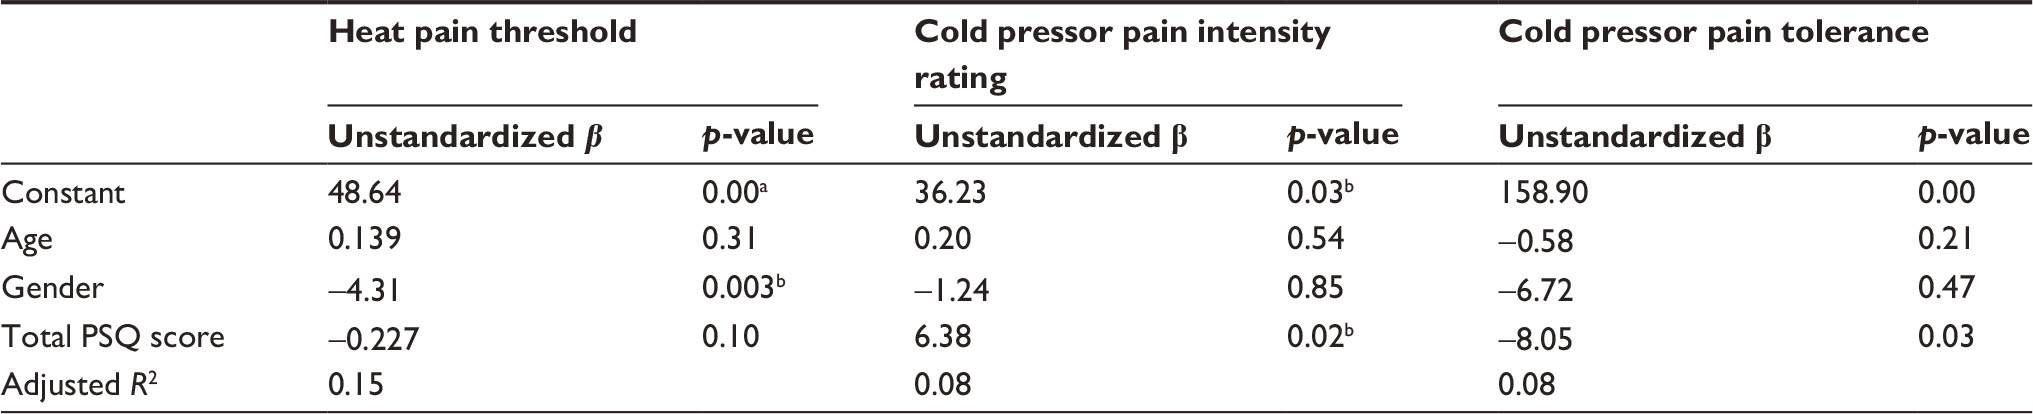 | Table 3 Linear regression analysis with experimental pain measures as the dependent variable (n=48) Notes: aSignificant at p≤0.001 level. bSignificant at p≤0.05 level. Abbreviation: PSQ, Pain Sensitivity Questionnaire. |
Discussion
The validation of the Norwegian PSQ is at large in accordance with the results from the validation of the original questionnaire,9 supporting the validity and reliability of the questionnaire.
In the factor analysis, two factors emerged, which were in accordance with the two factors found in the original questionnaire (PSQ minor and PSQ moderate).9 There was a small difference, as all items in the German PSQ minor had a mean score <4. In the Norwegian version, the mean score of item 12 was 4.1 (imagine you stick your bare hands in the snow for a couple of minutes or bring your hands in contact with snow for some time, e.g., while making snowballs). In the German sample, the mean score of this item had a mean score just >2. This difference may reflect the differences between the two countries in the general experience with snow during the winter season. Norwegians have normally more snow during winter, compared to Germans. We also found a statistically significant correlation between experimental pain intensity and PSQ total and the two subscales as did Ruscheweyh et al,9 but the correlations were not as strong. One possible explanation for this difference is that Ruscheweyh et al used the sum score of different pain modalities to measure pain sensitivity in their study. Using such a sum score of different pain modalities may be a suitable way to validate PSQ as a measure of general pain sensitivity, as different pain modalities are not well correlated and represent different specific dimensions.19 When comparing the same pain modality (cold pressor) in the two studies, a more similar correlation was found. The Norwegian sample also had somewhat lower pain intensity rating with a larger SD, compared to the German study.9 This probably reflects random differences between the two study populations. In a large epidemiologic study, cold pressor data were shown to be influenced by age, gender, chronic pain and hypertension.20,21 In addition, small differences in context and methods are known to influence pain scoring.
Another difference between the two studies is that Ruscheweyh et al9 found that PSQ minor had the highest correlation with experimental pain intensity, while PSQ moderate and PSQ total had the highest correlation with experimental pain intensity in our study. Ruscheweyh et al9 suggested that their findings might be due to a larger interindividual variance in the PSQ minor, but this explanation would not fit as our healthy subjects had higher interindividual variance in PSQ minor compared to their study (0.77 versus 0.44). Furthermore, they hypothesized that experimental pain stimuli are conceptually more similar to mildly painful than to moderately painful daily life situations because they are perceived to be more controllable. Our result does not support this notion. We found high correlation with cold pressor pain which definitely is perceived as severe pain by the majority, while heat pain threshold represents mild pain.
In our study, we also examined the correlation between pain intensity during cold pressor test and PSQ, and found that patients reporting higher pain intensity scored statistically significantly higher on the PSQ. Cold pressor pain is definitely perceived as severe pain by the majority. As Ruscheweyh et al,9 we did not find a correlation between heat pain threshold and PSQ, supporting that PSQ does not reflect pain threshold. Thus, PSQ predicts suprathreshold experimental pain in our study. Interestingly, clinical studies generally find that preoperative suprathreshold experimental pain is a better predictor of clinical pain than pain threshold.22,23
In a systematic review, preoperative pain, anxiety, age and type of surgery were found to be significant predictors of postoperative pain. These factors explained ~54% of the predictive model.24 PSQ could potentially contribute to predict pain, as PSQ had better predictive value of experimental pain than the psychological variables such as anxiety, depression and catastrophizing.10
A limitation may be that we did not explicitly ask the participants about ongoing clinical pain, but they were examined for conditions that might influence the pain sensitivity testing, such as wounds and injuries of the hand or other illnesses. Patients in pain may score differently on the PSQ, as research has shown that chronic pain patients may exhibit a generalized increase in experimental pain perception.23,25 Furthermore, a possible limitation of the questionnaire in general is that at least one question is linked to cold climate, which makes it less applicable to countries with a warmer climate.
In conclusion, this study shows that Norwegian PSQ may be a valid and reliable instrument for assessing pain sensitivity in general. Further studies are needed to examine whether the PSQ can be used in clinical settings to predict both acute postoperative pain and persistent postoperative pain.
Disclosure
The authors report no conflicts of interest in this work.
References
Nielsen CS, Staud R, Price DD. Individual differences in pain sensitivity: measurement, causation, and consequences. J Pain. 2009;10(3):231–237. | ||
Abrishami A, Chan JB, Chung F, Wong J. Preoperative pain sensitivity and its correlation with postoperative pain and analgesic consumption: a qualitative systematic review. Anesthesiology. 2011;114(2):445–457. | ||
Granot M. Can we predict persistent postoperative pain by testing preoperative experimental pain? Curr Opin Anesthesio. 2009;22(3):425–430. | ||
Kehlet H, Jensen TS, Woolf CJ. Persistent postsurgical pain: risk factors and prevention. Lancet. 2006;367(9522):1618–1625. | ||
Aasvang EK, Gmaehle E, Hansen JB, et al. Predictive risk factors for persistent postherniotomy pain. Anesthesiology. 2010;112(4):957–969. | ||
Edwards RR, Doleys DM, Lowery D, Fillingim RB. Pain tolerance as a predictor of outcome following multidisciplinary treatment for chronic pain: differential effects as a function of sex. Pain. 2003;106(3):419–426. | ||
Edwards RR, Haythornthwaite JA, Tella P, Max MB, Raja S. Basal heat pain thresholds predict opioid analgesia in patients with postherpetic neuralgia. Anesthesiology. 2006;104(6):1243–1248. | ||
Granot M, Zimmer EZ, Friedman M, Lowenstein L, Yarnitsky D. Association between quantitative sensory testing, treatment choice, and subsequent pain reduction in vulvar vestibulitis syndrome. J Pain. 2004;5(4):226–232. | ||
Ruscheweyh R, Marziniak M, Stumpenhorst F, Reinholz J, Knecht S. Pain sensitivity can be assessed by self-rating: development and validation of the pain sensitivity questionnaire. Pain. 2009;146(1–2):65–74. | ||
Ruscheweyh R, Verneuer B, Dany K, et al. Validation of the pain sensitivity questionnaire in chronic pain patients. Pain. 2012;153(6):1210–1218. | ||
Sellers AB, Ruscheweyh R, Kelley BJ, Ness TJ, Vetter TR. Validation of the English language pain sensitivity questionnaire. Reg Anesth Pain Med. 2013;38(6):508–514. | ||
Kim HJ, Lee JI, Kang KT, et al. Influence of pain sensitivity on surgical outcomes after lumbar spine surgery in patients with lumbar spinal stenosis. Spine (Phila Pa 1976). 2015;40(3):193–200. | ||
Beaton DE, Bombardier C, Guillemin F, Ferraz MB. Guidelines for the process of cross-cultural adaptation of self-report measures. Spine. 2000;25(24):3186–3191. | ||
Ferreira-Valente MA, Pais-Ribeiro JL, Jensen MP. Validity of four pain intensity rating scales. Pain. 2011;152(10):2399–2404. | ||
Olsen RB, Bruehl S, Nielsen CS, Rosseland LA, Eggen AE, Stubhaug A. Hypertension prevalence and diminished blood pressure-related hypoalgesia in individuals reporting chronic pain in a general population: the Tromsø study. Pain. 2013;154(2):257–262. | ||
Neziri Ay, Curatolo M, Nuesch E, et al. Factor analysis of repsonses to thermal, electical, and mechanical pain ful stimuli supports the importance3 of multi-model pain assessmen. Pain. 2011;152(5):1146–1155. | ||
Neziri AY, Scaramozzino P, Andersen OK, Dickenson AH, Arendt-Nielsen L, Curatolo M. Reference values of mechanical and thermal pain tests in a pain-free population. Eur J Pain. 2011;15(4):376–383. | ||
Tabachnick BG, Fidell LS. Using multivariate statistics; 2007. Boston, MA: Pearson/Allyn and Bacon. | ||
Neziri AY, Curatolo M, Nüesch E, et al. Factor analysis of responses to thermal, electrical, and mechanical painful stimuli supports the importance of multi-modal pain assessment. Pain. 2011;152(5):1146–1155. | ||
Olsen RB, Bruehl S, Nielsen CS, Rosseland LA, Eggen AE, Stubhaug A. Gender differences in blood pressure-related hypoalgesia in a general population: the Tromsø Study. J Pain. 2013;14(7):699–708. | ||
Johansen A, Schirmer H, Stubhaug A, Nielsen CS. Persistent post-surgical pain and experimental pain sensitivity in the Tromsø study: comorbid pain matters. Pain. 2014;155(2):341–348. | ||
Edwards RR, Sarlani E, Wesselmann U, Fillingim RB. Quantitative assessment of experimental pain perception: multiple domains of clinical relevance. Pain. 2005;114(3):315–319. | ||
Ashina S, Bendtsen L, Ashina M, Magerl W, Jensen R. Generalized hyperalgesia in patients with chronic tension-type headache. Cephalalgia. 2006;26(8):940–948. | ||
Ip HYV, Abrishami A, Peng PW, Wong J, Chung F. Predictors of postoperative pain and analgesic consumption: a qualitative systematic review. Anesthesiology. 2009;111(3):657–677. | ||
Giesecke T, Gracely RH, Grant MAB, et al. Evidence of augmented central pain processing in idiopathic chronic low back pain. Arthritis Rheum. 2004;50(2):613–623. |
 © 2017 The Author(s). This work is published and licensed by Dove Medical Press Limited. The
full terms of this license are available at https://www.dovepress.com/terms
and incorporate the Creative Commons Attribution
- Non Commercial (unported, 3.0) License.
By accessing the work you hereby accept the Terms. Non-commercial uses of the work are permitted
without any further permission from Dove Medical Press Limited, provided the work is properly
attributed. For permission for commercial use of this work, please see paragraphs 4.2 and 5 of our Terms.
© 2017 The Author(s). This work is published and licensed by Dove Medical Press Limited. The
full terms of this license are available at https://www.dovepress.com/terms
and incorporate the Creative Commons Attribution
- Non Commercial (unported, 3.0) License.
By accessing the work you hereby accept the Terms. Non-commercial uses of the work are permitted
without any further permission from Dove Medical Press Limited, provided the work is properly
attributed. For permission for commercial use of this work, please see paragraphs 4.2 and 5 of our Terms.