Back to Journals » International Journal of Chronic Obstructive Pulmonary Disease » Volume 13
Validation of the GOLD 2017 and new 16 subgroups (1A–4D) classifications in predicting exacerbation and mortality in COPD patients
Authors Han MZ ![]() , Hsiue TR
, Hsiue TR ![]() , Tsai SH, Huang TH, Liao XM, Chen CZ
, Tsai SH, Huang TH, Liao XM, Chen CZ ![]()
Received 3 July 2018
Accepted for publication 13 September 2018
Published 18 October 2018 Volume 2018:13 Pages 3425—3433
DOI https://doi.org/10.2147/COPD.S179048
Checked for plagiarism Yes
Review by Single anonymous peer review
Peer reviewer comments 2
Editor who approved publication: Dr Chunxue Bai
Meng-Zhi Han,1,2 Tzuen-Ren Hsiue,3 Sheng-Han Tsai,1 Tang-Hsiu Huang,2,3 Xin-Min Liao,2,3 Chiung-Zuei Chen3
1Division of General Medicine, Department of Internal Medicine, National Cheng Kung University, College of Medicine and Hospital, Tainan, Taiwan; 2Institute of Clinical Medicine, College of Medicine, National Cheng Kung University, Tainan, Taiwan; 3Division of Pulmonary Medicine, Department of Internal Medicine, National Cheng Kung University, College of Medicine and Hospital, Tainan, Taiwan
Background and objective: A multidimensional assessment of COPD was recommended by the Global Initiative for Chronic Obstructive Lung Disease (GOLD) in 2013 and revised in 2017. We examined the ability of the GOLD 2017 and the new 16 subgroup (1A–4D) classifications to predict clinical outcomes, including exacerbation and mortality, and compared them with the GOLD 2013 classifications.
Methods: Patients with COPD were recruited from January 2006 to December 2017. The predictive abilities of grades 1–4 and groups A–D were examined through a logistic regression analysis with receiver operating curve estimations and area under the curve (AUC).
Results: A total of 553 subjects with COPD were analyzed. The mortality rate was 48.6% during a median follow-up period of 5.2 years. Both the GOLD 2017 and the 2013 group A–D classifications had good predictive ability for total and severe exacerbations, for which the AUCs were 0.79 vs 0.77 and 0.79 vs 0.78, respectively. The AUCs for the GOLD 2017 groups A–D, grades 1–4, and the GOLD 2013 group A–D classifications were 0.70, 0.66, and 0.70 for all-cause mortality and 0.73, 0.71, and 0.74 for respiratory cause mortality, respectively. Combining the spirometric staging with the grouping for the GOLD 2017 subgroups (1A–4D), the all-cause mortality rate for group B and D patients was significantly increased from subgroups 1B–4B (27.7%, 50.6%, 53.3%, and 69.2%, respectively) and groups 1D–4D (55.0%, 68.8%, 82.1%, and 90.5%, respectively). The AUCs of subgroups (1A–4D) were 0.73 and 0.77 for all-cause and respiratory mortality, respectively; the new classification was determined more accurate than the GOLD 2017 for predicting mortality (P<0.0001).
Conclusion: The GOLD 2017 classification performed well by identifying individuals at risk of exacerbation, but its predictive ability for mortality was poor among COPD patients. Combining the spirometric staging with the grouping increased the predictive ability for all-cause and respiratory mortality.
Summary at a glance: We validate the ability of the GOLD 2017 and 16 subgroup (1A–4D) classifications to predict clinical outcome for COPD patients. The GOLD 2017 classification performed well by identifying individuals at risk of exacerbation, but its predictive ability for mortality was poor. The new 16 subgroup (1A–4D) classification combining the spirometric 1–4 staging and the A–D grouping increased the predictive ability for mortality and was better than the GOLD 2017 for predicting all-cause and respiratory mortality among COPD patients.
Keywords: multidimensional assessment, clinical outcomes, spirometric grade, predictive ability, logistic regression analysis, receiver operating curve
Introduction
COPD is a common cause of mortality in developed countries, with increasing mortality rates in developing countries.1 Globally, COPD-related deaths amount to approximately 3 million every year.2 Measurement of disease severity is important to predict prognoses and initiate treatment for patients with COPD. The GOLD criteria, which was launched first in 1997 and was updated to the current version in 2017, is used to classify the severity of COPD.3
In the GOLD 2007 classifications, postbronchodilator airflow limitations based on spirometry were used to grade the severity of COPD.4 However, COPD is a heterogeneous disease with multiple clinical manifestations and cannot be assessed based on airflow limitation only. The GOLD 2011, followed by the GOLD 2013, combined the exacerbation history and symptoms as measured by the modified Medical Research Council (mMRC) score or the COPD Assessment Test score, in addition to airflow limitation, to classify the severity of COPD.5 However, the ABCD classification was not better than a spirometric grade in terms of predicting mortality. In addition, both airflow limitation and exacerbation history modified patient outcome in groups C and D.6 In the recently refined classification, GOLD 2017, spirometric grade is separated from the ABCD classification. The assessment tool includes severity of airflow (spirometric grades 1–4) and combined symptoms and risk of exacerbation (group A–D).3
Previous studies comparing the GOLD 2007 and 2013 classifications reported that the ABCD classification predicted exacerbation better than the spirometric grade, but there was no difference in mortality predictions between the GOLD 2007 and 2013.6–9 Then, a nationwide cohort study performed by Gedebjerg et al10 reported that neither the GOLD 2017 nor 2011 classifications based on ABCD groups predicted mortality accurately, and they also found that the 16 subgroup (1A–4D) classification combining spirometric staging with the grouping increased the predictive ability for mortality and was more accurate for predicting mortality than either the GOLD 2017 or 2011. More evidence for the ability of the GOLD 2017 and the new 16 subgroup (1A–4D) classifications was therefore needed to measure risk of exacerbation and predictive ability for mortality in clinical practice.
We thus aimed at examining the ability of the GOLD 2017 and the subgroup (1A–4D) classifications to predict clinical outcomes, including exacerbation and mortality, in COPD patients and also to examine whether the GOLD 2017 classifications have greater predictive ability than the GOLD 2013 classifications.
Methods
Study population
This was a retrospective study in which 628 patients diagnosed with COPD in the pulmonary outpatient department of National Cheng Kung University Medical Center between January 2006 and December 2017 were recruited. Some of the patients included in the present study were also in our previous study.11 All patients had received regular medical treatment for COPD as outpatients for more than a year. According to the GOLD diagnosis guideline and criteria, COPD was defined as follows: all patients were ≥40 years old, had typical symptoms of COPD such as chronic and progressive dyspnea or cough with sputum production, and had a postbronchodilator ratio of forced expiratory volume in 1 second (FEV1) to forced vital capacity of <70%. All pulmonary function tests were performed according to the joint of the American Thoracic Society and the European Respiratory Society.12
Body mass index (BMI), the score for the modified mMRC dyspnea scale, the Charlson index for the degree of comorbidity, and lung function measurements with postbronchodilator spirometric values were assessed for all participants when they were included in the study. Acute exacerbation was defined as an acute worsening of the individual’s respiratory symptoms that required additional therapy such as a short-acting bronchodilator (mild), a short course of antibiotics or oral corticosteroid (moderate), and hospitalization or a visit to the emergency room due to exacerbation of COPD (severe).3 The numbers of exacerbation events in the preceding year and during follow-up for 1 year were recorded by the research assistants according to the patient’s chart and self-reported data. The Charlson index for evaluation of comorbidities was identified from the patients file and detailed interviews.
Individuals with other diseases such as end-stage lung cancer before enrollment that were likely to result in death within 2 years were excluded from the study. Participants who were not followed for more than 1 year after enrollment were excluded from the exacerbation analysis.
Participants were classified using the GOLD 2017 classifications into four grades (1–4) based on postbronchodilator FEV1 percent of prediction as stage 1 (FEV1≥80), stage 2 (50≤ FEV1<80), stage 3 (30≤ FEV1<50), and stage 4 (FEV1<30) into four groups (A–D) based on self-reported severity of dyspnea (mMRC) and risk of recurrent exacerbation. According to the GOLD 2017, a high risk of exacerbation is defined as two or more moderate exacerbations or one or more severe exacerbation in the preceding year. Patients with a low risk of exacerbation and fewer symptoms of dyspnea (mMRC 0–1) were classified as group A. Patients with a low risk of exacerbations and more symptoms of dyspnea (mMRC ≥2) were classified as group B. Patients with a high risk of exacerbations and fewer symptoms of dyspnea (mMRC 0–1) were classified as group C. Patients with a high risk of exacerbations and more symptoms of dyspnea (mMRC ≥2) were classified as group D. Moreover, in each group, patients with mild airflow limitations (FEV1≥80% of predicted) were classified into subgroups 1A–1D; patients with moderate airflow limitations (80% >FEV1≥50% of predicted) were classified into subgroups 2A–2D; patients with severe airflow limitations (50% >FEV1≥30% of predicted) were classified into subgroups 3A–3D, and patients with very severe airflow limitations (FEV1<30% of predicted) were classified into subgroups 4A–4D.
Outcomes
The exacerbation rate was calculated and survival status was evaluated by observation as in a previous study.11 Patients who died or were lost to follow-up in the first year were excluded from the exacerbation analyses due to that fact that follow-up for more than 1 year was needed to analyze the 1 year exacerbation rate in the study. Date and cause of death of participants who died in the hospital were recorded and verified using the hospital records. Date and cause of death of participants who died outside the hospital were obtained by research assistants by telephone contact with family members. We also verified the study cohort’s survival status and date of death by linking the Taiwan National Mortality Registry from the Health and Welfare Data Science Center. The research review board of National Cheng Kung University Medical Center approved this study, and all participants provided written informed consent.
Statistical analysis
A chi-squared test was used to compare the nominal variable. Continuous variables were presented as mean and standard deviation. Between-group comparisons were performed using a chi-squared test or a Fisher’s exact test to compare the nominal variables and one-way analysis of variance test to compare the continuous variable. To determine the independent mortality variables, a multivariate analysis was used to evaluate the association with age, BMI, comorbidities, the mMRC scale, postbronchodilator FEV1, and exacerbation history in the preceding year. The ability of the GOLD 2017 to predict exacerbations and all-cause and respiratory mortality was evaluated using a logistic regression analysis with receiver operating characteristic (ROC) curve estimations and an intramodal area under the ROC curve (AUC) comparisons, and P<0.05 was considered statistically significant. Statistical analyses were performed by using the PASW statistics software version 17.0.2 (SPSS Inc., Chicago, IL, USA).
Results
A total of 628 COPD patients were recruited in the study. Mortality was analyzed in a total of 553 patients because 47 patients were excluded because of missing data and 28 were excluded because of advanced malignancy. For the exacerbation analyses, 79 patients were further excluded because they died in the first year of follow-up and 66 patients (66/553; 11.9%) were lost to follow-up in the first year. Finally, the 1-year exacerbation rate was analyzed in 408 patients.
The distribution of patients in the GOLD 2013 and 2017 classifications are shown in Figure 1. Fourteen patients in group C (14/52; 26.9%) and 58 patients (58/230; 25.2%) in group D in the GOLD 2013 classification were shifted to group A and group B, respectively, in the GOLD 2017 classification. The characteristics of the subjects based on the GOLD 2017 classification groups are shown in Table 1. The median follow-up time was 5.18 (4.92–5.44) years, during which a total of 269 patients had died (269/553; 48.6%). The cause of death was respiratory-specific in 52.8%, cardiovascular-specific in 14.1%, cancer-specific in 17.1%, and related to other causes in 16%. The GOLD 2017 classification showed good ability to predict exacerbations (Table 2). Patients in the high-risk groups (groups C and D) had a higher average number of total exacerbations (3.4±4.1 vs 0.7±1.9, P<0.001) and severe exacerbations (2.0±2.8 vs 0.4±1.3, P<0.001) as compared to those in the low-risk groups (groups A and B). The logistic regression analysis showed that patients in groups C and D had a higher risk of both total and severe exacerbations as compared to those in group A, and there was no significant difference in risk of exacerbations between group B and group A (Table 3). Risk of exacerbations was higher for patients in group C than it was for those in group B, for which the odds ratio was 5.93 (95% CI, 2.58–13.62) for total exacerbations and 3.89 (95% CI, 1.72–8.28) for severe exacerbations. The ROC analysis showed good predictive ability for the GOLD 2017 classifications for total and severe exacerbations. This result was similar to the predictive ability of the GOLD 2013 classification during the first year of follow-up, where the AUCs were 0.79 vs 0.77 and 0.79 vs 0.78, respectively.
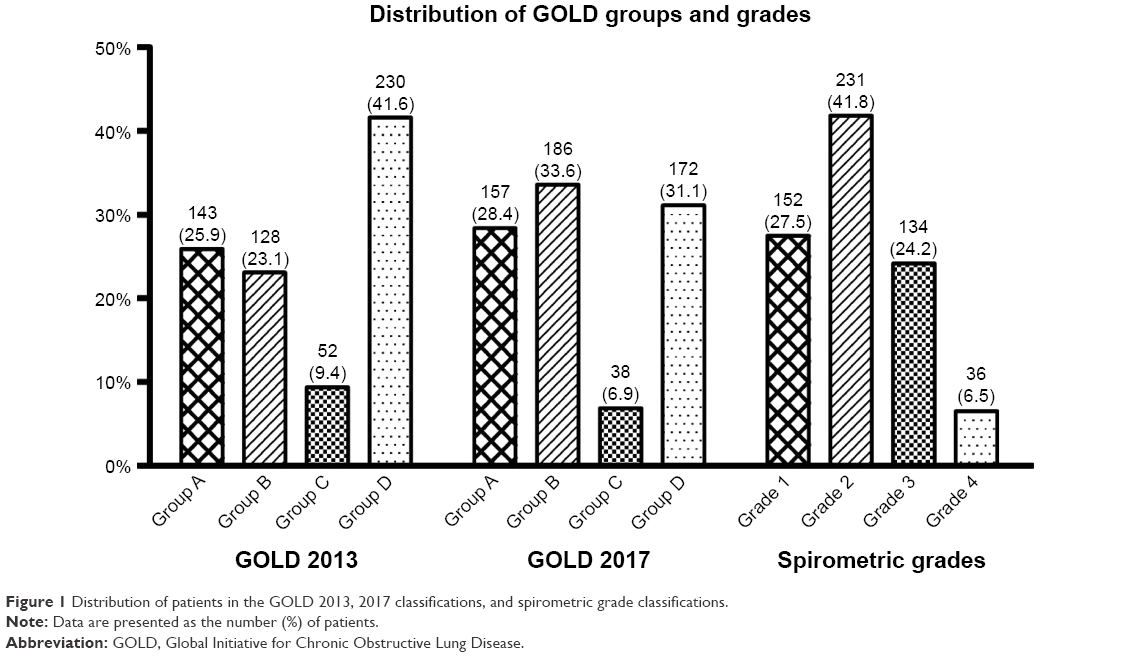 | Figure 1 Distribution of patients in the GOLD 2013, 2017 classifications, and spirometric grade classifications. |
 | Table 1 Characteristics of 553 patients according to the GOLD 2017 classification |
 | Table 2 Prognosis for patients according to the GOLD 2017 classificationa |
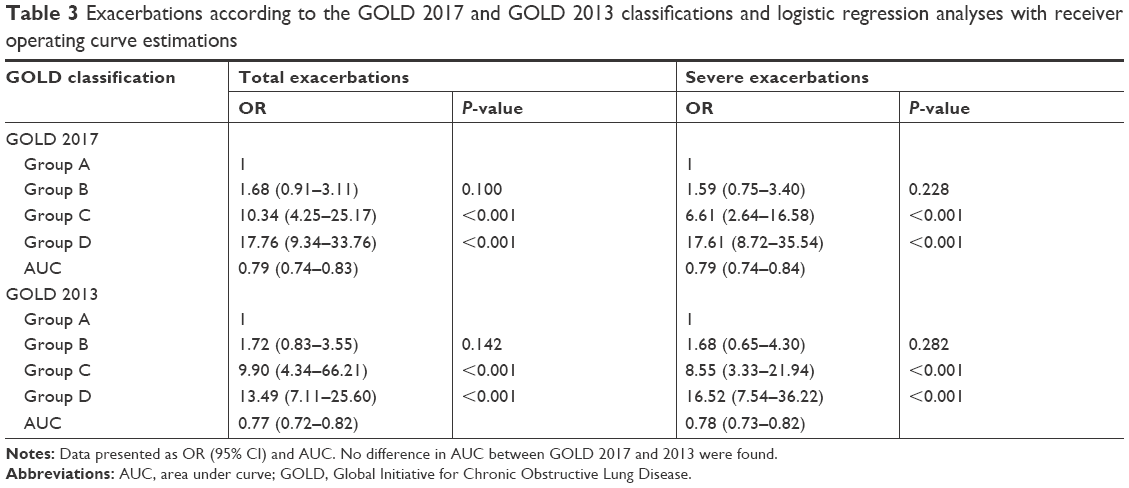 | Table 3 Exacerbations according to the GOLD 2017 and GOLD 2013 classifications and logistic regression analyses with receiver operating curve estimations |
In the GOLD 2017 groups A–D, the all-cause mortality rates were 26.1%, 46.8%, 31.6%, and 75.0%, respectively, and the respiratory mortality rates were 4.5%, 25.3%, 18.4%, and 47.1%, respectively (Table 2). The Kaplan–Meier analysis of all-cause mortality showed that group D had the highest mortality rate and that group B had higher mortality than group C in the GOLD 2017 classification. The GOLD 2017 and 2013 group A–D classifications had similar findings for all-cause mortality (Figure 2A and B). Each quartile increase in the spirometric staging of GOLD 2017 was associated with increased mortality (Figure 3A). The AUCs for the GOLD 2017 group A–D, spirometric stage 1–4, and GOLD 2013 group A–D classifications were 0.70, 0.66, and 0.70 for all-cause mortality and 0.73, 0.71, and 0.74 for respiratory cause mortality, respectively (Table 4). There was no significant difference between the GOLD 2017 group A–D and the spirometric stage 1–4 classifications (0.70 vs 0.66, P=0.15 for all-cause mortality and 0.73 vs 0.71, P=0.43 for respiratory cause mortality).
 | Figure 2 Kaplan–Meier survival curves according to the GOLD 2017 classification groups A–D (A) and the 2013 classification groups A–D (B). |
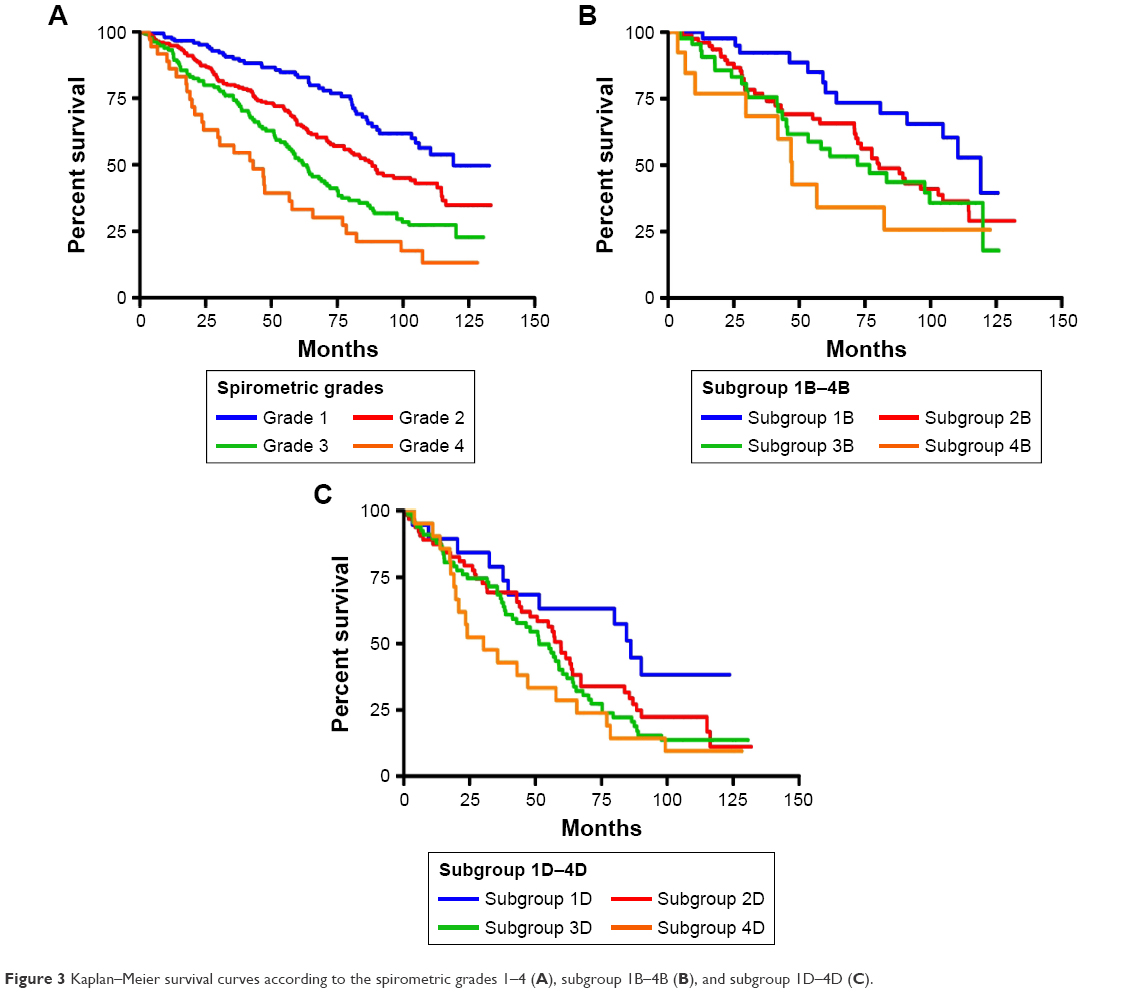 | Figure 3 Kaplan–Meier survival curves according to the spirometric grades 1–4 (A), subgroup 1B–4B (B), and subgroup 1D–4D (C). |
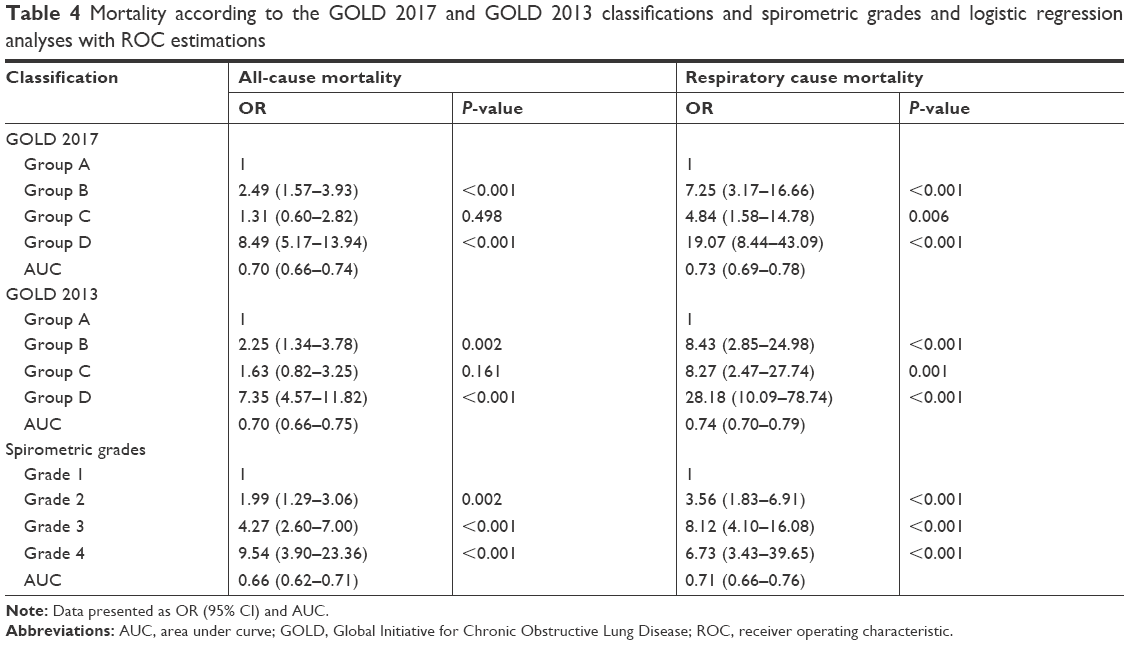 | Table 4 Mortality according to the GOLD 2017 and GOLD 2013 classifications and spirometric grades and logistic regression analyses with ROC estimations |
A multivariate analysis showed significant independent predictors of mortality, including age (P=0.001), lower BMI (P=0.003), mMRC score ≥2 (P<0.001), the Charlson index score (P<0.001), and exacerbation risk by history (P=0.006), but FEV1<50% of prediction (P=0.236) and being a current smoker (P=0.139) were not independent predictors of mortality.
In the subgroup analysis, the all-cause mortality was significantly increased in subgroups 1B–4B (27.7%, 50.6%, 53.3%, 69.2%, respectively; P=0.01) and 1D–4D (55.0%, 68.8%, 82.1%, and 90.5%, respectively; P=0.02), (Table 5), and each subgroup increase in group B (1B–4B) and group D (1D–4D) was associated with increased all-cause mortality (Figure 3B and C). The AUCs of the subgroups 1A–4D were 0.73 and 0.77 for all-cause and respiratory mortality, respectively; this new classification was more accurate than the GOLD 2017 group ABCD for predicting mortality (P<0.0001). There was no significant increase in risk of exacerbation for the subgroup 1A–4D classification.
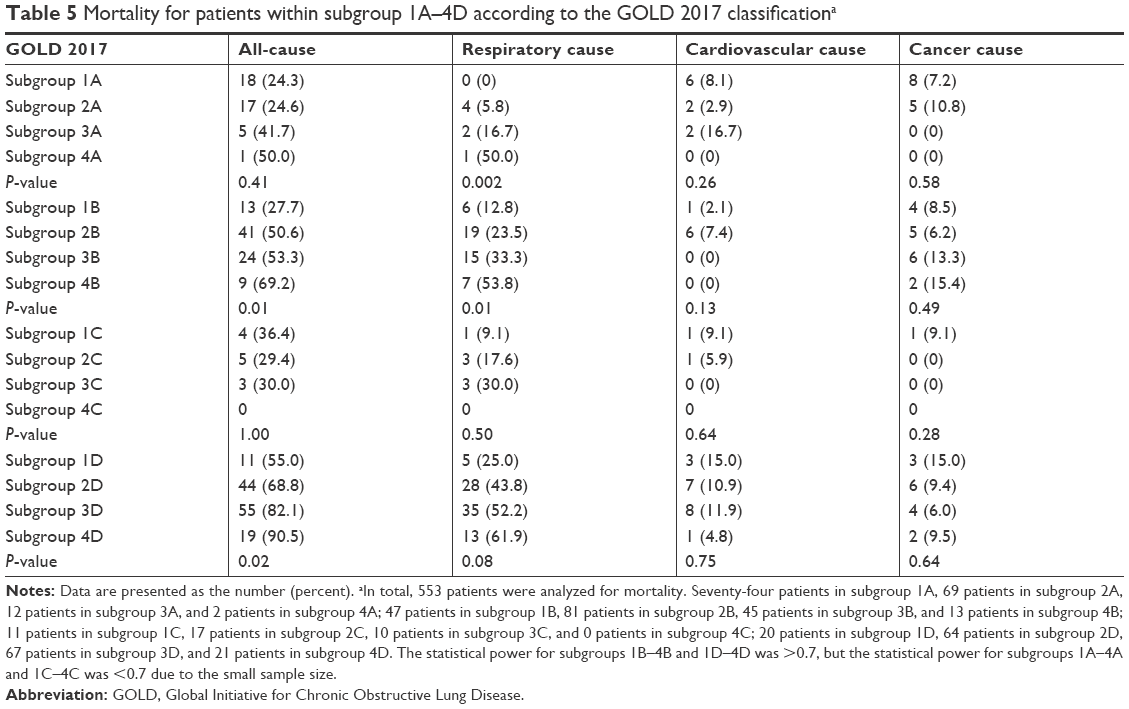 | Table 5 Mortality for patients within subgroup 1A–4D according to the GOLD 2017 classificationa |
Discussion
The main findings of this study were that the GOLD 2017 group ABCD classification showed good ability to predict recurrent exacerbations, and this ability was similar to that of the GOLD 2013 classification. The GOLD 2017 spirometric grade and group classifications and the GOLD 2013 classifications all had poor ability to predict mortality. The new subgroup (1A–4D) classification was more accurate than the GOLD 2017 group ABCD for predicting mortality.
Patients in group D had the highest risk of both total and severe exacerbations in the present study. Moreover, we found that patients in group C (high risk of exacerbations and fewer symptoms) had a higher risk of exacerbations than those in group B (low risk of exacerbations and more symptoms). After simplifying the severity classification by separating the spirometric grades from the risk of exacerbation evaluation in the GOLD 2017 ABCD classification, there was no significant difference in the predictive ability for exacerbation between the GOLD 2017 classification and the GOLD 2013 classification. Our results supported the findings by Hurst et al,13 suggesting that exacerbation frequency is a strong predictor of recurrent exacerbation.
Previous studies have shown that low FEV1 is strongly associated with mortality in the case of COPD patients.14 In addition, several studies have shown that the ABCD classification is not a better predictor of mortality than spirometric grades.8,15–17 In the present study, although a statistically significant difference was observed across the ABCD groups and the spirometric grades for the GOLD 2017 classification, it did not perform well with regard to predicting mortality. The GOLD guidelines for COPD diagnosis and management do not address clinical phenotypes and comorbidities. However, classifying COPD patients according to several clinical phenotypes, such as the asthma–COPD overlap or the frequent exacerbator with emphysema or chronic bronchitis, is useful to differentiate groups of subjects with different mortality risks.18 Comorbidities were reviewed and evaluated based on the Charlson score in the study, and the multivariate analysis revealed that an evaluation of comorbidity using the Charlson score was an independent predictor for all-cause mortality after adjusting for age, gender, the mMRC dyspnea scale, exacerbation history, and FEV1. These findings implied that clinical phenotypes and comorbidities are important predictors of mortality and may skew survival in a way that is not being accounted for in the present study or in most guidelines for COPD patients.3,5
The mortality rate was higher in group B than in group C in the present study. A nationwide cohort study performed by Gedebjerg et al10 had similar results to our findings, suggesting that mortality increases with increases in exacerbations and dyspnea, but mortality was higher for group B than for group C. The GenKOLS study15 also had similar results, and the author suggested a higher prevalence of cardiovascular disease in group B as the reason for the worse survival rate. In contrast, the prevalence of cardiovascular disease was similar in group B and group C, and the Charlson index for evaluation of comorbidities in group B was lower than that in group C in this study. These findings imply that there were other important factors causing the higher mortality in group B than in group C patients that has not been mentioned before. In group B in this study, the patients were older and had more symptoms of dyspnea than those in group C. The multivariate analysis showed that age and dyspnea (mMRC scale ≥2) were significant independent predictors of mortality. Our findings supported the finding that dyspnea is an important predictor of mortality.10 In addition, age is also a possible reason for the worse survival rate in group B as compared to that in group C.
A lot of patients (58/230; 25.2%) in group D in the GOLD 2013 classification were shifted to group B in the GOLD 2017 classification. The GOLD 2013 classification is based on a composite of spirometry and symptoms and exacerbation history. In the GOLD 2017 classification, spirometric grade is separated from the ABCD classification. Therefore, the distribution of spirometric grade according to lung function (FEV1 less or higher than 50%) (Figure 1) was one of the possible reasons for the significant change in B and D group from the GOLD 2013 to 2017.
In this study, we divided each group into four subgroups according to the spirometric grades. Each subgroup increase of group B (1B–4B) and group D (1D–4D) was associated with increased all-cause mortality, and there was a significant difference across these subgroups. In the more symptomatic groups B and D, worse lung function with a lower FEV1 was associated with higher mortality. This finding implied that a lower FEV1 is a significant independent predictor of mortality in groups with more symptoms. Moreover, the predictive ability of the 16-subgroup classification (1A–4D) was better than that of GOLD 2017 ABCD classification for all-cause mortality (0.73 vs 0.70, P<0.001) and respiratory cause mortality (0.77 vs 0.73, P<0.001). In contrast to the PLATINO study,19 no clear pattern was observed for mortality across the subgroups (1A–4D). Our findings were similar to the report by Gedebjerg et al,10 suggesting that the subgroup (1A–4D) classification improved the predictive ability for mortality more than the group ABCD classification only.
The main strengths of this study are the fact that the exact date and causes of death for all patients before December 31, 2016, was verified from the Taiwan National Mortality Registry from the Health and Welfare Data Science Center. These resources provided nearly 100% of the data for mortality analysis. In addition, all patients had received regular medical treatment for COPD as outpatients for more than 1 year, had typical symptoms of COPD, and had a postbronchodilator spirometry to confirm their COPD diagnosis.
There were four limitations of this study. First, this study was a retrospective study. Second, few women (6.6%) were enrolled in this study. Male smokers are the main proportion of COPD patients in Taiwan, where smoking prevalence for women is <5%.20 In contrast to industrialized countries in the West, COPD morbidity remains male-predominant in Asian countries.21,22 Third, the sample size of this study was relatively small, and all patients were from one center, which limited the ability to extend our findings to the general population. Fourth, the small sample size of group C and subgroups 1A–4A and 1C–4C limited the ability to measure the associations between groups and mortality.
Conclusion
The GOLD 2017 classification performed well by identifying individuals at risk of exacerbation, but its predictive ability for mortality was poor. The new 16-subgroup (1A–4D) classification increased the predictive ability for mortality and was better than the GOLD 2017 for predicting all-cause and respiratory mortality among COPD patients.
Acknowledgment
We are grateful to Sheng-Hsiang Lin and Chih-Hui Hsu for providing statistical consulting services from the Biostatistics Consulting Center, National Cheng Kung University Hospital, and to Chia-Yin Shih from the Department of Public Health, College of Medicine, National Cheng Kung University, for helping to verify the study cohort’s survival status and date of death by linking the Taiwan National Mortality Registry from the Health and Welfare Data Science Center.
Disclosure
The authors report no conflicts of interest in this work.
References
Barnes PJ. Chronic obstructive pulmonary disease: a growing but neglected global epidemic. PLoS Med. 2007;4(5):e112. | ||
GBD 2013 Mortality and Causes of Death Collaborators. Global, regional, and national age-sex specific all-cause and cause-specific mortality for 240 causes of death, 1990–2013: a systematic analysis for the Global Burden of Disease Study 2013. Lancet. 2015;385(9963):117–171. | ||
Vogelmeier CF, Criner G, Martinez FJ, et al. Global strategy for the diagnosis, management, and prevention of chronic obstructive lung disease 2017 report: GOLD executive summary. Am J Respir Crit Care Med. 2017;195(5):557–582. | ||
Rabe KF, Hurd S, Anzueto A, et al; Global Initiative for Chronic Obstructive Lung Disease. Global strategy for the diagnosis, management, and prevention of chronic obstructive pulmonary disease: GOLD executive summary. Am J Respir Crit Care Med. 2007;176(6):532–555. | ||
Vestbo J, Hurd SS, Agustí AG, et al. Global strategy for the diagnosis, management, and prevention of chronic obstructive pulmonary disease: GOLD executive summary. Am J Respir Crit Care Med. 2013;187(4):347–365. | ||
Han MK, Muellerova H, Curran-Everett D, et al. GOLD 2011 disease severity classification in COPDGene: a prospective cohort study. Lancet Respir Med. 2013;1(1):43–50. | ||
Soriano JB, Alfageme I, Almagro P, et al. Distribution and prognostic validity of the new Global Initiative for Chronic Obstructive Lung Disease grading classification. Chest. 2013;143(3):694–702. | ||
Lange P, Marott JL, Vestbo J, et al. Prediction of the clinical course of chronic obstructive pulmonary disease, using the new GOLD classification: a study of the general population. Am J Respir Crit Care Med. 2012;186(10):975–981. | ||
Agusti A, Edwards LD, Celli B, et al; ECLIPSE Investigators. Characteristics, stability and outcomes of the 2011 GOLD COPD groups in the ECLIPSE cohort. Eur Respir J. 2013;42(3):636–646. | ||
Gedebjerg A, Szépligeti SK, Wackerhausen LH, et al. Prediction of mortality in patients with chronic obstructive pulmonary disease with the new Global Initiative for Chronic Obstructive Lung Disease 2017 classification: a cohort study. Lancet Respir Med. 2018;6(3):204–212. | ||
Chen CZ, Ou CY, Wang WL, et al. Using post-bronchodilator FEV1 is better than pre-bronchodilator FEV1 in evaluation of COPD severity. COPD. 2012;9(3):276–280. | ||
American Thoracic Society; European Respiratory Society. ATS/ERS statement: raised volume forced expirations in infants: guidelines for current practice. Am J Respir Crit Care Med. 2005;172(11):1463–1471. | ||
Hurst JR, Vestbo J, Anzueto A, et al; Evaluation of COPD Longitudinally to Identify Predictive Surrogate Endpoints (ECLIPSE) Investigators Susceptibility to exacerbation in chronic obstructive pulmonary disease. N Engl J Med. 2010;363(12):1128–1138. | ||
Menezes AM, Pérez-Padilla R, Wehrmeister FC, et al; PLATINO team. FEV1 is a better predictor of mortality than FVC: the PLATINO cohort study. PLoS One. 2014;9(10):e109732. | ||
Johannessen A, Nilsen RM, Storebø M, Gulsvik A, Eagan T, Bakke P. Comparison of 2011 and 2007 Global Initiative for Chronic Obstructive Lung Disease guidelines for predicting mortality and hospitalization. Am J Respir Crit Care Med. 2013;188(1):51–59. | ||
Soriano JB, Lamprecht B, Ramírez AS, et al. Mortality prediction in chronic obstructive pulmonary disease comparing the GOLD 2007 and 2011 staging systems: a pooled analysis of individual patient data. Lancet Respir Med. 2015;3(6):443–450. | ||
Chen CZ, Ou CY, Hsu CH, Hsiue TR. Validation of the GOLD 2013 classification in predicting exacerbations and mortality in Taiwanese patients with chronic obstructive pulmonary disease. J Formos Med Assoc. 2015;114(12):1258–1266. | ||
Golpe R, Suárez-Valor M, Martín-Robles I, et al. Mortality in COPD patients according to clinical phenotypes. Int J Chron Obstruct Pulmon Dis. 2018;13:1433–1439. | ||
Menezes AM, Wehrmeister FC, Perez-Padilla R, et al. The PLATINO study: description of the distribution, stability, and mortality according to the Global Initiative for Chronic Obstructive Lung Disease classification from 2007 to 2017. Int J Chron Obstruct Pulmon Dis. 2017;12:1491–1501. | ||
Jamrozik E, Musk AW. Respiratory health issues in the Asia-Pacific region: an overview. Respirology. 2011;16(1):3–12. | ||
Tan WC, Ng TP. COPD in Asia: where East meets West. Chest. 2008;133(2):517–527. | ||
Tan WC. Trends in chronic obstructive pulmonary disease in the Asia-Pacific regions. Curr Opin Pulm Med. 2011;17(2):56–61. |
 © 2018 The Author(s). This work is published and licensed by Dove Medical Press Limited. The
full terms of this license are available at https://www.dovepress.com/terms
and incorporate the Creative Commons Attribution
- Non Commercial (unported, 3.0) License.
By accessing the work you hereby accept the Terms. Non-commercial uses of the work are permitted
without any further permission from Dove Medical Press Limited, provided the work is properly
attributed. For permission for commercial use of this work, please see paragraphs 4.2 and 5 of our Terms.
© 2018 The Author(s). This work is published and licensed by Dove Medical Press Limited. The
full terms of this license are available at https://www.dovepress.com/terms
and incorporate the Creative Commons Attribution
- Non Commercial (unported, 3.0) License.
By accessing the work you hereby accept the Terms. Non-commercial uses of the work are permitted
without any further permission from Dove Medical Press Limited, provided the work is properly
attributed. For permission for commercial use of this work, please see paragraphs 4.2 and 5 of our Terms.