Back to Journals » Nature and Science of Sleep » Volume 17

Validation of a Wireless, Self-Applied Device for Sleep Recording in the Paediatric Population
Authors Iadarola A ![]() , Cordani R, Veneruso M
, Cordani R, Veneruso M ![]() , Uccella S
, Uccella S ![]() , Nobili L
, Nobili L
Received 26 July 2025
Accepted for publication 25 October 2025
Published 3 November 2025 Volume 2025:17 Pages 2863—2873
DOI https://doi.org/10.2147/NSS.S554608
Checked for plagiarism Yes
Review by Single anonymous peer review
Peer reviewer comments 2
Editor who approved publication: Prof. Dr. Ahmed BaHammam
Antonella Iadarola,1 Ramona Cordani,1,2 Marco Veneruso,1,2 Sara Uccella,1,2 Lino Nobili1,2
1Department of Neurosciences, Rehabilitation, Ophthalmology, Genetics, Maternal and Child Health (DINOGMI), University of Genoa, Genoa, Italy; 2Child Neuropsychiatry Unit, IRCCS Istituto Giannina Gaslini, Genoa, Italy
Correspondence: Marco Veneruso, Department of Neurosciences, Rehabilitation, Ophthalmology, Genetics, Maternal and Child Health (DINOGMI), University of Genoa, Largo Paolo Daneo 3, Genoa, 16132, Italy, Email [email protected]
Purpose: Although polysomnography (PSG) is the gold standard for sleep evaluation, its use in children and adolescents is limited by poor compliance and the time-consuming setup required. For the first time in a paediatric population, this study tested the Sleep Profiler (SP), a self-applied ambulatory PSG device previously validated in adults.
Patients and Methods: Simultaneous standard PSG and SP recordings were acquired from hospitalized patients (n=14), aged 11 to 15 years, and independently scored by two certified sleep medicine experts, blinded to patient identity. Epoch-by-epoch agreement between manually scored PSG, manually scored SP and automatically scored SP records was assessed using confusion matrices and Cohen’s kappa coefficient (κ), with PSG as the reference. Sleep macrostructure measures were compared using Bland–Altman analysis.
Results: Manual scoring of SP data (SP1) showed substantial agreement with standard PSG across all stages, particularly for REM (κ=0.83), wake (κ=0.83), and N3 (κ=0.82). By contrast, automatic scoring algorithms (AA1 and AA2) provided by the device performed markedly worse (κ always below 0.70). SP1 resulted particularly strong in stage discrimination (specificity over 96% for wake, N1, N3, REM, and 88% in N2), with a sensitivity above 84% in all stages, except N1, which was lower at 55%. Moreover, Bland–Altman plots showed minimal bias and good agreement for sleep macrostructure parameters. These findings were further supported by a robust interrater reliability between scorers (κ=0.82).
Conclusion: The SP represents a reliable tool for sleep monitoring even in contexts where low compliance and time-consuming setups may compromise the quality or feasibility of standard recordings, such as in paediatric populations. While automatic scoring requires further refinement, and relatively small sample size should be considered when interpreting the generalizability of the findings, its robust detection especially of REM and N3 sleep make it suitable for both clinical and research applications.
Keywords: wearable device, low-channel EEG, polysomnography, paediatric patients, automatic scoring
Introduction
Polysomnography (PSG) is the gold standard for assessing sleep continuity, architecture, and a wide range of sleep disorders. PSG setups can vary from comprehensive montages with 21 electroencephalography (EEG) electrodes for specific differential diagnoses (eg, epilepsy vs NREM parasomnias)1 to simplified configurations for routine sleep studies. According to the American Academy of Sleep Medicine (AASM) scoring manual,2 standard PSG for sleep staging requires the recording of EEG, electrooculography (EOG) to detect eye movements, and electromyography (EMG) to assess muscle tone. These signals are essential for identifying sleep stages, including REM and NREM sub-stages.
In recent decades, efforts have focused on simplifying PSG recordings. These advancements include enabling home-based exams3,4 and reducing the number of electrodes required.5,6 The development of portable sleep monitoring systems has made it possible to perform PSG recordings outside of sleep laboratories, without the continuous presence of technical and medical staff, thereby significantly reducing procedure-related costs. Moreover, the development of more sophisticated analysis software and increasingly efforts in biotechnology research has led to the possibility to collect neurophysiological data using devices with a lowered number of electrodes,7–9 mostly self-appliable, giving the possibility to collect reliable data via less time-consuming procedures, in which even the presence of professional technicians is not necessarily required. This approach is particularly valuable in populations with limited compliance, such as the elderly, children, and patients with psychiatric or neurodevelopmental disorders.10,11
Sleep in paediatric patients with psychiatric or neurodevelopmental disorders is often characterized by increased fragmentation, altered REM patterns, and reduced sleep efficiency compared to healthy peers.12–14 These features, together with reduced compliance to conventional PSG setups, highlight the need for simplified, self-applied EEG systems that can reliably assess sleep architecture in this population.
In this study, we evaluated the reliability of a single-channel, self-applied EEG system Sleep Profiler™ (SP) for sleep staging in children and adolescents with psychiatric conditions, a population often characterized by limited compliance with conventional polysomnography. While the system has been previously validated in adults,15,16 to our knowledge no previous studies had addressed this before the present work in younger individuals. Our aims were to evaluate sleep macrostructure, determine epoch-by-epoch concordance with PSG, and assess inter-scorer reliability.
Materials and Methods
Subjects were recruited as part of a larger project concerning sleep disorders in patients hospitalised for an acute psychiatric condition in the Child Neuropsychiatry Unit of the Istituto Giannina Gaslini in Genoa, Italy. The study was approved by the regional ethics committee (542/2022 - DB id 12712) and conducted in accordance with the Declaration of Helsinki. Patients and their parents signed informed consent prior to the beginning of study.
Inclusion criteria were age between 11 and 16 years and admission to the neuropsychiatric unit for acute psychiatric symptoms, whereas exclusion criteria were the presence of factors limiting compliance (such as marked aggression or psychomotor agitation) or refusal to participate in the study. Subjects underwent an overnight sleep study with simultaneous recordings from a full PSG and the SP. The data were synchronized on an epoch-by-epoch basis and scored according to the AASM guidelines2 by a certified sleep technician (AI), who was blinded to patient identity. This scorer manually evaluated both the PSG and the SP recordings; the SP scoring from this rater is referred to as SP1 and was used for direct comparison with PSG. Agreement between the PSG and the SP scoring was assessed both at the epoch-by-epoch level and for aggregated sleep measures, with PSG serving as the reference standard. A certified sleep physician (MV) independently scored the SP recordings to assess inter-scorer reliability; this rater’s scoring is referred to as SP2.
Data Acquisition
Polysomnography
PSG was applied according to AASM guidelines,2 using Nox A1 PSG System (Nox Medical USA). Cup electrodes were placed following the 10–20 International System over the frontal (F3, F4), central (C3, C4) and occipital (O1, O2) areas, each one referenced to contralateral mastoids (M1, M2). Additional channels included ECG, EOG (E1, E2 both referred to M2), submental EMG, bilateral anterior tibialis EMG, nasal air pressure, pulse oximetry, and thoraco-abdominal plethysmography belts. Signals were sampled at 256 Hz and analogically filtered according to standard clinical settings (EEG and EOG 0.3–35 Hz; ECG 0.3–70 HZ; EMG 10–70 Hz; airflow, thoracal, and abdominal channels 0.1–15 Hz). Impedances were maintained below 5kΩ.
Sleep Profiler
Sleep Profiler™ X8 EEG Sleep Monitor (Advanced Brain Monitoring Inc., USA) was used for simultaneous reduced-channel recordings. The device is lightweight (71 g), small (7 cm × 4.5 cm × 1.75cm) and it is designed to be easily affixed to the forehead by the patient in few minutes, giving the possibility to manually start the acquisition. It includes three frontal EEG and two EMG/ECG self-adhesive electrodes, a pulse rate sensor, an acoustic microphone, and a triaxial accelerometer to detect head movements and position. The system records continuously for up to 24 hours with an internally rechargeable battery, and stores data on a memory card. For this study, one differential EEG (AF7–AF8) and two derived EOG channels (referenced to Fpz) were analysed. The EMG/ECG 2-pin connector was used to record submental EMG activity. Signals sampling rate was 256 Hz (0.1–67 Hz bandpass filter). The device automatically checked electrode contact quality and impedance through an interactive voice prompt at setup. The SP was positioned on the forehead, aligning the central electrode with the nasion above the top of the eyebrows; the relative strip was used to affix the device in compliance with subject head dimensions.
Due to space limitations in chin area, we chose to obtain just one EMG channel from PSG to allow simultaneous chin recording from both PSG and SP. In fact, although standard procedures recommend two bipolar chin derivations, one of the inferior PSG electrodes is normally considered as a backup.2
Data Management and Preprocessing
To ensure temporal alignment between recordings, the “start time/end time” of SP and PSG were synchronized accordingly to the “light off/light on” times reported on subjects’ sleep diary, allowing analyses to be performed on the same time window. All recordings were de-identified before analysis in a blinded manner, and a file containing subjects’ information was stored on a separate server. To minimize scorer bias, both raters completed all analyses after recruitment ended, randomly selecting whether to begin with PSG or SP recordings.
Data Analysis
Each SP recording was first processed by the automatic staging algorithm and subsequently edited by the two scorers using the proprietary software interface.
The automatic algorithm (AA1) spectrally decomposed the EEG signal, computed descriptors of sleep macro- and microstructure, and assigned each 30-s epoch to one of four sleep stages or wake. When spectral characteristics overlapped across stages, a secondary label was added as alternative stage (AA2). To evaluate algorithm reliability the consistency of both the primary and the secondary automatic staging was considered.
SP manual scoring of the same recording was compared between scorers on an epoch-by-epoch basis per subject. Epochs in which it was challenging to assign a defined stage due to poor electrode adhesion, and with more than 50% signal loss, were marked as invalid (“INV”) and excluded from all comparisons.16,17 Epochs of major body movement preceded or followed by an unequivocal wake stage were classified as wake rather than discarded.2 When one epoch was assigned as invalid by the primary or the secondary scorer, it was deleted conjointly from all records considered for the comparison, to maintain the same number of epochs analysed. By contrast, epochs considered as invalid by the algorithms were counted in the statistical analysis to assess how well the algorithm tolerated challenging or noisy signals, compared to expert scorers. Recordings with more than 20% invalid epochs were excluded from the overall analysis.
To evaluate automatic and manual SP scoring relative to PSG, epoch-by-epoch agreement was quantified using confusion matrices and Cohen’s kappa coefficient (κ), with PSG as the reference. Sensitivity, specificity, and accuracy were computed for each sleep stage. Bland–Altman analyses assessed the agreement between SP manual scoring and PSG for key sleep measures, including total sleep time (TST), sleep onset latency (SOL), sleep efficiency (SE), wake after sleep onset (WASO), sleep stage durations, and REM sleep latency.
Statistical analyses were performed in R (version 4.5.0). Categorical variables were expressed as absolute number and percentage, whereas continuous variables were expressed as mean and standard deviation.
Results
Seventeen subjects were recruited. Subsequently, 3 recordings were excluded from the analysis due to a percentage of invalid epochs greater than 20%. The final sample included 14 patients aged 11–15 years (mean age 13.4, SD 0.9), comprising 8 females and 6 males. The primary set of comparison was PSG vs SP1, where PSG record served as standard reference. Maintaining the PSG as a reference, a second comparison was performed between the PSG and the automatic SP scoring algorithms, both primary (AA1) and secondary (AA2). The last comparison was intended to evaluate interrater reliability considering SP1 vs SP2. The first macrostructural analysis was performed on a total of 15197 epochs, from which 1.8% were manually discarded due to poor signal quality.
The performance of the three methods SP1, AA1, and AA2 in classifying sleep stages has been first evaluated using confusion matrices (Figure 1). Each matrix compares the predicted sleep stages with the reference scoring obtained from PSG. The evaluated stages include wake, N1, N2, N3, and REM sleep. Values along the diagonal represent correctly classified epochs, while off-diagonal values indicate misclassifications. SP1 (Figure 1a) demonstrated the best overall performance, compared with the automatic algorithms provided by the device producers. SP1 correctly classified 80% of wake epochs, 84% of N2, 86% of N3, 90% of REM, and 50% of N1 epochs, using PSG as the reference. The primary automatic algorithm AA1 (Figure 1b) showed high classification concordance for wake (84%) and N3 stages (92%). However, it tended to misclassify a substantial portion of N1 epochs, with only 16% correctly identified as N1. Instead, 35% of N1 epochs were incorrectly classified as wake, and 27% as REM. Similarly, the N2 stage was correctly identified 40% of the time, with 44% being misclassified as N3. REM sleep was detected with 75% accuracy. The secondary automatic algorithm AA2 (Figure 1c) displayed similar trends, with comparable concordance for wake (84%) and N3 (92%) stages. The classification of N1 epochs slightly worsened to 15%, with a significant proportion (30%) still misclassified as REM. N2 classification remained consistent at 44%, with 41% being confused with N3. REM detection decreased marginally to 72%.
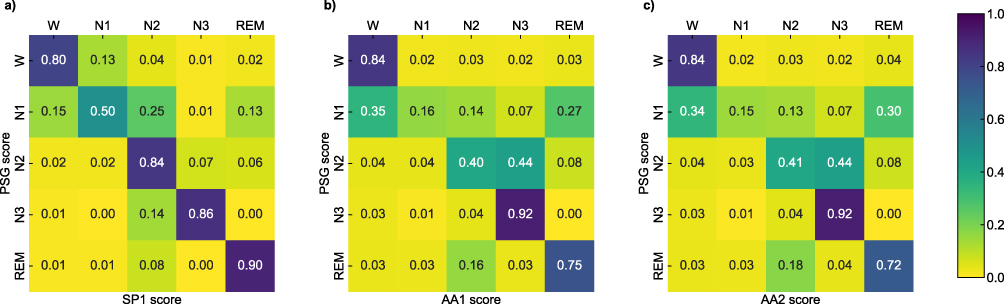 |
Figure 1 Confusion matrices illustrating the classification performance of (a) SP1 manual scoring, (b) AA1, and (c) AA2 in identifying different sleep stages (N1, N2, N3, and REM) and wake. All values are expressed as proportions (0–1), where 1 equals 100%. Rows represent the actual sleep stages scored by polysomnography (PSG), while the columns show the predicted stages by each algorithm. Higher values along the diagonal indicate the agreement between the predicted and actual stages, reflecting accurate classification. Off-diagonal values represent misclassifications. Color intensity corresponds to the number of samples classified in each category. Manual scoring with the SP showed strong agreement with PSG across all sleep stages, while automatic algorithms achieved high accuracy for N3 but markedly lower performance in distinguishing N1, N2, and REM stages. Abbreviations: N1, non-REM 1 sleep; N2, non-REM 2 sleep; N3, non-REM 3 sleep; W, wake; REM, REM sleep; SP1, Sleep Profiler manual scoring performed by scorer 1; AA1, Primary Automatic Algorithm; AA2, Secondary Automatic Algorithm; PSG, Polysomnography manual scoring performed by scorer 1. |
Accuracy, specificity, sensitivity and Cohen’s kappa coefficient as indicators of agreement and reliability across each stage are presented for the three sets of comparison in Table 1 and plotted in Figure 2. The manual scoring analysis showed consistent accuracy across all phases (Figure 2a), with comparable values of AA1 and AA2 if wake, N1 and REM stages are considered. A relative decrease in N2 and N3 resulted from both approaches, markedly more pronounced with the automated scoring (~72% in N2 and ~79% in N3).
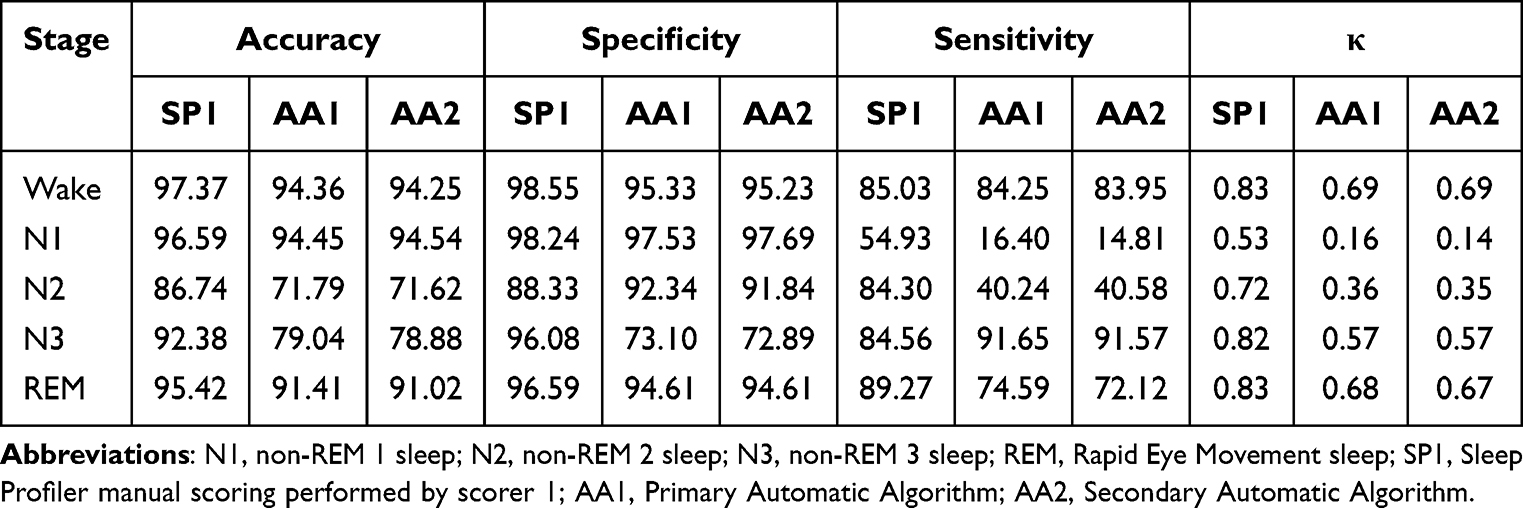 |
Table 1 Accuracy, Specificity, Sensibility, and Cohen’s Kappa Coefficient Numerical Detail of Comparison Between SP1, AA1, and AA2 Across All Stages |
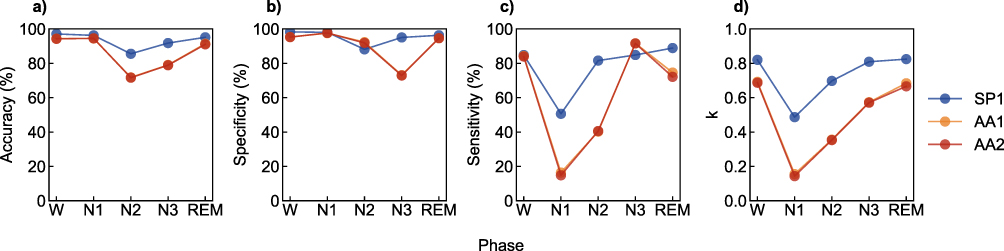 |
Figure 2 Comparison of performance metrics (a) accuracy, (b) specificity, (c) sensitivity, and (d) Cohen’s kappa coefficient across sleep phases (W, N1, N2, N3, REM) for the three methods: SP1 (blue series), AA1 (Orange series) and AA2 (red series). Accuracy, specificity, and sensitivity are expressed as percentages, while Cohen’s kappa (κ) is reported as a proportion (0–1). SP1 shows consistently higher agreement and performance across all phases, particularly in stages W and REM. Both AA1 and AA2 demonstrate lower sensitivity and agreement, notably in the N1 phase. Abbreviations: N1, non-REM 1 sleep; N2, non-REM 2 sleep; N3, non-REM 3 sleep; W, wake; REM, REM sleep; SP1, Sleep Profiler manual scoring performed by scorer 1; AA1, Primary Automatic Algorithm; AA2, Secondary Automatic Algorithm; κ, Cohen’s kappa coefficient. |
Specificity for SP1 remained above 88% in all phases (Figure 2b). Sensitivity varied between phases, reaching its lowest value (55%) in N1 but remaining above 84% in the other stages (Figure 2c). SP1 was particularly strong in correctly identify wake (κ=0.83), N3 (κ=0.82) and REM (κ=0.83) stages (Figure 2d). In contrast, AA1 and AA2 showed lower performance, particularly in N1, where sensitivity dropped to approximately 15%, probably due to small N1 representation in the dataset. Moreover, one of the intrinsic characteristics of the algorithm was to set sleep onset only after the occurrence of four consecutive non-wake epochs, meaning additional limitation in the identification of N1 epochs. Indeed, although AA1 and AA2 maintained moderate accuracy and specificity in other phases, its Cohen’s kappa values (κ) ranged from ~0.2 in N1 to ~0.69 in REM and wake stages, indicating low to moderate agreement. Overall, SP1 achieved the highest levels of concordance and performance metrics, as reflected by Cohen’s kappa values consistently above 0.6, suggesting substantial agreement.
The manual analysis of SP records resulted stably reproducible even between the primary (SP1) and secondary (SP2) scorer, with a concordance of 88.30% and κ coefficient 0.82 (data not shown), demonstrating strong interrater reliability.
Data of sleep measures and sleep stage durations are reported as a comparison between PSG and SP1 in Table 2 and graphically represented with Bland–Altman plots, Figure 3. In the case of SE, TST, WASO, and N2 sleep duration (respectively Figure 3i, f, h, and b), data were homoscedastic and LOAs (Limits of Agreement, grey solid lines) were represented as parallel to the bias line (red solid line). The mean difference (bias) between the two methods was zero, indicating no systematic over- or under-estimation at the group level. SOL and REM sleep duration (Figure 3g and d) appeared to be slightly overestimated by the device (ie, bias was positive), despite confidence intervals (red dotted lines) still around zero. On the contrary, N3 sleep duration (Figure 3c) was underestimated by the device, even if for negligible values. In both N1 and N3 sleep duration (Figure 3a and c) heteroscedasticity was observed, with higher random error (ie, proportional LOAs) for higher PSG-derived measures, meaning that difference between the two methods increased proportionally to longer durations of the two stages. Figure 3e finally shows that SP1 slightly underestimated REM latency (mean bias was approximately −5 minutes); most values fell within the 95% LOAs, suggesting good agreement between devices, though a few outliers indicated increased variability for subjects with longer REM latencies. Statistical reporting for Bland–Altman plots is described in detail in Table 2.
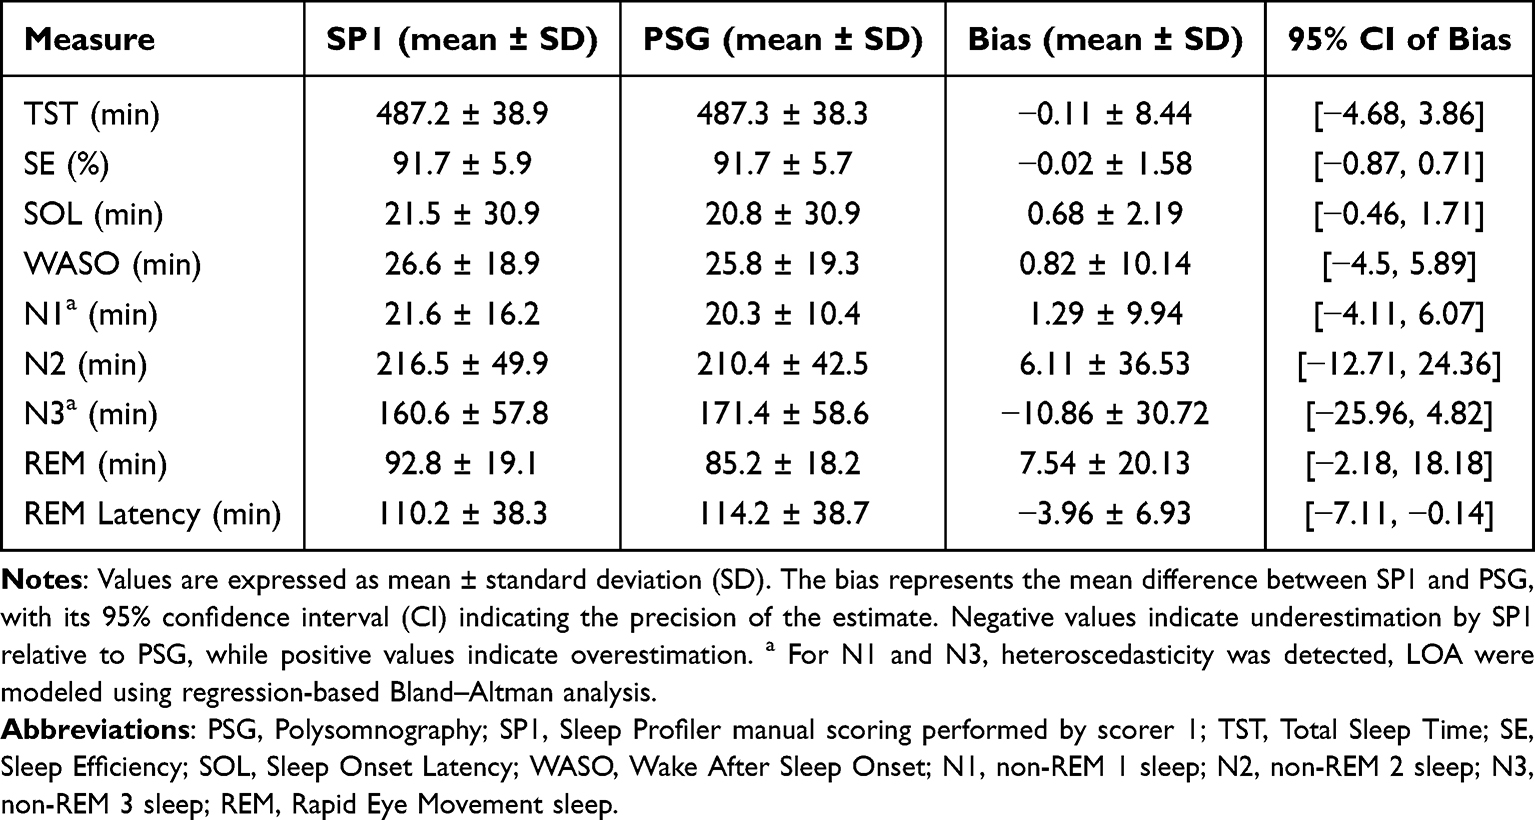 |
Table 2 Comparison of Sleep Macrostructure Parameters Between PSG and SP1 Using Bland–Altman Analysis |
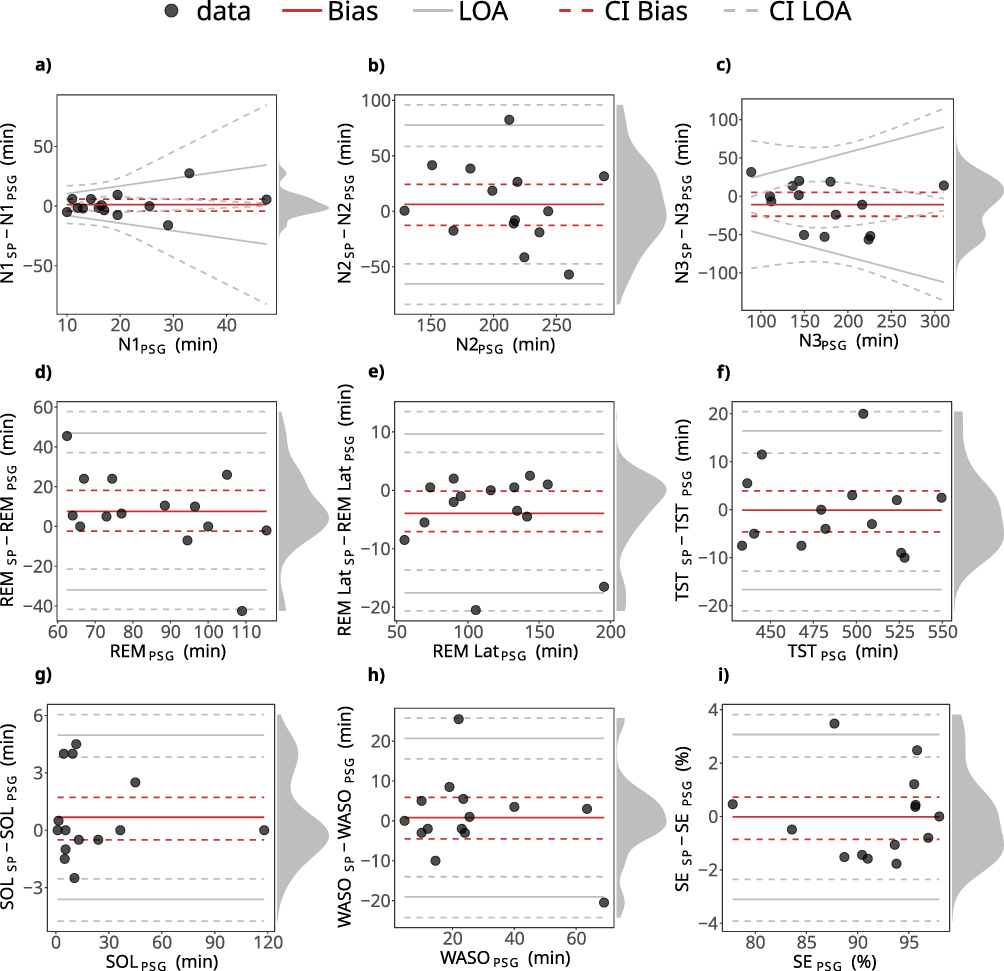 |
Figure 3 Bland–Altman plots graphical representation of (a) non-REM 1, (b) non-REM 2, (c) non-REM 3 and (d) REM sleep durations, (e) REM sleep onset latency, (f) Total Sleep Time, (g) Sleep Onset Latency, (h) Wake After Sleep Onset, (i) Sleep Efficiency. All data are expressed in minutes, except for SE which is a percentage. Differences between PSG and SP1 measures are plotted against the reference-derived (PSG) measures, considered as the size of measurement (SM). Red solid lines indicate bias, whereas grey solid lines indicate the 95% LOAs (Limits of Agreement, computed as bias ± 1.96 SD) of the differences, both with their 95% CIs (Confidence Intervals) dotted lines. Black dots indicate individual data points, and the density diagram on the right side of each plot illustrates the distribution of the differences. Plots are adjusted for the specific case of compliance with the assumptions for discrepancy analysis: constant bias over SM and homoscedasticity for all data except for N1 and N3 sleep duration (minutes), constant bias but heteroscedastic differences (N1 and N3 duration). |
The hypnograms obtained from SP1 and PSG are graphically represented in Figure 4.
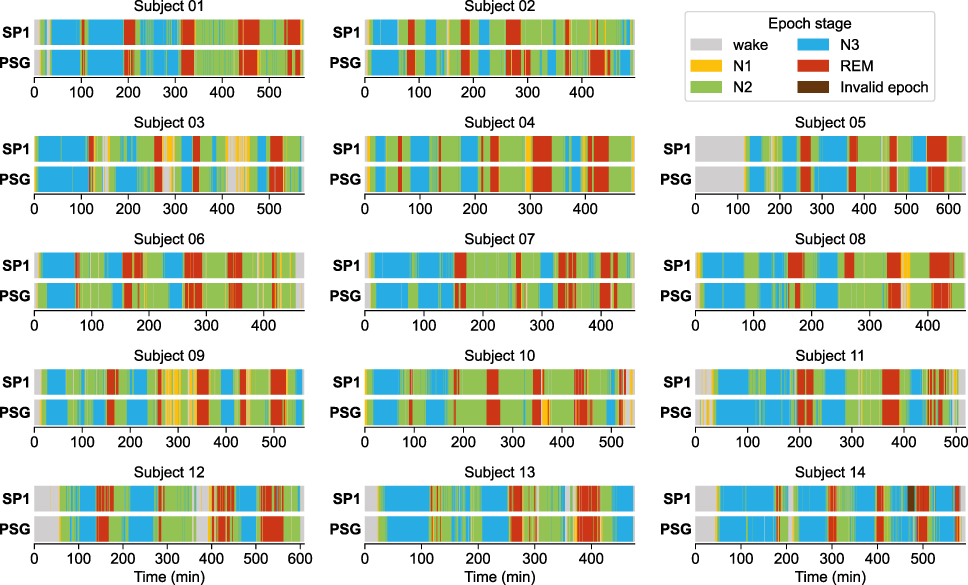 |
Figure 4 Subject by subject sleep architecture obtained from PSG recording and SP1. Sleep stages are colour coded for visual comparison across modalities and displayed as a function of the acquisition time. Time zero corresponds to the start of the recording. Phase transitions between sleep stages were highly consistent between PSG and SP1, indicating that manual scoring accurately captured overall sleep macrostructure. Abbreviations: SP1, Sleep Profiler manual scoring performed by scorer 1; PSG, Polysomnography manual scoring performed by scorer 1. |
Discussion
In this study, we demonstrated that the SP, a self-applied, reduced-channel PSG device, can reliably estimate sleep stages in children and adolescents when scored manually. Manual scoring (SP1) showed strong agreement with standard PSG, especially for REM and N3 sleep, while automatic scoring algorithms underperformed, particularly in classifying N1 and N2. Few wearable, low-channel EEG devices have been considered for overnight studies in children,9,18,19 despite their potential usefulness in populations typically showing low compliance with standard PSG montages.20,21
We compared both the autoscored (AA1 and AA2) and the manually scored (SP1) data to PSG acquired in the same participants on the same nights. As immediately appreciable from the confusion matrices and the Cohen’s kappa coefficient (κ), SP1 performance appeared to be constantly preferable compared to software automatic staging. SP1 was particularly strong in correctly identify REM stage (90% classification rate, κ=0.83), thanks to the additional use of the submental EMG activity channel, considered extremely reliable in detecting EMG activity even in more specific studies on this topic.22 With respect to REM sleep scoring, AA1 and AA2 showed a lower performance, respectively, 75% (κ=0.68) and 72% (κ=0.66), probably due to the SP automatic staging principally based on the power spectrum of each stage’s frequency band.
Regarding stage N1, manual scoring showed a κ value of 0.53, while both automatic scoring methods obtained κ values below 0.2, indicating poor performance. This result should be interpreted with caution, as the small sample size and the low number of N1 epochs may have contributed to statistical instability. Moreover, N1 staging is inherently prone to variability, since the transitions between wakefulness and N1 and between N1 and N2 involve rapid EEG changes that make classification more susceptible to subjective interpretation. Therefore, the lower κ values observed for N1 are likely related to these physiological and methodological factors rather than to device performance.
By contrast, AA1 and AA2 showed higher accuracy than SP1 in identifying N3 sleep (92% vs 86%). However, their ability to correctly classify N2 was lower, with 44% of epochs labelled as N3 by the algorithms actually scored as N2 in the PSG. In an overall evaluation, it is preferable to achieve consistently high accuracy across all sleep stages, as observed with SP1 (N2=86.7%, N3=92.4%), rather than unbalanced performance across stages, as exhibited by the algorithm. These confounding outcomes have been previously reported in literature, as a major cause of high interrater disagreement.23 The lower accuracy in N3 classification may partly reflect developmental aspects of sleep EEG, as during childhood and adolescence slow waves activity is not yet fully frontalized and tends to be more prominent over central regions.24 As the SP records from frontal derivations only, this may have led to an underestimation of N3 epochs compared to PSG. In addition, a visual context effect may influence scoring: when reviewing full-montage PSG, scorers are more likely to interpret synchronous slow waves across multiple channels as N3, while in a single-channel or limited-channel system, such waves may appear less prominent or convincing. This perceptual bias may further decrease the likelihood of N3 identification in reduced-channel devices.25,26 In order to bypass this latest possible limit to application, tools that objectively quantify slow wave activity across the night, such as power spectrum and spectral slope analyses,27 could be used.
Considering the Bland–Altman analysis, the average bias in the estimation of the various stages of sleep remains in the order of a few minutes, which does not represent an obstacle in the clinical context. Overall, our findings indicate that manual scoring remains preferable when accurate sleep staging is required, even when using simplified or wearable EEG systems.
The agreement of SP1 about wake was higher compared to previous studies,15 showing good reliability in both sustained (SP1 accuracy 97.4%, κ=0.83) and short period of wake after sleep onset (WASO). Bland–Altman plot referred to sleep onset latency (SOL) showed bias close to zero suggesting minimal systematic error between methods and most data points within the 95% limits of agreement, indicating good agreement even at individual level.28 Comparing all methods is noteworthy that wake specificity was generally higher than sensitivity: this result could be explained by a common bias,29 that occurs even during complete PSG scoring, caused by a physiological overlap during drowsiness of elements belonging both to wake state and N1 sleep, as slow eyes movements, or due to a similarity of the wake alpha to theta in stage N1. Moreover, alpha rhythm, which is better represented over occipital areas, is unlikely to be recorded from SP, which records only from frontal derivations. Despite these mixed findings, minutes of TST and WASO, which are reliant upon the differentiation of wake from sleep, were not significantly different between PSG and SP1.
REM sleep onset latency resulted slightly underestimated by SP1, with mild differences on individual-level-based evaluation, but with a substantial agreement if a group-level estimation was considered. This could represent a limit, and therefore should be used with the due caution, of the device applications relative to specific clinical assessments in which a precise information about the time of REM sleep onset is needed, as in case of narcolepsy.30 On the contrary, data obtained from the EMG activity channel applied over the mylohyoid muscle were considered extremely reliable, which could represent a strong tool for further analysis about muscle atonia index appliable in this pathology.31
Recordings with more than 20% epochs of low signal quality, because of great movements artifacts or decreased adherence of the electrodes to skin surface, were excluded from the overall analysis (n=3): this threshold was considered a good compromise between the need to preserve sample size and statistical power of the analysis, and the need to ensure data quality, avoiding bias from recordings with extensive signal loss.32 This element highlighted a weak adherence capacity of the device during challenging recording conditions. A noteworthy element was that in following recordings executed with the same device without a simultaneous PSG montage, the successful recoding rate increased from 82.3% to 96.4% (data not shown), supporting the hypothesis that the montage necessary for the validation contributed to lower quality signals, probably due to the unwieldy components.
Another limit was that SP revealed to be quite poor in differentiating N1 from N2, with better performances if the analysis was manual (Coehn’s κ for N1 0.53 and for N2 0.72), extremely bad if relying on automatic staging (κ N1~0.15 and κ N2~0.35). Concerning the automatic scoring rules, it is possible that the algorithm overestimated the quantity of N1 stages assigning it necessarily after a wake period interfering with REM sleep, instead of judging that epoch as what it really was. Moreover, a noteworthy element is that the number of N1 epochs is low in the paediatric population, in comparison to adult macrostructure, being sleep more stable and sleep onset generally faster: the scarcity of N1 epochs in this sample likely led to a downward bias of the κ estimate and sensitivity measure.
As visually displayed on hypnograms, phase shifts (intended as the transition from one sleep stage to another, to a sleep stage to wake state and vice versa) resulted superimposable between PSG and SP1, meaning that, beside the comparable proportion of stages, also the overall macrostructure of sleep was well represented following a manual analysis. This aspect, together with a reliable TST evaluation, suggests the reliability of the device even in quantitative sleep disturbances description, such as hypersomnia, insomnia and misperception sleep disorder, conjointly with the use of the actigraphy monitoring.33
We finally proved substantial interrater reliability of the manually scored records (SP1 vs SP2), ensuring the validity of the primary scorer’s staging assessment.
Furthermore, given the technical characteristics of the SP, its convenience in terms of costs of material employed and time consumption (considering preparation of the equipment, patient hook-up, montage, and scoring) is remarkable compared to a standard PSG, even considering a minimum montage procedure.34
Based on these considerations, within the reduce size of the sample studied, we concluded that the SP represents a valid alternative to PSG for sleep evaluation, although more efforts would be made to enlarge data to a broader and younger participant sample, and to a higher number of epochs relative to sleep stages less represented in this dataset, such as N1.
Future studies should assess the device’s reliability across multiple consecutive nights to evaluate its performance in extended home-monitoring conditions. Moreover, a drastic improvement in the automatic scoring procedure could be achieved by introducing modern pattern-matching algorithms, including AI-based algorithms that could be trained on paediatric data.
Conclusions
We demonstrated the capability of the SP, an easily self-appliable low-cannel PSG device, to reliably estimate sleep architecture if compared with a standard complete PSG acquisition. While manual scoring makes it reliably applicable in the paediatric population, the device’s integrated automatic algorithm requires further improvements. Moreover, considering the affordability of the SP in terms of costs and time consumption, and the possibility given by the device to obtain consecutive nights of sleep data in home environment, numerous perspectives could be opened for research designs, such as longitudinal home monitoring or screening in neurodevelopmental disorders, especially considering poorly compliant patients, as in case of a paediatric or psychiatric population, otherwise reluctant to a complete, awkward, PSG monitoring.
Although the autoscoring algorithm could be considered sufficient to a rough evaluation, having an overall acceptable specificity for all stages except N3, but high sensibility for it, we proved that manual editing was far more effective in terms of agreement across stages, particularly regarding REM and N3 sleep inspection.
Small sample size, a reduced amount of N1 epochs and signal quality issues represent considerable limits to generalization of this study and require a balanced interpretation of the results, considering the purpose of its clinical application case by case.
Given these results, further efforts would be made in extending the application of this device in younger cohorts of subjects, for instance neonates and infants. In this latest group, in whom the use of a large amount of electrodes for EEG monitoring could impact negatively due to excessive manipulation, the SP, possibly adapted to fit smaller head dimensions, would represent a precious tool for long-term monitoring. Moreover, given this case, active and quiet sleep could be detected based on not only visual inspection, but also on EEG quantitative and spectral power analysis.
Abbreviations
PSG, Polysomnography; SP, Sleep Profiler; EEG, electroencephalography; EOG, electrooculography; EMG, electromyography; ECG, electrocardiography; AASM, American Academy of Sleep Medicine; SP1, Sleep Profiler manual scoring performed by scorer 1; SP2, Sleep Profiler manual scoring performed by scorer 2; AA1, Primary Automatic Algorithm; AA2, Secondary Automatic Algorithm; κ, Cohen’s kappa coefficient; TST, Total Sleep Time; SOL, Sleep Onset Latency; SE, Sleep Efficiency; WASO, Wake After Sleep Onset; REM, Rapid Eye Movement sleep; N1, non-REM 1 sleep; N2, non-REM 2 sleep; N3, non-REM 3 sleep; W, wake; LOAs, Limits of Agreement; SM, Size of Measurement; Cis, Confidence Intervals.
Data Sharing Statement
The data that support the findings of this study are available on request from the corresponding author, MV. The data are not publicly available due to their containing information that could compromise the privacy of research participants.
Author Contributions
AI: conceptualization, investigation, writing – original draft, methodology, data curation, formal analysis; MV: conceptualization, methodology, formal analysis, writing – review and editing; RC: conceptualization, methodology, supervision, writing – review and editing; SU: methodology, supervision, writing – review and editing; LN: conceptualization, methodology, supervision, writing – review and editing. All authors gave final approval of the version to be published; have agreed on the journal to which the article has been submitted; and agree to be accountable for all aspects of the work.
Funding
This work was supported by the Italian Ministry of Health, 5 × 1000 project 2017 “SOLAR: Sleep disorders in children: an innovative clinical research perspective”. Sara Uccella and Lino Nobili are supported by the MNESYS project (PE0000006), funded by the Ministry of University and Research (MUR) under the National Recovery and Resilience Plan (NRRP), #NextGenerationEU.
Disclosure
The authors report no conflict of interest in this work. A preliminary version of this work was presented as an abstract at the 27th Congress of the European Sleep Research Society (https://onlinelibrary.wiley.com/toc/13652869/2024/33/S1).
References
1. Zucconi M, Ferini-Strambi L. NREM parasomnias: arousal disorders and differentiation from nocturnal frontal lobe epilepsy. Clin Neurophysiol. 2000;111:S129–S135. doi:10.1016/S1388-2457(00)00413-2
2. Berry RB, Quan SF, Abreu AR; for the American Academy of Sleep Medicine, et al. The AASM Manual for the Scoring of Sleep and Associated Events: Rules, Terminology and Technical Specifications. Version 2.6. Darien, IL: American Academy of Sleep Medicine;2020.
3. Kawai K, Iwamoto K, Miyata S, et al. Comparison of polysomnography, single-channel electroencephalogram, fitbit, and sleep logs in patients with psychiatric disorders: cross-sectional study. J Med Internet Res. 2023. doi:10.2196/51336
4. Kataoka H, Takatani T, Sugie K. Two-channel portable biopotential recording system can detect REM sleep behavioral disorder: validation study with a comparison of polysomnography. Parkinsons Dis. 2022. doi:10.1155/2022/1888682
5. Anderer P, Gruber G, Parapatics S, et al. An E-Health solution for automatic sleep classification according to Rechtschaffen and Kales: validation study of the somnolyzer 24 x 7 utilizing the siesta database. Neuropsychobiology. 2005;51:115–133. doi:10.1159/000085205
6. Levendowski DJ, Ferini-Strambi L, Gamaldo C, et al. The accuracy, night-to-night variability, and stability of frontopolar sleep electroencephalography biomarkers. J Clin Sleep Med. 2017;13:791–803. doi:10.5664/jcsm.6618
7. Alattar M, Govind A, Mainali S. Artificial intelligence models for the automation of standard diagnostics in sleep medicine—a systematic review. Bioengineering. 2024;11(3):206. doi:10.3390/bioengineering11030206
8. Stepnowsky C, Levendowski D, Popovic D, Ayappa I, Rapoport DM. Scoring accuracy of automated sleep staging from a bipolar electroocular recording compared to manual scoring by multiple raters. Sleep Med. 2013;14(11):1199–1207. doi:10.1016/j.sleep.2013.04.022
9. Sigurdardottir S, Pitkänen H, Korkalainen H, et al. Validation of manually scored multichannel frontal electroencephalography against polysomnography in a paediatric cohort. J Sleep Res. 2025;2025:1–12.
10. Lanzlinger D, Kevat A, Collaro A, Poh SH, Pérez WP, Chawla J. Tolerance of polysomnography in children with neurodevelopmental disorders compared to neurotypical peers. J Clin Sleep Med. 2023;19(9):1625–1631. doi:10.5664/jcsm.10626
11. van Twist E, Hiemstra FW, Cramer ABG, et al. An electroencephalography-based sleep index and supervised machine learning as a suitable tool for automated sleep classification in children. J Clin Sleep Med. 2024;20(3):389–397. doi:10.5664/jcsm.10880
12. Zhang Y, Ren R, Yang L, et al. Patterns of polysomnography parameters in 27 neuropsychiatric diseases: an umbrella review. Psychol Med. 2023;53(10):4675–4695. doi:10.1017/S0033291722001581
13. Baglioni C, Nanovska S, Regen W, et al. Sleep and mental disorders: a meta-analysis of polysomnographic research. Psychol Bull. 2016;142(9):969–990. doi:10.1037/bul0000053
14. Bruni O, Breda M, Mammarella V, Mogavero MP, Ferri R. Sleep and circadian disturbances in children with neurodevelopmental disorders. Nat Rev Neurol. 2025;21:103–120. doi:10.1038/s41582-024-01052-9
15. Finan PH, Richards JM, Gamaldo CE, et al. Validation of a wireless, self-application, ambulatory electroencephalographic sleep monitoring device in healthy volunteers. J Clin Sleep Med. 2016;12:1443–1451. doi:10.5664/jcsm.6262
16. Lucey BP, Mcleland JS, Toedebusch CD, et al. Comparison of a single-channel EEG sleep study to polysomnography. J Sleep Res. 2016;25:625–635. doi:10.1111/jsr.12417
17. Gunnarsdottir KM, Gamaldo C, Salas RM, et al. A novel sleep stage scoring system: combining expert-based features with the generalized linear model. J Sleep Res. 2020;29:e12991. doi:10.1111/jsr.12991
18. Kainulainen S, Korkalainen H, Sigurdardottir S, et al. Comparison of EEG signal characteristics between polysomnography and self applied somnography setup in a pediatric cohort. IEEE Access 9;2021. 110916–110926. doi:10.1109/ACCESS.2021.3099987
19. Zhu L, Wang C, He Z, Zhang Y. A lightweight automatic sleep staging method for children using single-channel EEG based on edge artificial intelligence. World Wide Web. 2022;25:1883–1903. doi:10.1007/s11280-021-00983-3
20. Lokhandwala S, Spencer RMC. Relations between sleep patterns early in life and brain development: a review. Dev Cogn Neurosci. 2022;56:101130. doi:10.1016/j.dcn.2022.101130
21. Cirelli C, Tononi G. Cortical development, EEG rhythms, and the sleep/wake cycle. Biol Psychiatry. 2015;77:1071–1078. doi:10.1016/j.biopsych.2014.12.017
22. Levendowski DJ, St Louis EK, Strambi LF, Galbiati A, Westbrook P, Berka C. Comparison of EMG power during sleep from the submental and frontalis muscles. Nat Sci Sleep. 2018;10:431–437. doi:10.2147/NSS.S189167
23. Kim Y, Kurachi M, Horita M, Matsuura K, Kamikawa Y. Agreement of visual scoring of sleep stages among many laboratories in Japan: effect of a supplementary definition of slow wave on scoring of slow wave sleep. Jpn J Psychiatry Neurol. 1993;47:91–97. doi:10.1111/j.1440-1819.1993.tb02035.x
24. Timofeev I, Schoch SF, LeBourgeois MK, Huber R, Riedner BA, Kurth S. Spatio-temporal properties of sleep slow waves and implications for development. Curr Opin Physiol. 2020;15:172–182. doi:10.1016/j.cophys.2020.01.007
25. Younes M, Younes M, Giannouli E. Accuracy of automatic polysomnography scoring using frontal electrodes. J Clin Sleep Med. 2016;12:735–746. doi:10.5664/jcsm.5808
26. Danker-Hopfe H, Anderer P, Zeitlhofer J, et al. Interrater reliability for sleep scoring according to the Rechtschaffen & Kales and the new AASM standard. J Sleep Res. 2009;18:74–84. doi:10.1111/j.1365-2869.2008.00700.x
27. Horváth GC, Szalárdy O, Ujma PP, et al. Overnight dynamics in scale-free and oscillatory spectral parameters of NREM sleep EEG. Sci Rep. 2022;12:18409. doi:10.1038/s41598-022-23033-y
28. Menghini L, Cellini N, Goldstone A, Baker FC, De Zambotti M. A standardized framework for testing the performance of sleep-Tracking technology: step-by-step guidelines and open-source code. Sleep. 2021;44:1–12. doi:10.1093/sleep/zsaa170
29. Rosenberg RS, Van Hout S. The American Academy of Sleep Medicine inter-scorer reliability program: sleep stage scoring. J Clin Sleep Med JCSM off Publ Am Acad Sleep Med. 2013;9:81–87.
30. Reiter J, Katz E, Scammell TE, Maski K. Usefulness of a nocturnal SOREMP for diagnosing narcolepsy with cataplexy in a pediatric population. Sleep. 2015;38:859–865. doi:10.5665/sleep.4728
31. Silvani A, Vandi S, Pizza F, Antelmi E, Ferri R, Plazzi G. Combining information on nocturnal rapid eye movement sleep latency and atonia to facilitate diagnosis of pediatric narcolepsy type 1. Sleep. 2021. doi:10.1093/sleep/zsaa203
32. Ghorbani S, Golkashani HA, Chee NIYN, et al. Multi-night at-home evaluation of improved sleep detection and classification with a memory-enhanced consumer sleep tracker. Nat Sci Sleep. 2022;14:645–660. doi:10.2147/NSS.S359789
33. Liguori C, Mombelli S, Fernandes M, et al. The evolving role of quantitative actigraphy in clinical sleep medicine. Sleep Med Rev. 2023;68:101762. doi:10.1016/j.smrv.2023.101762
34. Fischer J, Dogas Z, Bassetti CL, et al. Standard procedures for adults in accredited sleep medicine centres in Europe. J Sleep Res. 2012;21:357–368. doi:10.1111/j.1365-2869.2011.00987.x
 © 2025 The Author(s). This work is published and licensed by Dove Medical Press Limited. The
full terms of this license are available at https://www.dovepress.com/terms
and incorporate the Creative Commons Attribution
- Non Commercial (unported, 4.0) License.
By accessing the work you hereby accept the Terms. Non-commercial uses of the work are permitted
without any further permission from Dove Medical Press Limited, provided the work is properly
attributed. For permission for commercial use of this work, please see paragraphs 4.2 and 5 of our Terms.
© 2025 The Author(s). This work is published and licensed by Dove Medical Press Limited. The
full terms of this license are available at https://www.dovepress.com/terms
and incorporate the Creative Commons Attribution
- Non Commercial (unported, 4.0) License.
By accessing the work you hereby accept the Terms. Non-commercial uses of the work are permitted
without any further permission from Dove Medical Press Limited, provided the work is properly
attributed. For permission for commercial use of this work, please see paragraphs 4.2 and 5 of our Terms.