Back to Journals » Psychology Research and Behavior Management » Volume 14
Validation and Polish Adaptation of the Authorized Bratman Orthorexia Self-Test (ABOST): Comparison of Dichotomous and Continuous Likert-Type Response Scales
Authors Rogowska AM ![]() , Kwaśnicka A
, Kwaśnicka A ![]() , Ochnik D
, Ochnik D ![]()
Received 8 March 2021
Accepted for publication 8 May 2021
Published 29 June 2021 Volume 2021:14 Pages 921—931
DOI https://doi.org/10.2147/PRBM.S308356
Checked for plagiarism Yes
Review by Single anonymous peer review
Peer reviewer comments 2
Editor who approved publication: Dr Igor Elman
Aleksandra M Rogowska,1 Aleksandra Kwaśnicka,1 Dominika Ochnik2
1Institute of Psychology, University of Opole, Opole, Poland; 2Faculty of Medicine, University of Technology, Katowice, Poland
Correspondence: Aleksandra M Rogowska
Institute of Psychology, University of Opole, Plac Staszica 1, Opole, 45– 052, Poland
Tel +48 77 4527370
Email [email protected]
Purpose: Although research on orthorexia nervosa (ON) has developed in recent years, there exists a continuous need to develop valid tools to assess ON risk, according to strict diagnostic criteria. The present study aims to conduct Polish adaptation and validation of the Authorized Bratman Orthorexia Self-Test (ABOST), through a comparison of dichotomous and continuous Likert response scales.
Participants and Methods: This cross-sectional study involved 472 people with mean age of 27 years (ranging between 18 and 78 years, M = 26.88, SD = 10.40). The survey included demographic questions and measures of orthorexia (the ABOST and ORTO-15), eating disorders (EAT-26), body mass index (BMI), obsessive–compulsive disorder (OCI-R), anxiety (GAD-7), and depression (PHQ-9). The following statistical tests were performed to explore the psychometric properties of the ABOST: descriptive statistics, Student’s t-test, Pearson’s correlation, Cronbach’s α reliability, exploratory factor analysis (EFA), and confirmatory factor analysis (CFA).
Results: The ABOST using a five-point Likert scale for responses demonstrated good psychometric properties. The CFA goodness-of-fit indices confirmed the one-factor solution. Positive correlations were found between the ABOST and the ORTO-15, EAT-26, OCI-R, GAD-7, and PHQ-9. Women scored higher in the ABOST than men, while BMI was unrelated to the ABOST.
Conclusion: The ABOST using the Likert scale provides a reliable and valid instrument to assess ON risk, as indicated by the face, structural, and convergent validity results. However, more research in various countries is needed, in order to verify the results of this study.
Keywords: anxiety, depression, eating disorder, gender differences, obsessive-compulsive disorder, orthorexia nervosa
Introduction
In recent years, orthorexia nervosa (ON) has garnered growing interest among clinicians and researchers. Bratman1 introduced the term to describe people for whom healthy eating has become restrictive enough to lead to malnutrition and impaired daily functioning. The term “orthorexia” is derived from Greek and means “correct appetite.”2 A recent review2 has demonstrated that such terms usually define ON as an obsession (eg, persistent and disturbing thoughts about healthy eating), fixation (eg, stereotyped behavior related to an obsessive and unhealthy preoccupation or attachment), and concern/preoccupation (eg, an uneasy state of compound interest in healthy eating, uncertainty, and apprehension). According to various criteria, ON is more or less related to eating behavior, compulsivity, insight, body weight concerns and body image disturbance, medical complications, and psychosocial functioning. Some properties of ON are similar to those of other eating disorders (EDs);2 however, individuals with ON are more interested in food quality and purity, while people with anorexia and bulimia focus more on the amount of food.3,4 Research has indicated that ON is positively related to obsessive–compulsive, anxiety, and depressive symptoms.5–7 Equivocal relationships between ON, sex, and body mass index (BMI) have been found in previous studies.5,8,9
The Bratman Orthorexia Test (BOT) was developed to identify ON risk, defining it as an obsession with eating healthy foods.10 The BOT consists of 10 self-assessed questions (with dichotomous “yes” = 1 and “no” = 0 response scores), based on the professional and personal experiences of Steven Bratman as a clinician. People with four or more affirmative answers in the BOT are considered at risk for ON. The BOT has been translated and adapted in various countries, including Germany,11,12 Sweden,13,14 Greece,15,16 USA,17,18 and Poland.19,20 Cena et al2 indicated that the BOT was one of the most frequently used psychometric tools to assess ON in the last two decades.7,8,21,22 Moreover, the BOT questions and Bratman’s theory of ON have served as the basis for creating many new instruments, such as the ORTO-15,23,24 EHQ,25 BORE,26 and ONS.27
On the other hand, the conception of orthorexia has changed significantly in the recent decade. Dunn and Bratman28 developed ON criteria based on a critical review of published and unpublished case histories and discussions with eating disorder professionals from the US, Norway, Poland, Sweden, Australia, Italy, and Germany. The criteria of Dunn and Bratman28 are presented in Table 1. According to the development of ON diagnostic criteria and theory of ON,28,29 Bratman has revised the BOT and published the Authorized Bratman Orthorexia Self-Test (ABOST);30 however, to date, this tool has not yet been validated. The present study examines the psychometric properties of the ABOST, including its reliability, structural validity, and construct validity. Two versions of the response scale are compared: ABOST 1, with dichotomous yes/no answers; and ABOST 2, with a continuous five-point Likert scale. Positive relationships of the ABOST with eating disorders, disordered eating attitudes, poor physical health self-rating, obsessive–compulsive disorder, generalized anxiety disorder, and depression indicate its construct validity. The relationships of ON with gender and BMI are also explored in this study.
 |
Table 1 Diagnostic Criteria of on Developed by Dunn and Bratman28 |
Materials and Methods
Participants
The total sample consisted of 472 caucasian Polish citizens, with a mean age of 27 years (M = 26.88, SD = 10.40), including 283 women (59.96%). Most of the respondents were of normal weight and were from the countryside. Table 2 demonstrates the demographic characteristics of the study sample, such as age, height, weight, BMI, gender, and place of residence.
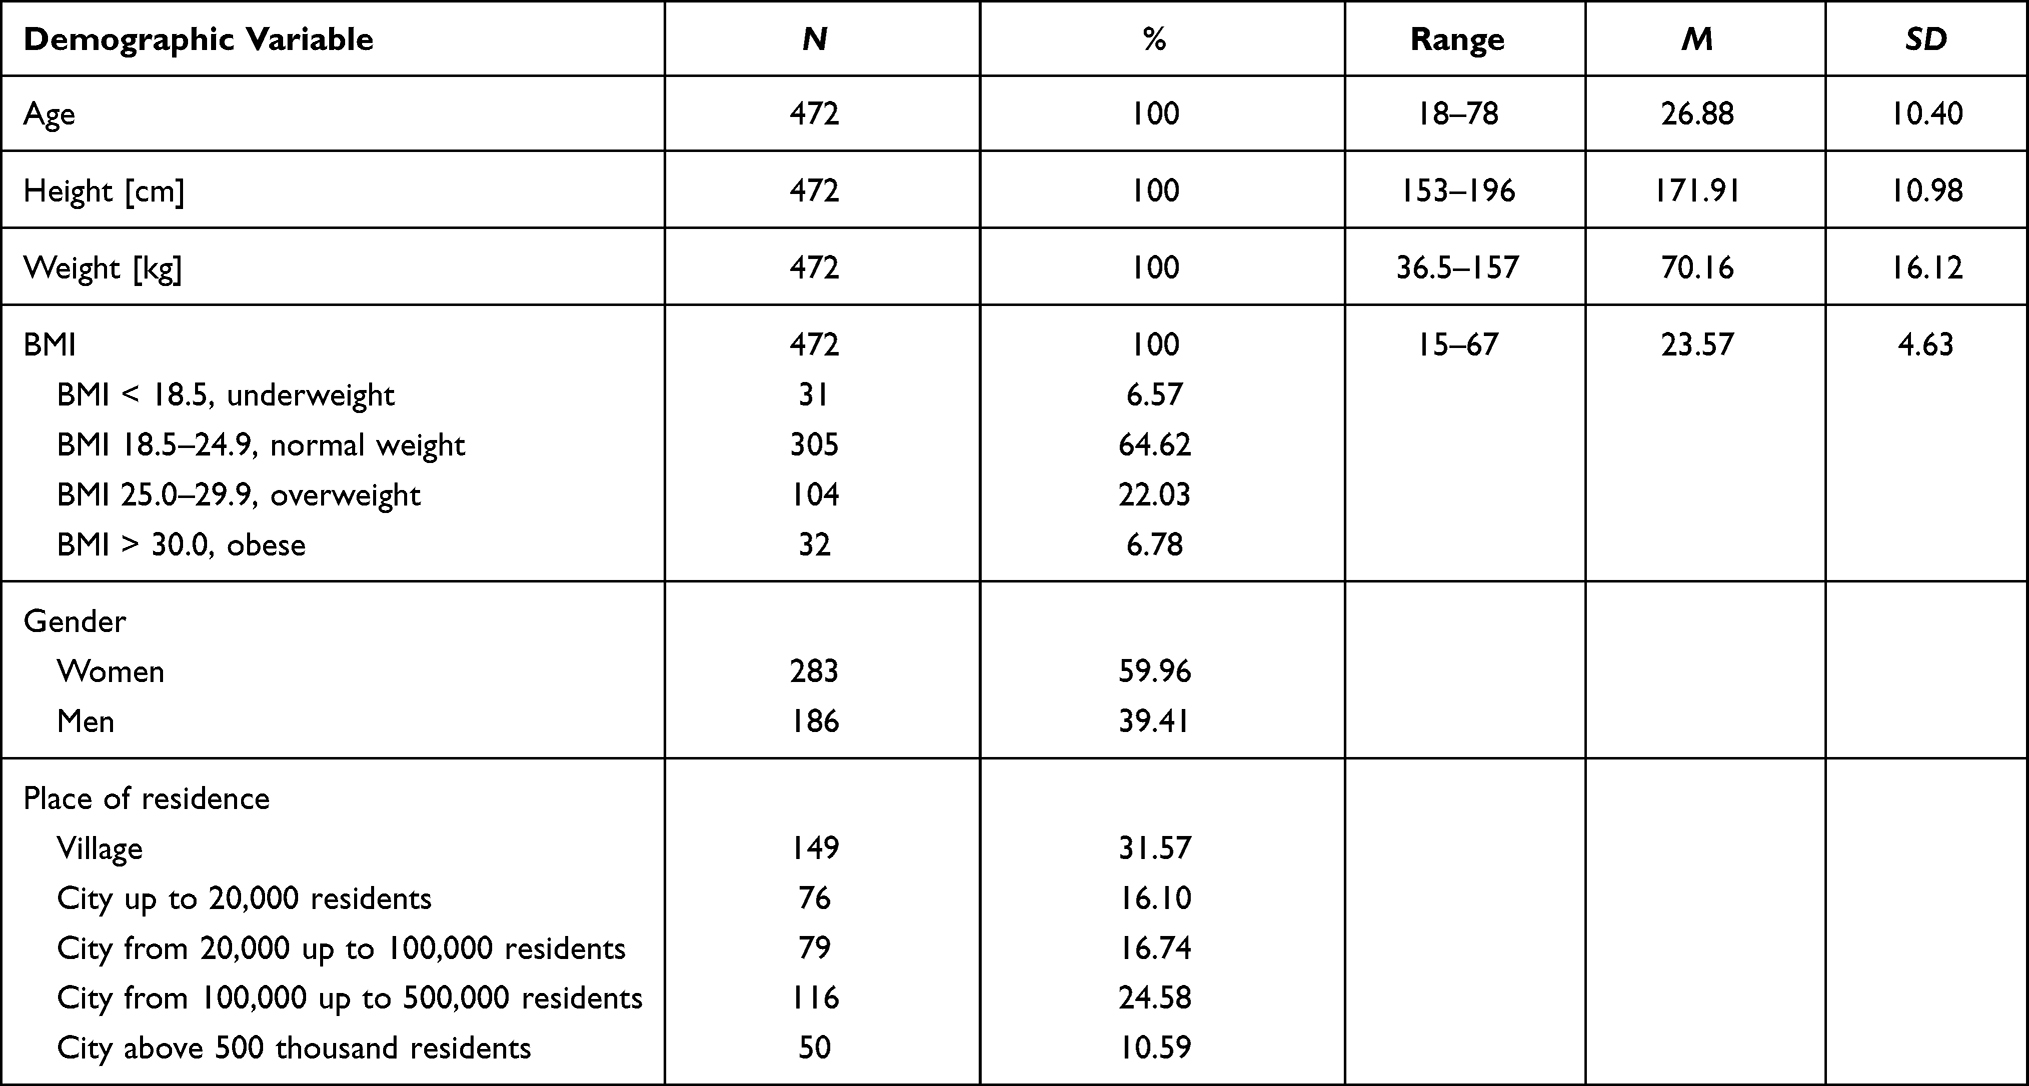 |
Table 2 Demographic Characteristics of the Sample |
Measures
The Authorized Bratman Orthorexia Self-Test (ABOST) was developed by Bratman.30 The ABOST is an authorized, more recent version of the Bratman Orthorexia Test (BOT), including only six statements with yes/no answers. According to Bratman,30 a positive answer to any of the questions indicates a risk of orthorexia nervosa. An example of an item is:
I spend so much of my life thinking about, choosing and preparing healthy food that it interferes with other dimensions of my life, such as love, creativity, family, friendship, work, and school.
The items were translated from English to Polish and backward by 12 students of Psychology during a social research seminar and a professional English native speaker, consistent with the recommendation of Beaton et al.31
A pilot study was conducted in a sample of 24 psychology students (twelve fourth-year students and twelve fifth-year students) participating in the seminar course. One of the main concerns in the pilot study was the dichotomous response. Dichotomous yes/no answers have been found to be difficult to use in various studies.32 A Likert scale offers more options to choose from, providing a higher accuracy of measurement and reliability of the questionnaire. The students proposed that a Likert-like scale would be more comfortable Thus, we decided to use a five-point Likert scale that graded the extent to which respondents agreed with each statement (1 = Strongly disagree, 2 = Rather disagree, 3 = I do not know, 4 = Rather agree, 5 = Strongly agree). The total score was calculated by summarizing all six scores obtained from the items, with greater scores indicating a higher risk of orthorexia nervosa.
The ORTO-15 is a 15-item tool for diagnosing orthorexia, developed by Donini et al,24 in which participants rate the frequency of a given behavior on a four-point Likert scale (4 = Always, 3 = Often, 2 = Sometimes, 1 = Never). A total score below 40 indicates orthorexia risk. In the Polish adaptation, the reliability coefficient (Cronbach’s α) was 0.64 and 0.77.33,34 The internal consistency (Cronbach’s α) in the present study was 0.65.
The Eating Attitudes Test (EAT-26) was developed by Garner et al,35 and includes 26 items related to eating disorders (eg, anorexia nervosa, binge-eating disorder, and bulimia nervosa). Individuals answer on a 6-point Likert scale (3 = Always, 2 = Usually, 1 = Often, 0 = Sometimes, Rarely, Never), with scores above 20 points indicating a risk of EDs. The Polish version of the EAT-26 has shown a reliability coefficient (Cronbach’s α) of 0.8036,37 (0.86 in the present study).
The body mass index (BMI) is calculated from weight (kg) and height (m), as BMI = weight/height2. A BMI below 18.5 = Underweight, BMI between 18.5 and 24.9 = Average weight, BMI from 25.0 to 29.9 = Overweight, and BMI above 30.0 = Obesity.38
The Obsessive–Compulsive Inventory-Revised (OCI-R) was developed as a short measure of obsessive–compulsive disorder (OCD).39 The OCI-R include 18 items, describing various symptoms during the past month, rated on a five-point Likert scale (0 = Not at all, 1 = A little, 2 = Moderately, 3 = A lot, 4 = Extremely). A score above 21 indicates severe OCD. The OCI-R contains six sub-scales: Washing, Checking, Ordering, Obsessing, Hoarding, and Mental Neutralizing.40 The Polish version of the OCI-R was used in this study.41 The reliability measured with Cronbach’s α was 0.90 for the total OCI-R score and ranged between 0.83 to 0.90 for the particular sub-scales.40 In the current study, the Cronbach’s α reliability coefficient was 0.91 for the total OCI-R and, for the sub-scales Washing, Checking, Ordering, Obsessing, Hoarding, and Neutralizing, the values were 0.76, 0.85, 0.59, 0.74, 0.77, and 0.75, respectively.
The Generalized Anxiety Disorder (GAD-7) was developed as a brief 7-item clinical assessment of anxiety symptoms, following the DSM-IV criteria.42 Participants rate their frequency of experiencing given symptoms (during the last 2 weeks) on a 4-point Likert scale (0 = Not at all, 1 = Several days, 2 = More than half the days, and 3 = Nearly every day). A total score over 10 points is indicative of generalized anxiety disorder.42 The internal consistency was very high (Cronbach’s α = 0.92) in both the original41 and Polish version,43 as well as in the present study.
The Patient Health Questionnaire (PHQ-9) was developed to screen depression severity on a 9-item scale, in accordance with the DSM-IV criteria.44,45 Participants answer, on a 4-point Likert scale (0 = Not at all, 1 = Several days, 2 = More than half the days, and 3 = Nearly every day), how often they have experienced the given symptoms over the last 2 weeks. A PHQ-9 score above 10 is indicative of major depressive disorder.44 The reliability coefficient (Cronbach’s α) was 0.89 in the original validation study44 and 0.88 in the Polish version.46 In the present study, we determined a Cronbach’s α of 0.84.
Procedure
A cross-sectional pilot study was conducted on a sample of 24 psychology students, in order to assess whether the translated items were correct, clearly formulated, and understandable. According to the collected opinions about the test, minor corrections were introduced and the scale of dichotomous answers was replaced with a 5-point Likert scale, in congruence with methodological standards, as a higher number of choices increases the accuracy of judgment.47 The final version of the ABOST was used in the study, in order to explore the questionnaire’s psychometric properties.
A sample size of a minimum of 115 participants was determined a priori, using the G*Power software for one-tail bivariate correlation model, with 95% CI, p < 0.05, and medium effect size of 0.30; while 174 participants were determined a priori using the one-tail Student’s t-test for two independent samples, with 95% CI, p < 0.05, and large Cohen’s d effect size of 0.50. The present sample of 472 participants achieved 0.99 power, as calculated by post hoc G*Power.48
A cross-sectional study was performed between March 2018 and June 2019 in two forms—an online survey (n = 340) and a paper-and-pencil questionnaire (n = 132)—both recruiting a convenience sample from the general population. The link to the online Google form was disseminated by e-mail (using a snowball technique) to acquaintances, friends, and family members. Participants were also asked to include the link to the online survey on their personal Facebook websites, as well as in Facebook groups related to a healthy lifestyle and healthy food. The paper-and-pencil questionnaires were disseminated, using snowball techniques, among university students. University students also participated in the study during classes at university, with the consent of lecturers. The inclusion criterion was being aged 18 years or older.
All surveys included ABOST and questions related to demographic characteristics, such as age, gender, height, weight, and residence. Different sets of other standardized questionnaires, such as the ORTO-15, EAT-26, GAD-7, PHQ-9, and OCI-R, were included in the surveys, in order to avoid participant fatigue. The total number of questions did not exceed 50 in each survey. Informed consent was obtained from all participants, as it was included on the first survey page. Respondents participated anonymously and voluntarily in the research. According to the Declaration of Helsinki guidelines, the study was conducted and approved by the Institutional Review Board of the University of Opole, Poland (05.10.2018).
Statistical Analysis
Descriptive statistics were tested in regard to the range of scores, mean (M), 95% confidence interval (CI), standard deviation (SD), and Cronbach’s α reliability coefficient. Pearson’s correlation coefficient (r) was calculated, in order to examine the relationship between the ABOST and other instruments (ie, ORTO-15, EAT-26, BMI, OCI-R, GAD-7, PHQ-9) and between particular items within the ABOST. Gender differences in the ABOST were examined using Student’s t-test. Exploratory factor analysis (EFA) and confirmatory factor analysis (CFA) were performed to examine the ABOST structure. The STATISTICA ver. 13.5 software was used to calculate the statistical results in this study. Sensitivity analysis was conducted using the OpenEpi ver. 3 software. The 95th percentile estimation was performed through the Bootstrapping method with 1000 samples, using the IBM SPSS ver. 25 software.
Results
Descriptive Statistics
The sample of 472 participants completed the ABOST 2 with a five-point Likert scale. The descriptive statistics, such as the range of scores, mean, standard deviation, and correlation for the ABOST 2, ORTO-15, EAT-26, OCI-R, GAD-7, and PHQ-9, are shown in Table 3. The ABOST 2 scores considered as a continuous variable (rated on a five-point Likert scale) were also converted to a dichotomous score (ABOST 1), due to original Bratman’s suggestions,30 where 1–3 answers were coded as zero (0 = No risk of ON), while 4–5 answers were coded as 1 (1 = Risk of ON). As recommended by Bratman,30 respondents whose scores were equal to or exceeded 1 were assigned to the “ON-risk” group (ONR, ABOST 1 ≥ 1, n = 158, 33.47%), whereas those with score of 0 were included in the “ON-no risk” sample (ONNR, ABOST 1 = 0, n = 314, 66.53%).
 |
Table 3 Descriptive Statistics |
Face Validity
The compliance of Dunn and Bratman’s28 criteria of ON with the ABOST statements30 are presented in Table 4. The first item of the ABOST involves an obsession and preoccupation with healthy food (criteria A and A1), which impairs social, academic, or vocational functioning (criterion B2). The second item regards the exaggerated negative emotional and physical responses to the dietary transgression, related predominantly to experiencing anxiety (criterion A2). The third item of the ABOST describes an excessive dependence on body image, self-worth, identity, and satisfaction with life, in compliance with self-defined “healthy” eating behavior (criterion B3). The fourth ABOST item shows that the entity was trying to loosen these constraints, but that attempt had been unsuccessful, thus showing strong obsessive–compulsive tendencies (criterion A1). The fifth statement of the ABOST indicates the typical escalation pattern that transforms mildly disordered eating into a significant pathology (criterion A3). The sixth item demonstrates the consequences of a restrictive diet on physical health, including malnutrition, severe weight loss, or other medical complications from a restricted diet (criterion B1).
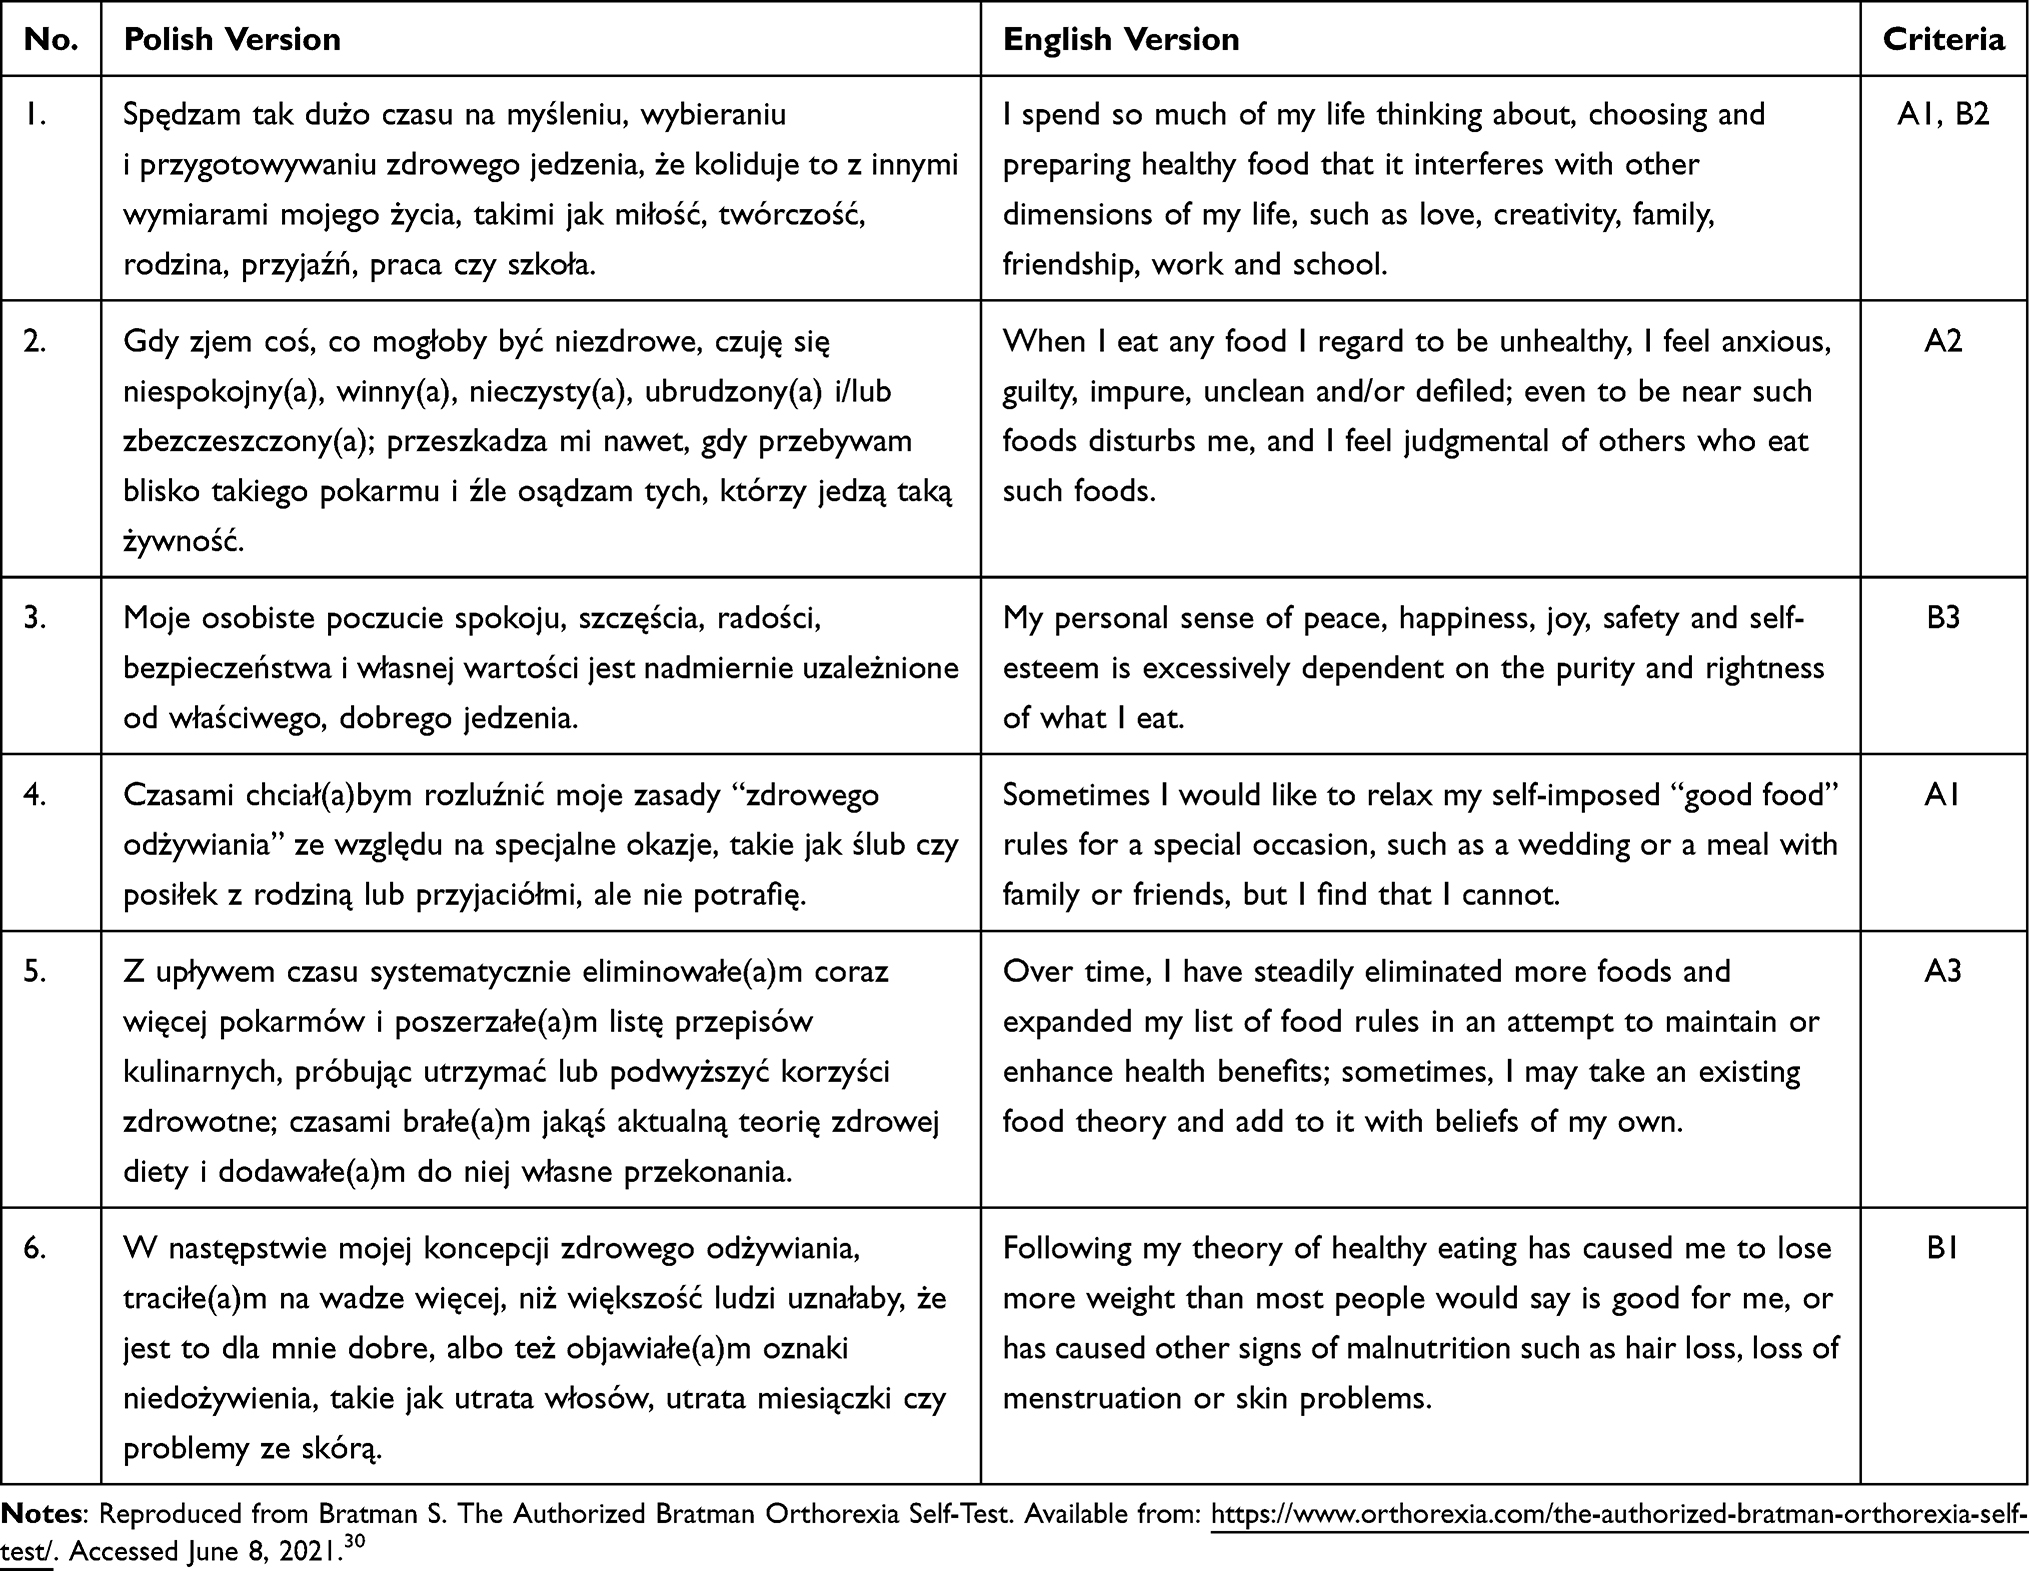 |
Table 4 Polish and English Versions of the ABOST and Corresponding Criteria of on Developed by Dunn and Bratman |
Structural Analysis: EFA and CFA
Two ABOST scoring methods were compared: Continuous (ABOST 2; Likert five-point response) and dichotomous (ABOST 1; scores 0 or 1, transformed from continuous 1–3 or 4–5, respectively). A preliminary correlation analysis was performed, in order to determine whether the items were related to each other. Spearman correlations were conducted for the ABOST 1 and Pearson’s correlation for the ABOST 2. The results are shown in Table 5. There were numerous correlations between items, suggesting that factor analysis is appropriate for structure exploration. The total sample was randomly divided into two samples: Sample A (n = 236) and Sample B (n = 236). Exploratory factor analysis (EFA) was performed in Sample A, while confirmatory factor analysis (CFA) was conducted in Sample B.
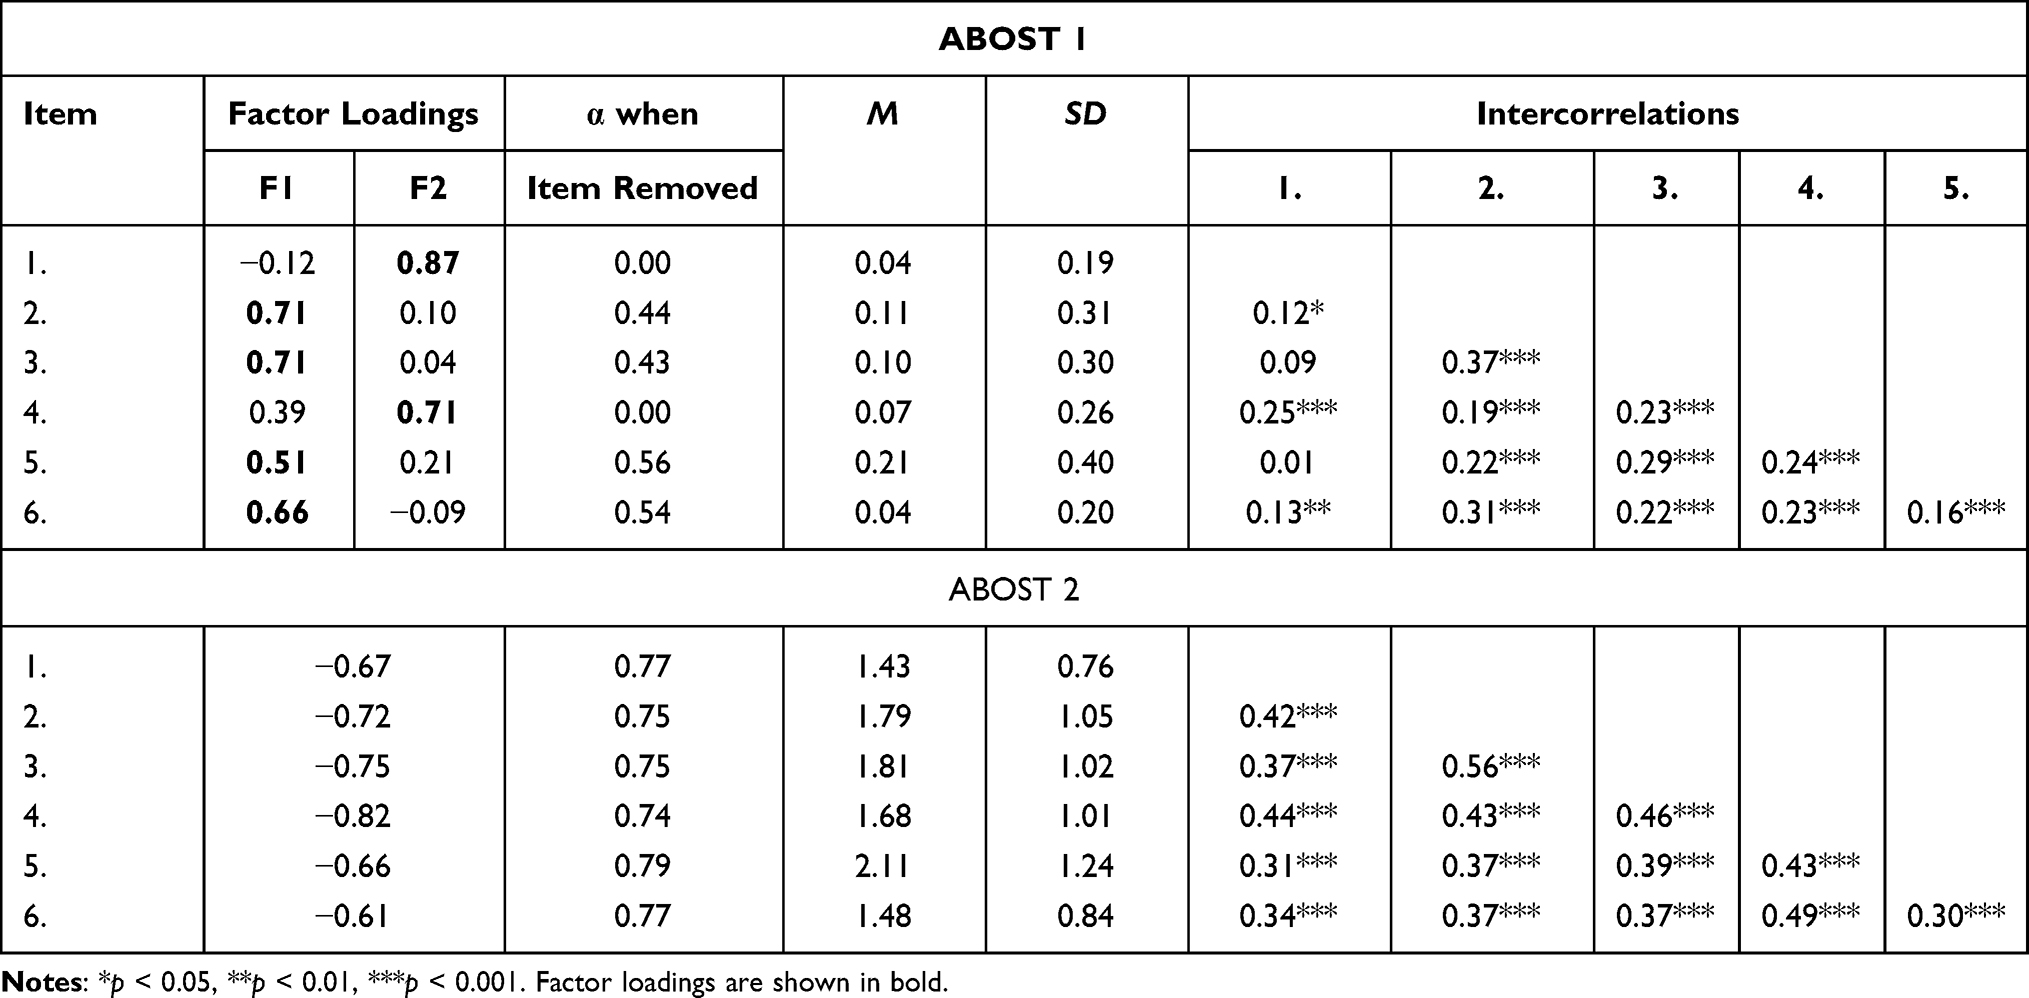 |
Table 5 Correlations Between Items in the ABOST 1 and ABOST 2 |
First, the structure of ABOST 1 was explored. The Kaiser–Meyer–Olkin coefficient was 0.70, and Bartlett’s test of sphericity was χ2(15) = 271.97 (p < 0.001), which indicated that factor analysis may be useful in the given data. According to the criteria of Kaiser (an eigenvalue above 1) and Cattell (analysis of scree test),49,50 two factors were extracted using the principal component method and Varimax rotation (Table 4). F1 included four items (2, 3, 5, and 6), with an eigenvalue of 2.02 and explaining 33.70% of the total variance. F2 included two items (1 and 4), with an eigenvalue of 1.17 and explaining 19.58% of the total variance. Thus, the cumulated variance explained 53.27% of the total variance. The Cronbach’s α was 0.54 for F1, while that for F2 was α = 0.38. The reduction in items may decrease the reliability of F1 and F2, as shown in Table 5.
Confirmatory factor analysis (CFA) with the maximum likelihood (ML) estimation technique was performed, in order to assess how well the two-factor model captured the covariance between all the items or measures in the model. The results indicated a rather unacceptable model fit (n = 236), based on the ML chi-squared test χ2(8) = 18.52 (p < 0.05); the standardized root mean square residual SRMR = 0.049; the root mean square error of approximation RMSEA = 0.073, (95% CI = [0.027, 0.119]); Gamma = 0.986 (95% CI = [0.964, 0.998]); McDonald’s centrality index Mc = 0.979 (95% CI = [0.945, 0.997]); Bolen’s delta BL89 = 0.927; normed fit index NFI = 0.878; Tucker–Lewis index TLI = 0.856; goodness-of-fit index GFI = 0.975; adjusted goodness-of-fit index AGFI = 0.934; Aikake information criterion AIC = 0.189; and Schwartz Bayesian information criterion BIC = 0.381.51,52
Next, the structure of the ABOST 2 was examined. The Kaiser–Meyer–Olkin coefficient was 0.84, and Bartlett’s test of sphericity was χ2(15) = 751.10 (p < 0.001), indicating the suitability of the data for structure detection. A one-factor solution was extracted, with eigenvalue 3.00 and explaining 49.93% of the total variance. The internal consistency was much higher in the ABOST 2 than in the ABOST 1, as the Cronbach’s α was 0.80. Confirmatory factor analysis (CFA) with the ML estimation method indicated an acceptable model fit for the ABOST 2 (n = 236), as well as better goodness-of-fit statistics than for the ABOST 1, based on the ML chi-squared test χ2(9) = 18.89 (p < 0.05); SRMR = 0.035; RMSEA = 0.068 (95% CI = [0.023, 0.112]); Gamma = 0.986 (95% CI = [0.964, 0.998]); Mc = 0.979 (95% CI = [0.945, 0.998]); BL89 = 0.973; NFI = 0.950; TLI = 0.954; GFI = 0.974; AGFI = 0.939; AIC = 0.183; and BIC = 0.359.51,52
Convergent Construct Validity
The construct validity was examined using Pearson’s correlation coefficient, with respect to such scales as the ORTO-15, EAT-26, OCI-R, GAD-7, and PHQ-9. As the ABOST 1 did not meet the criteria of structural validity (using CFA) and reliability (using Cronbach’s α), while the ABOST 2 showed a good fit and reliability of the one-factor model, ABOST 2 was selected for the analysis (see Table 3). The ABOST 2 positively correlated with all variables, except for BMI. Statistically significant medium correlations were found with eating disorders (the EAT-26) and obsessive–compulsive disorder (the total OCI-R and Washing sub-scale); while weak associations with the other orthorexia scale (the ORTO-15), depression (the PHQ-9), anxiety (the GAD-7), and the Checking, Ordering, Obsessing, Hoarding, and Neutralizing sub-scales of the OCI-R were observed. Gender differences were tested using Student’s t-test (N = 472). Women (M = 10.71, SD = 4.35, n = 283) scored significantly higher than men (M = 9.66, SD = 3.89, n = 186); with small effect size, t(467) = −2.67, p < 0.01, and Cohen’s d = 2.08.
Analysis of Sensitivity and Specificity of the ABOST
Bratman’s original method to recognize ON risk (ie, at least one positive answer in the ABOST) was used in a Receiver Operator Characteristic (ROC) analysis, in order to determine the optimal cut-off point for classification (ie, the highest sensitivity and specificity concurrently). The ROC curve is presented in Figure 1. A value of 0.5 represents random discrimination, values ranging from 0.7 to 0.8 demonstrate acceptable discrimination, while those between 0.8 and 0.9 indicate excellent discrimination ability. Values greater than 0.9 show outstanding discrimination.53 Table 6 presents statistics such as the sensitivity, specificity, positive predictive value (PPV), negative predictive value (NPV), Diagnostic Accuracy (DA), Likelihood ratio of a Positive Test (LPT), Likelihood ratio of a Negative Test (LNT), Diagnostic Odds (DO), Cohen’s Kappa (Unweighted K), and Bias Index (BI). The optimal cut-off score was determined as 13 points, with the maximum sensitivity (95%) and specificity (68%) values, as well as 86% DA (see Table 6 for more details). Using a cut-off score of 13 in the ABOST 2, we identified 123 people at risk of ON (26.06% of the total sample); however, as it seemed unlikely that one-fourth of participants had an orthorexia disorder, the cut-off point instead indicated an early orthorexia risk assessment. Therefore, the 95th percentile estimation was performed for the ABOST, in order to examine a high level of orthorexia risk among participants. The method of percentile estimation calculated the rank as p (n + 1), with p representing the percentile (divided by 100) and n being the sample size.54 A cut-off score of 19 was found for the ABOST, with Boot SE = 1.18, Boot 95% CI = [17.00, 20.00]. Of the 472 participants, 25 people (5.30%) showed total scores equal to or greater than 19.
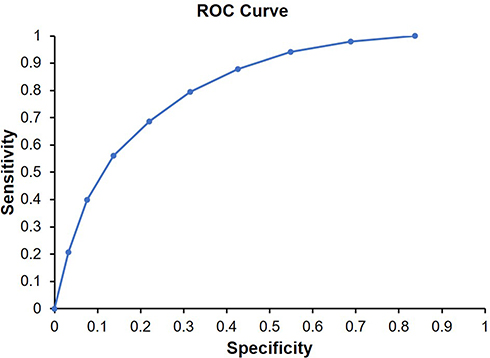 |
Figure 1 Receiver operator characteristic (ROC) analysis for the ABOST. |
 |
Table 6 ROC Analysis for the ABOST |
Discussion
In this study, we explored the psychometric properties of the ABOST, in terms of the face, structural, and construct validity of the questionnaire. Opitz et al55 have postulated, in a current review, to re-evaluate the existing tools and to establish a consensus regarding the conceptualization of ON, in order to establish a measure with good psychometric properties. This study indicated that the ABOST covers all of Dunn and Bratman’s28 criteria of ON and fully meets face validity criteria. Structural validity was examined in two versions of the ABOST: ABOST 1 (dichotomous yes/no answers) wan ABOST 2 (responses on a five-point Likert scale). As demonstrated in this study, the change of response scale significantly increased the accuracy of measurement and reliability of the ABOST. Moreover, the two-factor model ABOST 1 failed to meet the goodness-of-fit criteria and, as such, we rejected this tool from the following construct validity analysis. In contrast, the ABOST 2 indicated good structural validity for the one-factor solution, as well as sufficient reliability (as assessed by Cronbach’s α).
Finally, the positive correlations between ABOST 2 and another orthorexia tool (the ORTO-15), eating disorder (the EAT-26), obsessive–compulsive disorder (the OCI-R), anxiety (the GAD-7), and depression (PHQ-9) were consistent with previous studies, confirming the convergence validity of the ABOST.3–7 Consistent with some previous research, the BMI was not related to the ABOST.5,8 It is important to note that weight loss is a rare consequence of ON and may be seen only in selected, high-ON cases. Thus, the present research was unable to detect such a relationship. The gender differences found in this study were consistent with those of previous research: women are more concerned about a healthy diet than men and, therefore, women are at higher risk of ON.9
Although the BOT (a previous version of ABOST, developed by Bratman and Knight10) was one of the most commonly used orthorexia tools, this questionnaire has been criticized for its poor reliability and inappropriate validity.56 Moreover, a recent review55 showed that most of the currently existing ON tools also failed to present robust psychometric properties and sufficient validation results. The main problems with these ON questionnaires concern the dimensionality and conceptualization of ON measurement.2,55,57 In contrast, in the present study, we demonstrated that the ABOST is a reliable and valid questionnaire to assess moderate (cut-off: 13 points) and high (cut-off: 19 points) risk of ON. The prevalence of ON ranged between 26–39% in previous studies where the BOT was applied in the Polish population.19,58 These previous prevalence rates may have been overestimated, as suggested Dunn et al28 The prevalence of high risk of ON found in this study (5.3%) was similar to the results of recent research using the Dusseldorf Orthorexia Scale (DOS; prevalence between 2.3% and 7.8%), which seems more realistic.59–63 According to the recommendation of Valente et al,57 the ABOST is based on current knowledge and the re-conceptualization of ON. Summarizing the results of this study, the ABOST is a fully suitable and brief six-item instrument to measure orthorexia nervosa, with high validity and good reliability. Further research using the ABOST in various other cultures is necessary, in order to confirm the one-factor structure and psychometric properties across various populations.
Limitation of the Study
This study had several limitations. First, the cross-sectional design did not allow for assessment of the state of causal associations between variables. Although the sample size was relatively large, the proportion of men and women was not equal. The recruitment of participants was based predominantly on the snowball method and a convenience sample of individuals related to each other. Further research should include a larger group which better represents the general population. The present study used a questionnaire solely. Longitudinal research with more experimental techniques should be conducted in the future. Finally, we converted the response method (from a five-point Likert scale to dichotomous yes/no answer) and compared the transformed results of the ABOST 1 with an accurate measure in the ABOST 2. Future research should compare distinct methods of answering (scoring) in separate groups, or in the same group with a duration between surveys. More research should be conducted in various countries, in order to confirm the presented structure of the ABOST and to compare both versions of the ABOST using distinct response methods.
Conclusion
The ABOST 2, which uses a five-point Likert scale of responses, was shown to be a valid and reliable instrument to assess ON risk. We confirmed the face, structural, and construct validity of the ABOST 2, while the original version of the ABOST 1 did not meet the validity and reliability criteria. More research is necessary, in order to verify the presented results.
Disclosure
The authors declare no conflict of interest in this work. The orthorexia criteria28 in Table 1 were applied with the Publisher’s (Elsevier) permission.
References
1. Bratman S. Health food junkie. Yoga J. 1997;136:42–50.
2. Cena H, Barthels F, Cuzzolaro M, et al. Definition and diagnostic criteria for orthorexia nervosa: a narrative review of the literature. Eat Weight Disord. 2019;24(2):209–246. doi:10.1007/s40519-018-0606-y
3. Brytek-Matera A, Gramaglia C, Gambaro E, Delicato C, Zeppegno P. The psychopathology of body image in orthorexia nervosa. J Psychopathol. 2018;24(3):133–140.
4. Barthels F, Barrada JR, Roncero M. Orthorexia nervosa and healthy orthorexia as new eating styles. PLoS One. 2019;14(7):
5. McComb SE, Mills JS. Orthorexia nervosa: a review of psychosocial risk factors. Appetite. 2019;140:50–75. doi:10.1016/j.appet.2019.05.005
6. Strahler J. The dark side of healthy eating: links between orthorexic eating and mental health. Nutrients. 2020;12(12):
7. Koven NS, Abry AW. The clinical basis of orthorexia nervosa: emerging perspectives. Neuropsychiatr Dis Treat. 2015;18(11):385–394. doi:10.2147/NDT.S61665
8. Varga M, Dukay-Szabó S, Túry F, van Furth EF. Evidence and gaps in the literature on orthorexia nervosa. Eat Weight Disord. 2013;18(2):103–111. doi:10.1007/s40519-013-0026-y
9. Strahler J. Sex differences in orthorexic eating behaviors: a systematic review and meta-analytic integration. Nutrition. 2019;67–68(110534):110534. doi:10.1016/j.nut.2019.06.015
10. Bratman S, Knight D. Health food junkies. In: Orthorexia Nervosa: Overcoming the Obsession with Healthful Eating. New York, USA: Broadway Books; 2000.
11. Kinzl JF, Hauer K, Traweger C, Kiefer I. Orthorexia nervosa in dieticians. Psychother Psychosom. 2006;75(6):395–396. doi:10.1159/000095447
12. Korinth A, Schiess S, Westenhoefer J. Eating behaviour and eating disorders in students of nutrition sciences. Public Health Nutr. 2010;13(1):32–37. doi:10.1017/S1368980009005709
13. Rössner S. Orthorexia nervosa – a new disease? Lakartidningen. 2004;101(37):2835. Swedish.
14. Eriksson L, Baigi A, Marklund B, Lindgren EC. Social physique anxiety and sociocultural attitudes toward appearance impact on orthorexia test in fitness participants. Scand J Med Sci Sports. 2008;18(3):389–394. doi:10.1111/j.1600-0838.2007.00723.x
15. Grammatikopoulou MG, Gkiouras K, Markaki A, et al. Food addiction, orthorexia, and food-related stress among dietetics students. Eat Weight Disord. 2018;23(4):459–467. doi:10.1007/s40519-018-0514-1
16. Gkiouras K, Mavridis P, Tsakiri V, et al. Evaluation of orthorexia among dietetics students. Clin Nutr ESPEN. 2018;24:179. doi:10.1016/j.clnes
17. Bundros J, Clifford D, Silliman K, Neyman Morris M. Prevalence of orthorexia nervosa among college students based on Bratman’s test and associated tendencies. Appetite. 2016;101:86–94. doi:10.1016/j.appet.2016.02.144
18. Hayes O, Wu MS, De Nadai AS, Storch EA. Orthorexia nervosa: an examination of the prevalence, correlates, and associated impairment in a university sample. J Cogn Psychother. 2017;31(2):124–135. doi:10.1891/0889-8391.31.2.124
19. Dittfeld A, Gwizdek K, Jagielski P, Brzęk J, Ziora K. A study on the relationship between orthorexia and vegetarianism using the BOT (Bratman Test for Orthorexia). Psychiatr Pol. 2017;51(6):1133–1144. doi:10.12740/PP/75739
20. Dittfeld A, Gwizdek K, Koszowska A, et al. Assessing the risk of orthorexia in dietetic and physiotherapy students using the BOT (Bratman test for orthorexia). Pediatr Endocrinol Diabetes Metab. 2016;22(1):6–14. doi:10.18544/PEDM-22.01.0044/
21. Håman L, Barker-Ruchti N, Patriksson G, Lindgren EC. Orthorexia nervosa: an integrative literature review of a lifestyle syndrome. Int J Qual Stud Health Well-Being. 2015;10(1):26799. doi:10.3402/qhw.v10.26799
22. Michalska A, Szejko N, Jakubczyk A, Wojnar M. Nonspecific eating disorders—a subjective review. Psychiatr Pol. 2016;50(3):497–507. doi:10.12740/PP/59217
23. Donini LM, Marsili D, Graziani MP, Imbriale M, Cannella C. Orthorexia nervosa: a preliminary study with a proposal for diagnosis and an attempt to measure the dimension of the phenomenon. Eat Weight Disord. 2004;9(2):151–157. doi:10.1007/BF03325060
24. Donini LM, Marsili D, Graziani MP, Imbriale M, Cannella C. Orthorexia nervosa: validation of a diagnosis questionnaire. Eat Weight Disord. 2005;10(2):28–32. doi:10.1007/BF03327537
25. Gleaves D, Graham E, Ambwani S. Measuring “orthorexia”: development of the eating habits questionnaire. TIJEPA. 2013;12:1–18.
26. Burda L. Development and Validation of an Inventory Measuring Dietary Attitudes of Healthy Eating and Orthorexia Nervosa [Ph.D. thesis]. Corpus Christi, TX: Texas A&M University; 2018.
27. Kramer M. The Development of a Scale to Measure Orthorexia Nervosa [M.S. thesis]. Fort Collins, CO: Colorado State University; 2016.
28. Dunn TM, Bratman S. On orthorexia nervosa: a review of the literature and proposed diagnostic criteria. Eat Behav. 2016;21:11–17. doi:10.1016/j.eatbeh.2015.12.006
29. Bratman S. Orthorexia vs. theories of healthy eating. Eat Weight Disord. 2017;22(3):381–385. doi:10.1007/s40519-017-0417-6
30. Bratman S. The Authorized Bratman Orthorexia Self-Test. Available from: https://www.orthorexia.com/the-authorized-bratman-orthorexia-self-test/.
31. Beaton DE, Bombardier C, Guillemin F, Ferraz MB. Guidelines for the process of cross-cultural adaptation of self-report measures. Spine. 2000;25(24):3186–3191. doi:10.1097/00007632-200012150-00014
32. Welch PG, Carleton RN, Asmundson GJ. Measuring health anxiety: moving past the dichotomous response option of the original Whiteley index. J Anxiety Disord. 2009;23(7):1002–1007. doi:10.1016/j.janxdis.2009.05.006
33. Brytek-Matera A, Krupa M, Poggiogalle E, Donini LM. Adaptation of the ORTHO-15 test to Polish women and men. Eat Weight Disord. 2014;19(1):69–76. doi:10.1007/s40519-014-0100-0
34. Stochel M, Janas-Kozi M, Zejda E, Hyrnik J, Jelonek I, Siwiec A. Validation of ORTO-15 questionnaire in the group of urban youth aged 15–21. Psychiatr Pol. 2015;49(1):119–134. doi:10.12740/PP/25962
35. Garner DM, Olmsted MP, Bohr Y, Garfinkel PE. The eating attitudes test: psychometric features and clinical correlates. Psychol Med. 1982;12(4):871–878. doi:10.1017/S0033291700049163
36. Rogoza R, Brytek-Matera A, Garner D. Analysis of the EAT-26 in a non-clinical sample. Arch Psychiatry Psychother. 2016;18(2):54–58. doi:10.12740/APP/6364
37. Białokoz‑Kalinowska I, Kierus K, Piotrowska‑Jastrzębska J. [Eating disorders in adolescents - initial diagnosis in the office of a primary care physician]. Pediatr Med Rodz. 2012;8(4):298–303. Polish.
38. WHO. Obesity: preventing and managing the global epidemic. Report of a WHO consultation. WHO Tech Rep Ser. 2000;894:1–253.
39. Foa EB, Kozak MJ, Salkovskis PM, Coles ME, Amir N. The validation of a new obsessive–compulsive disorder scale: the Obsessive–Compulsive Inventory. Psychol Assess. 1998;10(3):206–214. doi:10.1037/1040-3590.10.3.206
40. Foa EB, Huppert JD, Leiberg S, et al. The obsessive-compulsive inventory: development and validation of a short version. Psychol Assess. 2002;14(4):485–496. doi:10.1037/1040-3590.14.4.485
41. Jeśka M. [Tools for measuring the symptoms of obsessive-compulsive disorder (application, properties, advantages and disadvantages]. Neuropsych Przegl Klin. 2012;4(3):137–142. Polish.
42. Spitzer RL, Kroenke K, Williams JB, Löwe B. A brief measure for assessing generalized anxiety disorder: the GAD-7. Arch Inter Med. 2006;166(10):1092–1097. doi:10.1001/archinte.166.10.1092
43. Rogowska AM, Kuśnierz C, Bokszczanin A. Examining anxiety, life satisfaction, general health, stress and coping styles during COVID-19 pandemic in Polish sample of university students. Psyhol Res Behav Manag. 2020;13:797–811. doi:10.2147/PRBM.S266511
44. Kroenke K, Spitzer RL, Williams JB. The PHQ-9: validity of a brief depression severity measure. J Gen Inter Med. 2001;16(9):606–613. doi:10.1046/j.1525-1497.2001.016009606.x
45. Löwe B, Kroenke K, Herzog W, Gräfe K. Measuring depression outcome with a brief self-report instrument: sensitivity to change of the Patient Health Questionnaire (PHQ-9). J Affect Disord. 2004;81(1):61–66. doi:10.1016/S0165-0327(03)00198-8
46. Kokoszka A, Jastrzębski A, Obrębski M. Psychometric properties of the polish version of Patient Health Questionnaire-9. Psychiatria. 2016;13(4):187–193.
47. Rosenthal R, Rosnow RL. Essentials of Behavioral Research: Methods and Data Analysis.
48. Faul F, Erdfelder E, Lang A-G, Buchner A. G*Power 3: a flexible statistical power analysis program for the social, behavioral, and biomedical sciences. Behav Res Method. 2007;39(2):175–191. doi:10.3758/BF03193146
49. Kaiser HF. The application of electronic computers to factor analysis. Educ Psychol Meas. 1960;20(1):141–151. doi:10.1177/001316446002000116
50. Cattell RB. The scree test for the number of factors. Multivariate Behav Res. 1966;1(2):245–276. doi:10.1207/s15327906mbr0102_10
51. Fan X, Sivo SA. Sensitivity of fit indexes to misspecified structural or measurement model components. Struct Equ Model. 2005;12(3):343–367. doi:10.1207/s15328007sem1203_1
52. Rigdon EE. CFI versus RMSEA: a comparison of two fit indexes for structural equation modeling. Struct Equ Model. 1996;3(4):369–379. doi:10.1080/10705519609540052
53. Zweig MH, Campbell G. Receiver-operating characteristic (ROC) plots: a fundamental evaluation tool in clinical medicine. Clin Chem. 1993;39(4):561–577. doi:10.1093/clinchem/39.4.561
54. Schoonjans F, De Bacquer D, Schmid P. Estimation of population percentiles. Epidemiology. 2011;22(5):750–751. doi:10.1097/EDE.0b013e318225c1de
55. Opitz MC, Newman E, Alvarado Vázquez Mellado AS, Robertson MDA, Sharpe H. The psychometric properties of orthorexia nervosa assessment scales: a systematic review and reliability generalization. Appetite. 2020;155:104797. doi:10.1016/j.appet.2020.104797
56. Missbach B, Dunn T, König J. We need new tools to assess orthorexia nervosa. A commentary on “Prevalence of orthorexia nervosa among college students based on Bratman’s test and associated tendencies”. Appetite. 2017;108:521–524. doi:10.1016/j.appet.2016.07.010
57. Valente M, Syurina EV, Donini LM. Shedding light upon various tools to assess orthorexia nervosa: a critical literature review with a systematic search. Eat Weight Disord. 2019;24(4):671–682. doi:10.1007/s40519-019-00735-3
58. Gubiec E, Stetkiewicz-Lewandowicz A, Rasmus P, Sobów T. Problem ortoreksji w grupie studentów kierunku dietetyka. Med Og Nauk Zdr. 2015;21(1):95–100. doi:10.5604/20834543.1142367
59. Brytek-Matera A, Onieva-Zafra MD, Parra-Fernández ML, Staniszewska A, Modrzejewska J, Fernández-Martínez E. Evaluation of orthorexia nervosa and symptomatology associated with eating disorders among European university students: a Multicentre Cross-Sectional Study. Nutrients. 2020;12(12):3716. doi:10.3390/nu12123716
60. Greetfeld M, Hessler-Kaufmann JB, Brandl B, et al. Orthorexic tendencies in the general population: association with demographic data, psychiatric symptoms, and utilization of mental health services. Eat Weight Disord. 2020. doi:10.1007/s40519-020-00961-0
61. He J, Ma H, Barthels F, Fan X. Psychometric properties of the Chinese version of the Düsseldorf orthorexia scale: prevalence and demographic correlates of orthorexia nervosa among Chinese university students. Eat Weight Disord. 2019;24(3):453–463. doi:10.1007/s40519-019-00656-1
62. Luck-Sikorski C, Jung F, Schlosser K, Riedel-Heller SG. Is orthorexic behavior common in the general public? A Large Representative Study in Germany. Eat Weight Disord. 2019;24(2):267–273. doi:10.1007/s40519-018-0502-5
63. Strahler J, Hermann A, Walter B, Stark R. Orthorexia nervosa: a behavioral complex or a psychological condition? J Behav Addict. 2018;7(4):1143–1156. doi:10.1556/2006.7.2018.129
 © 2021 The Author(s). This work is published and licensed by Dove Medical Press Limited. The
full terms of this license are available at https://www.dovepress.com/terms
and incorporate the Creative Commons Attribution
- Non Commercial (unported, 3.0) License.
By accessing the work you hereby accept the Terms. Non-commercial uses of the work are permitted
without any further permission from Dove Medical Press Limited, provided the work is properly
attributed. For permission for commercial use of this work, please see paragraphs 4.2 and 5 of our Terms.
© 2021 The Author(s). This work is published and licensed by Dove Medical Press Limited. The
full terms of this license are available at https://www.dovepress.com/terms
and incorporate the Creative Commons Attribution
- Non Commercial (unported, 3.0) License.
By accessing the work you hereby accept the Terms. Non-commercial uses of the work are permitted
without any further permission from Dove Medical Press Limited, provided the work is properly
attributed. For permission for commercial use of this work, please see paragraphs 4.2 and 5 of our Terms.