")
Back to Journals » International Journal of Nanomedicine » Volume 10 » Issue 1
Utilization of nanotechnology to enhance percutaneous absorption of acyclovir in the treatment of herpes simplex viral infections
Authors Al-Subaie M, Hosny KMH , El-Say KM , Ahmed T , Aljaeid B
Received 4 March 2015
Accepted for publication 16 April 2015
Published 15 June 2015 Volume 2015:10(1) Pages 3973—3985
DOI https://doi.org/10.2147/IJN.S83962
Checked for plagiarism Yes
Review by Single anonymous peer review
Peer reviewer comments 5
Editor who approved publication: Dr Thomas Webster
Mutlaq M Al-Subaie,1 Khaled M Hosny,1,2 Khalid Mohamed El-Say,1,3 Tarek A Ahmed,1,3 Bader M Aljaeid1
1Department of Pharmaceutics and Industrial Pharmacy, Faculty of Pharmacy, King Abdulaziz University, Jeddah, Kingdom of Saudi Arabia; 2Department of Pharmaceutics and Industrial Pharmacy, Faculty of Pharmacy, Beni Suef University, Beni Suef, 3Department of Pharmaceutics and Industrial Pharmacy, Faculty of Pharmacy, Al-Azhar University, Cairo, Egypt
Abstract: This study aimed to formulate an optimized acyclovir (ACV) nanoemulsion hydrogel in order to provide a solution for the slow, variable, and incomplete oral drug absorption in patient suffering from herpes simplex viral infection. Solubility of ACV in different oils, surfactants, and cosurfactants was explored utilizing a cubic model mixture design to obtain a nanoemulsion with minimum globule size. Preparation of an optimized ACV nanoemulsion hydrogel using a three-factor, three-level Box–Behnken statistical design was conducted. The molecular weight of chitosan (X1), percentage of chitosan (X2), and percentage of Eugenol as a skin permeation enhancer (X3) were selected to study their effects on hydrogel spreadability (Y1) and percent ACV permeated through rat skin after 2.5 hours (Y2). A pharmacokinetic study of the optimized ACV nanoemulsion hydrogel was conducted in rats. Mixtures of clove oil and castor oil (3:1 ratio), Tween 80 and Span 80 (3:1 ratio), and propylene glycol and Myo-6V (3:1 ratio) were selected as the oil, surfactant, and cosurfactant phases, respectively. Statistical analysis indicated that the molecular weight of chitosan has a significant antagonistic effect on spreadability, but has no significant effect on the percent ACV permeated. The percentage of chitosan also has a significant antagonistic effect on the spreadability and percent ACV permeated. On the other hand, the percentage of Eugenol has a significant synergistic effect on percent ACV permeated, with no effect on spreadability. The ex vivo study demonstrated that the optimized ACV nanoemulsion hydrogel showed a twofold and 1.5-fold higher permeation percentage than the control gel and marketed cream, respectively. The relative bioavailability of the optimized ACV nanoemulsion hydrogel improved to 535.2% and 244.6% with respect to the raw ACV hydrogel and marketed cream, respectively, confirming improvement of the relative bioavailability of ACV in the formulated nanoemulsion hydrogel.
Keywords: acyclovir, nanoemulsion, hydrogel, experimental design, relative bioavailability, optimization
Introduction
Acyclovir (ACV) is on the World Health Organization’s list of essential medicines needed in a basic health system.1 It is a guanosine antiviral drug, and is one of the antiviral drugs most commonly used for treatment of herpes simplex virus infection, as well as varicella zoster (chickenpox) and herpes zoster (shingles). Topical application of ACV is limited by low transdermal penetration and poor solubility in water. Many strategies have been used to improve the therapeutic efficacy of ACV, including chemical modification, liposomes, and nanoparticles.2,3 ACV is slightly soluble in water, with solubility ranging from 1.2 to 1.6 mg/mL at room temperature,4,5 has relatively low oral bioavailability (10%–30%), has a short plasma half-life, and is absorbed from the gastrointestinal tract via passive diffusion and by transporters, but its absorption is slow, variable, and incomplete.6
The term nanoemulsion (NE) refers to a type of emulsion with a droplet size in its internal phase ranging from 5 nm to 200 nm, and forms spontaneously with a transparent appearance. It is stabilized by a strong interfacial film of surfactant and cosurfactant/cosolvent molecules. Techniques such as microfluidization, high pressure homogenization,7 emulsion inversion point,8 and sonication9 have been utilized in preparation of NEs. NEs have been reported to successfully deliver a wide variety of therapeutic agents, including quercetin, simvastatin, piroxicam, pilocarpine, indomethacin, cyclosporine A, lidocaine, prilocaine, insulin, and testosterone, via the oral, ocular, percutaneous, and nasal routes.10–13 The major limitation restricting the use of NEs is the stability of the obtained nanosized particles. The limited solubilizing capacity for high-melting substances represents another disadvantage.14
Hydrogels are hydrophilic polymeric networks with a three-dimensional configuration and are capable of absorbing large amounts of water or biological fluids.15 They are thermodynamically compatible with water, which allows them to swell in aqueous medium. Hydrogels are biocompatible due to their high water content and soft consistency. Various systems are used to classify hydrogels depending on the mechanical and structural characteristics of the network formed, the nature of the polymer used, and the physical structure of the network.16 These delivery systems have been used for oral, rectal, ocular, epidermal, and subcutaneous application.17–20
The objective of this work was to prepare an optimized topical ACV-NE hydrogel formulation to enhance of the antiviral effect of ACV. Parameters such as the molecular weight and percent of the gelling agent and percent of the skin permeation enhancer were optimized for their effect on hydrogel spreadability and percent of ACV permeated through rat skin after selecting the appropriate components for development of the NE. The pharmacokinetics and relative bioavailability of the optimized ACV-NE hydrogel formulation were compared with those of the marketed ACV cream and raw ACV hydrogel in a rodent model.
Materials and methods
Materials
ACV powder was obtained as a gift from GlaxoSmithKline. Isopropyl myristate was donated by Gattefosse. Linoleic acid, isopropyl alcohol, Eugenol, and paraffin oil were purchased from Acros Organics. Clove oil, olive oil, and propylene glycol were sourced from Tedia Company Inc. Triacetin, castor oil, oleic acid, Tween 80, Span 80, polyethylene glycol (PEG) 200, PEG 400, and ethanol were purchased from Sigma-Aldrich. PEG-6 oleate (Myo-6V) was kindly gifted by Nikko Chemical Company Ltd. The marketed ACV cream (Zovirax®) was obtained from GlaxoSmithKline. Low molecular weight chitosan (40,000 Da), viscosity of 1 wt% in 1% acetic acid ranged 20–300 cP, with deacetylation grade of 84%; medium molecular weight chitosan (480,000 Da), viscosity of 1 wt% in 1% acetic acid ranged 200–800 cP, with deacetylation grade 81%; and high molecular weight chitosan (850,000 Da), viscosity of 1 wt% in 1% acetic acid ranged 500–2,000 cP, with deacetylation grade 90% were purchased from Aldrich Chemical Co. All reagents and chemicals were of analytical grade.
Solubility studies
The solubility of ACV was measured in various oils, ie, castor oil, olive oil, clove oil, isopropyl myristate, oleic acid, linoleic acid, paraffin oil, triacetin, and clove oil mixed with castor oil in 1:1, 2:1, and 3:1 ratios. The solubility of ACV was also determined in various surfactants, including Span 80, Tween 80, and a mixture of Tween 80 and Span 80 in ratios of 1:1, 3:1, and 1:3, and in cosurfactants, including PEG 200, PEG 400, ethanol, propylene glycol, isopropanol, Myo-6V, and a mixture of propylene glycol and Myo-6V in ratios of 1:1, 3:1, and 1:3. The solubility of ACV was determined by dissolving an excess amount of the drug in 2 mL of each liquid separately. The mixtures were shaken at 25°C±0.5°C for 48 hours in a water bath (Model 1031, GFL Corporation). After reaching equilibrium, the mixtures were centrifuged at 3,000 rpm for 15 minutes using a Heraeus Labofuge™ 400 centrifuge. The supernatant was diluted with methanol, and the concentration of ACV was quantified spectrophotometrically at 254 nm. Each experiment was performed in triplicate.
Experimental design for formulation of NE
Bearing in mind the efficiency of the mixture experimental design for the optimization of the NEs, the cubic model was utilized to study and statistically optimize the effects of three components in 18 runs in randomized order.12 The three components-based system was designed using the percent of oil phase, ie, a mixture of clove oil and castor oil in a 3:1 ratio (X1); the percent of surfactant, ie, a mixture of Tween 80 and Span 80 in a 3:1 ratio (X2), and the percent of cosurfactants, ie, a mixture of propylene glycol and Myo-6V in a 3:1 ratio (X3). The response variable was the mean globule size (Y). The levels for the independent variables were selected to be 0.1–0.3 for X1, 0.4–0.75 for X2, and 0.1–0.3 for X3.
Formulation of ACV-NE according to mixture design
Eighteen formulas, each containing 10 mg ACV, were prepared with varying concentrations of oil mixture, surfactant mixture, and cosurfactant mixture (Table 1). For any mixture, the sum of the three components always equals 100%.
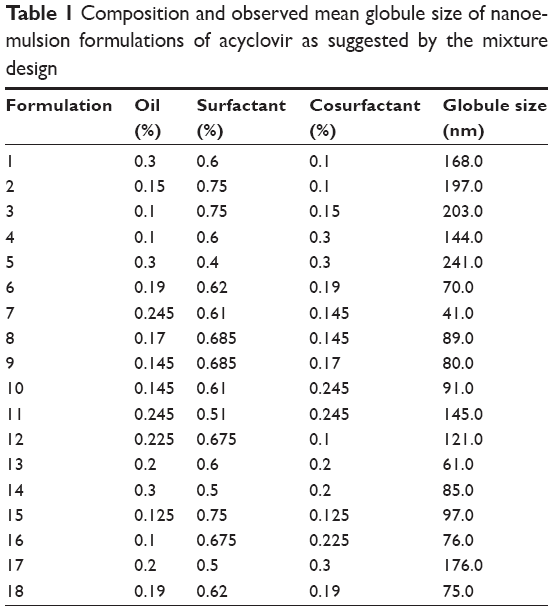 | Table 1 Composition and observed mean globule size of nanoemulsion formulations of acyclovir as suggested by the mixture design |
Evaluation of the ACV-NE formulations
Visual assessment and emulsification ability
The prepared NE dispersions were visually assessed for tendency to spontaneously emulsify, clarity, and appearance of the final emulsion.
Thermodynamic stability studies
The obtained NE formulations were subjected to various thermodynamic stability studies in order to assess their phase separation and/or stability.21 The prepared NE formulations was subjected to centrifugation at 3,000 rpm for 30 minutes and to repeated cycles of heating and cooling (three freeze-thaw cycles) at −20°C and +25°C to measure their thermodynamic stability. The resulting formulations were then tested for phase separation, creaming, or cracking. The globule size was measured to ensure NE stability.
Globule size and zeta potential determination
A 100 mg aliquot of each formulation was diluted with 20 mL of distilled water and gently agitated using a magnetic stirrer. The obtained dispersions were characterized for globule size and zeta potential by dynamic light scattering using a Zetatrac machine from Microtrac Inc. Each experiment was done in triplicate.
Analysis of extreme vertices design mixture
The effect of the study variables, X1, X2, and X3, on globule size was statistically correlated with a regression equation using Statgraphics Centurion XV version 15.2.05 software (StatPoint Technologies Inc, Warrenton, VA, USA). The optimized formula with the minimum globule size was used to prepare the ACV-NE hydrogel.
Design and optimization of ACV-NE hydrogel
The optimized ACV-NE formula was included in the preparation of the ACV-NE hydrogel. An Box–Behnken experimental design was constructed to evaluate the effects of the independent variables on the spreadability of the hydrogel (Y1) and the percentage of ACV permeated through the rat skin after 2.5 hours (Y2) from the prepared hydrogels in 15 runs. The studied variables in this work were: the molecular weight of the gelling agent, ie, chitosan (X1); the percentage of chitosan (X2) which was used in three different levels (1%–3%); and the percentage of Eugenol used as a skin permeation enhancer (X3) used in three different levels (0.25%, 0.5%, and 0.75%). The levels of these factors were selected according to preliminary studies carried out before implementing the experimental design (Table 2). Optimization of the hydrogels was done using Statgraphics software to improve the spreadability and enhance permeability through the skin. The resulting composition of the 15 formulations and the observed responses of these formulations are listed in Table 3.
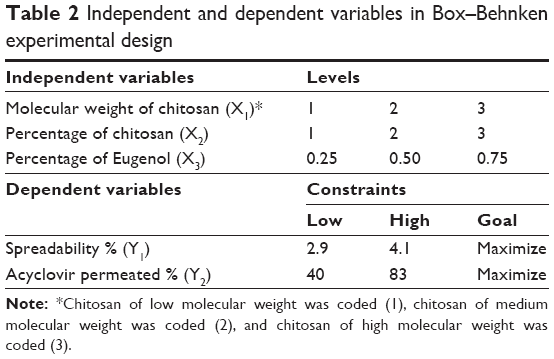 | Table 2 Independent and dependent variables in Box–Behnken experimental design |
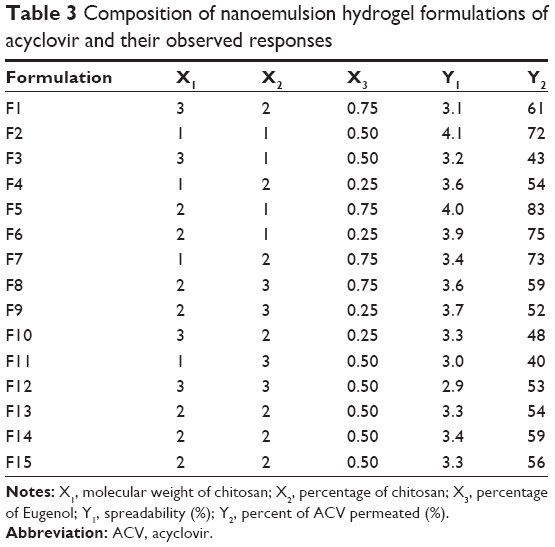 | Table 3 Composition of nanoemulsion hydrogel formulations of acyclovir and their observed responses |
Preparation of ACV-NE hydrogels
Fifteen formulations of ACV-NE hydrogel were prepared, in which the specified type and amount of chitosan was sprinkled over 10 mL of 1.5% acetic acid solution containing the specified concentration of Eugenol at 25°C±1°C. All hydrogels were prepared to contain an amount of the optimized ACV-NE formula equivalent to 1% ACV. The solution was stirred at 500 rpm until the polymer was completely dissolved. The final ACV-NE hydrogels were stored overnight in a refrigerator prior to further evaluation.
Evaluation of the prepared hydrogels
Spreadability
The spreadability of the prepared gels was measured by spreading 0.5 g on a 1 cm diameter circle premarked on a glass plate over which a second glass plate was placed. A weight of 100 g was allowed to rest on the upper glass plate for 5 minutes.22,23 The diameter of the circle was determined after spreading of the hydrogels (n=3). The following equation was used to determine the percent spread:
|
|
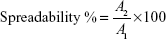
Where A1 =1 cm and A2 was the final diameter after spreading.
Ex vivo skin permeation of ACV from NE-based hydrogels
The diffusion behavior of the prepared ACV-NE hydrogels was studied using an automated Franz diffusion cell apparatus (Hanson Research) with a diffusion area of 1.76 cm2 and a receptor chamber volume of 7 mL. Full thickness skin (area 2 cm ×2 cm) free from any subcutaneous fat was and taken from the abdominal region of shaved male Wistar rats weighing 200–250 g was examined using a magnifier to confirm skin integrity. The prepared skin was mounted between the donor and receptor compartments of the diffusion cell with the dermal side in direct contact with the receptor medium. A quantity of ACV equivalent to 10 mg was placed in the donor compartment. Phosphate-buffered saline (pH 7.2) was used as a diffusion medium in the receptor chamber, with temperature maintained at 32°C±0.5°C and a stirring rate of 400 rpm. Aliquots withdrawn by the autosampler were analyzed using high-performance liquid chromatography,24 and the percentage of ACV permeated through the rat skin after 2.5 hours was calculated for each formulation. For calculation of the drug recovery after the release study, the amount of ACV remaining in the formulation at the donor compartment was assayed for ACV content using high-performance liquid chromatography method as previously described.
Statistical analysis of the data obtained with regard to the effect of the independent variables on the spreadability and percent of ACV permeated was done using the Statgraphics Centurion XV version 15.2.05 software. The optimized formula that maximized both Y1 and Y2 was identified and prepared.
Ex vivo skin permeation study for the optimized formulation
The skin permeability of the optimized ACV-NE hydrogel was carried out as described before and compared with the corresponding gel containing raw ACV and with the marketed ACV (Zovirax) cream. The technique previously published by Chaudhary and Verma was implemented, with slight modification.25 The permeation pattern for ACV was determined by plotting the cumulative amount of the drug permeated (Q) per unit area as a function of time. The steady-state flux was calculated from the slope. The permeability coefficient was calculated by dividing the flux by the initial drug load. The enhancement factor was calculated by dividing the Q of the ACV-NE gel by that of the corresponding prepared plain gel. The diffusion coefficient was obtained by plotting Q versus the square root of time.
In vivo investigation of the optimized ACV-NE hydrogel
An analysis of bioavailability was performed in rats in an attempt to explore the ability of the transdermal NE formulations to improve the pharmacokinetic parameters for ACV. Rats weighing 200–250 g were maintained on a standard diet under controlled humidity (30%–70%) and temperature (24°C±2°C) conditions. Use of these rats was approved by the local institutional review board for preclinical and clinical research which ensures that the care and use of animals at our institution conforms to the Declaration of Helsinki and the Guiding Principles in Care and Use of Animals and adheres to the legislation for the protection of animals used for scientific purposes.26,27
The animals were divided into three groups. In the first group (the negative control), plain chitosan hydrogel was applied topically to a 3.0 cm2 area. In the second group (the positive control), the marketed ACV (reference) cream was applied transdermally at a dose of 2 mg/kg to a 3.0 cm2 area. In the third group, the optimized ACV-NE hydrogel was administered transdermally at a dose of 2 mg/kg to a 3.0 cm2 area. Once applied, the hydrogels were covered with plain adhesive patches. Pharmacokinetic calculations were performed based on serum ACV concentrations. Quantification of the drug in plasma samples was done using isocratic chromatographic elution equipped with an ultraviolet spectroscopic detector set at 280 nm. Chromatographic separation was performed on a Luna (2) RP-18 (250×4.6 mm, 5 μm packing) reverse phase analytical column (Chromatec) at 40°C. The mobile phase was composed of methanol, water, and acetic acid at a ratio of 30:69.5:0.5 (pH 2.8). The mobile phase was pumped isocratically at a flow rate of 1.0 mL per minute. For extraction of ACV from the plasma samples, the protein was precipitated with 60% trichloroacetic acid at a working volume to plasma volume ratio of 1:5 v/v. The resulting acidic solution was vortexed for 10 minutes and centrifuged at 6,000 rpm for a further 10 minutes. Next 100 μL of the separated supernatant was added, followed by extraction with 500 μL of n-hexane. The supernatant was evaporated under nitrogen and the residue was reconstituted with 50 μL of mobile phase prior to injection. The bioanalytical chromatographic method used was validated in-house and deemed to be precise, accurate, sensitive, selective, and robust. The minimum and maximum limits of quantitation and detection were 5 ng/mL and 500 ng/mL, respectively.28
Kinetica (version 4, Thermo Electron Corporation) was used to compute the following pharmacokinetic parameters: elimination rate constant (ke), maximum plasma concentration (Cmax), time to maximum plasma concentration (tmax), and area under the plasma concentration-time curve (AUC).
Statistical analysis of in vivo data
The data are expressed as the mean ± standard deviation. The statistical analysis was done using GraphPad Prism version 6 (GraphPad Software, San Diego, CA, USA). Two-way repeated measures analysis of variance was used to assess the significance of the difference between quantitative variables. P<0.05 was considered to be statistically significant.
Results and discussion
Solubility studies
Figure 1 shows the solubility of ACV in different oils, surfactants, and cosurfactants. The highest solubility of ACV was achieved in a mixture of clove oil and castor oil (ratio 3:1; 329.893 μg/mL). Of the surfactants screened, the mixture of Tween 80 and Span 80 (ratio 3:1) showed the best solubilizing potential (145.43 μg/mL). A mixture of propylene glycol and Myo-6V (ratio 3:1) was selected as the cosurfactant due to its efficient solubilizing effect (110.45 μg/mL).
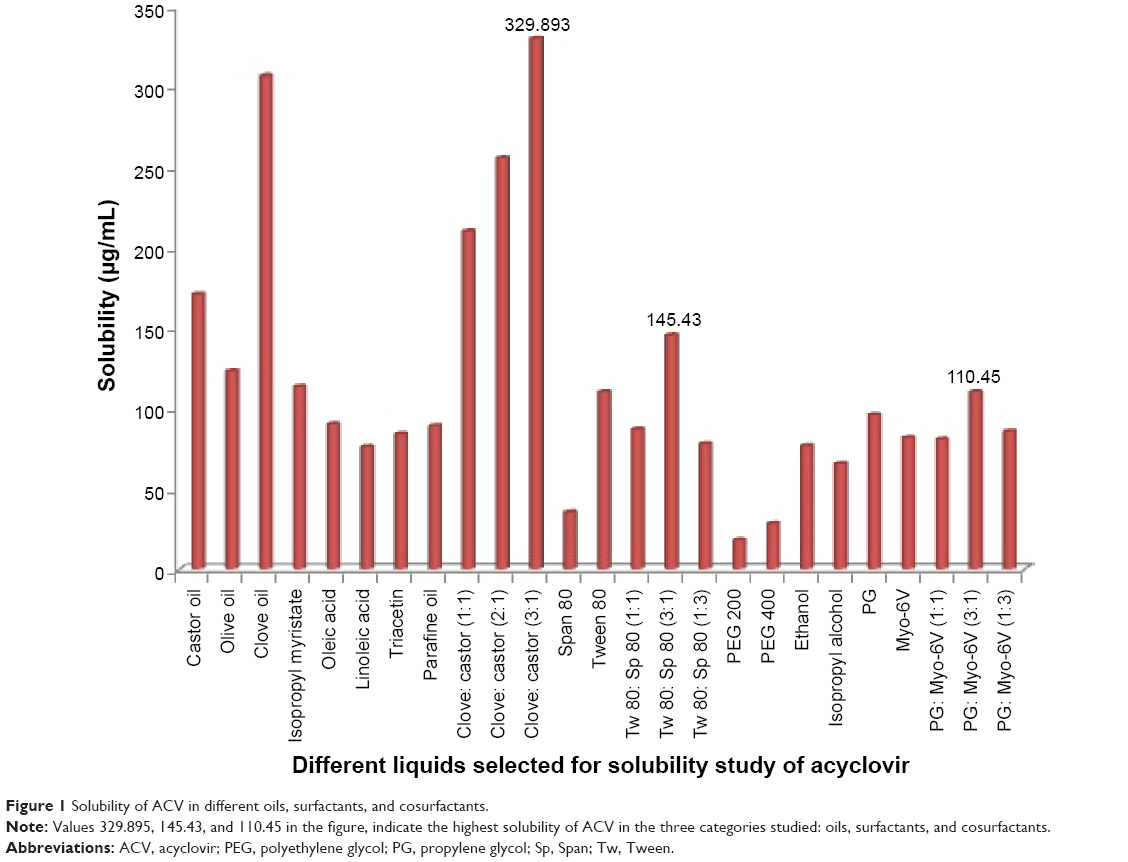 | Figure 1 Solubility of ACV in different oils, surfactants, and cosurfactants. |
Optimization of ACV-NE
The mixture experimental design was used to study and statistically optimize a ACV-loaded NE with a minimum globule size (Y). A three component-based system in 18 formulations was designed using: the percent of oil phase, ie, a mixture of clove oil and castor oil in a 3:1 ratio (X1); the percent of surfactant, ie, a mixture of Tween 80 and Span 80 in a 3:1 ratio (X2); and the percent of cosurfactants, ie, a mixture of propylene glycol and Myo-6V in a 3:1 ratio (X3) within the levels mentioned in Table 1. Each of the three components was used in ten different ratios with a total concentration of 100%. The selected components and their responses were correlated by regression equation and analyzed using Statgraphics Centurion XV version 15.2.05 statistical software.
The formulations were prepared and analyzed for globule size. The results varied from 41 nm in formula 7 to 241 nm in formula 5, and were used to fit the cubic model. Analysis of variance using the cubic model showed a statistically significant (P=0.0329) relationship between the components and globule size at the 95% confidence level. Response and contour plots showing the effects of the components on the globule size of NE were as demonstrated in Figure 2. Subsequently, variations on the mixture composition affected the globule size (Y). The regression equation for the fitted cubic model for the globule size showed positive values for the X1 and X2 components of the mixture, indicating their direct relationships with the globule size and the negative value of X3 indicates its inverse relationship with the globule size of NE.
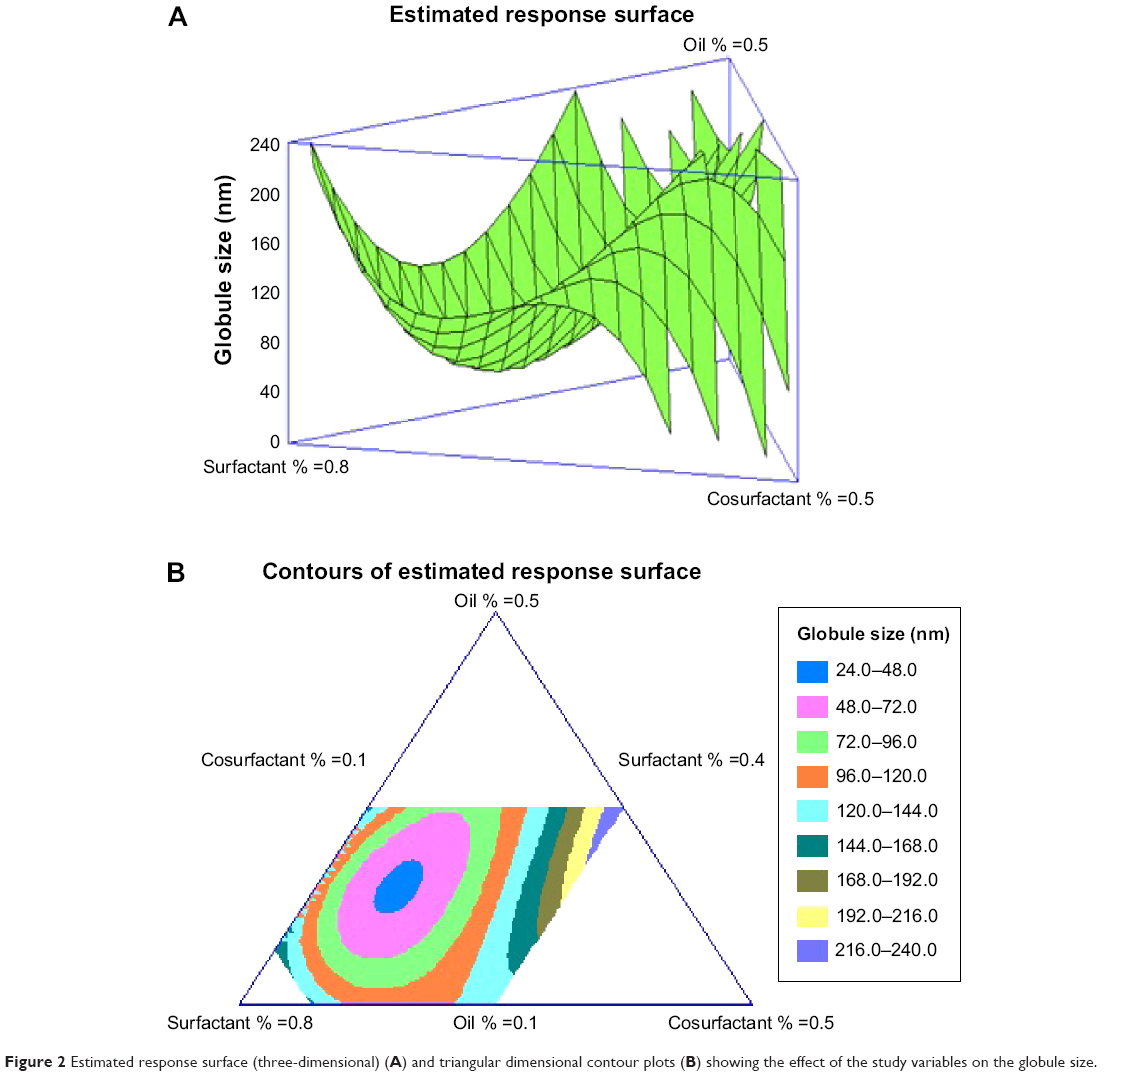 | Figure 2 Estimated response surface (three-dimensional) (A) and triangular dimensional contour plots (B) showing the effect of the study variables on the globule size. |
The percentage for the X1 and X3 components varied from 10% to 30% and the X2 percentage ranged from 40% to 75%. The cubic model was achieved for globule size (Y) and Equation 2 was calculated as follows:
|
|
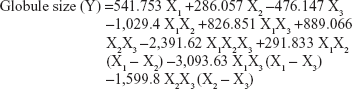
This equation and the triangular dimensional contour figure demonstrated that higher proportions of surfactant (X2) and lower proportions of both oil (X1) and cosurfactant (X3) minimized the globule size of the formulations. The blue area in the system close to the corner of surfactant in the triangle represents the minimum globule size of the formulations. The optimized formulation has been prepared according to the fitted regression Equation 2. The composition of this formulation appeared to contain 21.9% of X1, 61.6% of X2, and 16.5% of X3. The predicted and observed globule sizes were found to be 43.89 nm and 44.3 nm, respectively. The goal from this optimization process was set to minimize the globule size. The optimized formula for the ACV-loaded NE with the minimum globule size was used to prepare the ACV-NE hydrogel.
Response surface methodology for optimization of ACV-NE hydrogel
A Box–Behnken statistical design with three factors in three levels was used to study, optimize, and evaluate the main effects, interaction effects, and quadratic effects of the selected factors on the dependent variables. The molecular weight of gelling agent, ie, chitosan (X1); the percentage of chitosan (X2); and the percentage of Eugenol as a skin permeation enhancer (X3) were selected as the independent variables. The spreadability of hydrogel (Y1) and the percentage of ACV permeated through the rat skin after 2.5 hours (Y2) were chosen as the dependent variables.
Estimation of quantitative effects of the selected factors
For estimation of the quantitative effects of the selected factors, statistical analysis of Box–Behnken statistical design batches was carried out by multiple regression analysis and two-way analysis of variance using Statgraphics software. Table 4 shows the estimated effects of the selected factors, the F-ratios, and the associated P-values for the two responses resulting from analysis of variance.
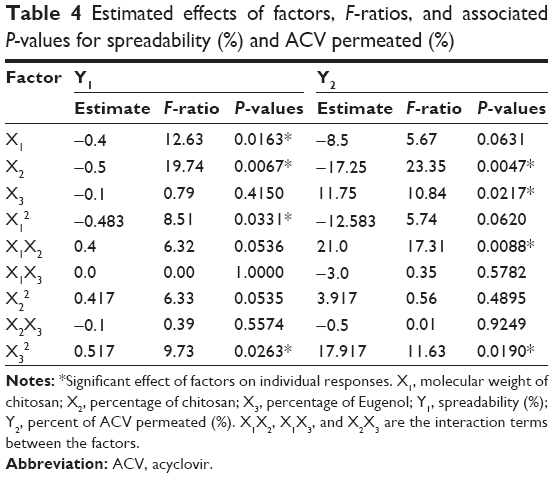 | Table 4 Estimated effects of factors, F-ratios, and associated P-values for spreadability (%) and ACV permeated (%) |
According to these results, X1 had a significant antagonistic effect on Y1 (P=0.0163), but had no significant effect on Y2. It was also found that X2 had a significant antagonistic effect on both responses (P=0.0067 for Y1 and P=0.0047 for Y2). On the other hand, X3 had a significant synergistic effect on Y2 (P=0.0217) with no significant effect on Y1. In addition, Y1 was significantly affected by the antagonistic effects of the quadratic term of X12 (P=0.0331) and the synergistic effect of the quadratic term of X32 (P=0.0263), while Y2 was significantly affected by the synergistic effect of both the interaction term of X1X2 and the quadratic term of X32 (P=0.0088 and P=0.0190, respectively). Finally, it was found that the interaction terms of X1X3 and X2X3 and the quadratic term of X22 had no significant effect on the studied responses.
Statistical analysis and mathematical modeling of the experimental data
The values for the responses regarding spreadability of hydrogel (Y1) and percentage of ACV permeated through the rat skin after 2.5 hours (Y2) were analyzed. The mathematical model for each response was generated and is shown in Equations 3 and 4:
|
|
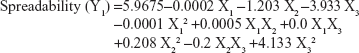
|
|
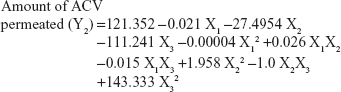
Equations 3 and 4 reflect the quantitative influence of the formulation variables, ie, the molecular weight of chitosan (X1), the percentage of chitosan (X2), and the percentage of Eugenol (X3), on the spreadability of the hydrogel (Y1) and the percentage of ACV permeated through rat skin after 2.5 hours (Y2).
Pareto charts was plotted to determine the effect of the independent variables, their interactions, and their quadratic effects on the dependent variables (Figure 3). The fact that the bar for the variable X2 extend after the reference line and has a relatively larger coefficient in the regression equations for both Y1 and Y2 which confirm the significant effect of the percentage of chitosan on each of the spreadability of the hydrogel and the percentage of ACV permeated through rat skin. As shown in the figure, X1 has an antagonistic effect on the spreadability of the hydrogel (Y1). Also, the quadratic term of the variable X32 had a significant effect on the spreadability of the hydrogel (Y1) and the percentage of ACV permeated through rat skin after 2.5 hours (Y2). On the other hand, X3 and the interaction term X1X2 significantly affected the percentage of ACV permeated through rat skin after 2.5 hours (Y2), while the quadratic term X12 affected significantly Y1.
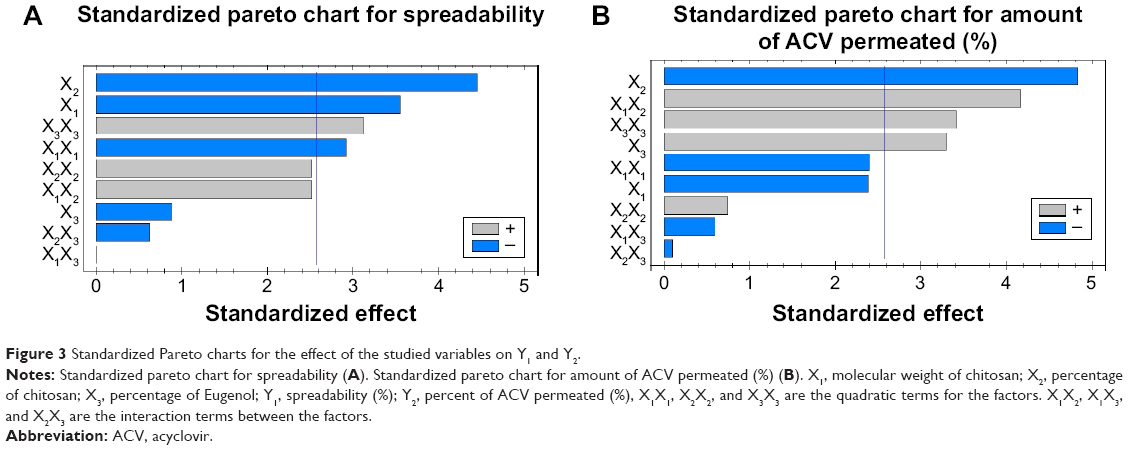 | Figure 3 Standardized Pareto charts for the effect of the studied variables on Y1 and Y2. |
Effects on spreadability (Y1)
The quality of a hydrogel depends on its spreadability. Moreover, the therapeutic efficiency of topical preparations is affected by the spreadability of a hydrogel because it helps in uniform application of the hydrogel to the skin. Spreadability is also considered as an important parameter in patient compliance. If the hydrogel takes less time to spread, it is a good hydrogel with a high spreadability value. The Y1 response ranged from 2.9 cm in F12 to 4.1 cm in F2, as shown in Table 3. An inverse relationship was found between X1 and Y1 and between X2 and Y1. Increasing the molecular weight of chitosan (X1) from 40 kDa to 850 kDa using the same concentrations of chitosan and Eugenol, decreased the spreadability (Y1) of the hydrogel from 4.1 in F2 to 3.2 in F3, from 3.0 in F11 to 2.9 in F12, from 3.6 in F4 to 3.3 in F10, and from 3.4 in F7 to 3.1 in F1. This may be explained by the increase in molecular weight of chitosan leading to increased viscosity of the obtained hydrogel, which decreases the spreadability of the hydrogel, in agreement with previous work.29 The same finding was observed with regard to the effect of concentration of chitosan (X2) on spreadability. When the concentration of chitosan (X2) increased from 1% to 3% in the formulations with the same level of the other factors, the spreadability (Y1) of the hydrogel decreased from 4.1 in F2 to 3.0 in F11, from 3.2 in F3 to 2.9 in F12, and from 4.0 in F5 to 3.6 in F8. The decrease in the spreadability of the hydrogel from 3.9 in F6 to 3.7 in F9 was also confirmed when the concentration of chitosan was increased, which may be attributed to the increased viscosity of the hydrogel, and is in accordance with previous work in which an oral mucosal gel was developed to facilitate local and systemic delivery of ACV for the treatment of oral herpes infection.25
Effects on percent of ACV permeated (Y2)
Percentage of drug permeated (Y2) ranged from 40% in F11 to 83% in F5 (Table 3). X2 and X3 had significant effects on the percentage of ACV permeated from the hydrogel, as displayed in the Pareto chart plot (Figure 3). An inverse relationship was found between X2 and Y2 and between X1 and Y2. Increasing the concentration of chitosan (X2) from 1% to 3% at the same molecular weight of chitosan, and the same concentration of Eugenol, decreased the percentage of ACV permeated from the hydrogel (Y2) from 72% in F2 to 40% in F11, from 83% in F5 to 59% in F8, and 75% in F6 to 52% in F9. This may be explained by the increased concentration chitosan leading to increased viscosity of the obtained hydrogel, which decreased the permeation of drug from the viscous hydrogel, which in agreement with previous work.30 On the other hand, there was a direct relationship between the concentration of Eugenol (X3) and the percent of ACV permeated (Y2). When the concentration of Eugenol (X3) increased from 0.25% to 0.75% in the formulations, keeping levels of the other factors the same, the percent of ACV permeated (Y2) from the hydrogel increased from 54% in F4 to 73% in F7, from 52% in F9 to 59% in F8, from 48% in F10 to 61% in F1, and from 75% in F6 to 83% in F5, which is in good agreement with the data reported by Mutalik and Udupa.31
Figure 4 showed three-dimensional response surface with contour plots of the estimated responses to demonstrate the influence of each factor on Y1 and Y2 graphically. The regression equation and the contours established that a lower molecular weight of chitosan (X1) and a lower concentration of chitosan (X2) at the mid-level of Eugenol (X3) maximized the spreadability of the hydrogel. Also, the percent of ACV permeated will be increased when a low molecular weight chitosan at its lower concentration, and higher concentration of Eugenol are used.
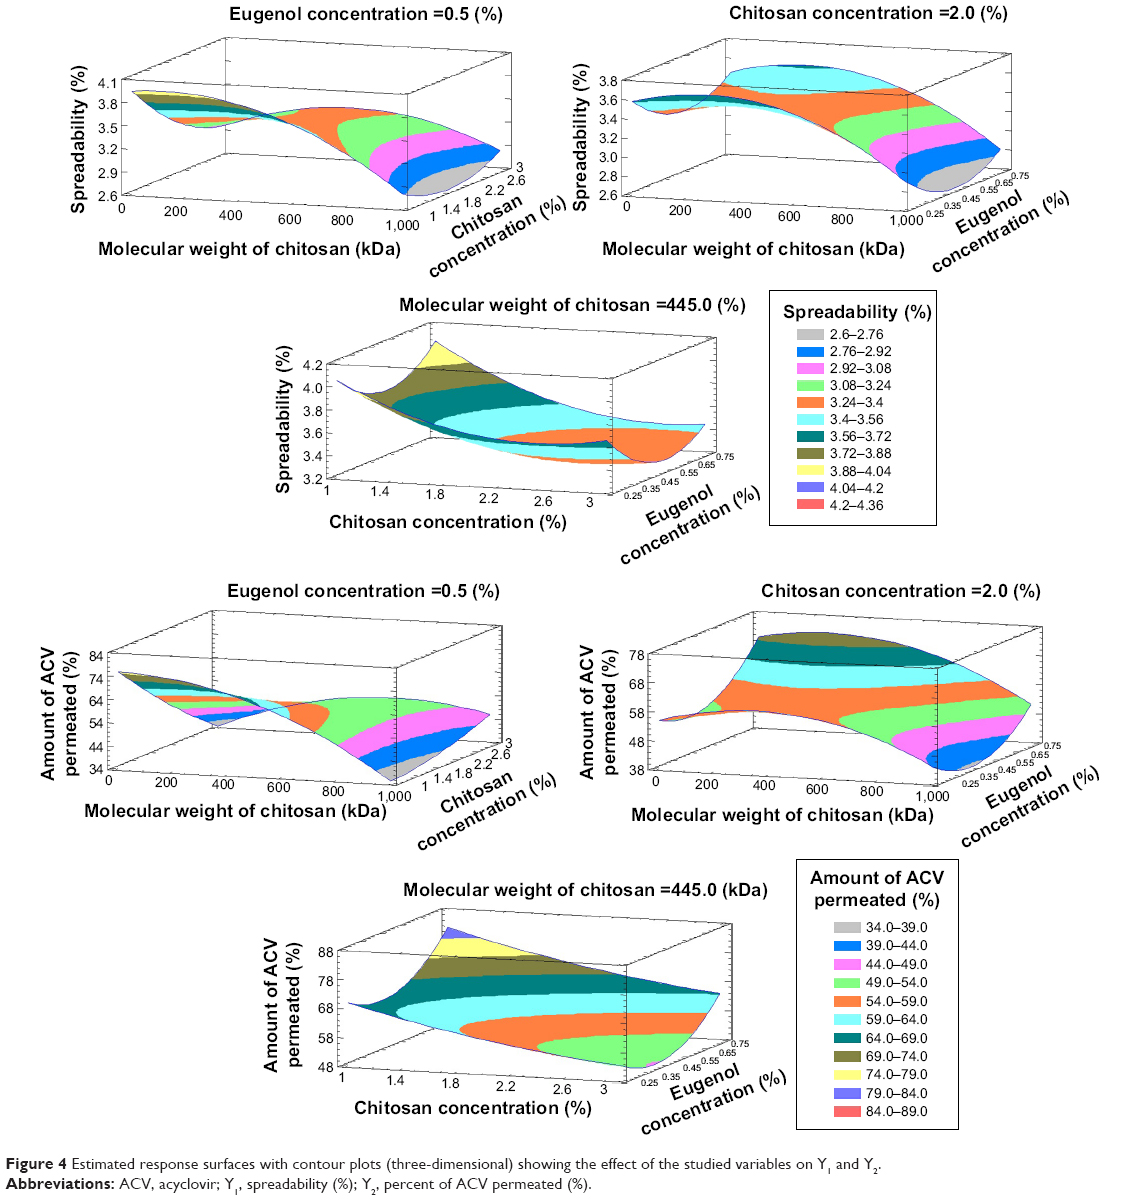 | Figure 4 Estimated response surfaces with contour plots (three-dimensional) showing the effect of the studied variables on Y1 and Y2. |
Prediction of optimized formulation
Analysis of experimental parameters was performed to achieve an optimum combination of the studied factors. The optimum formulation was suggested to contain 336.127 of X1, 1.013 of X2, and 0.745 of X3, and was prepared to confirm the validity of the calculated optimal parameters and predicted responses. The predicted values for Y1 and Y2 were 4.19 and 85.21, respectively, while the observed values were 3.95 and 86.15, respectively. From the obtained results, it can be concluded that the optimized combination of independent factors ensured the desired spreadability and the percent of ACV permeated. This finding also verified the reliability of the optimization procedure in development of an ACV-NE hydrogel with high quality attributes.
Ex vivo skin permeation of ACV from the optimized NE-based hydrogel
Figure 5 shows the skin permeability profiles for the optimized formula of ACV-NE hydrogel, the corresponding hydrogel containing 1% ACV, and the marketed ACV cream. The results indicated that the cumulative amounts of ACV permeated after 2.5 hours were 2,209, 1,047, and 1,406 μg/cm2 for the ACV-NE hydrogels, the corresponding gel containing 1% ACV, and the marketed ACV cream, respectively. The ACV-NE hydrogel showed twofold higher percentage permeation when compared to the control gel, and 1.5-fold higher percentage permeation when compared with the marketed cream. An amount of ACV not exceeding 10% was recovered, which could be attributed to retention of the drug in the skin layers. Table 5 shows the ACV permeation parameters for the different formulations. The steady-state flux, diffusion coefficient, and permeability coefficient for the ACV-NE hydrogel were higher than for either the marketed cream or the raw ACV hydrogel. Maximal enhancement of ACV permeation was obtained with the ACV-NE hydrogel formula. This could be due to incorporation of ACV as NE which is expected to penetrate the skin tissue and to exist intact in the skin tissue, thereby altering both the lipid and polar permeation pathways.32 Additionally, the hydrophilic domain of a NE can hydrate the external surface of the skin tissue to a greater extent and play an important role in drug uptake in tissues. When the aqueous fluid of an NE enters the polar pathway, it increases the interlamellar volume of the tissue lipid bilayer, resulting in disruption of its interfacial structure.33
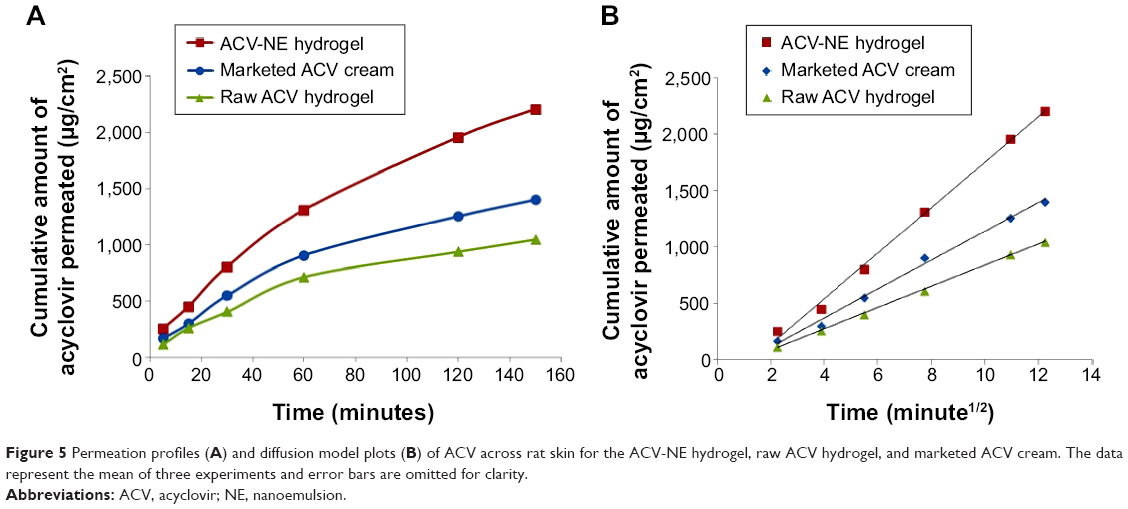 | Figure 5 Permeation profiles (A) and diffusion model plots (B) of ACV across rat skin for the ACV-NE hydrogel, raw ACV hydrogel, and marketed ACV cream. The data represent the mean of three experiments and error bars are omitted for clarity. |
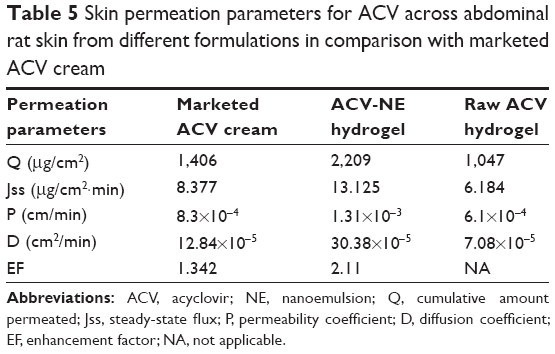 | Table 5 Skin permeation parameters for ACV across abdominal rat skin from different formulations in comparison with marketed ACV cream |
Pharmacokinetics studies of ACV-NE hydrogel
The plasma concentration-time profiles for ACV after transdermal administration of the different formulations are shown in Figure 6. The pharmacokinetic parameters for all groups were calculated using Kinetica version 5.0.11 software (Thermo Fisher Scientific Inc). The AUC total for the optimized ACV-NE hydrogel formulation was found to be 4,137 ng/mL·hour, which was significantly (P<0.05) greater than that of the marketed ACV cream (1,691 ng/mL·hour) and raw ACV hydrogel (773 ng/mL·hour). When the Cmax values were compared, significant augmentation (P<0.05) was observed for the ACV-NE (324.69 ng/mL) when compared with the hydrogel (123.64 ng/mL) and marketed cream (160.75 ng/mL). These results are in good agreement with the observed values for tmax and mean residence time. The tmax values were 6, 2, and 4 hours for the optimized ACV-NE hydrogel, raw ACV hydrogel, and marketed ACV cream, respectively, while the mean residence times were 11.539, 7.362, and 8.473 hours for the optimized ACV-NE hydrogel, raw ACV hydrogel, and marketed ACV cream, respectively. The enhanced bioavailability following transdermal administration of the ACV-NE formulations could be ascribed to a combination of the following factors. First, the NE vesicles allowed a delivery vector for ACV to cross the skin barrier. Second, the NE vesicles delivered ACV as a fine dispersion as opposed to the coarse particles delivered by raw ACV hydrogel, hence with an increased surface area and a reduced diffusion path length. Third, there was increased adhesion surface contact between the NE vesicles and the absorption site.34 Further, transdermal application of ACV-NE hydrogel on the rat skin was significantly different than other formulations at all of the time intervals (P<0.001); except at the first hour with the marketed ACV cream (P<0.05), (Figure 6). Moreover, enhancement of the steady-state flux, diffusion coefficient, and permeability coefficient with ACV-NE hydrogel, compared with the raw gel and marketed cream, were essential to improving the bioavailability of this formulation. This explains the enhancement of the relative bioavailability of ACV-NE hydrogel when compared with the marketed ACV cream and the raw ACV hydrogel.
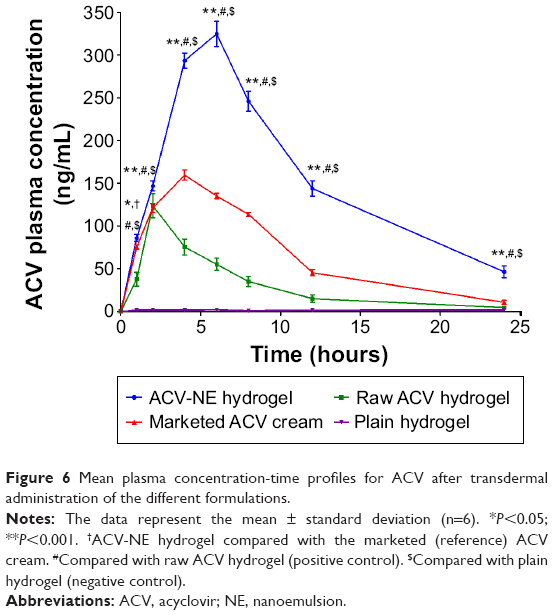 | Figure 6 Mean plasma concentration-time profiles for ACV after transdermal administration of the different formulations. |
The relative bioavailability of ACV-NE hydrogel was 535.2% and 244.6% with respect to the raw ACV hydrogel and marketed ACV cream, respectively. Thus, there is a 5.35-fold and 2.44-fold increase in the bioavailability of ACV, with the expectation to decrease the administered dose of drug to the patient, and subsequently minimize the the undesirable effects present with the administration of the large dose.
Conclusion
This study demonstrates that a NE formulation can be used to improve the bioavailability of ACV and overcome the difficulties associated with its use in the clinic. An optimized NE composed of 21.9% oil (a mixture of clove oil and castor oil in a ratio of 3:1), 61.6% surfactant (a mixture of Tween 80 and Span 80 in a ratio of 3:1), and 16.5% cosurfactant (a mixture of propylene glycol and PEG-6 oleate in a ratio of 3:1) had a globule size of 43 nm, and showed rapid emulsification and excellent thermodynamic stability. This optimized NE formula was incorporated into different hydrogel bases using a Box–Behnken design. ACV-NE hydrogels were prepared utilizing chitosan as the gelling agent and Eugenol as a skin permeation enhancer. The optimized NE hydrogel formula contained 1% medium molecular weight chitosan and 0.75% Eugenol as a penetration enhancer, successfully providing maximum spreadability and in vitro and ex vivo permeation, as well as enhancing the bioavailability of ACV in rats by twofold when compared with the marketed ACV cream. We recommend transdermal administration of this formulation of ACV-NE hydrogel for patients with herpes simplex virus infection due to the superior bioavailability of ACV.
Disclosure
The authors report no conflicts of interest in this work.
References
World Health Organization. WHO Model List of Essential Medicines 18th List; 2013. Available from: http://www.who.int/medicines/publications/essentialmedicines/en/index.html. Accessed May 9, 2015. | ||
Wilhelmus KR, Beck RW, Moke PS, et al. Acyclovir for the prevention of recurrent herpes simplex virus eye disease. N Engl J Med. 1998;339:300–306. | ||
Uchoa UB, Rezende RA, Carrasco MA, Rapuano CJ, Laibson PR, Cohen EJ. Long-term acyclovir use to prevent recurrent ocular herpes simplex virus infection. Arch Ophthalmol. 2003;121:1702–1704. | ||
Kristl A, Srcic S, Vrecer F, Sustar B, Vojnovic D. Polymorphism and pseudopolymorphism: influencing the dissolution properties of the guanine derivative acyclovir. Int J Pharm. 1996;139:231–235. | ||
von Plessing Rossel C, Carreño JS, Rodríguez-Baeza M, Alderete JB. Inclusion complex of the antiviral drug acyclovir with cyclodextrin in aqueous solution and in solid phase. Quim Nova. 2000;23:749–752. | ||
De Clercq E. Antivirals for the treatment of herpesvirus infections. J Antimicrob Chemother. 1993;32 Suppl A:121–132. | ||
Shah P, Bhalodia D, Shelat P. NE: a pharmaceutical review. Syst Rev Pharm. 2010;1(1):24. | ||
Anton N, Benoit J-P, Saulnier P. Design and production of nanoparticles formulated from nano-emulsion templates – a review. J Control Release. 2008;12:185–199. | ||
Forster T. Principles of emulsion formation. In: Rieger MM, Rhein LD, editors. Surfactants in Cosmetics. 2nd ed. New York, NY, USA: Marcel Dekker Inc; 1997. | ||
Ahmed OA, Badr-Eldin SM, Tawfik MK, Ahmed TA, El-Say KM, Badr JM. Design and optimization of self-nanoemulsifying delivery system to enhance quercetin hepatoprotective activity in paracetamol-induced hepatotoxicity. J Pharm Sci. 2014;103:602–612. | ||
El-Say KM, Ahmed TA, Badr-Eldin SM, Fahmy U, Aldawsari H, Ahmed OA. Enhanced permeation parameters of optimized nanostructured simvastatin transdermal films: ex vivo and in vivo evaluation. Pharm Dev Technol. July 14, 2014. [Epub ahead of print]. | ||
Gutiérrez JM, González C, Maestro A, Solè I, Pey CM, Nolla J. Nano-emulsions: new applications and optimization of their preparation. Curr Opin Colloid Interface Sci. 2008;13:245–251. | ||
Jadhav K, Shaikh I, Ambade K, Kadam V. Applications of microemulsion based drug delivery system. Curr Drug Deliv. 2006;3:267–273. | ||
Reddy RB, Kumari CTL, Sowjanya GN, Sindhuri S, Bandhav P. NEs an emerging trend: a review. Int J Pharm Res Dev. 2011;4:137–152. | ||
Peppas NA, Mikos AG. Preparation methods and structure of hydrogels. In: Peppas NA, editor. Hydrogels in Medicine and Pharmacy. Boca Raton, FL, USA: CRC Press; 1986. | ||
Bell CL, Peppas NA. Biomedical membranes from hydrogels and interpolymer complexes. In: Advances in Polymer Science. Volume 122. Berlin, Germany: Springer-Verlag; 1995. | ||
Ryu J-M, Chung S-J, Lee M-H, Kim C-K. Increased bioavailability of propranolol in rats by retaining thermally gelling liquid suppositories in the rectum. J Control Release. 1999;59:163–172. | ||
Sinha VR, Khosla L. Bioabsorbable polymers for implantable therapeutic systems. Drug Dev Ind Pharm. 1998;24:1129–1138. | ||
Cohen S, Lobel E, Trevgoda A, Peled Y. A novel in situ-forming ophthalmic drug delivery system from alginates undergoing gelation in the eye. J Control Release. 1997;44:201–208. | ||
Patel VR, Amiji MM. Preparation and characterization of freeze-dried chitosan-poly(ethylene oxide) hydrogels for site-specific antibiotic delivery in the stomach. Pharm Res. 1996;13:588–593. | ||
Lawrence MJ, Rees GD. Microemulsion-based media as novel drug delivery systems. Adv Drug Deliv Rev. 2000;45:89–121. | ||
Bachhav YG, Patravale VB. Microemulsion based vaginal gel of fluconazole: formulation, in vitro and in vivo evaluation. Int J Pharm. 2009;365:175–179. | ||
Al-Suwayeh SA, Taha EI, Al-Qahtani FM, Ahmed MO, Badran MM. Evaluation of skin permeation and analgesic activity effects of carbopol lornoxicam topical gels containing penetration enhancer. Scientific World Journal. 2014;2014:127495. | ||
Shibata N, Kitamura A, Yoshikawa Y, Inoue T, Bamba T, Takada K. Simultaneous determination of aciclovir and ganciclovir in plasma by HPLC and pharmacokinetic interactions. Pharm Pharmacol Commun. 2000;6:501–506. | ||
Chaudhary B, Verma S. Preparation and evaluation of novel in situ gels containing acyclovir for the treatment of oral herpes simplex virus infections. Scientific World Journal. 2014;2014:280928. | ||
Council for International Organization of Medical Sciences. International guiding principles for biomedical research involving animals, 2012. Available from: http://grants.nih.gov/grants/olaw/Guiding_Principles_2012.pdf. Accessed May 10, 2015. | ||
European Parliament. Directive 2010/63/EU of the European Parliament and of the Council of 22 September 2010 on the protection of animals used for scientific purposes. Available from: http://ec.europa.eu/environment/chemicals/lab_animals/legislation_en.htm. Accessed May 10, 2015. | ||
Padullés A, Colom H, Armendariz Y, et al. Determination of ganciclovir in human plasma by ultra performance liquid chromatography-UV detection. Clin Biochem. 2012;45:309–314. | ||
Şenyiğit ZA, Karavana SY, Eraç B, Gürsel Ö, Limoncu MH, Baloğlu E. Evaluation of chitosan based vaginal bioadhesive gel formulations for antifungal drugs. Acta Pharm. 2014;64:139–156. | ||
Williams AC, Barry BW. Penetration enhancers. Adv Drug Deliv Rev. 2004;56:603–618. | ||
Mutalik S, Udupa N. Effect of some penetration enhancers on the permeation of glibenclamide and glipizide through mouse skin. Pharmazie. 2003;58:891–894. | ||
Thacharodi D, Rao KP. Transdermal absorption of nifedipine from microemulsions of lipophilic skin penetration enhancers. Int J Pharm. 1994;111:235–240. | ||
Baboota S, Shakeel F, Ahuja A, Ali J, Shafiq S. Design, development and evaluation of novel NE formulations for transdermal potential of celecoxib. Acta Pharm. 2007;57:315–332. | ||
Huang C-T, Tsai M-J, Lin Y-H, et al. Effect of microemulsions on transdermal delivery of citalopram: optimization studies using mixture design and response surface methodology. Int J Nanomedicine. 2013;8:2295–2304. |
 © 2015 The Author(s). This work is published and licensed by Dove Medical Press Limited. The
full terms of this license are available at https://www.dovepress.com/terms.php
and incorporate the Creative Commons Attribution
- Non Commercial (unported, v3.0) License.
By accessing the work you hereby accept the Terms. Non-commercial uses of the work are permitted
without any further permission from Dove Medical Press Limited, provided the work is properly
attributed. For permission for commercial use of this work, please see paragraphs 4.2 and 5 of our Terms.
© 2015 The Author(s). This work is published and licensed by Dove Medical Press Limited. The
full terms of this license are available at https://www.dovepress.com/terms.php
and incorporate the Creative Commons Attribution
- Non Commercial (unported, v3.0) License.
By accessing the work you hereby accept the Terms. Non-commercial uses of the work are permitted
without any further permission from Dove Medical Press Limited, provided the work is properly
attributed. For permission for commercial use of this work, please see paragraphs 4.2 and 5 of our Terms.