Back to Journals » Therapeutics and Clinical Risk Management » Volume 17
Utilization of Healthcare Resources in Osteoarthritis: A Cost of Illness Analysis Based on Real-World Data in Italy
Authors Colombo GL ![]() , Heiman F, Peduto I
, Heiman F, Peduto I
Received 12 January 2021
Accepted for publication 15 March 2021
Published 21 April 2021 Volume 2021:17 Pages 345—356
DOI https://doi.org/10.2147/TCRM.S301005
Checked for plagiarism Yes
Review by Single anonymous peer review
Peer reviewer comments 2
Editor who approved publication: Professor Garry Walsh
Giorgio Lorenzo Colombo,1 Franca Heiman,2 Ilaria Peduto2
1CEFAT - Department of Drug Sciences, University of Pavia, Pavia, Italy; 2Real World Solutions, IQVIA Solutions Italy S.r.l., Milan, Italy
Correspondence: Ilaria Peduto
IQVIA Solutions Italy S.r.l., Via Fabio Filzi 29, Milan, 20124, Italy
Email [email protected]
Purpose: Understand the demographics and clinical features of patients with osteoarthritis (OA), quantify healthcare resource utilization by OA patients, and estimate the annual direct medical costs per OA patient from a National Health Service (NHS) perspective in Italy.
Patients and Methods: Retrospective observational cohort analysis using data from electronic medical records captured by the Italian IQVIA Longitudinal Patient Database (LPD). Only direct medical costs reimbursed by the NHS were considered. Patients were included if they received at least one diagnosis of OA during the period from January 1 to December 31, 2018. Each patient was observed for 3 years: a 24-month baseline period preceding the index date, and a 12-month follow-up period starting at the index date.
Results: A total of 71,467 patients met inclusion criteria: 43.98% had not been prescribed NSAIDs/opioids, 40.76% had been prescribed NSAIDs, and 15.26% an opioid. Mean age was 71.36 years, and 68.2% of the patients were women. At least one comorbidity was present in 91.34% of the patients; 38.05% were newly diagnosed with OA. During 1-year of follow-up, 173,884 prescriptions with an associated diagnosis of OA were found: 47.36% had been prescribed an NSAID, 9.11% diclofenac, 8.30% codeine+paracetamol, and 7.32% ketoprofen. Nearly 15% of the patients had at least 1 request for a specialist visit and 23.82% had at least 1 request for exams. Orthopedic visits accounted for 60% of all specialist visits. Yearly mean costs per patient were € 622, for approximately € 2.5 billion per year in direct costs, considering 3.9 million patients with OA in Italy. Protheses were a major driver in annual costs: € 143.45 in patients without a prosthesis and € 10,090.91 in those with a joint prosthesis.
Conclusion: This real-world analysis of direct costs of care of patients with OA in Italy confirms the substantial economic burden. Direct costs dramatically increased when joint replacement was needed.
Keywords: osteoarthritis, costs, real-world, Italy
Introduction
Osteoarthritis (OA) is one of the most common joint disorders, affecting roughly one-third of adults over the age of 65 years.1 The incidence and prevalence of OA increase with age, and depend on the site affected.2,3 For example, in Western countries over the age of 65 years, the structural OA of the hands is believed to present in more than half of the individuals, that of the knee in 33%, and of the hip in 5%.4,5 OA is characterized by failure of the synovial joint that leads to loss of articular cartilage, osteophyte formation, meniscal damage, ligamentous laxity, and changes in subchondral bone.2,3,6 OA is a chronic multifactorial condition comprising genetic, metabolic, biochemical, and biomechanical factors.3,6 In addition to age, the most common risk factors include obesity, joint injury, and individual structural features.3,6 Given the presence of its OA its hallmark symptom – pain – OA is a leading cause of disability globally affecting millions of individuals.1 In fact, OA is the single most common cause of disability in older adults.7
OA is classified as primary or secondary. The former includes idiopathic forms, while the latter comprises OA is which a causative factor is recognized (eg, trauma, bone deformity).3,6 Diagnosis of OA is based on history, physical examination, and characteristics of pain, and is often aided by plain radiographs and magnetic resonance imaging in selected cases depending on the site.3,8 The therapeutic management of OA is divided into four main categories: nonpharmacologic, pharmacologic, complementary, and surgical.3,8 As a general rule, a stepwise approach is adopted, in which least invasive therapies are attempted first, followed by more intensive and invasive treatments.9
Given its debilitating consequences, OA is associated with substantial socioeconomic burden.6,10 The individual burden is related to pain and limitations in activity, with a consequence decrease in the quality of life, as well as negative impact on mood, fatigue, and sleep.11 While the link is unclear, OA has also been associated with increased mortality12 and dramatic loss in quality-adjusted life years.13 Thus, in addition to intangible costs such as pain and activity limitations, OA is associated with significant direct and indirect costs.13
Considering direct costs, a study from France in 2005 reported that the direct costs of OA were €1.6 billion, amounting to 1.7% of all health expenditures in the country. An investigation in the United States (US) reported that patients with knee OA had a mean of six more physician visits and almost four more non-physicians visits per year compared to individuals without OA, with a 28% increase in hospital stays that can mostly be attributed to joint replacements.14 Drugs account for only about 10% of all direct costs, with the remainder due to physician visits, diagnostic procedures, and joint replacement surgery.15 Indeed, the costs of joint replacement surgery are staggering, and during the last decade, in the US the number of joint replacement procedures has doubled: over 1 million are now performed each year, with an estimated cost of $15 billion.16 Moreover, the costs of OA are anticipated to increase drastically due to expanding indications for the procedure to over 3 million annually in the US by 2030.17 The indirect costs of OA are also high, with contributions to absenteeism from work, loss of productivity, and early retirement.18–21 In a study from 2009, the aggregate increase in total direct plus indirect costs associated with OA was estimated at $185.5 billion.22
In Italy, there is a knowledge gap regarding economic burden of the disease in a real-world setting. The last study conducted in Italy dates to 2004, reporting that the direct costs of OA were €934 per patient per year: €233 for hospitalization, €209 for diagnostic procedures, €46 on therapy, and €346 on non-medical costs.23 To shed more light on this and provide an updated analysis health economic analysis, we performed a real-world analysis on utilization of healthcare resources of OA in Italy. The overall objectives were to understand the demographics and clinical features of OA patients, quantify healthcare resource utilization by OA patients, and estimate the annual direct medical costs per OA patient from a National Health Service (NHS) perspective.
Patients and Methods
Data and Cost Sources
This was a retrospective observational cohort analysis using data from electronic medical records captured by the Italian IQVIA Longitudinal Patient Database (LPD). IQVIA LPD is a computerized network of general practitioners (GPs) in different European countries feeding a centralized database with anonymous data on patient consultations and treatments. The information, which is gathered continuously and in real time, allows patients and physicians to be longitudinally monitored in order to analyze management in real-life situations. Drug prescriptions and medical diagnoses are both coded directly by GPs. Drugs prescriptions comply with the Anatomical Therapeutic and Chemical (ATC) classification system, while medical diagnoses comply with the ninth edition of International Classification of Disease Clinical Modification (ICD-9-CM). Currently, ~900 primary care practitioners contribute to the Italian IQVIA LPD, providing data from routinely collected records of ~1.2 million patients.
Only direct medical costs reimbursed by the NHS were included in the analysis. These comprise the following. 1) Pharmaceutical treatments for OA. Drug acquisition costs for branded products were derived from national price lists, and public prices were used (net of mandatory reductions regulated by AIFA).24 For generic drugs, we considered prices from the Agenzia Italiana del Farmaco (AIFA) Transparency List which indicates medicines that are reimbursed by the NHS on the basis of the reference price system. 2) Hospitalization for OA. Costs were derived from the last national DRG Tariffs System from the Italian Ministry of Health of 2013.25 This system quantifies the use of resources and provides an estimate of the cost per acute event from the NHS perspective. 3) Outpatient specialist visits and exams for OA. Costs were based on the last available “2013 National Tariff Nomenclator”.26 4) GP visits for OA retrieved from Dal Negro, 201627 and inflated to 2019 prices according to the ISTAT consumer price index.28 5) Joint prothesis. We considered a cost of €8992.50, which is a weighted mean cost based on the 2018 discharge number of DRGs:29 replacement of major joints or reimplantation of lower limbs (€8837);25 revision of hip or knee replacement (€11,152).25 Further details on unit costs are shown in Supplementary Data (Table S1).
Patients Population
Patients were included in the analysis if they received at least one diagnosis of OA (defined as a diagnosis falling into the ICD-9-CM code 715.xx) during the period from January 1 to December 31, 2018. The date of the first OA diagnosis during the selection period was considered as the index date. To be included in the analysis, patients had to have: 1) an age more than 18 years at the index date; 2) at least 2 years of available data before the index date and 1 year after the index date. Each patient was observed for 3 years: a 24-month baseline period preceding the index date, and a 12-month follow-up period starting at the index date.
OA Pharmaceutical Groups
OA patients were classified into three different groups depending on treatments received during follow-up. In particular, patients who had prescriptions of opioids (ATC code following into the N02A class) with an associated diagnosis of OA during follow-up were classified as “opioid patients”; patients who were prescribed with non-steroidal anti-inflammatory drugs (NSAIDs) (ATC code following into the M01A class) for OA and not opioids during follow-up were classified as “NSAID patients”; patients who were not prescribed neither with opioids, nor with NSAIDs were classified as “no opioid/NSAID patients”.
Naïve Patients
Patients without a diagnosis of OA during the pre-selection period, ie, the 2-year period preceding the index date, were defined as new OA patients.
Statistical Analysis
The patient characteristics analyzed included demographics (gender, age, BMI), clinical features (diagnosis, OA treatment, comorbidity) and healthcare resource utilization (registration of exams, visit and joint prothesis during follow-up). Details on ICD-9-CM codes used in the analysis are shown in Supplementary Data Table S2. Descriptive statistical analyses, stratified by the OA pharmaceutical group, were used. Qualitative variables were described in terms of frequencies and percentages, while quantitative variables as mean value, standard deviation (SD), median, minimum and maximum. All analyses were performed using SAS® software version 9.4.
Results
Demographic and Clinical Characteristics
Details on selection of the patient population are shown in Figure 1. During the analysis period, a total of 78,811 patients received a diagnosis of OA. Of these 71,467 (90.68%) were included and the remainder were excluded as they did not meet inclusion criteria. And, 43.98% of the patients had not been prescribed NSAIDs/opioids, 40.76% had been prescribed NSAIDs, and 15.26% had taken an opioid.
 |
Figure 1 Selection of the patient population. |
Demographic and clinical characteristic are shown in Table 1. Mean age of the entire population was 71.36 years, and the majority of patients were women (68.2%); 59.6% of the patients were >70 years old, while <5% were less than 50 years of age. BMI was available in 68.44% of patients BMI, and of these 70% were overweight or obese. During 2-year preceding index date, at least one comorbidity was present in 91.34% of the patients (Figure 2), with the most common comorbidities being cardiovascular and musculoskeletal diseases, and 38.05% of patients were newly diagnosed with OA. This proportion increased considering no opioids/NSAIDs group of treatment (50.35%).
 |
Table 1 Demographical and Clinical Characteristics of the Population with OA |


Healthcare Resource Utilization
IQVIA LPD database analysis identified 173,884 patients with a diagnosis of OA between January 1 and December 31, 2018 (Table 2). Of all prescriptions, 47.36% were for patients who had been prescribed an NSAID. The most prescribed agents were NSAIDs and opioids: 9.11% of all prescriptions were for diclofenac, followed by codeine+paracetamol (8.30%) and ketoprofen (7.32%).
 |
Table 2 Healthcare Resource Utilization During Follow-Up |
Less healthcare resources were recorded by GPs in patients with an NSAID prescription compared to those with no NSAIDs/opioids or an opioid. Almost 15% of all OA patients had at least one request for a specialist visit and 23.82% had at least one request for exams during follow-up. Only 2.31% of the patients had at least one registration of hospitalization during follow-up. Rehabilitation was the second most recorded hospitalization by GPs and was more frequent among patients prescribed an opioid (9.93% versus 8.14% and 6.58% in the no NSAID/opioid and opioid groups, respectively; data not shown). Radiographs were the most common exams requested among all patients, with no significant differences considering pharmaceutical treatments of OA, accounting for 39.14% of all requested exams for patients who were not prescribed NSAIDs/opioids compared to 41.99% and 37.48% of those prescribed with NSAID and opioids, respectively (data not shown). Orthopedic visits were the most frequent visit requested by GPs, involving 60% of the total number of specialist visits, followed by physical therapists (26.32%) (data not shown). During the first year of follow-up, 57.13% of the patients prescribed an opioid had ≥3 GP visits compared to 30.85% of the patients prescribed an NSAID and 11.56% of those receiving neither. Moreover, almost 5% of the patients have been undergone a prothesis intervention during follow-up. Higher proportion of opioid patients with a prothesis than other groups was observed (6.5%, 3.2%, 5.7% for opioids, NSAIDs, and no opioids/NSAID, respectively).
Annual Costs per Patient
Yearly mean costs per OA patient were €622, which varied substantially depending on pharmaceutical group (Table 3). Costs were lowest for patients who had been prescribed an NSAID and highest in those receiving an opioid (Figure 3). In this latter group, hospitalization accounted for a larger proportion of costs than in the other two groups. Protheses were a major driver in annual costs, which were €143.45 in patients without a prosthesis and €10,090.91 in those with a joint prosthesis (Table 4). A breakdown of costs in patients with and without a prosthesis are shown in Figure 4. Hospitalization costs were 47% of all costs in patients without a prosthesis compared to 10% in those with a prosthesis in which the prosthesis accounted of 89% of total costs.
 |
Table 3 Annual Costs per Patient, Stratified by OA Pharmaceutical Group, in Euro |
 |
Table 4 Annual Costs per Patient, Stratified by Patient with and without Joint Prothesis in Euro |


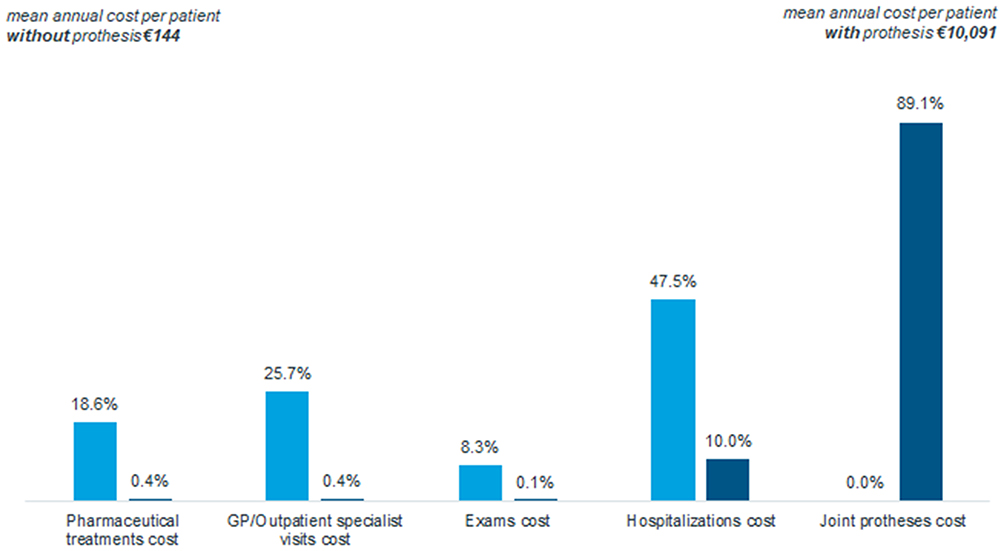 |
Figure 4 Distribution of costs in patients with and without a joint prosthesis. |


Discussion
The present analysis of real-world data from Italy found that, as expected, the majority of patients were elderly with a mean age of 71 years and that most were female; cardiovascular and other musculoskeletal diseases were common comorbidities. Moreover, almost 40% of all patients were newly diagnosed. Patients treated with an opioid were older and had even more comorbidities that those receiving less intensive therapy. The group of patients receiving an opioid also had more hospitalizations and joint prostheses, while those receiving an NSAID underwent more specialist visits and exams. Mean yearly costs were €622 but varied greatly depending on the prescription received. As might be expected, prostheses were a major driver of costs in these patients: costs were 70 times higher in those with a prosthesis compared to those without one.
Considering data from January 1, 2019 in which the Italian population was 60,359,546 and the proportion of patients with OA found in our analysis, there are roughly 3.9 million patients in Italy with OA.30 For yearly mean costs of €622/patient, this would mean that the NHS spends approximately €2.5 billion per year in direct costs for these patients. As joint prostheses account for 70% of costs, it can be estimated that the total expenditure for joint prostheses is €1.7 billion. Moreover, these estimates appear to be relatively accurate since expenditure data from 2018 reported that the combined costs for replacement of major joints or reimplantation of lower limbs and revision of hip or knee replacement were €1.705 billion.25
The cost estimates found herein are largely in line with other studies in different countries. In a systematic review from 2015 that analyzed the economic costs of OA, the annual incremental healthcare costs of osteoarthritis varied from €705 to €19,715, depending on the particular geographic setting, that amounted to 0.25–0.5% of a country’s gross domestic product (GDP).31 Similarly, another systematic review reported that annual total costs per patient of lower limb OA ranged from €700 to €12,000.32 Costs of OA in the US have been reported to vary from $1442 to $21,335.33 In Spain, an analysis in 2009 however reported that total direct costs of OA per patients were €1502, with total national costs of 4.74 billion, or 0.5% of GDP.34 The study also noted that higher total costs were seen in patients with comorbid conditions. In France, the COART study carried out in 2002 calculated that the total direct costs of OA exceeded €1.6 billion, or 1.7% of the total expenditure of the entire national healthcare system.35 In the UK, the costs of joint replacement alone for patients with OA was £852 million, further noting that arthritis is the most common condition for receipt of the country’s disability living allowance.36
In this regard, in our population, the vast majority of patients had at least one comorbidity. In an analysis of comorbidities and direct medical costs, it was reported that compared to a control group without OA, those with OA had more comorbidities such as musculoskeletal, neuropathic pain, depression, anxiety, and sleep disorders.37 Patients with OA also received more treatments for pain and treatment of comorbidities, leading to an increase in direct medical costs that was twice as high versus those with no OA. While our analysis considered all medical costs prescribed by the patient’s GP for OA, it would be interesting to extend this analysis to include all GP prescriptions, and possibly compare direct costs to another disease.
Joint replacement was a major source of costs in our analysis. However, despite these massive costs, a number of studies have concluded that these interventions may be considered as cost effective.38–40 A very recent PRISMA systematic review also concluded that total hip arthroplasty is a cost-effective option for hip osteoarthritis.41 Some of these analyses have considered both direct and indirect costs. This is not a trivial point since the indirect costs of OA are substantial.42 In fact, in the study from Italy from 2004 while direct yearly costs were €934, yearly indirect costs, including lost productivity of patients and caregivers, were nearly 30% greater, amounting to €1236.23 Another study reported that indirect costs were similar or even greater than direct costs for OA across Asia.43 A health economic analysis of costs for OA in the US further confirmed that the disease is associated with substantial economic burden considering costs of medical care, drugs, and indirect work loss.44 Total knee replacement is also seen as an effective intervention that is cost effective at low and high levels of improvement.45
Our real-world analysis has some limitations that may have led to an underestimation of the actual costs of OA. First, we analyzed only direct costs of specialist visits, exams, and drug therapies that were prescribed by a GP, and any additional treatments or exams that were not prescribed by the GP, such as by a specialist for example, were not included in the database. In particular, other authors considered also therapies such as hyaluronic acid injections and platelet-rich plasma,46 however not being administered by GPs they are not recorded in IQVIA LPD. Second, drugs that were not reimbursed drugs were not considered among costs. In addition, since reporting a hospitalization to the patient’s GP is not mandatory, the costs of hospitalizations that the GP was not aware of could not be included. Third, cost variability due to different OA severity of patients cannot be analyzed since the database does not have such information. Lastly, while not a limitation, we note that indirect costs are not recorded in database.
In conclusion, this updated real-world analysis of direct costs associated with care of patients in Italy confirms the substantial economic burden of OA, substantially depending on the medical therapy prescribed. Furthermore, direct costs also dramatically increased when joint replacement was needed.
Data Sharing Statement
The data that support the findings of this analysis are available from IQVIA, but restrictions apply to the availability of these data, which were used under license for the current analysis, and so are not publicly available. Data are, however, available from the corresponding author upon reasonable request and with permission of IQVIA.
Ethics Approval and Informed Consent
IQVIA LPD is fed by 900 GPs who, in line with Italian law requirements, use an ambulatory management software to record information related to their patients’ visits and for reimbursement purposes according to their usual clinical practice. IQVIA LPD data are not ad hoc collected for studies purposes and there is no sponsor. Being so, all the analyses conducted on IQVIA LPD data do not require an approval by an Ethical Committee. Indeed, LPD relies on anonymous data which are not originated by any clinical trial. Before being stored into IQVIA databases, data are anonymized through a non-identifiable encryption process directly on GPs’ computer, and patients’ names are not collected into IQVIA LPD. IQVIA LPD complies with the European Regulation 679/2016 and the ex-Legislative Decree 196/03 and subsequent modifications.
Acknowledgments
All authors made substantial contributions to conception and design and interpretation of data. Ilaria Peduto performed analyses. All authors took part in drafting the article or revising it critically for important intellectual content.
Funding
This research was sponsored by Pfizer Srl.
Disclosure
Franca Heiman and Ilaria Peduto are employees of IQVIA which received financial support to develop this manuscript. Giorgio Lorenzo Colombo has received speaker fees, research and educational grants from Abbott, Amgen, EISAI, Jazzpharma, LEO Pharma, Novo Nordisk, Merck Sharp and Dompé, Menarini, Otsuka and Pfizer. The authors report no other conflicts of interest in this work.
References
1. Neogi T. The epidemiology and impact of pain in osteoarthritis. Osteoarthritis Cartilage. 2013;21(9):1145–1153. doi:10.1016/j.joca.2013.03.018
2. Mandl LA. Osteoarthritis year in review 2018: clinical. Osteoarthritis Cartilage. 2019;27(3):359–364. doi:10.1016/j.joca.2018.11.001
3. Martel-Pelletier J, Barr AJ, Cicuttini FM, et al. Osteoarthritis. Nat Rev Dis Primers. 2016;2(1):16072. doi:10.1038/nrdp.2016.72
4. Felson DT, Naimark A, Anderson J, Kazis L, Castelli W, Meenan RF. The prevalence of knee osteoarthritis in the elderly. The Framingham Osteoarthritis Study. Arthritis Rheum. 1987;30(8):914–918. doi:10.1002/art.1780300811
5. van Saase JL, van Romunde LK, Cats A, Vandenbroucke JP, Valkenburg HA. Epidemiology of osteoarthritis: zoetermeer survey. Comparison of radiological osteoarthritis in a Dutch population with that in 10 other populations. Ann Rheum Dis. 1989;48(4):271–280. doi:10.1136/ard.48.4.271
6. Glyn-Jones S, Palmer AJ, Agricola R, et al. Osteoarthritis. Lancet. 2015;386(9991):376–387. doi:10.1016/S0140-6736(14)60802-3
7. World Health Organization. Available from: https://www.who.int/medicines/areas/priority_medicines/Ch6_12Osteo.pdf.
8. Sinusas K. Osteoarthritis: diagnosis and treatment. Am Fam Physician. 2012;85(1):49–56.
9. Kolasinski SL, Neogi T, Hochberg MC, et al. 2019 American college of rheumatology/arthritis foundation guideline for the management of osteoarthritis of the hand, hip, and knee. Arthritis Rheum. 2020;72(2):220–233. doi:10.1002/art.41142
10. Hermann W, Lambova S, Muller-Ladner U. Current treatment options for osteoarthritis. Curr Rheumatol Rev. 2018;14(2):108–116. doi:10.2174/1573397113666170829155149
11. Hunter DJ, Schofield D, Callander E. The individual and socioeconomic impact of osteoarthritis. Nat Rev Rheumatol. 2014;10(7):437–441. doi:10.1038/nrrheum.2014.44
12. Nuesch E, Dieppe P, Reichenbach S, Williams S, Iff S, Juni P. All cause and disease specific mortality in patients with knee or hip osteoarthritis: population based cohort study. BMJ. 2011;342(mar08 2):d1165. doi:10.1136/bmj.d1165
13. Losina E, Walensky RP, Reichmann WM, et al. Impact of obesity and knee osteoarthritis on morbidity and mortality in older Americans. Ann Intern Med. 2011;154(4):217–226. doi:10.7326/0003-4819-154-4-201102150-00001
14. Wright EA, Katz JN, Cisternas MG, Kessler CL, Wagenseller A, Losina E. Impact of knee osteoarthritis on health care resource utilization in a US population-based national sample. Med Care. 2010;48(9):785–791. doi:10.1097/MLR.0b013e3181e419b1
15. Hiligsmann M, Cooper C, Arden N, et al. Health economics in the field of osteoarthritis: an expert’s consensus paper from the European Society for Clinical and Economic Aspects of Osteoporosis and Osteoarthritis (ESCEO). Semin Arthritis Rheum. 2013;43(3):303–313. doi:10.1016/j.semarthrit.2013.07.003
16. Agency for Healthcare Research and Quality. Healthcare cost and utilization project: Nationwide Inpatient Sample (NIS), 1999– 2008 [online]; 2012. Available from: http://www.ahrq.gov/data/hcup/.
17. Kurtz S, Ong K, Lau E, Mowat F, Halpern M. Projections of primary and revision hip and knee arthroplasty in the United States from 2005 to 2030. J Bone Joint Surg Am. 2007;89(4):780–785. doi:10.2106/00004623-200704000-00012
18. Dunlop DD, Manheim LM, Yelin EH, Song J, Chang RW. The costs of arthritis. Arthritis Rheum. 2003;49(1):101–113. doi:10.1002/art.10913
19. Kotlarz H, Gunnarsson CL, Fang H, Rizzo JA. Osteoarthritis and absenteeism costs: evidence from US national survey data. J Occup Environ Med. 2010;52(3):263–268. doi:10.1097/JOM.0b013e3181cf00aa
20. Li X, Gignac MA, Anis AH. The indirect costs of arthritis resulting from unemployment, reduced performance, and occupational changes while at work. Med Care. 2006;44(4):304–310. doi:10.1097/01.mlr.0000204257.25875.04
21. Zhang W, Gignac MA, Beaton D, Tang K, Anis AH; Canadian Arthritis Network Work Productivity G. Productivity loss due to presenteeism among patients with arthritis: estimates from 4 instruments. J Rheumatol. 2010;37(9):1805–1814. doi:10.3899/jrheum.100123
22. Kotlarz H, Gunnarsson CL, Fang H, Rizzo JA. Insurer and out-of-pocket costs of osteoarthritis in the US: evidence from national survey data. Arthritis Rheum. 2009;60(12):3546–3553. doi:10.1002/art.24984
23. Leardini G, Salaffi F, Caporali R, et al. Direct and indirect costs of osteoarthritis of the knee. Clin Exp Rheumatol. 2004;22(6):699–706.
24. AIFA. Elenchi di farmaci di classe A e H; November 15, 2019. Available from: https://www.aifa.gov.it/liste-farmaci-a-h.
25. Ministero della salute. Principali caratteristiche DRG; April 8, 2013. Available from: http://www.salute.gov.it/portale/temi/p2_6.jsp?lingua=italiano&id=1349&area=ricoveriOspedalieri&menu=sistema.
26. Ministero della salute. Nomenclatore dell’assistenza specialistica ambulatoriale; April 8, 2013. Available from: http://www.salute.gov.it/portale/temi/p2_6.jsp?lingua=italiano&id=1767&area=programmazioneSanitariaLea&menu=vuoto.
27. Dal Negro RW, Distante C, Bonadiman L, Turco P, Iannazzo S. Cost of persistent asthma in Italy. Multidiscip Respir Med. 2016;11(1):44. doi:10.1186/s40248-016-0080-1
28. ISTAT. Rivaluta ISTAT. Available from: http://rivaluta.istat.it:8080/Rivaluta/.
29. Ministero della salute. Tavole Rapporto SDO 2018; January 16, 2020. Available from: http://www.salute.gov.it/portale/documentazione/p6_2_8_3_1.jsp?lingua=italiano&id=33.
30. ISTAT. Available from: http://dati.istat.it/Index.aspx?DataSetCode=DCIS_POPRES1#.
31. Puig-Junoy J, Ruiz Zamora A. Socio-economic costs of osteoarthritis: a systematic review of cost-of-illness studies. Semin Arthritis Rheum. 2015;44(5):531–541. doi:10.1016/j.semarthrit.2014.10.012
32. Salmon JH, Rat AC, Sellam J, et al. Economic impact of lower-limb osteoarthritis worldwide: a systematic review of cost-of-illness studies. Osteoarthritis Cartilage. 2016;24(9):1500–1508. doi:10.1016/j.joca.2016.03.012
33. Xie F, Kovic B, Jin X, He X, Wang M, Silvestre C. Economic and humanistic burden of osteoarthritis: a systematic review of large sample studies. Pharmacoeconomics. 2016;34(11):1087–1100. doi:10.1007/s40273-016-0424-x
34. Loza E, Lopez-Gomez JM, Abasolo L, et al. Economic burden of knee and hip osteoarthritis in Spain. Arthritis Rheum. 2009;61(2):158–165. doi:10.1002/art.24214
35. Le Pen C, Reygrobellet C, Gerentes I. Financial cost of osteoarthritis in France. The “COART” France study. Joint Bone Spine. 2005;72(6):567–570. doi:10.1016/j.jbspin.2005.01.011
36. Chen A, Gupte C, Akhtar K, Smith P, Cobb J. The global economic cost of osteoarthritis: how the UK compares. Arthritis. 2012;2012:698709. doi:10.1155/2012/698709
37. Gore M, Tai KS, Sadosky A, Leslie D, Stacey BR. Clinical comorbidities, treatment patterns, and direct medical costs of patients with osteoarthritis in usual care: a retrospective claims database analysis. J Med Econ. 2011;14(4):497–507. doi:10.3111/13696998.2011.594347
38. Clarke A, Pulikottil-Jacob R, Grove A, et al. Total hip replacement and surface replacement for the treatment of pain and disability resulting from end-stage arthritis of the hip (review of technology appraisal guidance 2 and 44): systematic review and economic evaluation. Health Technol Assess. 2015;19(10):
39. Kamaruzaman H, Kinghorn P, Oppong R. Cost-effectiveness of surgical interventions for the management of osteoarthritis: a systematic review of the literature. BMC Musculoskelet Disord. 2017;18(1):183. doi:10.1186/s12891-017-1540-2
40. Xie F, Tanvejsilp P, Campbell K, Gaebel K. Cost-effectiveness of pharmaceutical management for osteoarthritis pain: a systematic review of the literature and recommendations for future economic evaluation. Drugs Aging. 2013;30(5):277–284. doi:10.1007/s40266-013-0062-3
41. Agarwal N, To K, Khan W. Cost effectiveness analyses of total hip arthroplasty for hip osteoarthritis: a PRISMA systematic review. Int J Clin Pract. 2020;e13806.
42. Bitton R. The economic burden of osteoarthritis. Am J Manag Care. 2009;15(8 Suppl):S230–235.
43. Xie F, Thumboo J, Fong KY, et al. Direct and indirect costs of osteoarthritis in Singapore: a comparative study among multiethnic Asian patients with osteoarthritis. J Rheumatol. 2007;34(1):165–171.
44. White AG, Birnbaum HG, Janagap C, Buteau S, Schein J. Direct and indirect costs of pain therapy for osteoarthritis in an insured population in the United States. J Occup Environ Med. 2008;50(9):998–1005. doi:10.1097/JOM.0b013e3181715111
45. Waimann CA, Fernandez-Mazarambroz RJ, Cantor SB, et al. Cost-effectiveness of total knee replacement: a prospective cohort study. Arthritis Care Res (Hoboken). 2014;66(4):592–599. doi:10.1002/acr.22186
46. Landi S, Landa P, Russo S. Economic evaluation of platelet-rich-plasma versus hyaluronic acid for the treatment of knee osteoarthritis. Scenarios to 1 and 5 years. GRHTA. 2016;4(1):11.
 © 2021 The Author(s). This work is published and licensed by Dove Medical Press Limited. The
full terms of this license are available at https://www.dovepress.com/terms
and incorporate the Creative Commons Attribution
- Non Commercial (unported, 3.0) License.
By accessing the work you hereby accept the Terms. Non-commercial uses of the work are permitted
without any further permission from Dove Medical Press Limited, provided the work is properly
attributed. For permission for commercial use of this work, please see paragraphs 4.2 and 5 of our Terms.
© 2021 The Author(s). This work is published and licensed by Dove Medical Press Limited. The
full terms of this license are available at https://www.dovepress.com/terms
and incorporate the Creative Commons Attribution
- Non Commercial (unported, 3.0) License.
By accessing the work you hereby accept the Terms. Non-commercial uses of the work are permitted
without any further permission from Dove Medical Press Limited, provided the work is properly
attributed. For permission for commercial use of this work, please see paragraphs 4.2 and 5 of our Terms.