Back to Journals » Clinical Epidemiology » Volume 14
Using Machine Learning to Identify Patients at High Risk of Inappropriate Drug Dosing in Periods with Renal Dysfunction
Authors Kaas-Hansen BS ![]() , Leal Rodríguez C
, Leal Rodríguez C ![]() , Placido D
, Placido D ![]() , Thorsen-Meyer HC
, Thorsen-Meyer HC ![]() , Nielsen AP
, Nielsen AP ![]() , Dérian N
, Dérian N ![]() , Brunak S
, Brunak S ![]() , Andersen SE
, Andersen SE
Received 22 October 2021
Accepted for publication 24 January 2022
Published 22 February 2022 Volume 2022:14 Pages 213—223
DOI https://doi.org/10.2147/CLEP.S344435
Checked for plagiarism Yes
Review by Single anonymous peer review
Peer reviewer comments 3
Editor who approved publication: Professor Irene Petersen
Benjamin Skov Kaas-Hansen,1– 3 Cristina Leal Rodríguez,2 Davide Placido,2 Hans-Christian Thorsen-Meyer,2,4 Anna Pors Nielsen,2 Nicolas Dérian,5 Søren Brunak,2 Stig Ejdrup Andersen1
1Clinical Pharmacology Unit, Zealand University Hospital, Roskilde, Denmark; 2NNF Center for Protein Research, University of Copenhagen, Copenhagen, Denmark; 3Section for Biostatistics, Department of Public Health, University of Copenhagen, Copenhagen, Denmark; 4Department of Intensive Care Medicine, Copenhagen University Hospital (Rigshospitalet), Copenhagen, Denmark; 5Data and Development Support, Region Zealand, Sorø, Denmark
Correspondence: Benjamin Skov Kaas-Hansen, Clinical Pharmacology Unit, Zealand University Hospital, Munkesoevej 18, Roskilde, 4000, Denmark, Tel +45 60 19 68 02, Email [email protected]
Purpose: Dosing of renally cleared drugs in patients with kidney failure often deviates from clinical guidelines, so we sought to elicit predictors of receiving inappropriate doses of renal risk drugs.
Patients and methods: We combined data from the Danish National Patient Register and in-hospital data on drug administrations and estimated glomerular filtration rates for admissions between 1 October 2009 and 1 June 2016, from a pool of about 2.6 million persons. We trained artificial neural network and linear logistic ridge regression models to predict the risk of five outcomes (> 0, ≥ 1, ≥ 2, ≥ 3 and ≥ 5 inappropriate doses daily) with index set 24 hours after admission. We used time-series validation for evaluating discrimination, calibration, clinical utility and explanations.
Results: Of 52,451 admissions included, 42,250 (81%) were used for model development. The median age was 77 years; 50% of admissions were of women. ≥ 5 drugs were used between admission start and index in 23,124 admissions (44%); the most common drug classes were analgesics, systemic antibacterials, diuretics, antithrombotics, and antacids. The neural network models had better discriminative power (all AUROCs between 0.77 and 0.81) and were better calibrated than their linear counterparts. The main prediction drivers were use of anti-inflammatory, antidiabetic and anti-Parkinson’s drugs as well as having a diagnosis of chronic kidney failure. Sex and age affected predictions but slightly.
Conclusion: Our models can flag patients at high risk of receiving at least one inappropriate dose daily in a controlled in-silico setting. A prospective clinical study may confirm that this holds in real-life settings and translates into benefits in hard endpoints.
Keywords: predictive modelling, kidney failure, machine learning, risk markers, inappropriate drug dosing, renal risk drugs
A Letter to the Editor has been published for this article.
A Response to Letter has been published for this article.
Introduction
Renal diseases affect patients’ susceptibility to, and modify the effects of many drugs, and they reduce renal clearance exposing patients to higher steady-state concentrations when given standard doses. Kidneys excrete active forms and/or metabolites of many drugs, so renal dysfunction necessitates dose-adjustment of renally cleared drugs with narrow therapeutic indices to prevent adverse events and accidental over-dosing.
Inadequate dose-adjustment of such drugs has been linked to polypharmacy1,2 and can cause noxious events3 or accidental over-dosing.4 Although not a new issue,5,6 deviating from guidelines is widespread with prevalence estimates up to 70%.1,2,7–9 Despite large inter-individual variability in clearance and response, dose adjustment for many drugs is crude and based on the estimated glomerular filtration rate (eGFR), for example, halving the dose when eGFR <60 mL/min/1.73 m2.
Appropriate alerts in order-entry systems may facilitate rational clinical decision-making,10,11 and convincing examples have showcased how computerized systems can underpin rational pharmacotherapy.4,12 However, downsides of extensive computerization of healthcare emerge;13 alert fatigue14 is particularly problematic, and strategies and interventions have been proposed to mitigate its negative effects.15
At Danish hospitals, prescriptions are mostly dispensed and administered by nurses who record detailed meta-data.16 Prescriptions are usually made and revised by physicians regularly during clinical rounds, typically in the morning or early afternoon. Electronic decision support is generally immature and neither prescribing physicians nor dispensing nurses are warned if dose-adjustment be advised or even required.
We suspect that the need for dose-adjustment in patients with renal dysfunction often goes unrecognized. Thus, with this paper, we study its predictability to inform clinicians and health-care personnel upfront about which patients with renal dysfunction are at elevated risk of inappropriate drug dosing. To this end, we used and compared predictive modelling methods from classical statistical modelling and machine learning as the richer and more complex models in the latter group may capture more complex relationships than (and thus outperform17) those in the former.18
Methods
Study Design, Patients and Data
We conducted a register-based prediction study with prospective data19 for patients admitted to 12 public hospitals in two Danish regions comprising about 2.6 million persons (more than half the Danish population). We collected diagnosis data from the Danish National Patient Register, demographic data from the Danish Civil Registration System,20 as well as medication and biochemical data from electronic patient records. Diagnoses were encoded using the 10th revision of the International Classification of Diseases (ICD-10), drugs with the Anatomical and Therapeutic Chemical classification (ATC).
The units of analysis were inpatient admissions, defined as chains of successive in-hospital visits at most 24 hours apart. We included admissions starting between 1 October 2009 and 1 June 2016, with at least one eGFR measurement ≤30 during the first 24 hours of admission. We excluded minors (age <18 years). Admission time uses hour resolution (an admission starting at 9:54 is recorded as starting at 9:00) so to ensure at least 24 hours of observation time before inclusion, index was set at hour of admission + 25 hours. Prior sample-size estimation was foregone.
Outcomes
The outcome variables were based on the daily rate = r/E of inappropriate doses during follow-up, capped at 30 days. r is the number of given inappropriate doses of select drugs cleared mainly renally and with narrow therapeutic indices; E the time-at-risk (Figure 1). To obtain well-defined times-at-risk, we set the eGFR threshold to ≤30 mL/min/1.73m2 (unit omitted from here onward) and used the rules in Supplementary Table S1 for counting the number of inappropriate doses, based on the official reference guidelines for Danish physicians (pro.medicin.dk) as of January 2021.
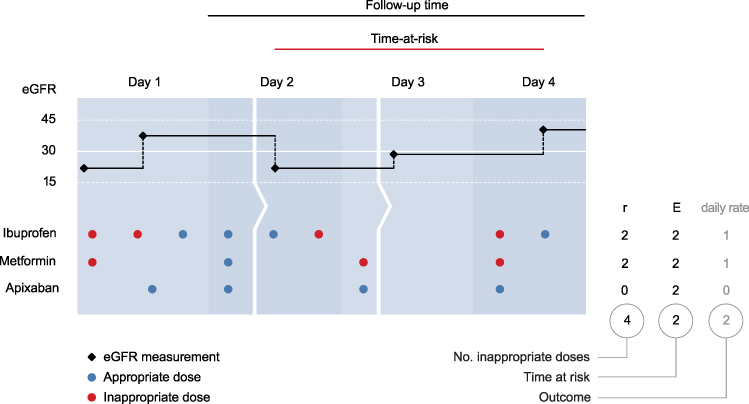 |
Figure 1 Deriving the outcome variables. This exemplary admission is composed of three successive in-patient visits (ie the patient has been transferred twice represented by the arrows). The admission is eligible because it spans more than 24 hours and an eGFR ≤30 was measured before index. Here, apixaban was given while the patient’s eGFR was ≤30, but dose reduction rendered these administrations appropriate. |
We used two rules, one definitive (maximum daily dose = 0 mg) and one of dose-adjustment (reduced daily dose). Operationalization of the definitive rule is straightforward: if the last eGFR ≤30, there should be no administrations until an eGFR >30 is measured. The dose-adjustment rule is slightly more involved as inappropriate dosing comes in two forms: (a) on a given day, there are more than one eGFR measurements, of which at least one is ≤30, and the cumulative daily dose surpasses the threshold in the period(s) between above-threshold measurements, or (b) all eGFR measurements of a given day are ≤30 and the cumulative daily dose surpasses the threshold.
Variables and Features
Variables are original data (eg sex and age at admission) and features the results of rendering the variables appropriate as model inputs (eg one-hot-encoded day of admission). Based on clinical and pharmacological experience we hand-picked pertinent variables likely to be informative to the prediction problem and realistically available in the clinical setting. These fall into three categories. Demographic: age at admission (numeric), sex (binary). Clinical: number of distinct drugs (ATC level 5) administered between admission and index (numeric); therapeutic drug classes (ATC level 2) used between admission and index (one-hot-encoded); the Elixhauser score at admission (numeric, AQHR adaptation);21 ICD-10 chapters of diagnoses recorded in the past five years before admission (one-hot-encoded); record of chronic kidney failure in the past five years before admission (ICD-10 N18* diagnoses, one-hot-encoded). Contextual: hour of admission (numeric, transformed as f(t) = abs(12 – t); see Supplementary Figure S1); weekday of admission (one-hot-encoded); number of admissions in the past 5 years before admission (numeric). In all, there were 98 features.
Missing values, only present for hour of admission and discharge, were imputed by sampling from the empirical distributions of valid values.
Models and Training
We tried two model architectures (linear logistic ridge regression and artificial neural network) with several binary outcomes defined by increasing thresholds of the daily rate of inappropriate doses (>0, ≥1, ≥2, ≥3 and ≥5). The neural network models were multi-layer perceptrons (MLPs) enabling speedy training and evaluation. We compared these full models with sparser versions (reference models with 9 features known to precipitate renal dysfunction, see Supplementary Figures S79-S82) for the outcomes >0 and ≥1 inappropriate daily doses, to assess the added benefit with respect to predictive performance of the full (richer) feature set.
All admissions starting before 1 July 2015 were assigned to the development set (42,250 admissions [81%] of 27,253 patients) and the rest to the independent hold-out test set (10,201 admissions [19%] of 8412 patients). Because admissions constitute the unit of analysis, some patients likely appear in both the development and test sets. Information may leak between the sets,22 so as a sensitivity analysis, we evaluated the performance also in the subset of test-set patients not in the development set.
We used the multivariate TPEsampler from Optuna23 to find the best-performing hyperparameters by sampling 100 configurations, each using 5-fold stratified-and-grouped cross-validation, from the following proposal distributions (discrete values in round brackets, bounds of log-uniform distributions in squared): optimizer (Adam, RMSprop), learning rate [10-6, 10-1], activation function (tanh, sigmoid), L2 penalty [10-6, 10-2], number of hidden layers (1, 2, 3, 4), number of nodes per hidden layer (16, 32, 65, 128), batch size (32, 64, 128, 256, 512), class handling (see below). We used the binary cross-entropy loss function throughout.
Only relevant hyperparameters were sampled and we ran Optuna on linear and MLP models separately because they have disparate hyperparameter sets. MLP models with more hidden layers and more nodes therein can learn more complex relationships but become prone to overfitting which we countered with early stopping24 and L2 regularization (handles collinearity better than L1 regularization).18,25 The batch size is the number of observations from which the model learns at a time; small batches can give outliers undue influence while full-batch training (batch size = number of units) can become computationally impractical.22 Class imbalances in binary outcomes can misguide training, so we tested the following remedies: synthetic minority oversampling technique (SMOTE), random over-sampling of minority class, NearMiss, random under-sampling of majority class, class weighting, and none. SMOTE creates a dataset similar to the minority class but of the same size as the majority class;26 NearMiss downsizes the majority class in a systematic way to retain as much information as possible in fewer data points.27 Class weighting retains the original data but gives more weight to minority-class observations.
Hyperparameter optimization models trained for maximum 500 epochs with 50-epoch patience on improvement in the validation loss. The final models were trained on the full development set until the loss reached that obtained in the best cross-validation fold for the best configuration.24
Evaluation and Explanation
Discrimination was assessed with receiver operating characteristic (ROC) curves and areas under the ROC curves (AUROC), calibration-in-the-small by plotting decile-binned predicted probabilities against corresponding bin-wise observed event proportions28 with 95% Jeffrey intervals;29 results from a perfectly calibrated model fall on the diagonal. We used the decision-curve analytic framework to gauge the models’ potential clinical utility.30,31 In the interest of transparency, all performance figures of the reference models are included in the supplement.
For explanation and scrutiny of prediction drivers, we used the SHAP DeepExplainer yielding one shap value per feature per unit.32 The shap value for a risk prediction model is the absolute change in risk of a given unit’s value for each feature: the cohort-wide mean risk plus the sum of one unit’s shap values equals that unit’s risk.
Analysis and Ethics
The full analytical pipeline was built with Snakemake33 (schematic overview in Supplementary Figure S2) to facilitate transparency and reproducibility; blinding was impractical and so foregone, but all analytic code is available online (DOI: 10.5281/zenodo.4560078). Univariate distributions were summarized by median (inter-quartile range) and count (proportion), as appropriate. This report adheres to pertinent items in the MINIMAR guideline34 and TRIPOD statement;35 the latter is available in the supplement.
All data have been marshalled on Computerome, a secure high-performance Danish computing infrastructure, after obtaining approval from the Danish Patient Safety Authority (3–3013-1723; then competent authority for ethical approval), the Danish Data Protection Agency (DT SUND 2016–48, 2016–50, 2017–57) and the Danish Health Data Authority (FSEID 00003724).
Results
Table 1 shows univariate summary statistics of the 52,451 admissions (42,250 + 10,201) of 35,665 patients (27,253 + 8412) included in the study (see Supplementary Table S2 for extended version with all features). Patients in the test sets were similar to those in the development set with some notable exceptions. Fewer had received inappropriate doses, especially in the test-set patients not part of the development set who also had fewer previous admissions.
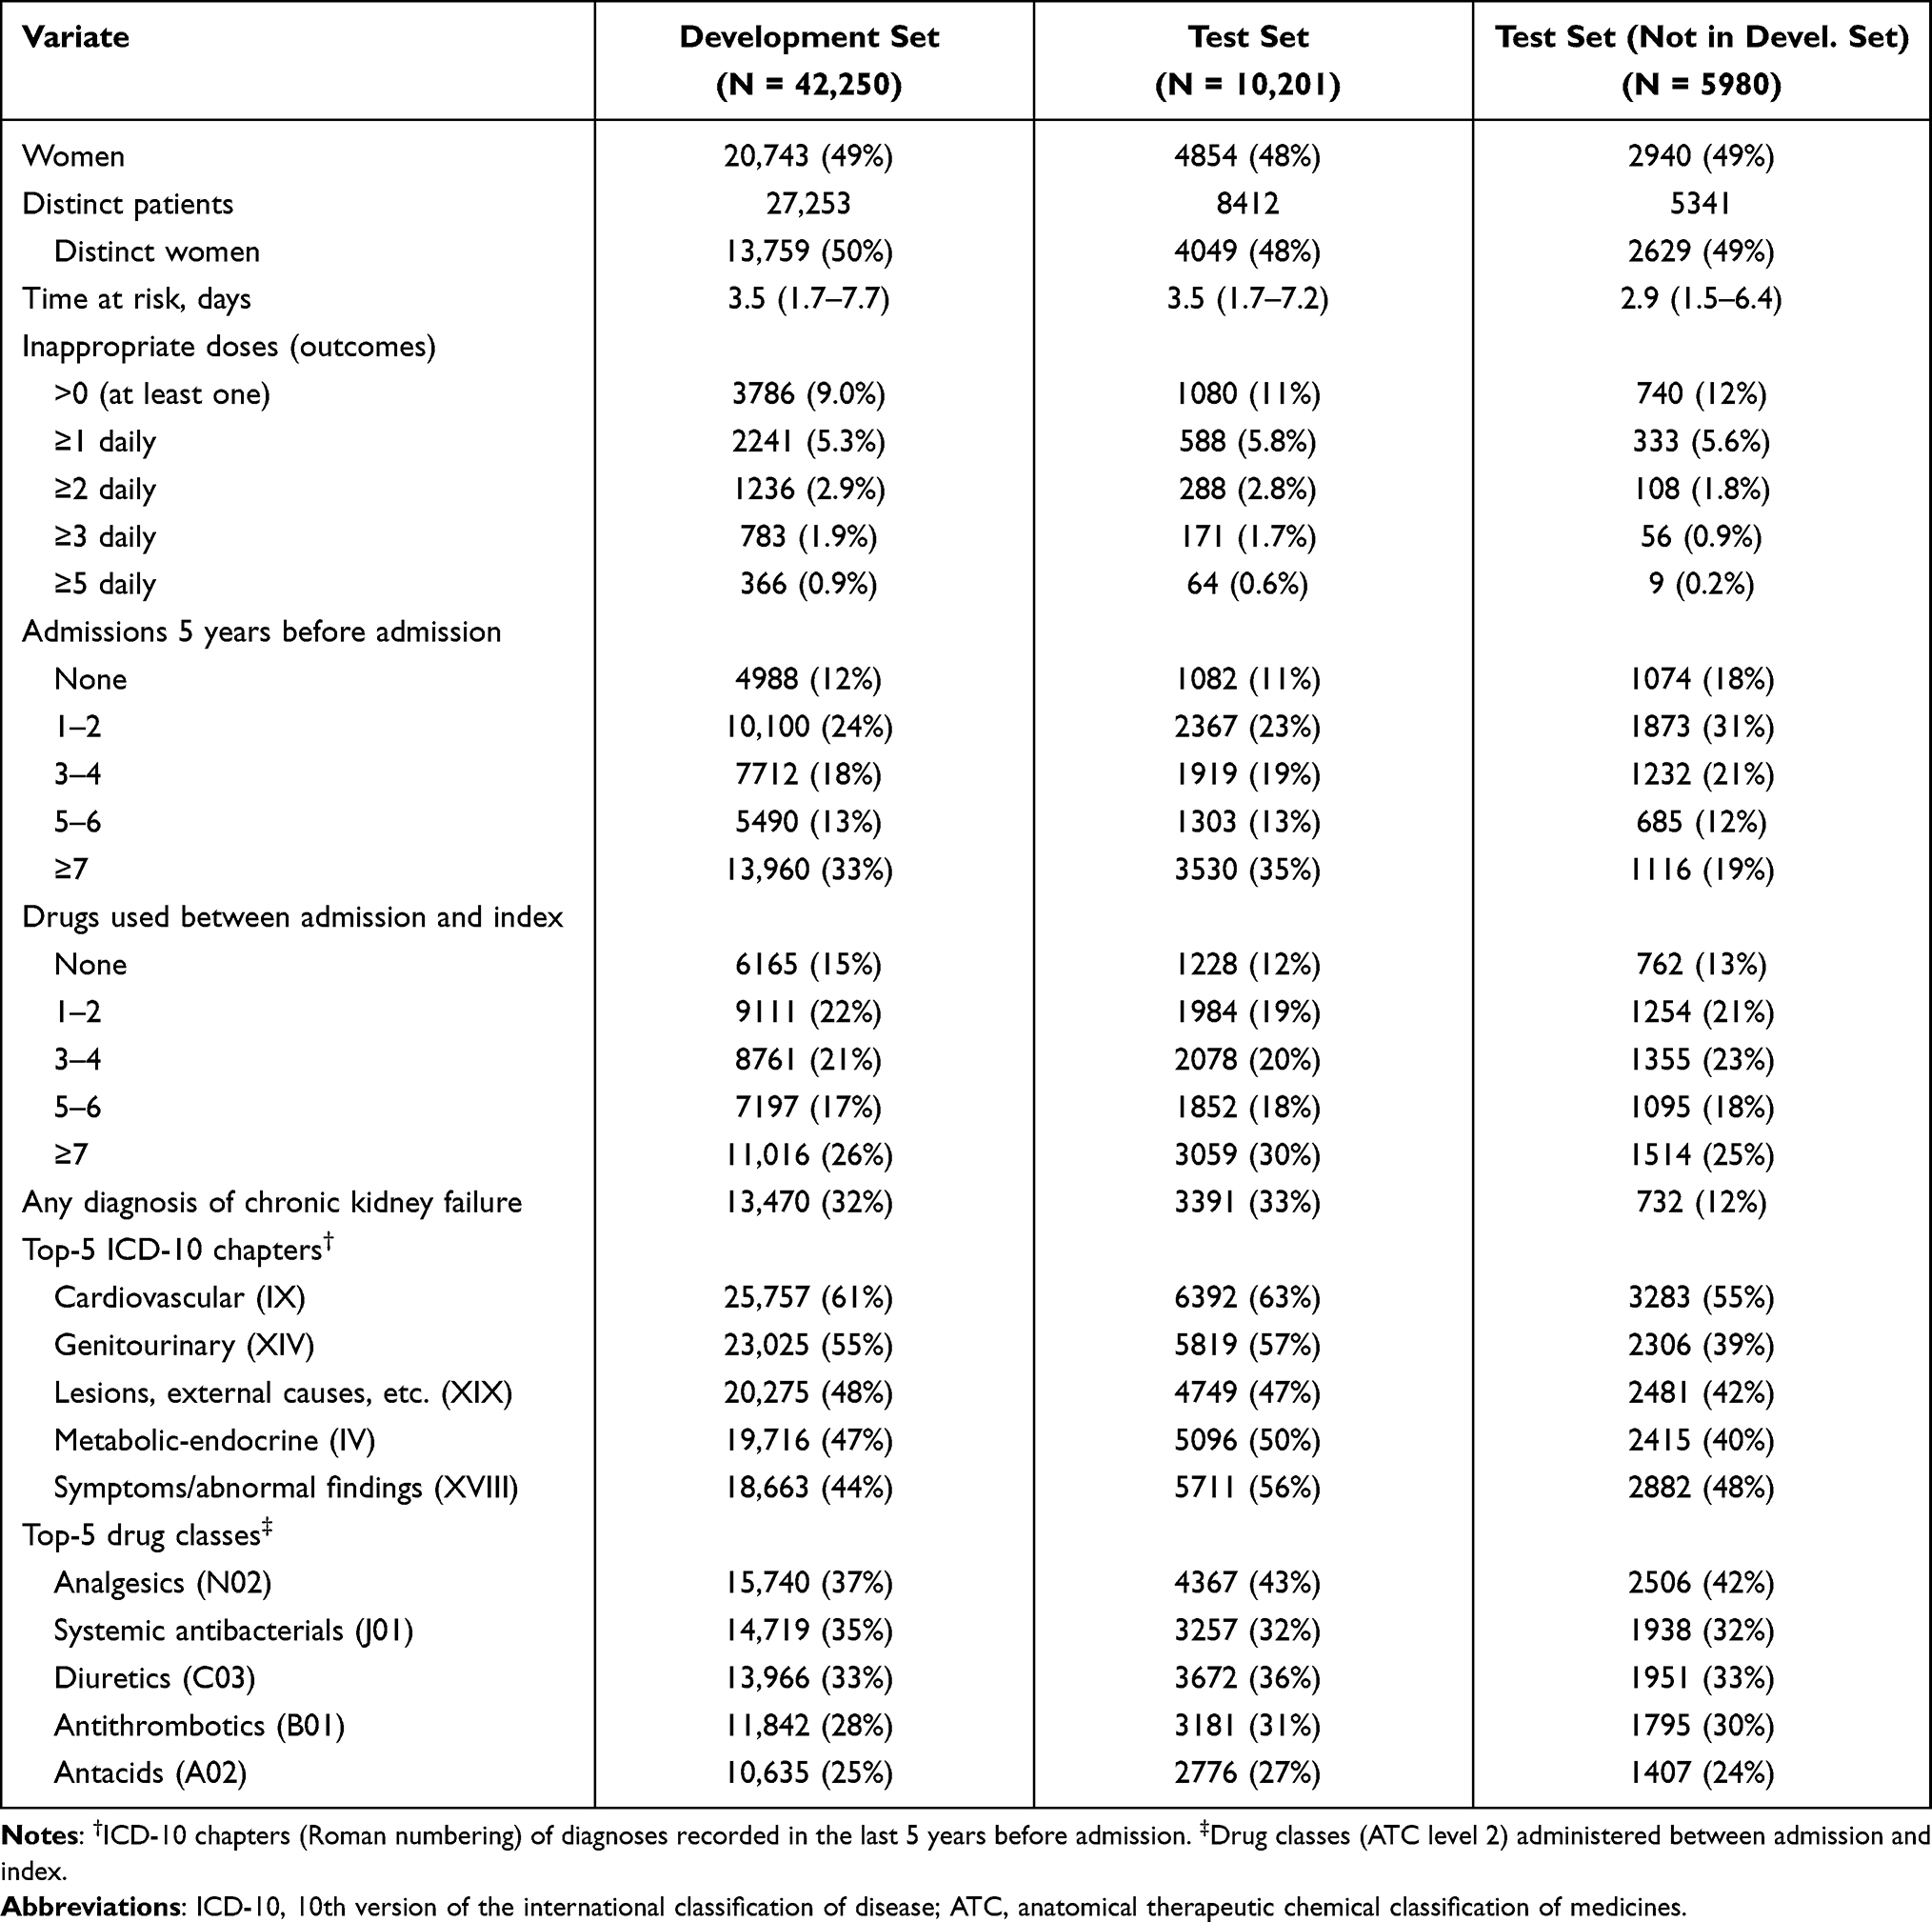 |
Table 1 Univariate Summary Statistics of Select Features. Values are Median (Inter-Quartile Range) and Count (Proportion) as Appropriate. Distinct Patients and Distinct Women Show Counts of Actual Patients (as a Patient Can Contribute More Than One Unit) |
In the development set, the median age was 77 years (IQR: 67–85) and 20,743 admissions (49%) were of 13,759 women (50%). The median time at risk was 3.5 days (inter-quartile range: 1.7–7.7) and at least one inappropriate dose was given in 3786 admissions (9.0%); ≥1 inappropriate dose daily was given in 5.3% of admissions and ≥5 inappropriate doses daily were given in 0.9%. The events-per-feature ratios in the development set varied between 39 (3.786/98, for at least one inappropriate dose) and 3.7 (366/98, ≥5 inappropriate doses daily). The target drugs most commonly given in inappropriate doses were ibuprofen (M01AE01, 4.1%) and metformin (A10BA02, 3.4%); inappropriate doses of the other target drugs were given in <1% of admissions.
Patients in 4988 admissions (12%) had no admissions in the 5 years before inclusion; 13,960 (33%) had ≥7 previous admissions. The most common drug classes used between admission and index were analgesics (N02, 37%), systemic antibacterials (J01, 35%), diuretics (C03, 33%) antithrombotics (B01, 28%), and antacids (A02, 25%). Previous diagnoses were most commonly cardiovascular (chapter IX, 61%), genitourinary (XIV, 55%), related to i.a. lesions and external causes (XIX, 48%), endocrine-metabolic (IV, 47%), and symptoms/abnormal findings (XVIII, 44%).
Table 2 shows the hyperparameters of the best configurations with performance metrics of the final and reference models (see also Supplementary Figures S3–S16). Generally, multi-layer perceptron (MLP) models performed slightly better than their linear counterparts, all obtaining AUROC’s between 0.77 and 0.81 in the test set (ROC curves in Supplementary Figures S17–S30). The MLP models more consistently showed good calibration in the development set. For daily rates >0, ≥1 and ≥2 both MLP and linear models were very well calibrated in the test set (Supplementary Figures S31–S44). The full models had better discrimination and were better calibrated than the corresponding reference models. The decision curves did not suggest the clinical utility of the MLP models be superior to that of the linear (Supplementary Figures S45–S54).
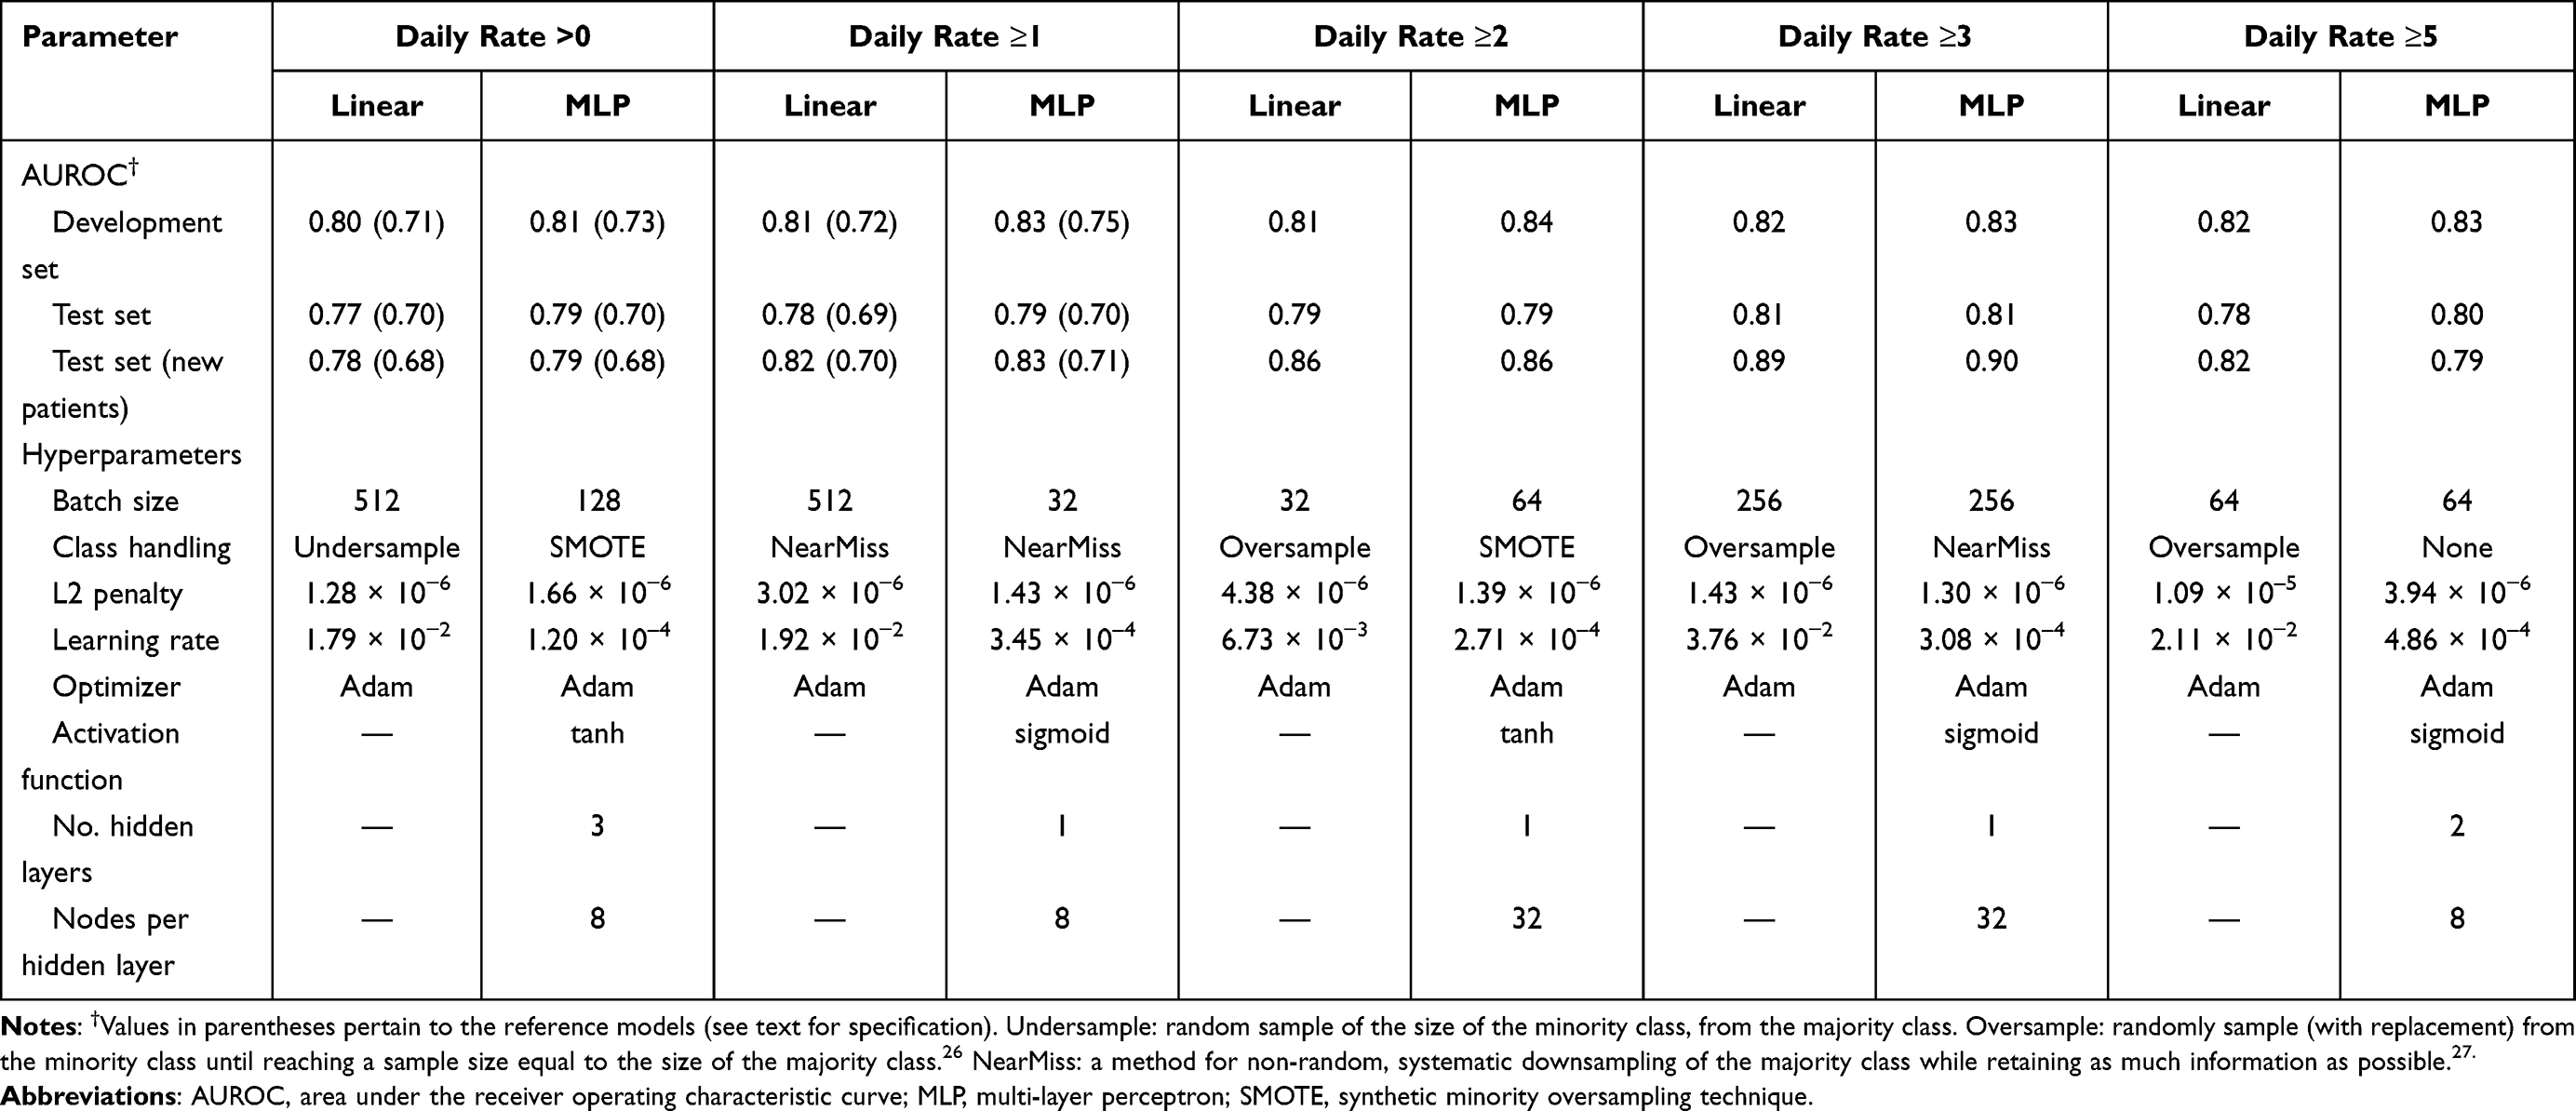 |
Table 2 Performance Metrics of Final Models and Results of Optuna Hyperparameter Optimization |
The model-specific shap values offer some insights (Supplementary Figures S59–S68). First, many features contribute substantively to the predictions of daily rate >0 and ≥1 outcomes, while few features almost entirely drive the predictions for the other outcomes. Second, few features are the dominant prediction drivers across outcomes and models: use of anti-inflammatory, antirheumatic and antidiabetic drugs as well as diagnoses of chronic kidney failure. Third, sex and age contribute little to predictions. Fourth, using more distinct drugs (reflecting various levels of polypharmacy) pushes the risk up and using fewer drugs pulls the risk down. Fifth, the linear models tend to give most weight to relatively few features whereas the MLP models spread out the contributions across more features. Finally, the number of previous admissions (a proxy for frailty) became an increasingly important driver with increasing rarity of the outcome, in the MLP models.
Figure 2 shows the relationships between values of select features and their shap values and illustrates how MLP models capture highly non-linear effects and near-linear effects as appropriate (eg the effects of age at admission and number of previous admissions for daily rate >0.)
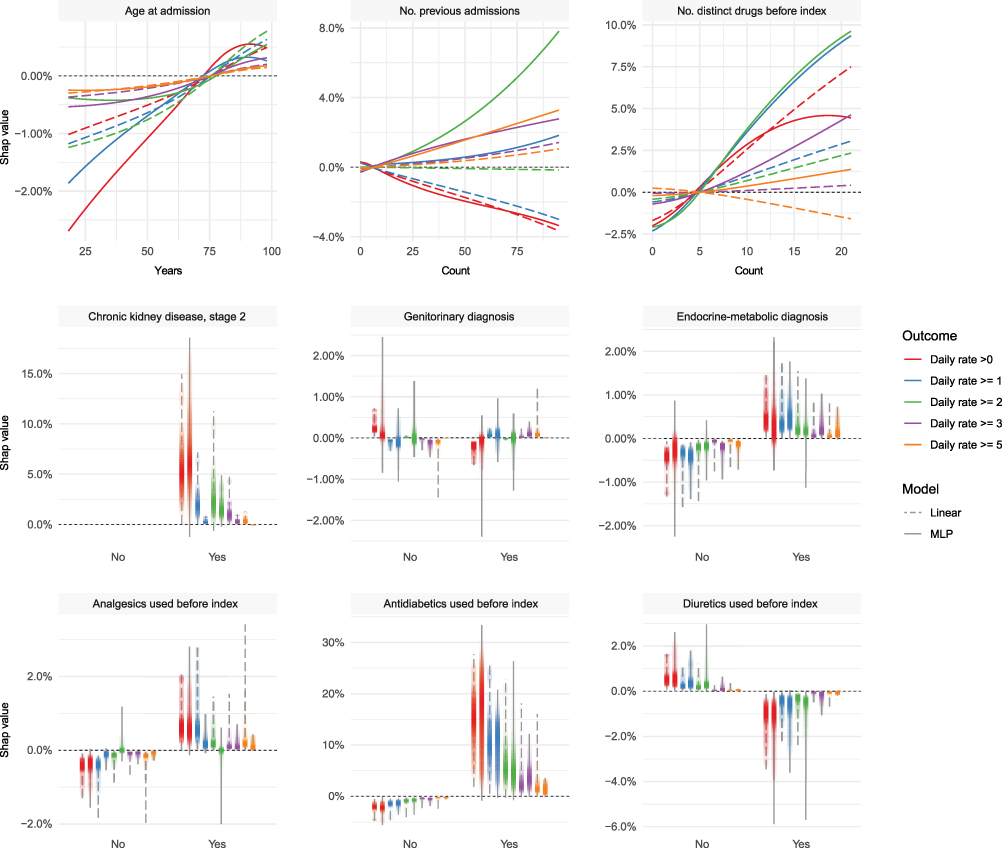 |
Figure 2 Bivariate relationships between values of select features (x axis) and their corresponding shap values (y axis). The continuous features are summarized by locally estimated scatterplot smoothing (LOESS), binary features by vertical density bands. |
Discussion
This study reveals that 9.0% of patients with reduced kidney function are exposed to inappropriate doses of selected renal risk drugs in the follow-up period. Our models performed quite well with AUROC’s between 0.77 and 0.81 with good calibration-in-the-small for daily rates >0 and ≥1, in the test set. For rarer outcomes (daily rates ≥2, ≥3 and ≥5) calibration suffered and clinical utility is unlikely to be substantive.
Apt intervention necessitates comprehension of the nature and extent of the problem. Use of renal risk drugs and associated problems, including inappropriate dosing, in patients with renal dysfunction is well described.36–40 A cross-sectional study of 83,000 American outpatient Veterans found that 32% of patients with creatinine clearance between 15 and 29 were given drugs at excessive doses considering their kidney function.41 Medication burden had the strongest cooccurrence with inappropriate dosing and metformin was a prominent drug among those with inappropriate doses. This agrees with our findings although our study design has clearer temporality.
Some have called for a prediction tool to identify elderly at elevated risk of adverse drug reactions,42 a notion similar to ours in spirit but different in scope. Studies of factors associated with inadequate dose adjustment are few and often of retrospective nature eliciting relationships with characteristics after inappropriate doses have already been given. One study seeking to elicit factors associated with dosing appropriateness, using a logistic regression, reported the statistically strongest association to be with severity of chronic kidney failure (p-value = 7%).43 A similar study found dosing errors in 33% of the patients; age (odds ratio, OR: 1.05), number of drug prescriptions (OR: 1.1) and number of drugs requiring dose adjustment (OR: 2.0) were associated with dosing errors.44 A third study found that, in patients with chronic kidney failure, late-stage chronic kidney disease, number of prescribed drugs and presence of comorbidity were associated with dosing errors. Ill-defined indices and times-at-risk render such enquiries of little use for a priori prediction and risk stratification: the ability to intervene presupposes a reliable estimate of risk in advance, before the event happens.
Carey et al found only few factors to be genuinely predictive of potentially inappropriate prescribing in elderly outside the hospital setting.45 Our models had AUROC’s (0.77–0.81), slightly higher than that of their model (0.76). In a prospective study from Norway37 of internal-medicine patients with a mean age of 71 years, 35% received suboptimal doses; a composite variable (number of clinical/pharmacological risk factors) was quite strongly associated with non-optimal dosing (RR: 1.33), less so number of drugs at admission (RR: 1.09), whereas sex and age were not predictive of non-optimal dosing. Our results agree quite well with that finding, probably because the information captured by age and sex (essentially, proxies of comorbidity) is expressed explicitly in our feature set.
As such, our models fare quite well with performance metrics superior to those of other published models even though ours came from an independent and temporally distinct test set. Many studies employing machine learning models for predicting medical outcomes use normal split-sample validation, putting aside a random sample of the observations for testing. This has several logical and practical implications, perhaps most notably that a model developed with data collected between, say, 2005 and 2015 will likely perform better in a test case from 2013 than in one from 2017. The subset of our test set with patients not part of the development set is a conceptually appealing way to gauge how the model might perform in a new population. It does, however, distort the data and somewhat delink it from the clinical reality: some patients have previous admissions and those admitted for the first time are probably different from the rest.
Strengths
Here, we highlight six principal strengths of this study. First, this is by far the largest study of its kind to date. Second, time-series validation yielded realistic performance evaluation in distinct (future) data46 vis-a-vis many articles on predictive modelling, perhaps most clearly seen in the surge of COVID-19 papers.47 Third, our data were richer than in any other study in this area thanks to the combined diversity and reliability of longitudinal diagnostic data from the National Patient Register and deep phenotypic in-hospital data. Fourth, our summary statistics are well aligned with descriptive studies of deviations from dosing recommendations, and the nature of the general patient population to which a model as ours would be applied.48 Fifth, we found that the full models performed substantively better than the sparser reference models with few features known to precipitate renal dysfunction. Finally, the shap-value analysis suggests that the models picked up clinically relevant information without undue influence of individual predictors.
Limitations
Like any study, this has potential limitations. First, albeit simple and elegant, using only eGFR as a proxy for kidney function is not always advisable.49 It is, however, considered a reasonable metric for medicinal dosing50 and used in Danish guidelines. Second, eGFR can be estimated in several ways51 and both the 4-variable MRDR Study and CKD-EPI equations were used in our data. However, clinicians use the reported eGFR estimate as-is and both equations perform well for low eGFR values.52 Third, hard thresholds on eGFR are arbitrary: the difference in kidney function between eGFRs of 29 and 31 is minuscule, but the cutoff must be set somewhere. Again, we stayed loyal to the guidelines as these are, nevertheless, what should support clinicians’ prescribing decisions. Fourth, many drugs have narrow and intermediate therapeutic indices. We focused on seven drugs cleared primarily by the kidneys and with narrow therapeutic indices that are fairly common in a Danish setting and span several important drug classes. The drugs included also allowed for reasonably harmonized rules of inappropriate dosing. Fifth, our binary outcomes are soft endpoints and do constitute a simplification. Seemingly inappropriate doses could be conscious choices and the outcome variables do not capture information about actual toxicity experienced by the patient. However, the narrow therapeutic indices of the included drugs increase the likelihood of noxious effects without appropriate dose adjustment. Finally, although low eGFR in the first 24 hours of admission was required for inclusion, using data on the kidney function between admission and index as input to the model could have been beneficial; however, perhaps mostly so if modelling the eGFR trajectory with eg a Long Short-Term Memory neural network or a Hidden Markov Model.
Conclusion
Despite physicians’ awareness of the need for dose adjustment in patients with kidney dysfunction, a well-performing clinical decision support tool may help prevent such patients from “flying under the radar” in a busy clinical setting. Indeed, our models can flag patients at high risk of receiving >0 or ≥1 inappropriate dose daily.
A prospective evaluation is necessary to assess if these results transport to the clinic and if the models can offer genuine clinical utility for the patients. Receiving inappropriate doses is a soft endpoint, so clinical evaluation should consider also hard endpoints, either generic (eg length-of-stay, need for post-discharge rehabilitation and mortality) or specific ones related to the target drugs (eg transfusion and occurrence of known side-effects of these drugs.)
Data Sharing Statement
Due to the sensitive nature of the data, we can neither offer access to nor share our data with third parties. Data can be obtained from the original sources upon request.
Funding
The authors would like to thank Innovation Fund Denmark (5153-00002B) and the Novo Nordisk Foundation (NNF14CC0001, NNF17OC0027594) for their financial contribution to BigTempHealth without which this study had not been possible. The funders played no role in designing, conducting, interpreting, or reporting this study.
Disclosure
SB reports ownerships in Intomics A/S, Hoba Therapeutics Aps, Novo Nordisk A/S, Lundbeck A/S, and managing board memberships in Proscion A/S and Intomics A/S outside the submitted work. Dr Anna Pors Nielsen reports grants from Novo Nordisk Foundation, during the conduct of the study. All other authors report no other conflicts of interest in this work.
References
1. Saleem A, Masood I. Pattern and predictors of medication dosing errors in chronic kidney disease patients in Pakistan: a single center retrospective analysis. PLoS One. 2016;11(7):e0158677. doi:10.1371/journal.pone.0158677
2. Hoffmann F, Boeschen D, Dorks M, Herget-Rosenthal S, Petersen J, Schmiemann G. Renal Insufficiency and Medication in Nursing Home Residents. A cross-sectional study (IMREN). Dtsch Arztebl Int. 2016;113(6):92–98. doi:10.3238/arztebl.2016.0092
3. Munar MY, Singh H. Drug dosing adjustments in patients with chronic kidney disease. Am Fam Phys. 2007;75(10):1487–1496.
4. Niedrig D, Krattinger R, Jodicke A, Gott C, Bucklar G, Russmann S. Development, implementation and outcome analysis of semi-automated alerts for metformin dose adjustment in hospitalized patients with renal impairment. Pharmacoepidemiol Drug Saf. 2016;25(10):1204–1209. doi:10.1002/pds.4062
5. Bernstein JM, Erk SD. Choice of antibiotics, pharmacokinetics, and dose adjustments in acute and chronic renal failure. Med Clin North Am. 1990;74(4):1059–1076. doi:10.1016/S0025-7125(16)30536-3
6. Khare AK. Antibiotic dose adjustment in renal insufficiency. Lancet. 1992;340(8833):1480.
7. Dorks M, Allers K, Schmiemann G, Herget-Rosenthal S, Hoffmann F. Inappropriate medication in non-hospitalized patients with renal insufficiency: a systematic review. J Am Geriatr Soc. 2017;65(4):853–862. doi:10.1111/jgs.14809
8. Getachew H, Tadesse Y, Shibeshi W. Drug dosage adjustment in hospitalized patients with renal impairment at Tikur Anbessa specialized hospital, Addis Ababa, Ethiopia. BMC Nephrol. 2015;16:158. doi:10.1186/s12882-015-0155-9
9. Altunbas G, Yazc M, Solak Y, et al. Renal drug dosage adjustment according to estimated creatinine clearance in hospitalized patients with heart failure. Am J Ther. 2016;23(4):e1004–8. doi:10.1097/01.mjt.0000434042.62372.49
10. Hillestad R, Bigelow J, Bower A, et al. Can electronic medical record systems transform health care? Potential health benefits, savings, and costs. Health Aff (Millwood). 2005;24(5):1103–1117. doi:10.1377/hlthaff.24.5.1103
11. Stewart WF, Shah NR, Selna MJ, Paulus RA, Walker JM. Bridging the inferential gap: the electronic health record and clinical evidence. Health Affairs (Millwood). 2007;26(2):w181–91. doi:10.1377/hlthaff.26.2.w181
12. Boussadi A, Caruba T, Karras A, et al. Validity of a clinical decision rule-based alert system for drug dose adjustment in patients with renal failure intended to improve pharmacists’ analysis of medication orders in hospitals. Int J Med Inform. 2013;82(10):964–972. doi:10.1016/j.ijmedinf.2013.06.006
13. Gawande A Why doctors hate their computers. The New Yorker. November 12, 2018.
14. Baysari MT, Tariq A, Day RO, Westbrook JI. Alert override as a habitual behavior - a new perspective on a persistent problem. J Am Med Inform Assoc. 2017;24(2):409–412. doi:10.1093/jamia/ocw072
15. Kane-Gill SL, O’Connor MF, Rothschild JM, et al. Technologic Distractions (Part 1): summary of approaches to manage alert quantity with intent to reduce alert fatigue and suggestions for alert fatigue metrics. Crit Care Med. 2017;45(9):1481–1488. doi:10.1097/CCM.0000000000002580
16. Jensen TB, Jimenez-Solem E, Cortes R, et al. Content and validation of the Electronic Patient Medication module (EPM)—the administrative in-hospital drug use database in the Capital Region of Denmark. Scand J Public Health. 2018;48(1):43–48. doi:10.1177/1403494818760050
17. Zhang Z, Ho KM, Hong Y. Machine learning for the prediction of volume responsiveness in patients with oliguric acute kidney injury in critical care. Crit Care. 2019;23(1):112. doi:10.1186/s13054-019-2411-z
18. Efron B, Hastie T. Computer Age Statistical Inference: Algorithms, Evidence, and Data Science. London, United Kingdom: Cambridge University Press; 2016.
19. Rothman KJ, Lash TL, Greenland S. Modern Epidemiology.
20. Schmidt M, Schmidt SAJ, Sandegaard JL, Ehrenstein V, Pedersen L, Sørensen HT. The Danish National Patient Registry: a review of content, data quality, and research potential. Clin Epidemiol. 2015;7:449–490. doi:10.2147/CLEP.S91125
21. Moore BJ, White S, Washington R, Coenen N, Elixhauser A. Identifying increased risk of readmission and in-hospital mortality using hospital administrative data: the AHRQ Elixhauser Comorbidity Index. Med Care. 2017;55(7):698–705. doi:10.1097/MLR.0000000000000735
22. Chollet F. Deep Learning with Python. New York, USA: Manning Publications Co; 2018.
23. Akiba T, Sano S, Yanase T, Ohta T, Koyama M. Optuna: a next-generation hyperparameter optimization framework. arXiv (Unpublished). 2019.
24. Goodfellow I, Bengio Y, Courville A. Deep Learning. Cambridge (MA), USA: MIT Press; 2016.
25. Hastie T, Tibshirani R, Friedman J. The Elements of Statistical Learning: Data Mining, Inference, and Prediction.
26. Chawla NV, Bowyer KW, Hall LO, Kegelmeyer WP. SMOTE: synthetic Minority Over-sampling Technique. J Artif Intell Res. 2002;16:321–357. doi:10.1613/jair.953
27. Zhang J, Mani I kNN approach to unbalanced data distributions: a case study involving information extraction. In:
28. Steyerberg EW. Clinical Prediction Models: A Practical Approach to Development, Validation, and Updating. New York: Springer; 2009.
29. Brown LD, Cai TT, DasGupta A. Interval estimation for a binomial proportion. Statistical Sci. 2001;16(2):101–133. doi:10.1214/ss/1009213286
30. Vickers AJ, Elkin EB. Decision curve analysis: a novel method for evaluating prediction models. Med Decision Making. 2006;26(6):565–574. doi:10.1177/0272989X06295361
31. Kerr KF, Brown MD, Zhu K, Janes H. Assessing the clinical impact of risk prediction models with decision curves: guidance for correct interpretation and appropriate use. J Clin Oncol. 2016;34(21):2534–2540. doi:10.1200/JCO.2015.65.5654
32. Lundberg SM, Lee S. A unified approach to interpreting model predictions. In: Guyon I, Luxburg UV, Bengio S, et al., editors. Advances in Neural Information Processing Systems. Vol. 30. Curran Associated, Inc.; 2017:4765–4774.
33. Köster J, Rahmann S. Snakemake—a scalable bioinformatics workflow engine. Bioinformatics. 2012;28(19):2520–2522. doi:10.1093/bioinformatics/bts480
34. Hernandez-Boussard T, Bozkurt S, Ioannidis JPA, Shah NH. MINIMAR (MINimum Information for Medical AI Reporting): developing reporting standards for artificial intelligence in health care. J Am Med Inf Assoc. 2020;6:2011–2015.
35. Collins GS, Reitsma JB, Altman DG, Moons KGM. Transparent Reporting of a multivariable prediction model for Individual Prognosis Or Diagnosis (TRIPOD): the TRIPOD Statement. Ann Intern Med. 2015;162(1):55–63. doi:10.7326/M14-0697
36. Saad R, Hallit S, Chahine B. Evaluation of renal drug dosing adjustment in chronic kidney disease patients at two university hospitals in Lebanon. Pharm Pract (Granada). 2019;17(01):1304. doi:10.18549/PharmPract.2019.1.1304
37. Blix HS, Viktil KK, Reikvam A, et al. The majority of hospitalised patients have drug-related problems: results from a prospective study in general hospitals. Eur J Clin Pharmacol. 2004;60(9):651–658. doi:10.1007/s00228-004-0830-4
38. Andreu Cayuelas JM, Caro Martínez C, Flores Blanco PJ, et al. Kidney function monitoring and nonvitamin K oral anticoagulant dosage in atrial fibrillation. Eur J Clin Invest. 2018;48(6):e12907. doi:10.1111/eci.12907
39. Seiberth S, Bauer D, Schönermarck U, et al. Correct use of non-indexed eGFR for drug dosing and renal drug-related problems at hospital admission. Eur J Clin Pharmacol. 2020;76(12):1683–1693. doi:10.1007/s00228-020-02953-6
40. Breton G, Froissart M, Janus N, et al. Inappropriate drug use and mortality in community-dwelling elderly with impaired kidney function–the Three-City population-based study. Nephrol Dial Transplant. 2011;26(9):2852–2859. doi:10.1093/ndt/gfq827
41. Chang F, O’Hare AM, Miao Y, Steinman MA. Use of renally inappropriate medications in older veterans: a national study. J Am Geriatr Soc. 2015;63(11):2290–2297. doi:10.1111/jgs.13790
42. Parameswaran Nair N, Chalmers L, Peterson GM, Bereznicki BJ, Castelino RL, Bereznicki LR. Hospitalization in older patients due to adverse drug reactions - the need for a prediction tool. Clin Interv Aging. 2016;11:497–505. doi:10.2147/CIA.S99097
43. Kalender-Rich JL, Mahnken JD, Wetmore JB, Rigler SK. Transient impact of automated glomerular filtration rate reporting on drug dosing for hospitalized older adults with concealed renal insufficiency. Am J Geriatr Pharmacother. 2011;9(5):320–327. doi:10.1016/j.amjopharm.2011.08.003
44. Won H, Chung G, Lee KJ, et al. Evaluation of medication dosing errors in elderly patients with renal impairment. Int J Clin Pharmacol Ther. 2018;56(8):358–365. doi:10.5414/CP203258
45. Carey IM, De Wilde S, Harris T, et al. What factors predict potentially inappropriate primary care prescribing in older people? Drugs Aging. 2008;25(8):693–706. doi:10.2165/00002512-200825080-00006
46. Steyerberg EW, Harrell FEJ. Prediction models need appropriate internal, internal-external, and external validation. J Clin Epidemiol. 2016;69:245–247. doi:10.1016/j.jclinepi.2015.04.005
47. Wynants L, Van Calster B, Collins GS, et al. Prediction models for diagnosis and prognosis of covid-19: systematic review and critical appraisal. BMJ. 2020;7:369.
48. Yusuf M, Atal I, Li J, et al. Reporting quality of studies using machine learning models for medical diagnosis: a systematic review. BMJ Open. 2020;10:3. doi:10.1136/bmjopen-2019-034568
49. Eppenga WL, Kramers C, Derijks HJ, Wensing M, Wetzels JFM, De Smet PAGM. Drug therapy management in patients with renal impairment: how to use creatinine-based formulas in clinical practice. Eur J Clin Pharmacol. 2016;72(12):1433–1439. doi:10.1007/s00228-016-2113-2
50. Rule AD, Glassock RJ. GFR estimating equations: getting closer to the truth?. Clin J Am Soc Nephrol. 2013;8(8):1414–1420.
51. Corsonello A, Onder G, Bustacchini S, et al. Estimating renal function to reduce the risk of adverse drug reactions. Drug Safety. 2012;35(Suppl 1):47–54. doi:10.1007/BF03319102
52. Levey AS, Stevens LA, Schmid CH, et al. A new equation to estimate glomerular filtration rate. Ann Intern Med. 2009;150(9):604–612. doi:10.7326/0003-4819-150-9-200905050-00006
 © 2022 The Author(s). This work is published and licensed by Dove Medical Press Limited. The
full terms of this license are available at https://www.dovepress.com/terms
and incorporate the Creative Commons Attribution
- Non Commercial (unported, 3.0) License.
By accessing the work you hereby accept the Terms. Non-commercial uses of the work are permitted
without any further permission from Dove Medical Press Limited, provided the work is properly
attributed. For permission for commercial use of this work, please see paragraphs 4.2 and 5 of our Terms.
© 2022 The Author(s). This work is published and licensed by Dove Medical Press Limited. The
full terms of this license are available at https://www.dovepress.com/terms
and incorporate the Creative Commons Attribution
- Non Commercial (unported, 3.0) License.
By accessing the work you hereby accept the Terms. Non-commercial uses of the work are permitted
without any further permission from Dove Medical Press Limited, provided the work is properly
attributed. For permission for commercial use of this work, please see paragraphs 4.2 and 5 of our Terms.