Back to Journals » Cancer Management and Research » Volume 10
Using LC–MS/MS-based targeted proteomics to monitor the pattern of ABC transporters expression in the development of drug resistance
Authors Meng F, Zou L ![]() , Zhang T, Jiang L, Ding Y, Yu P, Peng J
, Zhang T, Jiang L, Ding Y, Yu P, Peng J
Received 6 February 2018
Accepted for publication 23 April 2018
Published 23 August 2018 Volume 2018:10 Pages 2859—2870
DOI https://doi.org/10.2147/CMAR.S164766
Checked for plagiarism Yes
Review by Single anonymous peer review
Peer reviewer comments 2
Editor who approved publication: Professor Lu-Zhe Sun
Fanqi Meng,1 Le Zou,2 Tengyu Zhang,3 Lei Jiang,1 Yao Ding,4 Peng Yu,1 Jie Peng5
1Department of Drug Analysis, Xiangya School of Pharmaceutical Sciences, Central South University, Changsha 410013, Hunan Province, China; 2Department of Pharmacy, Xiangya Hospital, Central South University, Changsha 410008, Hunan Province, China; 3Department of Pharmacy, University of Copenhagen, København Ø, Denmark; 4Department of Analyses and Testing, Hunan Key Laboratory for Bioanalysis of Complex Matrix Samples, Changsha 410013, Hunan Province, China; 5Department of Pharmacy, Jiangxi Provincial People’s Hospital, Nanchang 330006, Jiangxi Province, China
Purpose: The overexpression of ATP-binding cassette transporters (ABC transporters), mainly including permeability glycoproteins (P-gp), multidrug resistance (MDR)-related protein 1 (MRP1), and breast cancer resistance proteins (BCRP), is one of the main reasons for the development of MDR which directly leads to chemotherapy failure. However, most of the currently used detection methods in MDR-related studies are qualitative or semiquantitative, but not quantitative. As a result, the measurement criteria of different experiments are not unified. Moreover, there are many contradictory results of the studies of the induction effect of drugs on ABC transporters. So, it is necessary to establish a quantitative assay for the quantification of P-gp, MRP1, and BCRP to study the mechanism of drug resistance.
Methods: In this paper, a novel and advanced liquid chromatography/mass spectrometry (MS)/MS-based targeted proteomics method for the quantification of P-gp, MRP1, and BCRP was developed and validated. Then, the cell lines MCF-7, HepG-2, and SMMC-7721 were, respectively, induced by different concentrations of doxorubicin (adriamycin [ADM]), mitoxantrone (MX), and methotrexate (MTX), to establish resistance cell lines. The method established was used to quantify the expression of P-gp, MRP1, and BCRP.
Results: The result showed that the induction effects of drugs on protein were relatively stable and selective. ADM, MX, and MTX could induce overexpression of P-gp, MRP1, and BCRP. And, the induction effect of different drugs on proteins was selective. The pattern of overexpression of ABC transporters in the three types of resistance cell lines was different.
Conclusion: During the development of drug resistance, the cell type and patch, but not drug type, were the most important determinant factors of the overexpression level of ABC transporters in resistance cell lines. This study provides a good foundation for understanding the development of drug resistance in cell lines and can be used to explain the contradictory results in other published studies as described above.
Keywords: P-gp, MRP1, BCRP, multidrug resistance, quantification
Introduction
The development of multidrug resistance (MDR) remains a major clinical obstacle in current cancer therapy, which is the main cause of chemotherapy failure.1
The mechanism of MDR is complicated. One of the determinant factors is the initiative efflux of drugs across the cell membrane via ATP-binding cassette transporter (ABC transporter).2 ABC transporters mainly include permeability glycoprotein (P-gp), MDR-related protein 1 (MRP1), and breast cancer resistance proteins (BCRP). Many chemotherapeutic agents are substrates of ABC transporters, which are pumped out of cells and as a result their intracellular accumulation is reduced.3 It has been found that, when tumor cells exposed to a cytotoxic agent induce cross-resistance, ABC transporter expression moves from higher expressing cells to the cells that have low expression of the corresponding protein in a wave and stepwise manner. Consequently, the sensitive cells with low expression of drug transporter turn into resistant ones.4,5 To solve this clinical problem, the induction effects of drugs on protein and the inhibitor of ABC transporter have been extensively studied.6–10
To induce drug resistance, cells are treated with the drug until they become resistant, and then protein expression in the resistance cell line is detected and compared with that in the parental cell line.7,9,11–17 However, there are many contradictory results from different studies that cannot be explained. For example, in the studies of the induction effects of adriamycin (ADM) on MRP1 (short-term drug exposure), Louisa et al7 proved that the resistance of MCF-7/ADM is closely related to the overexpression of MRP1, while Yan et al15 claimed that the MRP1 expression in HepG-2/ADM and SMMC-7721/ADM was not significantly higher than that in the parental cells. Different types of cell lines used in the two experiments may explain the contradictory results. However, Zhai et al18 showed that MRP1 was overexpressed in HepG-2/ADM, using the same type of cell line as Yan et al but with a contrary conclusion.
Assumptions to these phenomena are explained as follows. 1) The determinant of whether the drug can induce drug resistance of cells is the cell’s type. The drug is the less important contributor. 2) The methods used are qualitative or semiquantitative which are not precise enough to observe minor differences caused by the drug. Meanwhile, the clinical results were disappointing because of the lack of proper analysis techniques to monitor the accurate level of ABC transporters.19,20 So, it is necessary to establish a quantitative assay for the quantification of P-gp, MRP1, and BCRP to study the pattern of ABC transporters overexpression in the development of drug resistance in different types of cell lines.
Quantitative targeted absolute proteomics (QTAP) is a new technology based on biological mass spectrometry (MS), which demonstrates remarkable abilities of separating and measuring the target protein from the biological matrix.21 Amino acid sequence-dependent mass transitions of protein-specific peptides (surrogate peptide) generated by tryptic digestion are monitored for quantification.22 The multiple reaction monitoring mode (MRM) of MS can be used to filter the parent and fragments ions; so surrogate peptide can be detected from biological samples to quantify the target protein.
In this paper, a novel and advanced liquid chromatography (LC)/MS/MS-based QTAP assay for the quantification of P-gp, MRP1, and BCRP was developed and validated. Different concentrations of ADM, mitoxantrone (MX), and methotrexate (MTX) were used to induce the cell lines MCF-7, HepG-2, and SMMC-7721 to establish resistance cell lines. Then, the assay was applied to comprehensively analyze the expression of the ABC transporters in these resistance cell lines, and the corresponding gene expression was determined using real-time polymerase chain reaction (RT-PCR) to evaluate the consistency between mRNA and protein expression.
Materials and methods
Chemicals and reagents
MCF-7, HepG-2, and SMMC-7721 cell lines were all purchased from the Cell Bank of Chinese Academy of Sciences (Beijing, China). The protein quantification bicinchoninic acid (BCA) kit was purchased from Pierce Biotechnology (Rockford, IL, USA). Sequencing grade modified trypsin was purchased from Merck & Co, Inc (Whitehouse Station, NJ, USA). HPLC-grade acetonitrile and methanol were purchased from EMD Millipore (Billerica, MA, USA). The peptides and the stable isotope-labeled internal standards (IS) were obtained from Jill Biochemical Co (Shanghai, China). Human serum albumin (HSA) was obtained from Sigma-Aldrich (St Louis, MO, USA). Ammonium bicarbonate (NH4HCO3) was obtained from Qiangshun Chemical Reagent Co, Ltd (Shanghai, China). Dithiothreitol (DTT) was obtained from Amersco (Cleveland, OH, USA). Iodoacetamide (IAA), Tris/HCl, trifluoroacetic acid (TFA), and Triton X-114 were supplied by Sigma-Aldrich. Phosphate-buffered saline was purchased from the Beyotime Institute of Biotechnology (Jiangsu, China). Water was purified and deionized with a Milli-Q system manufactured by Merck Millipore (Billerica, MA, USA). Dulbecco’s modified Eagle’s medium (DMEM), RPMI-1640, and trypsin containing 0.25% EDTA were obtained from Thermo Fisher Scientific (Waltham, MA, USA). Fetal bovine serum and Trizol were also obtained from Thermo Fisher Scientific. Drugs ADM (CAS: 25316-40-9; Machlia, Shanghai, China), MTX (CAS: 59-05-2), and MX (CAS: 70476-82-3, ID: F818-ZHFX) were obtained from National Institutes for Food and Drug Control, China.
Identification of surrogate peptides and optimal MRMs
Surrogate peptides for P-gp, MRP1, and BCRP were determined using a combined approach of in silico predictions and experimental data. Briefly, a full protein sequence was obtained from National Center for Biotechnology Information (NCBI), and then a list of potential peptides was generated by using in silico digestion tools: UniProt (the regions of uncertainty and instability excluded) and Skyline (to predict peptides that the target protein digested and the MS information of every peptide). Protein specificity of each observed peptide was assured by NCBI protein Basic Local Alignment Search Tool search against the UniProtKB/Swiss-Prot database. Moreover, these peptides had to meet the following criteria. 1) Their mass range should to be detectable in triple quadrupole MS; only peptides with 7–22 amino acids can be selected. 2) Continuous sequence of arginine (R) or lysine (K) (eg, RR, KK, RK, or KR) (ragged ends) should be excluded as it may cause incomplete trypsin digestion. 3) The best proportion of hydrophobic amino acids is 25%–50% so as to ensure that the peptide selected can be completely dissolved in water.
In parallel, a Waters ACQUITY ultra performance liquid chromatography (UPLC) system consisting of a triple quadrupole mass spectrometer (UPLC-XEVO TQ-S MS; Waters Corporation, Milford, MA, USA) equipped with a sample management system (IntelliStart; Waters Corporation) was used to verify the appropriate specific peptide candidates. A programmable column management system (Waters Corporation) was used for sample analysis. In order to create optimal multiple reaction monitoring (MRM) methods for the best observed peptides, appropriate mass transitions for each peptide were identified and optimized by manual infusion of synthetic peptides and their stable isotope-labeled counterparts. For each peptide, the mass transitions of highest intensity were chosen.
LC–MS/MS analysis
The Waters ACQUITY UPLC system described above was used for sample analysis. The LC separations were performed on an ACQUITY UPLC BEH C18 column (2.1×50 mm, 1.7 μm; Waters Corporation) at 35°C. The mobile phase consisted of solvent A (0.1% formic acid in water) and solvent B (0.1% formic acid in methanol). A linear gradient with a flow rate of 0.5 mL/min was applied in the following manner: 2% B (5 minutes) → 2%–25% B (10 minutes) → 25% B (1 minute) → 45% B (2 minutes). The injection volume was 5 μL.
The mass spectrometer was equipped with electrospray ionization and operated in the positive ion mode to monitor the m/z transitions for all peptides and the corresponding IS peptides given in Table 1. The scheduled MRM acquisition method was constructed using manually optimized mass spectrometer source parameters: 1000 L/h desolvation gas flow, 3 kV spray voltage, and 350°C source temperature. Data were processed by integrating the appropriate peak areas from the reconstructed ion chromatograms for the 9-mer analytic peptides and the SIL-IS peptide using the Analyst 1.8.2 software (UNIFI Scientific Information System; Waters Corporation).
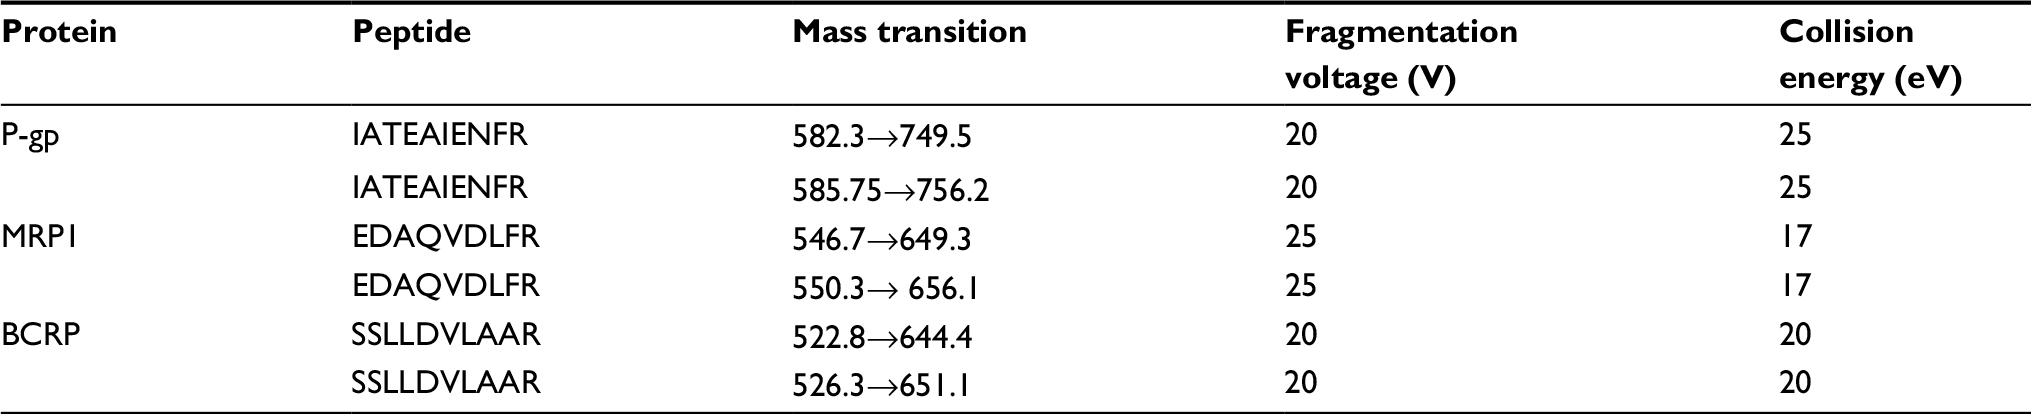 | Table 1 Details of mass transitions of m/z and mass spectrometry conditions Abbreviations: P-gp, permeability glycoprotein; MRP1, multidrug resistance-related protein 1; BCRP, breast cancer resistance proteins. |
Preparation of calibration curves, method validation
For preparation of calibration curves, digested HSA (digested as described below) was used as the blank matrix and was spiked with increasing amounts of chosen peptides. The calibration standards concentrations were 0.1, 0.2, 0.5, 1.0, 2.0, 5.0, 10, 20, 50, and 100 ng/mL. The standard quality control (QC) solutions for the lower limit of quantification (LLOQ), low QC, mid QC, and high QC were 0.1, 0.16, 4, and 80 ng/mL, respectively. The stock solution was diluted with water:acetonitrile (ACN) mixture (50:50, V/V) to prepare an IS solution (30 ng/mL).
Method validation involved detecting several key parameters to establish credibility in assay performance, linearity, LLOQ, accuracy and precision, and the blank matrix effect as well as stability. Sample analysis was conducted according to current regulatory guidelines for macromolecular proteins. A double blank without any peptides and a zero standard containing IS peptides were analyzed in duplicate for the calibration curve. QC samples which spiked with analytic peptide to specific final concentrations in normal human serum were tested in five replicates.
Stability was evaluated by analyzing QC samples (0.16, 4, and 80 ng/mL) exposed to different conditions: at room temperature for 6 hours before sample preparation, and at room temperature for 16 hours after sample preparation. Peptide stability during overnight tryptic digestion was studied by measuring the prepared samples immediately before and after incubation for 16 hours at 37°C.
The protein digestion efficiency was determined by using a membrane protein processed as described which was digested for 2, 4, 16, and 24 hours at 37°C. In each case, 200 μg membrane protein was digested in triplicate and the peptide concentration was detected for P-gp, MRP1, and BCRP as these transporters are known to be expressed in drug-resistant cell lines. The concentrations of target proteins under different times of digestion were divided by that digested for 16 hours to calculate the digestion efficiency.
Development of resistance cell lines and membrane protein extraction
The MTT method was used to measure the half maximal inhibitory concentration values (IC50) of ADM, MX, and MTX on each cell line, and the average of IC50 was used as the initial induction concentration of each drug: ADM is 0.168 μg/mL, MX is 0.209 μg/mL, and MTX is 0.319 μg/mL. Cell lines MCF-7 and HepG-2 were maintained in DMEM media and SMMC-7721 was cultured in RPMI-1640 media, all supplemented with 10% FBS, 100 units penicillin, and 100 µg/mL streptomycin at 37°C and 5% CO2. Cell lines MCF-7, HepG-2, and SMMC-7721 were induced by different concentrations of ADM, MX, and MTX, respectively, to establish resistance cell lines (MCF-7/ADM, MCF-7/MX, MCF-7/MTX, HepG-2/ADM, HepG-2/MX, HepG-2/MTX, SMMC-7721/ADM, SMMC-7721/MX, and SMMC-7721/MTX). The parental cell lines were induced by drugs under 1/10 of the initial induction concentrations, and then the concentrations were gradually increased. After 7–9 passages (21–27 days), the parental cells developed drug resistance. After that, the concentration of the drug was increased until the cell lines could grow steadily at concentrations of 1, 2, and 3 times of the initial concentration.
Cells whose numbers were diluted to 106–107 were pelleted at 1500×g for 10 minutes, and then suspended in 500 μL of 1% Triton X-114 extraction buffer (1 mM DTT, 2 mM EDTA in 50 mM Tris/HCl, pH 7.4) containing a protease inhibitor cocktail. The samples were incubated on ice for 30 minutes with a 1–2 minute shake in every 10 minutes, and then incubated for 10 minutes at 37°C. For separating the detergent and aqueous phases, the samples were centrifuged at 10,000×g for 10 minutes. Then, 500 μL of the 1% Triton X-114 extraction buffer and 500 μL of 0.06% Triton X-114 wash buffer (1 mM DTT, 2 mM EDTA in 50 mM Tris/HCl, pH 7.4) were added into the aqueous phase and the detergent phase, respectively. For achieving complete extraction, the incubation and centrifugation steps were repeated. Then, the retained protein pellet was pooled and precipitated in cold acetone at −20°C for 1 hour. Finally, the protein pellet was resuspended in 1% SDS and stored at −80°C before analysis. Total isolated membrane protein concentration in the sample was determined using the BCA protein assay kit.
Trypsin digestion
The concentration of the membrane fraction exacted was diluted to 2 mg/mL. Then, 100 μL of the cell membrane fraction was mixed with 50 μL of 50 mM NH4HCO3 buffer (pH 7.8). The mixture was vortexed for 2 minutes, reduced with 10 mM DTT at 60°C for 20 minutes. Then, the mixture was alkylated with 50 mM IAA in 50 mM ammonium and incubated at room temperature for 6 hours in the dark. After adding SIL-IS (30 ng/mL, 20 μL) and vortexing for 30 seconds, the protein samples were digested by sequence-grade trypsin (trypsin:protein =1:20, w/w) at 37°C for 16 hours in the dark. Thereafter, 20 μL of 10% TFA was added to terminate digestion. The final tryptic digestion was centrifuged at 16,000×g, 4°C for 15 minutes, and the supernatant was evaporated under a gentle stream of nitrogen at 45°C. The residue was dissolved by 100 μL of the mobile phase. After centrifugation at 16,000×g, at 4°C for 15 minutes, 5 μL of the supernatant was injected into the UPLC-MS/MS system. Following this, 100 μL solutions of each standard and QC were just subjected to tryptic digestion.
Gene expression analysis
Total RNA from MCF-7, HepG-2, and SMMC-7721 cell lines and corresponding resistant cells were extracted by Trizol. An iQ5 RT-PCR, ABI 7500 instrument (Bio-Rad Laboratories Inc, Hercules, CA, USA) was used to carry out RT-PCR. The following primers were used: GAPDH (F), 5′-TGGGGAAACAGGGTAATGAG-3′; GAPDH (R), 5′-CTGGCCTTTGGTCTTTTTGA-3′; ABCB1 (F), 5′-AACTTCCGAACCGTTGTTTC-3′; ABCB1 (R), 5′-CCAAAGATGTGTGCTTTCCTC-3′; ABCC1 (F), 5′-CTACCTCCTGTGGCTGAATC-3′; ABCC1 (R), 5′-ATCAGCTTGATCCGATTGTC-3′; ABCG2 (F), 5′-ACAGGTGGAGGCAAATCTTC-3′; ABCG2 (R), 5′-GCGGTGCTCCATTTATCAG-3′. Reactions were performed in triplicate for three biological replicates, and GAPDH mRNA levels were used for normalization. Melt-curve analysis was performed to ensure that the mRNA-specific fragments were amplified and the standard curve method was used for data analysis.
Statistical analysis
Statistical analysis was performed using SPSS for Windows version 22. (IBM Corporation, Armonk, NY, USA). Student’s t-test was used to compare two groups and Friedman M test was used to evaluate differences between three or more groups. The significance level P-value was set at 0.05.
Results and discussion
LC–MS/MS assay development and validation
LC–MS/MS analysis
To our knowledge, a validated method for quantification of P-gp, MRP1, and BCRP in resistance cell lines has not been developed so far. A prerequisite factor to achieve accurate quantification of proteins is the generation of high-quality MRM (multiple reaction monitoring).23 In order to create the best optimal MRM methods for detecting peptides, appropriate mass transitions for each peptide were identified and optimized by surrogate peptides and their stable isotope-labeled counterparts to a Waters TQ-S. Details of mass transitions of m/z and MS conditions are shown in Table 1.
By using long gradient elution with a reverse phase column, chromatography was used to separate surrogate peptides from the complex biological matrix. A Waters ACQUITY UPLC system and a high flow rate of 0.5 mL/min were used to increase the chromatographic resolution. The first 5 minutes were directed to exclude hydrophilic compounds and salts. As there was no blank matrix for cell lines available, HSA was used as validation matrix to investigate the matrix effect. The resulting chromatograms for the method in digested HSA and samples are shown in Figure 1.
 | Figure 1 Chromatograms for surrogate peptides. Notes: Total ion chromatograms for the developed LC–MS/MS method applied to measure surrogate peptides and their stable isotope-labeled IS peptides in human serum albumin (A) and in membrane protein (B). Abbreviations: P-gp, permeability glycoprotein; MRP1, multidrug resistance-related protein 1; BCRP, breast cancer resistance proteins; cps, counts per second; LC, liquid chromatography; MS, mass spectrometry; IS, internal standards. |
Method validation
There was a positive linear correlation between peptide concentration and the analytical signal for the entire validation range (0.1–100 nM) observed (1/x weighting) in each case. The correlation coefficients (r) for all calibration curves of all peptides (in each case N=10) were all >0.994 (P-gp: 0.997, MRP1: 0.998, BRCP: 0.994). The LLOQ of our analytical assays for P-gp, MRP1, and BCRP were all 0.1 nM, which is better than the LLOQ values from previously published LC–MS/MS methods.23–25
The precision and accuracy of the assay were assessed by observing the response of the QC samples with three different concentrations of each protein (0.16, 4, 80 ng/mL) in three validation runs (n=15). The intra and interday precisions were expressed as the percent coefficient of variation. Accuracy was obtained by comparing the average calculated concentrations to their nominal values (%bias). Intraday as well as interday accuracies for all peptides in the validation matrix were within the required range of ±10% (±15% at LLOQ) and the precision was within the required range of ±10% (±10% at LLOQ). The details are listed in Table 2.
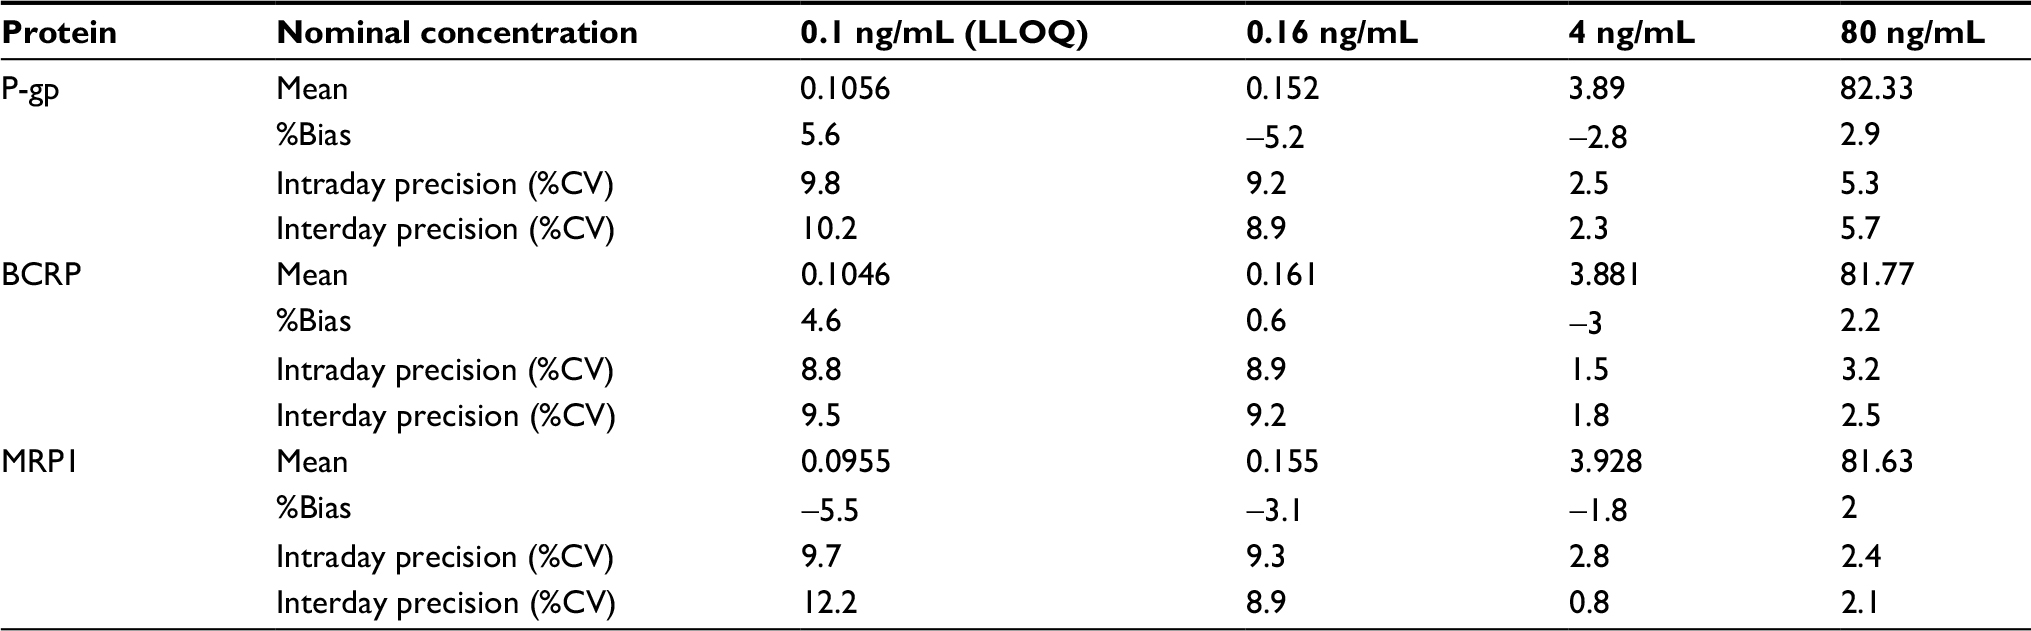 | Table 2 Intra and interday accuracy and precision for the determination of transporter proteins in human serum albumin (2 mg/mL) Abbreviations: P-gp, permeability glycoprotein; MRP1, multidrug resistance-related protein 1; BCRP, breast cancer resistance proteins; LLOQ, lower limit of quantification; %CV, percent coefficient of variation. |
Digestion efficiency
To detect a surrogate peptide as an alternative to the target protein, insufficient digestion was a confounding interference to measurements. The protein digestion efficiency is shown in Figure 2. It can be observed that BCRP reached complete digestion after 16 hours while the digestion efficiency was nearly unchanged for MRP1. The different size and structure of proteins may be the reason that caused the difference in digestion efficiency. For P-gp, the digestion efficiency slowly decreased after 4 hours. However, the slippage between 4 and 16 hours digestion was still within its digestion stability (Table 3). As a compromise, the overnight digestion (16 hours) procedure was used for intestinal samples to make sure of complete digestion.
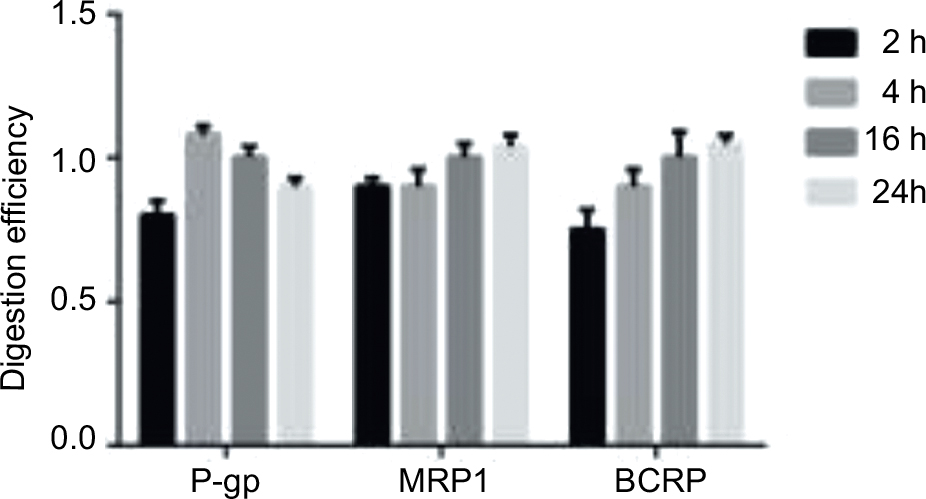 | Figure 2 Digestion efficiency of different ABC transporters in membrane protein (each 200 μg). Notes: Digestion efficiency of different ABC transporters in membrane protein (each 200 μg) after tryptic digestion (1:40) at 37°C for 2, 4, 16, and 24 hours. All experiments were performed in triplicate (mean ± SD is given). Abbreviations: P-gp, permeability glycoprotein; MRP1, multidrug resistance-related protein 1; BCRP, breast cancer resistance proteins. |
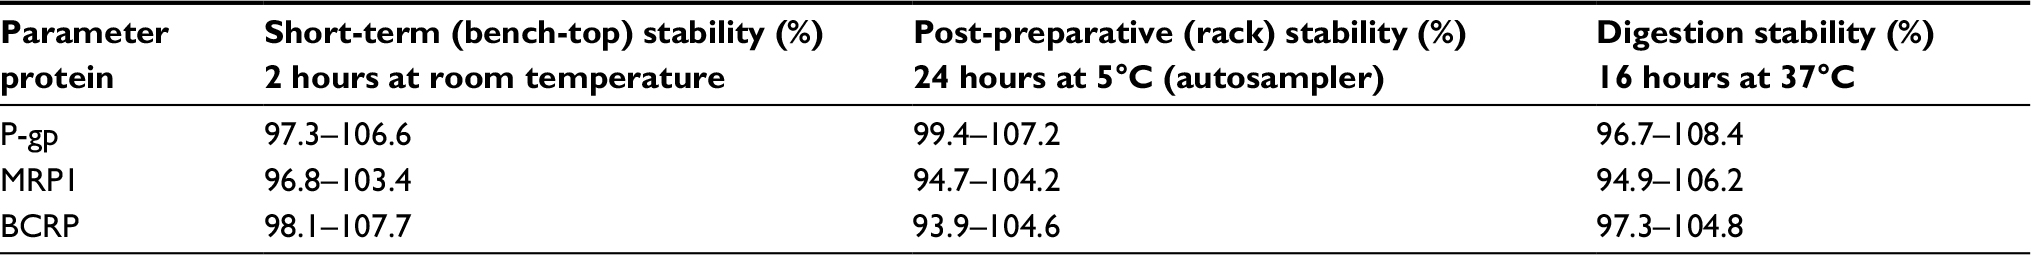 | Table 3 Results of stability tests for transporter-specific peptides Notes: Results are given as mean values in percentages of the respective initial concentrations. All values were derived from (in each case) three quality control sample sets (0.16, 4, and 80 ng/mL) in digested HSA (2 mg/mL). Abbreviations: P-gp, permeability glycoprotein; MRP1, multidrug resistance-related protein 1; BCRP, breast cancer resistance proteins; HSA, human serum albumin. |
Quantification of target proteins
Expression levels of target proteins in parental cell lines
In order to determine whether ABC transporter overexpression in the development of MDR was affected by the cell type as assumed above, the target proteins concentrations in parental cell lines were firstly determined before induction. The result is shown in Figure 3. Friedman M test was used to analyze these data. It can be confirmed that the expression levels of the proteins in the three types of cell lines are different (P<0.05). The P-gp expression in SMMC-7721 and the MRP1 and BCRP expression in MCF-7 were higher than the others. The concentration of MRP1 in the three cell lines was significantly lower than the other two proteins; it has been reported earlier that P-gp and BCRP were at a much higher level than MRP1 in liver tissue or hepatocellular carcinoma cell lines.26 Also, the proteins expression in HepG-2 was lower than those in the other two cell lines. Meanwhile, the IC50 values of the parental HepG-2 cell line of ADM, MX, and MTX were also lower than those in the other two cell lines (data not shown).
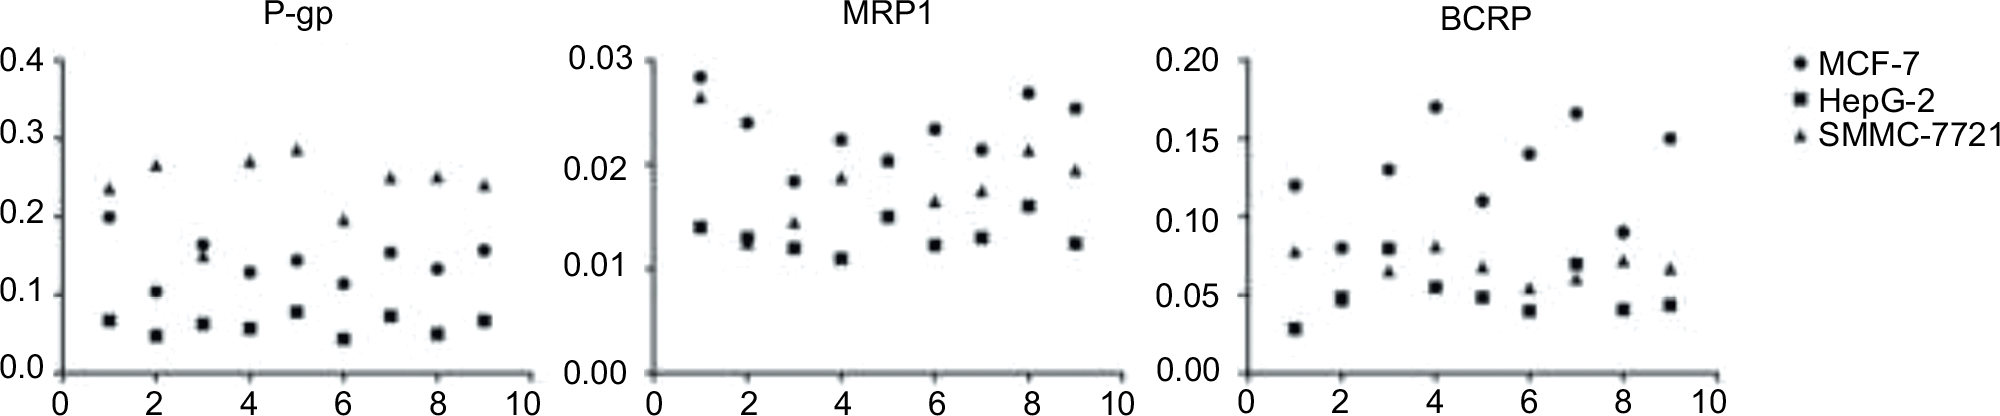 | Figure 3 Transporter proteins expression in parental cell lines. Abbreviations: P-gp, permeability glycoprotein; MRP1, multidrug resistance-related protein 1; BCRP, breast cancer resistance proteins. |
Induction effect of drug on ABC transporter
The target proteins overexpression in resistance cell lines was monitored in quadruplicate (Figure 4). It is easy to note that the induction effects of the drugs on the protein are relatively stable, and during the process of drug resistance, the expression levels of the three proteins increased. However, the induction effect of different drugs on proteins is selective.
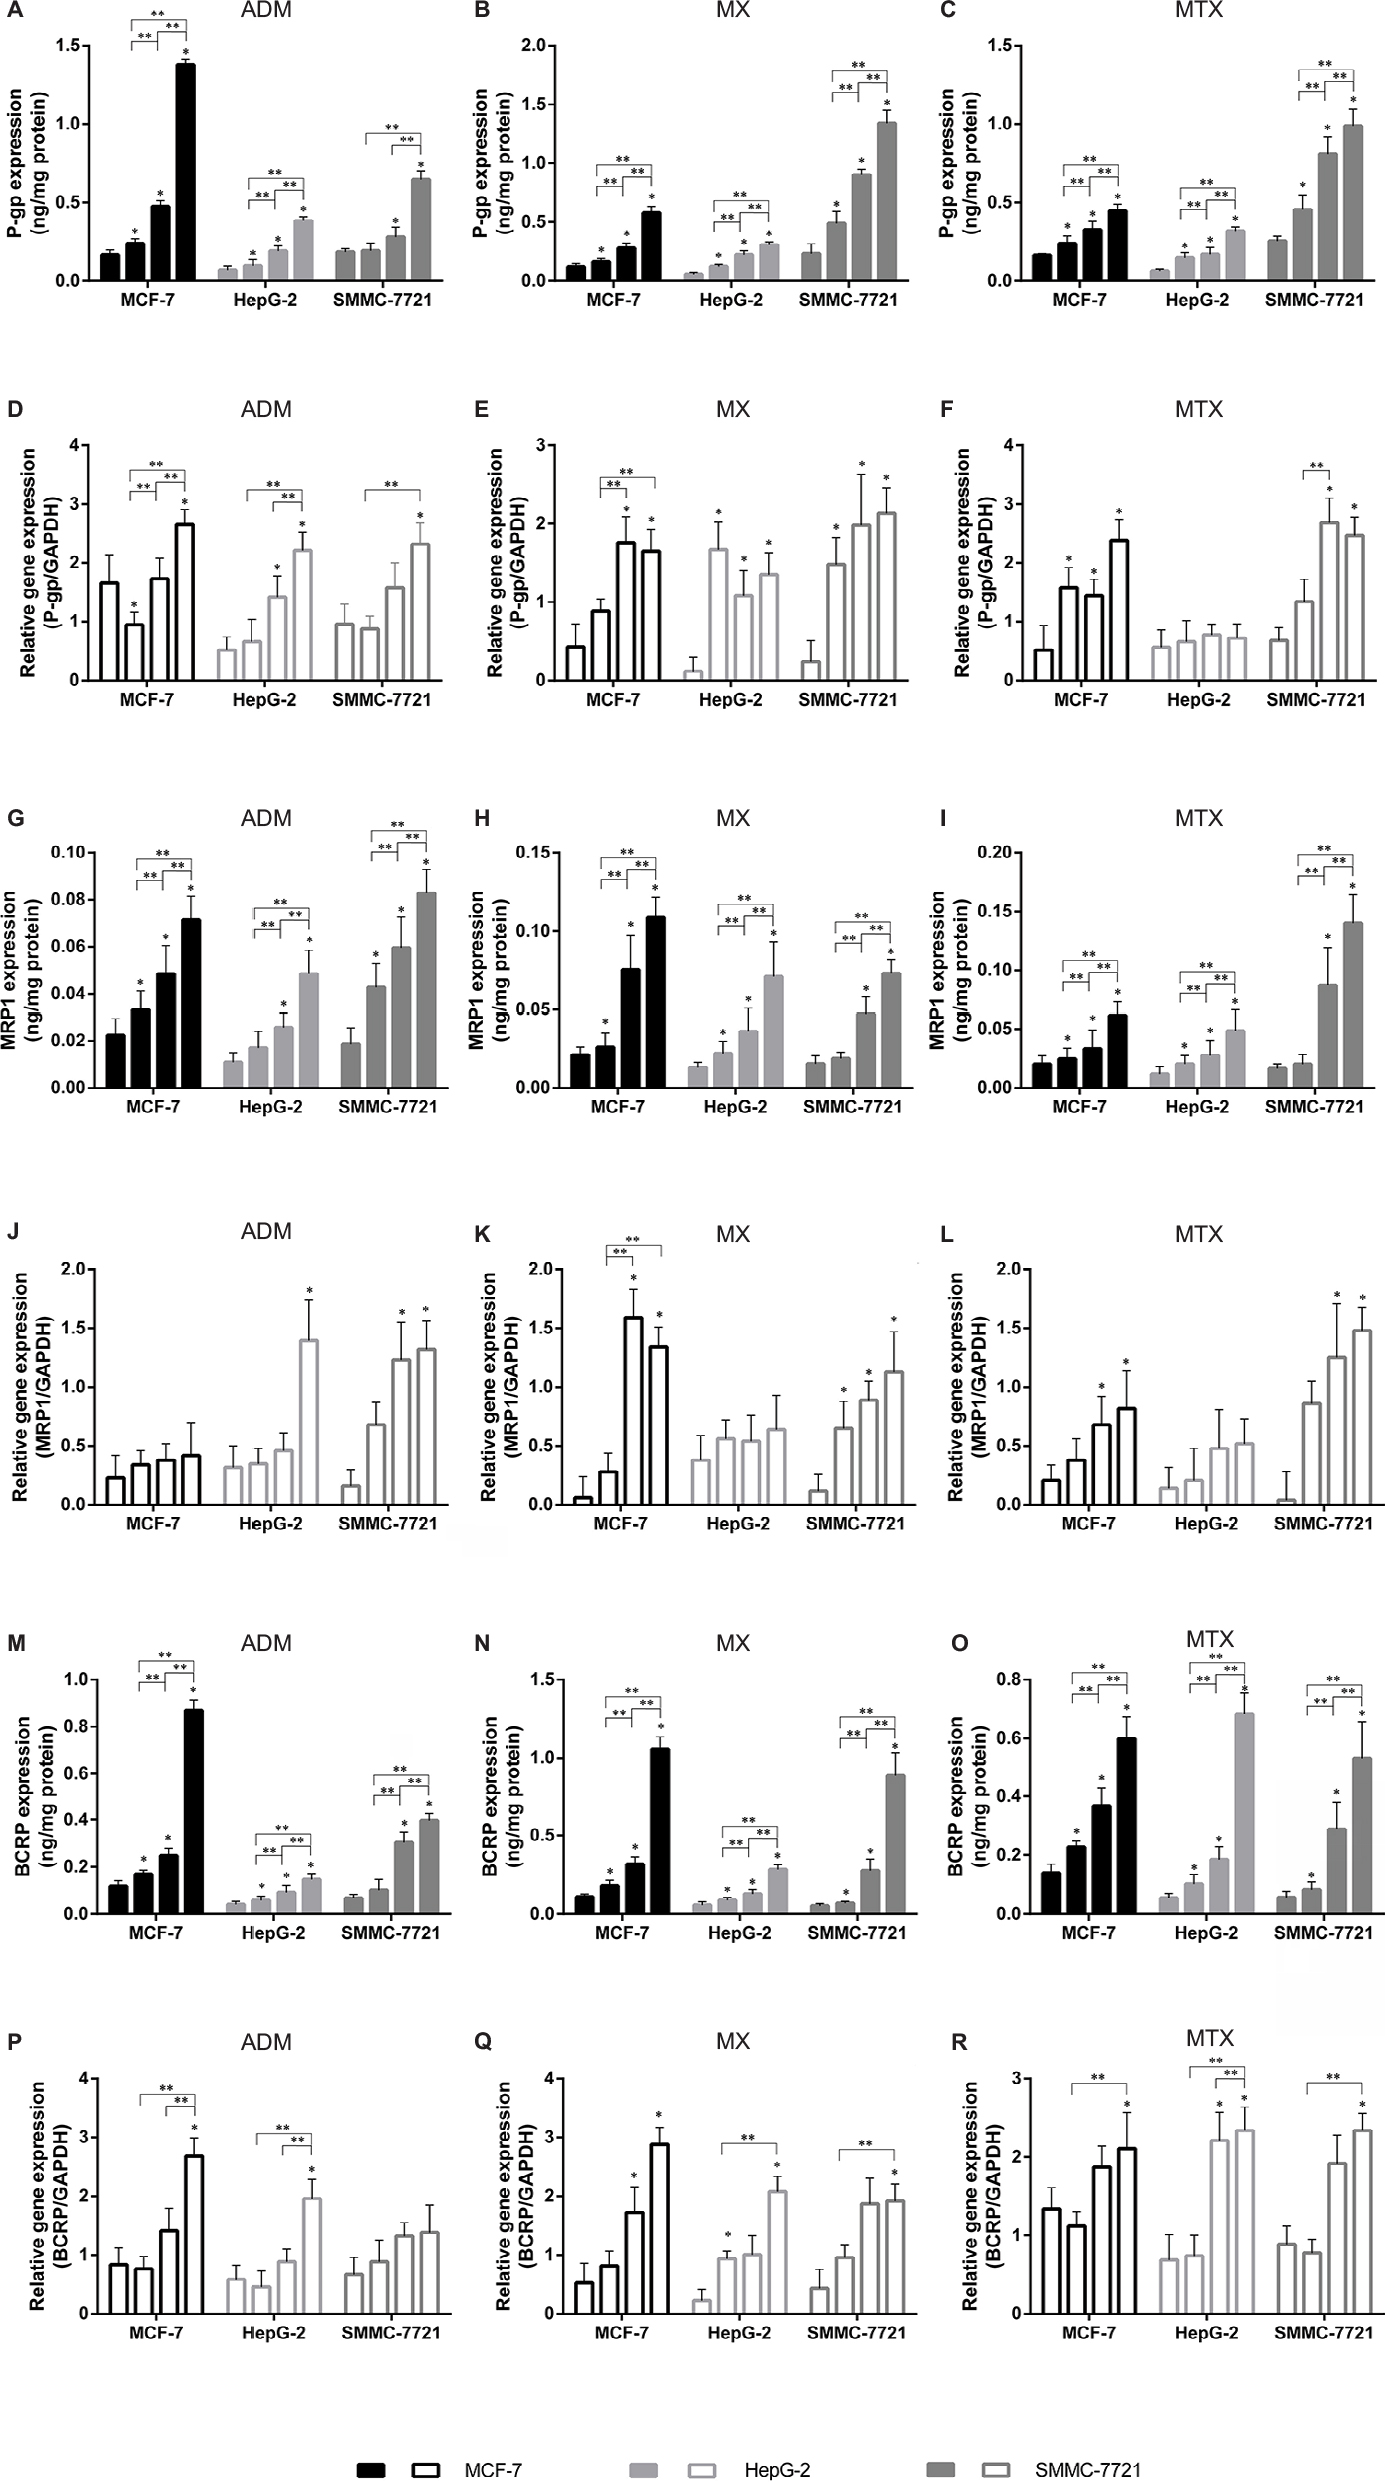 | Figure 4 Analysis of transporter proteins expression and corresponding genes expression. Notes: Analysis of transporter proteins expression induced by drugs (P-gp/ADM, A; P-gp/MX, B; P-gp/MTX, C; MRP1/ADM, G; MRP1/MX, H; MRP1/MTX, I; BCRP/ADM, M; BCRP/MX, N; BCRP/MTX, O) and corresponding gene expression (ABCB1/ADM, D; ABCB1/MX, E; ABCB1/MTX, F; ABCC1/ADM, J; ABCC2/MX, K; ABCC2/MTX, L; ABCG2/ADM, P; ABCG2/MX, Q; ABCG2/MTX, R) in resistance cell lines. Data are given in mean ± SEM. *P<0.01, significant differences between parental cells and drug-resistant cell lines; **P<0.01, significant differences between drug-resistant cell lines treated with the same chemotherapeutic drugs. Abbreviations: P-gp, permeability glycoprotein; MRP1, multidrug resistance-related protein 1; BCRP, breast cancer resistance proteins; ADM, adriamycin; MX, mitoxantrone; MTX, methotrexate; SEM, standard error of mean. |
When cell lines were induced by ADM, the expression of P-gp and BCRP increased rapidly. At the end of the induction, in MCF-7, P-gp expression increased by 6.9 times (Figure 4A), while BCRP expression increased by 7.2 times (p); in HepG-2, P-gp expression increased by 5.7 times (Figure 4A), while BCRP expression increased by 5.1 times (p); in SMMC-7721, P-gp expression increased by 4.7 times (Figure 4A), while BCRP expression increased by 5.0 times (p). However, the MRP1 expression increased relatively slowly (in MCF-7: 2.3 times, in HepG-2: 2.8 times, in SMMC-7721: 2.6 times) (g). When cell lines were treated with MX, all three proteins expression increased, but the induction degree of MX to MRP1 was significantly greater than that of ADM (in MCF-7: 4.7 times, in HepG-2: 7.1 times, in SMMC-7721: 5.9 times) (h), which means MX can selectively induce MRP1 to overexpress in resistance cells. MTX can also cause ABC transporters overexpression, but no obvious selectivity is found.
There have been numerous published studies consistent with the results of the induction effect of drugs on ABC transporter in this experiment. Meanwhile, studies which used other types of cancer cells to establish resistant cell lines also match the conclusions of this paper (Table 4).
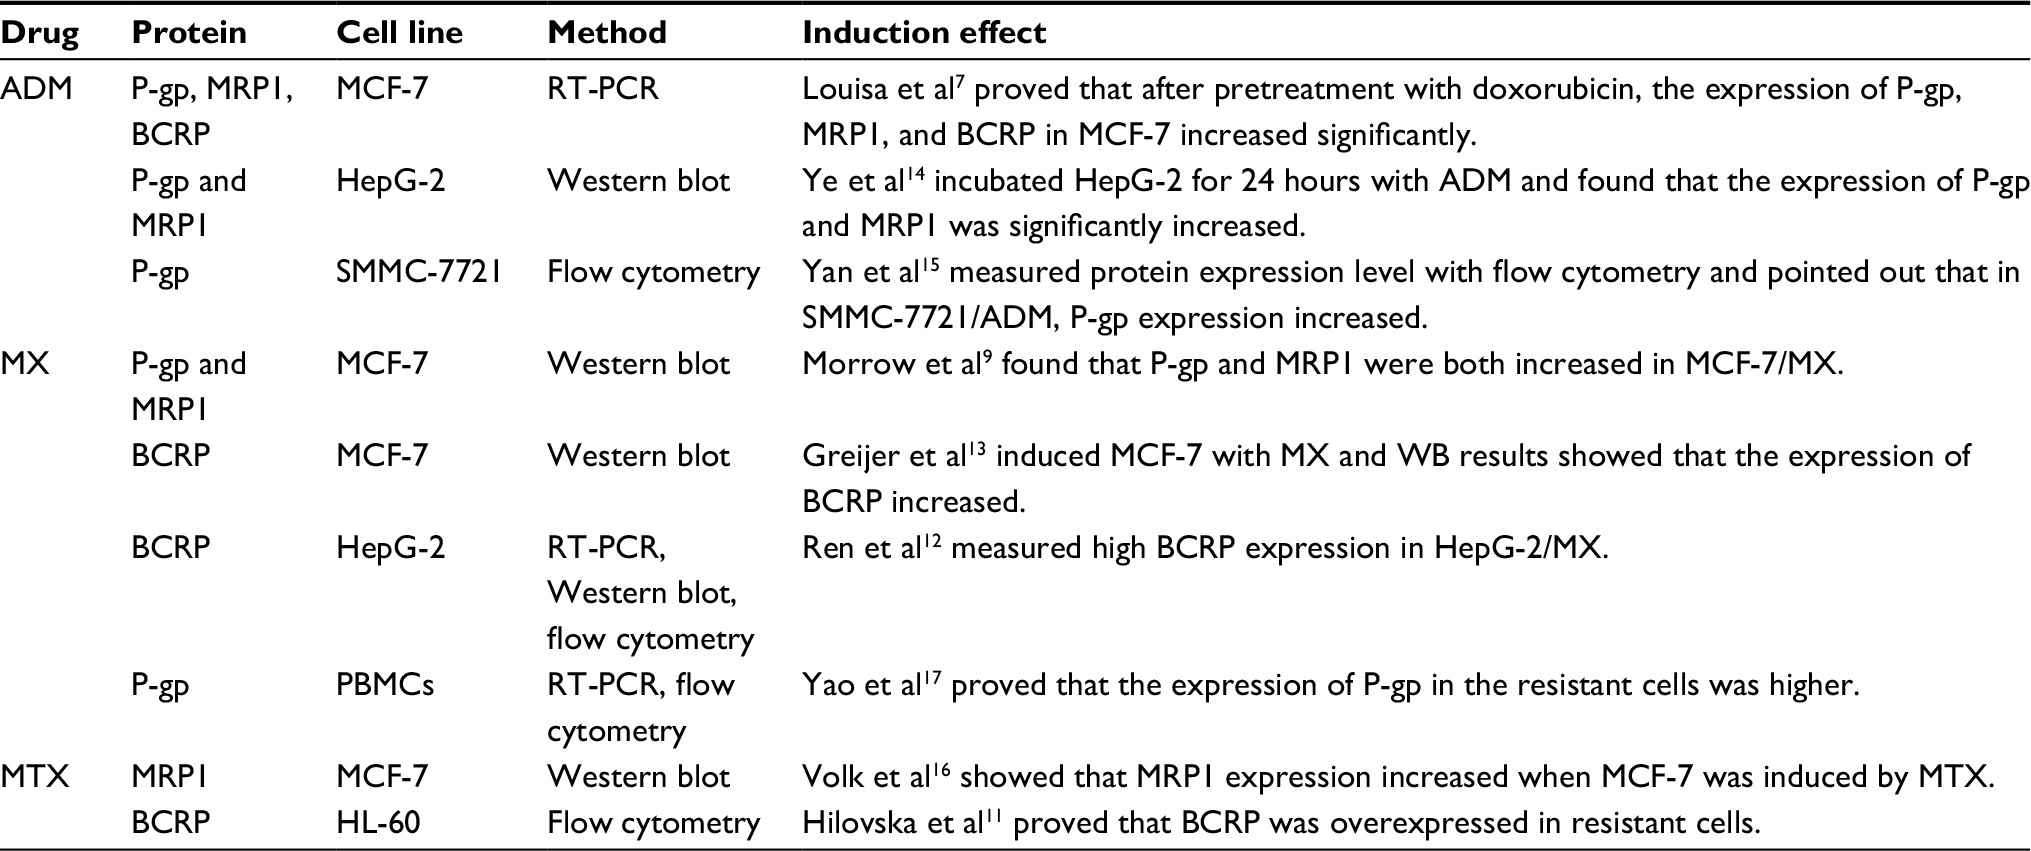 | Table 4 Related reports in published studies which are consistent with our experimental results about the induction effect of drugs on ABC transporter Abbreviations: P-gp, permeability glycoprotein; MRP1, multidrug resistance-related protein 1; BCRP, breast cancer resistance proteins; ADM, adriamycin; MX, mitoxantrone; MTX, methotrexate; PBMCs, peripheral blood mononuclear cells; RT-PCR, real-time polymerase chain reaction; WB, Western blot. |
To study whether the level of target proteins expression in all resistant cells is related to its gene, target proteins mRNA expression was investigated by RT-PCR. The observations from different multidrug-resistant cell lines did not show the same pattern of protein or mRNA level of target proteins expression. Although RT-PCR can provide valuable information of protein expression on transcriptional level, it often lacks necessary precision and reproducibility for monitoring subtle changes. In Figure 4, RT-PCR results showed that most of the target mRNA did not change significantly in the process of MDR while the corresponding protein amount increased gradually.
Meanwhile, the result of the transcript analysis could not be used as direct evidence for protein expression. It has been reported that proteins levels were not always in agreement with the level of its mRNA. For example, Gomez-Martinez et al27 have shown that the changes of P-gp mRNA expression did not influence P-gp protein activity but did affect P-gp mRNA destabilization and P-gp translation inhibition. Taipalensuu et al28 have pointed out that the transcript analysis’ predictive power of protein expression has to be investigated on a case-by-case basis. Therefore, the mRNA level only gives hints on a general pattern of expression but no information on the actual level of protein expression.29
Relationship between ABC transporters expression level and type of cell line
The absolute concentration and relative value (protein concentration in resistance cell line divided by that in the parental cell line) of P-gp, MRP1, and BCRP were detected and calculated, and Friedman M test was used to determine whether the expression pattern of the proteins was affected by the cell type. As is shown in Table 5, there were significant differences in the absolute concentration of proteins expression among different types of cell lines (P<0.05), but no statistically significant difference in the relative value (P>0.05).
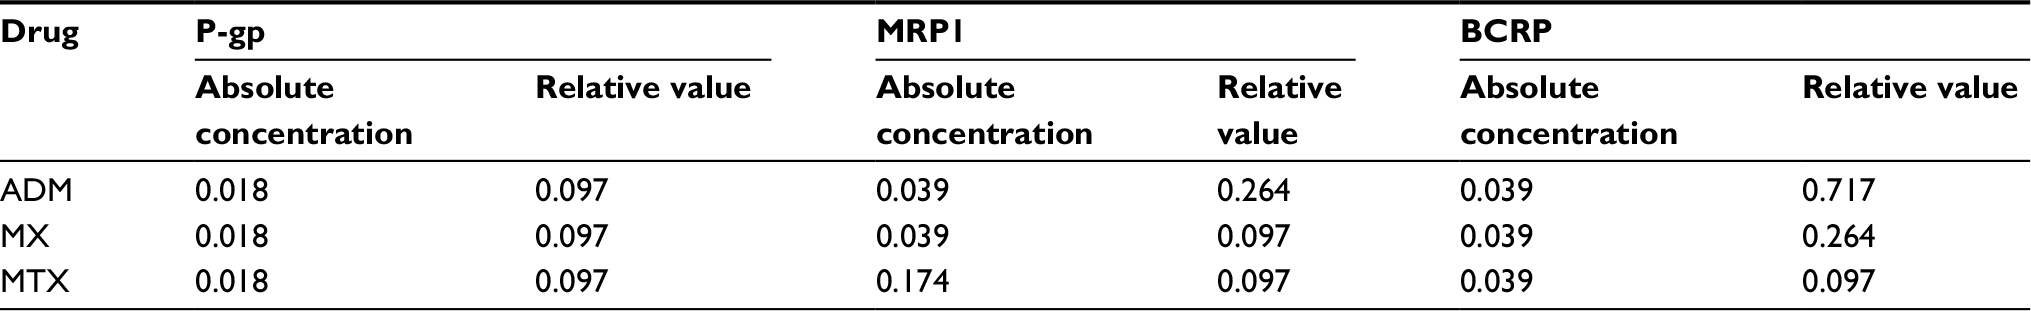 | Table 5 P-values of absolute concentration and relative value of ABC transporters overexpression (n=16) Abbreviations: P-gp, permeability glycoprotein; MRP1, multidrug resistance-related protein 1; BCRP, breast cancer resistance proteins; ADM, adriamycin; MX, mitoxantrone; MTX, methotrexate. |
The result in our experiment shows that during the development of drug resistance, the expression level of ABC transporters was affected by the cell’s ability to express corresponding proteins. The cell type and patch were the most important determinant factors of the overexpression level of ABC transporters in resistance cell lines, instead of the drug (Figure 5). Our conclusion about the pattern of ABC transporters overexpression also conforms to the resistance mechanism mentioned above. The reason for the contradictory results in other published studies may be the different type of cell lines they used causing different levels of ABC transport expression. For studies which used the same type of cell line but yet resulted in contrary conclusions, the reasoning may be that the semiquantitative method they used may not have been precise enough to observe minor differences caused by the drug.
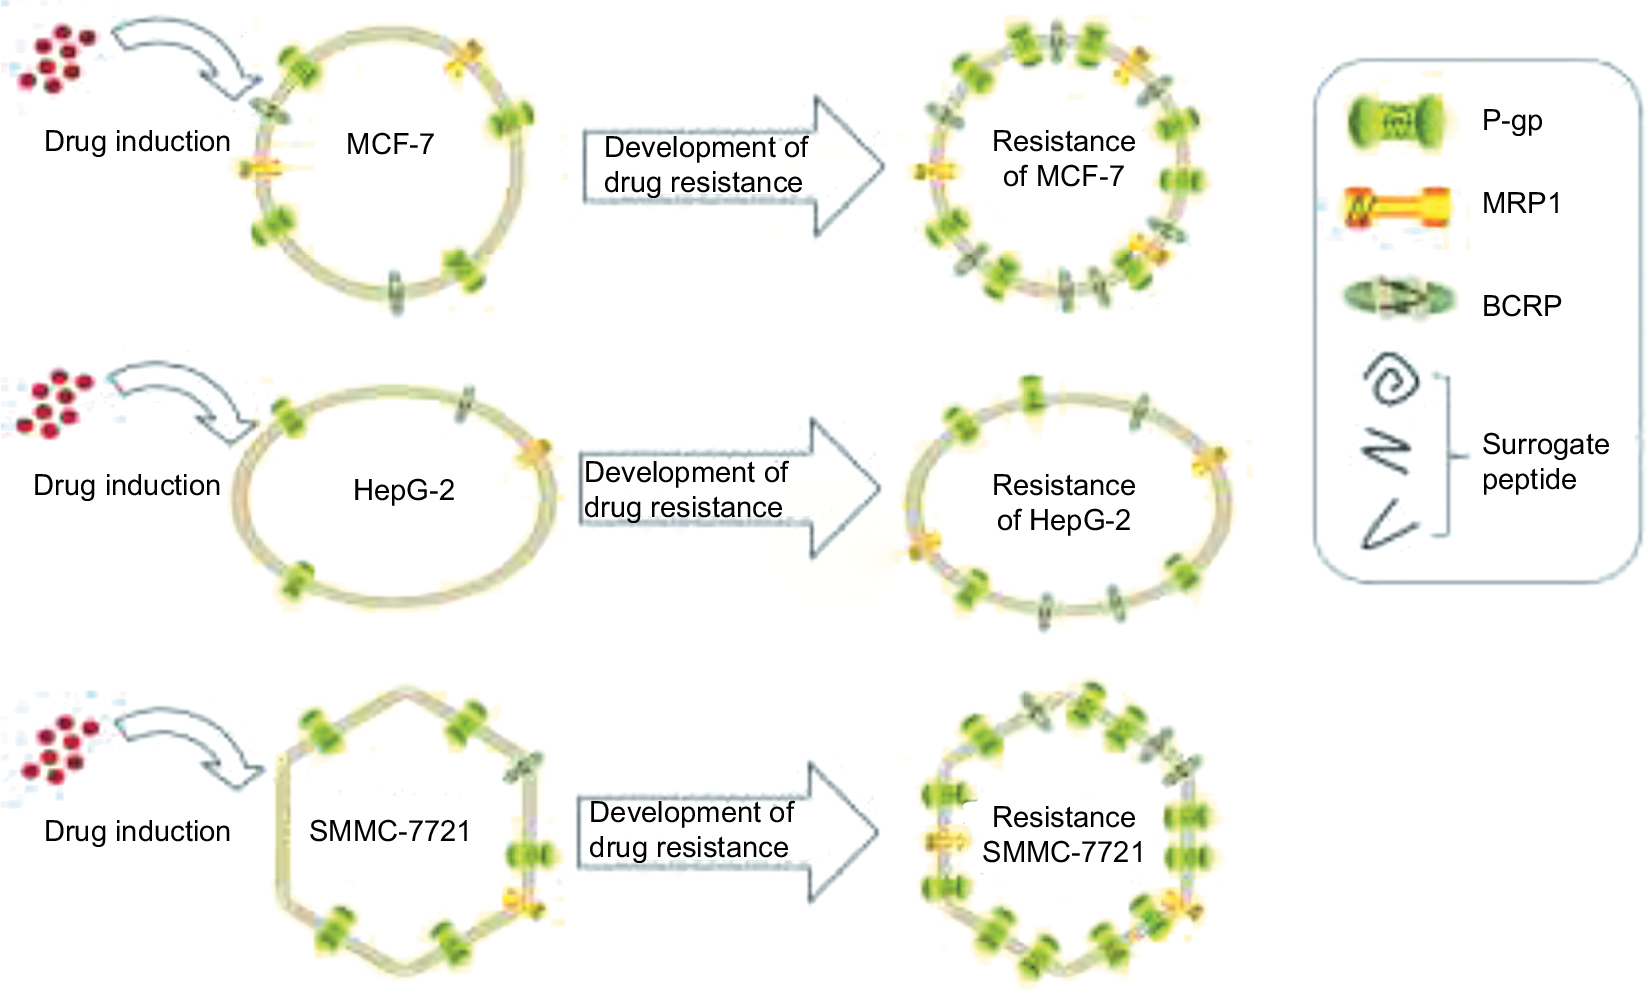 | Figure 5 The overexpression of ABC transporters in cells and its effect on the development of drug resistance. |
Conclusion
In our study, an LC–MS/MS-based targeted proteomics assay for the quantification of P-gp, MRP1, and BCRP was developed by measuring the corresponding surrogate peptides. The method was shown to possess sufficient specificity, sensitivity, accuracy, precision, and stability to measure transporter proteins in the drug-resistant cell lines. Using this assay, the amounts of target proteins in drug-resistant cells induced by different concentrations of ADM, MX, and MTX were successfully measured.
The result shows that the induction effects of drugs on proteins are relatively stable and selective. The expression levels of P-gp, MRP1, and BCRP in the parental cells of MCF-7, HepG-2, and SMMC-7721 were different. Also, during the development of drug resistance, the cell type and patch were the most important determinant factors of the level of ABC transporters overexpression, instead of the drug type. This study provides a good foundation for understanding the development of drug resistance in cell lines and can be used to explain the contradictory results in other published studies. When monitoring the expression of drug-resistant proteins, researchers can choose to use a quantitative method as an analysis technique to avoid the shortcomings of Western blot/RT-PCR.
Acknowledgments
This study was supported by Hunan Provincial Natural Science Foundation of China (S2017JJMSXM1571). The authors thank Prof Tao Yin, Department of Pharmacy, Xiangya Hospital, for a review of the statistical analysis; and Prof Ouyang, Hunan Key Laboratory for Bioanalysis of Complex Matrix Samples, for providing the mass spectrometer for this study.
Disclosure
The authors report no conflicts of interest in this work.
References
Prasad B, Evers R, Gupta A, et al. Interindividual variability in hepatic organic anion-transporting polypeptides and P-glycoprotein (ABCB1) protein expression: quantification by liquid chromatography tandem mass spectroscopy and influence of genotype, age, and sex. Drug Metab Dispos. 2014;42(1):78–88. | ||
Prasad B, Lai Y, Lin Y, Unadkat JD. Interindividual variability in the hepatic expression of the human breast cancer resistance protein (BCRP/ABCG2): effect of age, sex, and genotype. J Pharm Sci. 2013;102(3):787–793. | ||
Kathawala RJ, Gupta P, Ashby CJ, Chen ZS. The modulation of ABC transporter-mediated multidrug resistance in cancer: a review of the past decade. Drug Resist Updat. 2015;18:1–17. | ||
Shen F, Chu SA, Bailey B, et al. Quantitation of doxorubicin uptake, efflux, and modulation of multidrug resistance (MDR) in MDR human cancer cells. J Pharmacol Exp Ther. 2008;324(1):95–102. | ||
Szakacs G, Paterson JK, Ludwig JA, Booth-Genthe C, Gottesman MM. Targeting multidrug resistance in cancer. Nat Rev Drug Discov. 2006;5(3):219–234. | ||
Jia P, Wu S, Li F, et al. Breast cancer resistance protein-mediated topotecan resistance in ovarian cancer cells. Int J Gynecol Cancer. 2005;15(6):1042–1048. | ||
Louisa M, Soediro TM, Suyatna FD. In vitro modulation of P-glycoprotein, MRP-1 and BCRP expression by mangiferin in doxorubicin-treated MCF-7 cells. Asian Pac J Cancer Prev. 2014;15(4):1639–1642. | ||
Liu J, Li J, Liu N, et al. In vitro studies of phospholipid-modified PAMAM-siMDR1 complexes for the reversal of multidrug resistance in human breast cancer cells. Int J Pharm. 2017;530(1–2):291–299. | ||
Morrow CS, Peklak-Scott C, Bishwokarma B, Kute TE, Smitherman PK, Townsend AJ. Multidrug resistance protein 1 (MRP1, ABCC1) mediates resistance to mitoxantrone via glutathione-dependent drug efflux. Mol Pharmacol. 2006;69(4):1499–1505. | ||
Li J, Liu J, Guo N, Zhang X. Reversal of multidrug resistance in breast cancer MCF-7/ADR cells by h-R3-siMDR1-PAMAM complexes. Int J Pharm. 2016;511(1):436–445. | ||
Hilovska L, Jendzelovsky R, Jendzelovska Z, Koval J, Fedorocko P. Downregulation of BCRP and anti-apoptotic proteins by proadifen (SKF-525A) is responsible for the enhanced mitoxantrone accumulation and toxicity in mitoxantrone-resistant human promyelocytic leukemia cells. Int J Oncol. 2015;47(4):1572–1584. | ||
Ren ZG, Zhao Q, Wei YX, et al. Establishment of erlotinib-resistant HepG2 cell line and its resistant mechanisms. Chin J Pharmacol Toxicol. 2012;26(6):823–828. | ||
Greijer AE, de Jong MC, Scheffer GL, Shvarts A, van Diest PJ, van der Wall E. Hypoxia-induced acidification causes mitoxantrone resistance not mediated by drug transporters in human breast cancer cells. Cell Oncol. 2005;27(1):43–49. | ||
Ye CG, Wu WK, Yeung JH, et al. Indomethacin and SC236 enhance the cytotoxicity of doxorubicin in human hepatocellular carcinoma cells via inhibiting P-glycoprotein and MRP1 expression. Cancer Lett. 2011;304(2):90–96. | ||
Yan F, Wang XM, Liu ZC, Pan C, Yuan SB, Ma QM. JNK1, JNK2, and JNK3 are involved in P-glycoprotein-mediated multidrug resistance of hepatocellular carcinoma cells. Hepatobiliary Pancreat Dis Int. 2010;9(3):287–295. | ||
Volk EL, Rohde K, Rhee M, et al. Methotrexate cross-resistance in a mitoxantrone-selected multidrug-resistant MCF7 breast cancer cell line is attributable to enhanced energy-dependent drug efflux. Cancer Res. 2000;60(13):3514–3521. | ||
Yao X, Sun Y, Wukai MA, et al. [Over-expression of mdr1/P-gp is associated with methotrexate resistance in patients with rheumatoid arthritis]. Xi Bao Yu Fen Zi Mian Yi Xue Za Zhi. 2017;33(6):815–819. Chinese. | ||
Zhai BJ, Wu F, Shao ZY, Hu K, Zhao CL, Wang ZB. [Establishment of human hepatocellular carcinoma multidrug-resistance cell line (HepG2/Adm) and study apoptosis induced by low-frequency pulse ultrasound exposure]. Chin J Hepatol. 2004;12(2):95–98. Chinese. | ||
Garraway LA, Chabner B. MDR1 inhibition: less resistance or less relevance? Eur J Cancer. 2002;38(18):2337–2340. | ||
Leonard GD, Fojo T, Bates SE. The role of ABC transporters in clinical practice. Oncologist. 2003;8(5):411–424. | ||
Yassine H, Borges CR, Schaab MR, et al. Mass spectrometric immunoassay and MRM as targeted MS-based quantitative approaches in biomarker development: potential applications to cardiovascular disease and diabetes. Proteomics Clin Appl. 2013;7(7–8):528–540. | ||
Groer C, Bruck S, Lai Y, et al. LC-MS/MS-based quantification of clinically relevant intestinal uptake and efflux transporter proteins. J Pharm Biomed Anal. 2013;85:253–261. | ||
Yang T, Chen F, Xu F, Wang F, Xu Q, Chen Y. A liquid chromatography-tandem mass spectrometry-based targeted proteomics assay for monitoring P-glycoprotein levels in human breast tissue. Clin Chim Acta. 2014;436:283–289. | ||
Li N, Palandra J, Nemirovskiy OV, Lai Y. LC-MS/MS mediated absolute quantification and comparison of bile salt export pump and breast cancer resistance protein in livers and hepatocytes across species. Anal Chem. 2009;81(6):2251–2259. | ||
Zhang Y, Li N, Brown PW, Ozer JS, Lai Y. Liquid chromatography/tandem mass spectrometry based targeted proteomics quantification of P-glycoprotein in various biological samples. Rapid Commun Mass Spectrom. 2011;25(12):1715–1724. | ||
Yu S, Jiang J, Zhao S, Wei D, Jie DI, Wang B. Expression and significance of ATP-binding cassette proteins in hepatocellular carcinoma. Chin J Clin Oncol. 2010;37:190–193. | ||
Gomez-Martinez A, Garcia-Morales P, Carrato A, et al. Post-transcriptional regulation of P-glycoprotein expression in cancer cell lines. Mol Cancer Res. 2007;5(6):641–653. | ||
Taipalensuu J, Tavelin S, Lazorova L, Svensson AC, Artursson P. Exploring the quantitative relationship between the level of MDR1 transcript, protein and function using digoxin as a marker of MDR1-dependent drug efflux activity. Eur J Pharm Sci. 2004;21(1):69–75. | ||
Mohammad IS, He W, Yin L. Understanding of human ATP binding cassette superfamily and novel multidrug resistance modulators to overcome MDR. Biomed Pharmacother. 2018;100:335–348. |
 © 2018 The Author(s). This work is published and licensed by Dove Medical Press Limited. The
full terms of this license are available at https://www.dovepress.com/terms
and incorporate the Creative Commons Attribution
- Non Commercial (unported, 3.0) License.
By accessing the work you hereby accept the Terms. Non-commercial uses of the work are permitted
without any further permission from Dove Medical Press Limited, provided the work is properly
attributed. For permission for commercial use of this work, please see paragraphs 4.2 and 5 of our Terms.
© 2018 The Author(s). This work is published and licensed by Dove Medical Press Limited. The
full terms of this license are available at https://www.dovepress.com/terms
and incorporate the Creative Commons Attribution
- Non Commercial (unported, 3.0) License.
By accessing the work you hereby accept the Terms. Non-commercial uses of the work are permitted
without any further permission from Dove Medical Press Limited, provided the work is properly
attributed. For permission for commercial use of this work, please see paragraphs 4.2 and 5 of our Terms.