Back to Journals » International Journal of Nanomedicine » Volume 12
Using CdTe/ZnSe core/shell quantum dots to detect DNA and damage to DNA
Authors Moulick A ![]() , Milosavljevic V, Vlachova J, Podgajny R, Hynek D, Kopel P
, Milosavljevic V, Vlachova J, Podgajny R, Hynek D, Kopel P ![]() , Adam V
, Adam V ![]()
Received 8 September 2016
Accepted for publication 24 November 2016
Published 14 February 2017 Volume 2017:12 Pages 1277—1291
DOI https://doi.org/10.2147/IJN.S121840
Checked for plagiarism Yes
Review by Single anonymous peer review
Peer reviewer comments 4
Editor who approved publication: Dr Thomas Webster
Amitava Moulick,1,2 Vedran Milosavljevic,1,2 Jana Vlachova,1,2 Robert Podgajny,3 David Hynek,1,2 Pavel Kopel,1,2 Vojtech Adam1,2
1Department of Chemistry and Biochemistry, Mendel University, 2Central European Institute of Technology, Brno University of Technology, Brno, Czech Republic; 3Faculty of Chemistry, Jagiellonian University, Krakow, Poland
Abstract: CdTe/ZnSe core/shell quantum dot (QD), one of the strongest and most highly luminescent nanoparticles, was directly synthesized in an aqueous medium to study its individual interactions with important nucleobases (adenine, guanine, cytosine, and thymine) in detail. The results obtained from the optical analyses indicated that the interactions of the QDs with different nucleobases were different, which reflected in different fluorescent emission maxima and intensities. The difference in the interaction was found due to the different chemical behavior and different sizes of the formed nanoconjugates. An electrochemical study also confirmed that the purines and pyrimidines show different interactions with the core/shell QDs. Based on these phenomena, a novel QD-based method is developed to detect the presence of the DNA, damage to DNA, and mutation. The QDs were successfully applied very easily to detect any change in the sequence (mutation) of DNA. The QDs also showed their ability to detect DNAs directly from the extracts of human cancer (PC3) and normal (PNT1A) cells (detection limit of 500 pM of DNA), which indicates the possibilities to use this easy assay technique to confirm the presence of living organisms in extreme environments.
Keywords: nanoparticles, nucleobases, biosensor, fluorescence, mutation
Corrigendum for this paper has been published
Introduction
Researchers are focusing on semiconductor nanocrystals or quantum dots (QDs) in recent years,1–7 due to their unique physical properties and promising potential applications in photonics, solar cells, biotechnology, medicine, and imaging. QDs became more important in the field of nanoscience because of their unique electronic and optical properties such as narrow emission bands, continuous broad absorption band, high quantum yields, and high resistance to photobleaching compared with traditional organic fluorophores. The optical properties of QDs depend on the electronic quantum states associated with the surface (called surface states) due to the high surface-to-volume ratio of the QDs.8 It has been suggested that the high surface-to-volume ratio can enhance or reduce the transfer rate of photogenerated charge carriers because of the high density of the surface sites. The surface states of the QDs can affect the quantum efficiency, optical absorption (photoluminescence excitation), aging effects, luminescence intensity, and spectrum.9–11 The surface states generally arise from unsaturated bonds at the reconstructed surface. It has been suggested that the energies of these surface states generally lie in the band gap of the QDs.12 The electrochemical reactions or behavior at the surface potentially regulate the optical properties and overall conductivity of QDs.13,14 As a consequence, the surface states show substantial effects on the optical and optoelectronic properties of the QDs. Among nanostructured materials, QD-based size-tuned emission spectra offer the potential to develop a multicolor optical coding technique. QDs have been used by a number of research workers for in vivo and in vitro imaging and diagnostic use of live cells as a complement to or replacement of conventional organic dyes.15–18
To decrease the toxicity of QDs, core/shell structures and environmentally friendly materials are mostly used. Different types of core/shell QDs (CdSe/ZnS, CdTe/ZnS, and CdTe/ZnSe), core/shell/shell QDs (CdTe/CdS/ZnS and CdSe/CdTe/ZnSe), and environmentally friendly QDs (CuInSe, Ag2S, and Si) have been synthesized for various purposes.19–28 In our previous study, we reported that CdTe/ZnSe core/shell QDs can be applied for in vitro imaging of chicken tissue and embryo.29 The biological applications of QDs can be hampered by their inherently low solubility in water. Many groups tried to overcome this problem with different chemical strategies including the replacement of surface-capping molecules on QDs prepared in organic solvents with water-soluble thiols.30–32
In recent times, extensive research has concentrated on the interaction between QDs and DNA. For example, Noh et al reported that DNA can be conjugated directly to the QDs for scalable assembly of photoactive thin films.33 The production of CdxPb1-xTe tertiary-alloyed QDs (emitting in 1,100–1,300 nm wavelength range), capped with the hydrophilic ligands mercaptopropionic acid or glutathione, together with DNA, as specific surface tags was described by Samanta et al.34 Onoshima et al developed a fluorescence resonance energy transfer probe based on the conjugation of a QD with a dye (YOYO-3)-intercalated DNA, and they showed that the probe was tolerant to nuclease digestion.35 A generalized method for the synthesis of silanized water-soluble CdSe/ZnS semiconductor nanocrystals (conjugated with DNA) with different surface charges and chemical functionalities was shown by Parak et al.36
Here, we report a novel QD-based method to detect the presence of the DNA, damage to DNA, and mutation. CdTe/ZnSe core/shell QD, which was selected as one of the most robust and highly luminescent nanoparticles, was synthesized in an environment-friendly method using water as a solvent instead of toxic organic solvents.29 We carried out a detailed study of the interaction between the QD and important nucleobases like adenine (A), guanine (G), cytosine (C), and thymine (T) using different techniques like absorption and fluorescent spectrophotometry, fluorescence microscopy, scanning electron microscopy (SEM), dynamic light scattering (DLS), Fourier transform infrared spectroscopy (FTIR), scanning electrochemical microscopy (SECM), and differential pulse voltammetry (DPV). We hypothesized that the QDs interact differently with different nucleobases, and this phenomenon can be used to detect the presence of the DNA, damage to DNA, and mutation. To prove this hypothesis, the QDs were applied to interact with the DNAs from different samples (PC3, PNT1A, Escherichia coli, and Staphylococcus aureus), plasmid with different inserts, and the mixture of A, T, G, and C in the same molar ratio. The obtained result showed that the QDs were highly efficient in the detection of the DNAs directly from the cell extracts, damage to DNA, and mutations. As there are very few reports available in the literature to describe the behavior of core/shell QDs in relation to the variation of the DNA sequences, the present study will certainly smooth the way to detect cancer at its early stage.
Experimental
Chemicals
Zinc acetate, cadmium acetate, sodium borohydride, mercaptosuccinic acid, nucleobases, and other used chemicals were obtained from Sigma–Aldrich (St Louis, MO, USA). High purity deionized water (Milli-Q Millipore 18.2 MΩ/cm; Millipore, Bedford, MA, USA) was used to prepare the aqueous solution of the nucleobases.
Synthesis of CdTe/ZnSe core/shell QDs with different nucleobases
CdTe QDs were synthesized according to the following protocol. A volume of 10 mL of cadmium acetate (5.32 mg/mL) and 1 mL of mercaptosuccinic acid (60 mg/mL) was added to 76 mL of deionized water and mixed on a magnetic stirrer. A volume of 1.8 mL of ammonia (1 M) solution and 1.5 mL of sodium tellurite (4.43 mg/mL) was also added to this solution and mixed very well. A quantity of 50 mg of sodium borohydride was added later to this solution and the solution was stirred for around 2 h. Finally, the volume of the solution was made up to 100 mL with deionized water. Then, the solution was heated at 50°C and 300 W for 10 min (ramping time of 10 min) under microwave irradiation (Multiwave 3000; Anton-Paar GmbH, Graz, Austria). Finally, the prepared CdTe QDs were stored in the dark at 4°C.
A volume of 1 mL of zinc acetate (43.9 mg/mL) and 1 mL of mercaptosuccinic acid (60 mg/mL) were added to 85 mL of deionized water and mixed completely on a magnetic stirrer. The pH of the solution was made to 7.5 using ammonia solutions (1 M). Then, 1.5 mL of sodium selenite (5.26 mg/mL) was added to it and mixed for few minutes. Later, 40 mg of sodium borohydride was added to it, and the solution was stirred for 2 h. Finally, the volume of the solution was made up to 100 mL with deionized water. The prepared ZnSe QD solution was stored in the dark at 4°C.
The synthesis and characterization of CdTe/ZnSe core/shell QDs were carried out following our previous report.29 Briefly, 1 mL of prepared CdTe QDs was mixed with 1 mL of fresh stock solution of ZnSe and then heated under microwave irradiation at 60°C (300 W, ramping time of 10 min and heating time of 10 min). Then, aqueous solutions of nucleobases (A, G, C, and T) with different concentrations were added separately to the prepared CdTe/ZnSe core/shell QDs and mixed well in small glass vessels. In the case of control, deionized water was added in place of the aqueous solution of the nucleobases. Finally, all these samples were heated at a temperature of 100°C under microwave irradiation using the same conditions as described before.
Fluorescence and absorbance spectrophotometry
The fluorescence properties of the samples were analyzed by fluorescence spectrophotometer Tecan Infinite M200 PRO (Tecan, Grödig, Austria) in a microplate of Nunc Microplate MaxiSorp (Thermo Fisher Scientific, Roskilde, Denmark). The fluorescence spectrum was measured using an excitation wavelength of 380 nm (emission range 420–850 nm). The results were subjected to statistical analysis using analysis of variance (P≤0.05) and Bonferroni post hoc tests. The data are expressed as mean ± standard deviation (SD) with n=5. The absorbance spectra of the samples were recorded by a spectrophotometer SPECORD 210 (Analytik Jena, Jena, Germany) using quartz cuvettes (1 cm; Hellma, Essex, UK) at 25°C maintained by Julabo (Labortechnik, Wasserburg, Germany). The changes in spectra of the samples were recorded and evaluated using the program WinASPECT version 2.2.7.0. The measurements were repeated five times from five different sets of the samples.
Fluorescence microscopy
The microscopic studies were performed using an inverted Olympus IX 71S8F-3 fluorescence microscope (Olympus, Tokyo, Japan) equipped with a mercury arc lamp, X-cite 120 Lamp (120 W; Lumen Dynamics, Mississauga, Canada) for illumination. In this experiment, an excitation filter of 545–580 nm and an emission filter of 610 nm were used. The images were obtained using a Camera Olympus DP73 (Olympus) and processed by Stream Basic1.7 software (Olympus Soft Imaging Solutions GmbH, Münster, Germany) using a resolution of 1,600×1,200 pixels.
SEM and DLS
The structures and size of the QDs with or without different nucleobases were observed using SEM (Tescan, Brno, Czech Republic) under the following conditions: work distance about 5 mm, high vacuum mode (10–3 Pa), and a voltage of 15 kV.
The average size of the nanoparticles and the size distribution were determined by quasielastic laser light scattering with a Malvern Zetasizer (NANO-ZS; Malvern Instruments Ltd, Worcestershire, UK). A volume of 1.5 mL of aqueous solution of the QDs (1 mg/mL) was put into a polystyrene latex cell and measured at a detector angle of 173°, wavelength of 633 nm, refractive index of 0.30, real refractive index of 1.59, and temperature of 25°C.
Fourier transform infrared spectroscopy
The FTIR measurements of the CdTe/ZnSe core/shell QDs with or without different nucleobases were performed over the range of wavenumber 4,000–550 cm−1 using a Thermo Scientific Nicolet iS5 spectrometer (Thermo Fisher Scientific, Inc., Waltham, MA, USA) equipped with iD5 ATR-Diamond.
DPV and SECM
The electrochemical measurements of the test samples were carried out using Autolab PGSTAT302N Potentiostat/Galvanostat (Metrohm, Utrecht, The Netherlands) connected to VA Stand 663 (Metrohm, Herisau, Switzerland) with glass cell and three-electrode system. Ag/AgCl/3 M KCl was used as a reference electrode and a platinum wire as an auxiliary electrode. A hanging mercury drop electrode was used as a working electrode. The DPV was performed in the presence of acetate buffer (pH 5.0) at room temperature. The parameters for the DPV were as follows: initial potential 0 V, end potential −1.6 V, step potential 0.005 V, and modulation amplitude 0.25 V. Before the measurement, the samples were adsorbed on the mercury drops for 2 min. The deoxygenation of the electrolyte was performed by purging with argon for 2 min.
The electrochemical properties of the surface of the CdTe/ZnSe QDs with different nucleobases were studied by a scanning electrochemical microscope (CH instruments, Austin, TX, USA). The electrochemical microscope consisted of a 10 μm platinum disc probe electrode, which is controlled by piezoelectric motors. The modified electrodes were characterized by cyclic voltammetry in 3 M KCl and 1 mM Ferrocenemethano with the following parameters: initial potential −0.2 V, high potential 0.5 V, and low potential −0.2 V. The initial scan polarity was positive with a scan rate of 0.02 V/s. The quiet time was 10 s. A gold disc electrode was employed as a substrate electrode with a potential of −0.3 V. The speed of scanning was 250 μm/s. The platinum electrode was moved at least 50 μm above the surface. The electrochemical measurements were performed in a three-electrode configuration using a platinum wire as a counterelectrode and Ag/AgCl/3 M KCl as a reference electrode. Before scanning, the test samples were air-dried on the gold electrode.
Application of CdTe/ZnSe QDs on biological samples
Prostate cancer (PC3) and normal human cells (PNT1A) were purchased from American Type Culture Collection (Manassas, VA, USA), were cultivated with a reduced serum medium (Opti-MEM; Life Technologies, Grand Island, NY, USA) in an incubator (New Brunswick Eppendorf, Edison, NJ, USA) using standard conditions (37°C, 5% CO2). The cells were washed three times using autoclaved water to remove the media and were irradiated with ultraviolet B (UVB) (500 J/m2) using a UV transilluminator (312 nm source). A comet assay was performed according to the method of Singh et al37 to investigate the occurrence of DNA damage. The plasma membranes of the cells (before or after UV irradiation) were disrupted by sonication and the cell debris was removed by centrifugation. Then, the cell extract was added to the aqueous solution of the QDs and was heated using microwave irradiation as described before. For a detailed study, we extracted and purified the DNA from both the human cells, a Gram-negative bacterium (E. coli), and a Gram-positive bacterium (S. aureus) using MagNA Pure Compact Nucleic Acid Isolation Kit (Roche, Basel, Switzerland) according to the manufacturer’s protocol.
To study the sensitivity of this method to detect mutation, 1 mM QDs were mixed with 1 nM plasmid, pGEM-T Easy vector (Promega, Madison, WI, USA) with or without insert DNAs and subsequently heated using microwave irradiation as described earlier. All the DNA fragments were purchased from Sigma–Aldrich and inserted into the vector according to the manufacturer’s protocol.38 The sequences of the DNA fragments are given in Table 1.
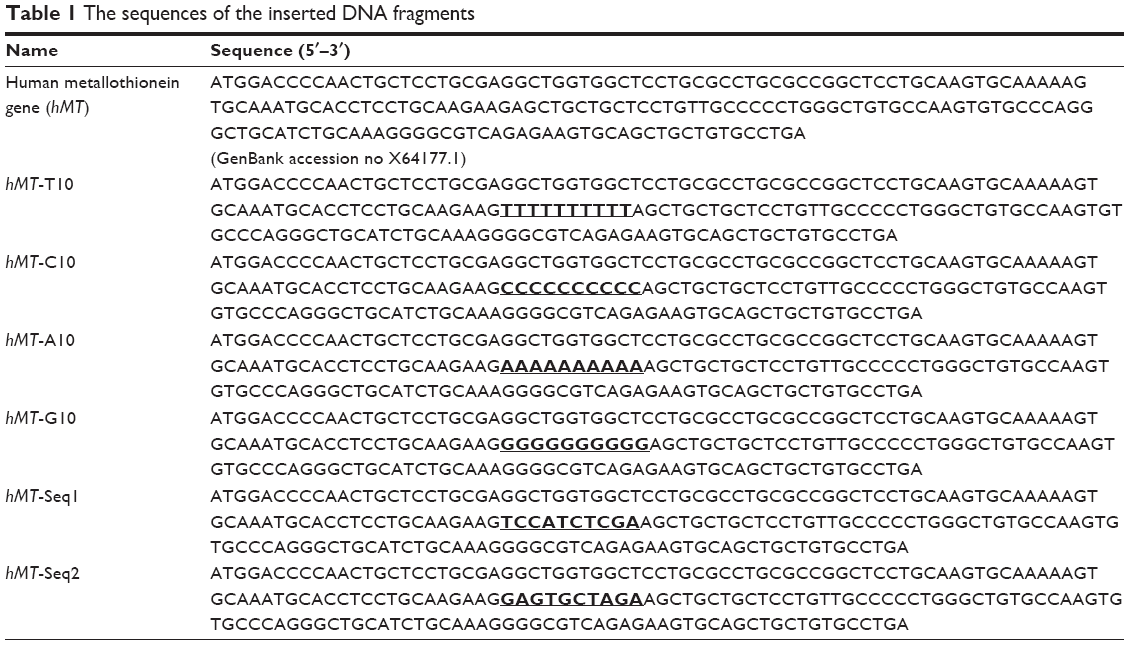 | Table 1 The sequences of the inserted DNA fragments |
Descriptive statistics
Mathematical analysis of the data and their graphical interpretation were realized by Microsoft Excel®, Microsoft Word®, and Microsoft PowerPoint®. Results are expressed as mean ± SD, unless otherwise noted. The detection limit (three signal/noise, S/N) was calculated according to Long and Winefordner,39 whereas N was expressed as SD of noise, determined in the signal domain unless stated otherwise.
Result and discussion
Interaction of the CdTe/ZnSe QDs with nucleobases
The aqueous solutions of the nucleobases (A, G, C, and T) with different concentrations were added separately to the QDs and all these samples were heated at a temperature of 100°C under microwave irradiation using the same conditions as described before. In the case of control, deionized water was added in place of the aqueous solution of the nucleobases.
Optical property analysis
Under UV transilluminator, the test solutions of the CdTe/ZnSe QDs conjugated with T or C (pyrimidine bases) showed an orangish-yellow color which was brighter than the control. On the other hand, the QDs conjugated with A and G (purine bases) showed a reddish-orange and a red color, respectively, which were darker than the control. Under visible light, no significant change of the colors was found. The absorbance and fluorescence spectra were recorded (Figure 1A–C) for the samples where the final concentrations of the nucleobases and QDs were 1 nM and 1 mM, respectively. The highest fluorescence intensities of the QDs conjugated with T and C (QD+T and QD+C, respectively) increased 27% and 51% over than that of control, whereas the QDs conjugated with A and G (QD+A and QD+G, respectively) showed the opposite results. The fluorescence intensities of QD+A and QD+G decreased 25% and 82% from that of control QDs. Red shifts (compared to control) of the fluorescence emission maxima of the QDs were found after the interaction with all the nucleobases. The changes in fluorescence intensities of the QDs in response to the addition of different concentrations of the nucleobases were also studied. We found that the fluorescence intensities of the QDs after the interaction with the nucleobases were gradually increased (in case of T and C) or decreased (in case of A and G) with the increasing concentration of the nucleobases (Figure 1D).
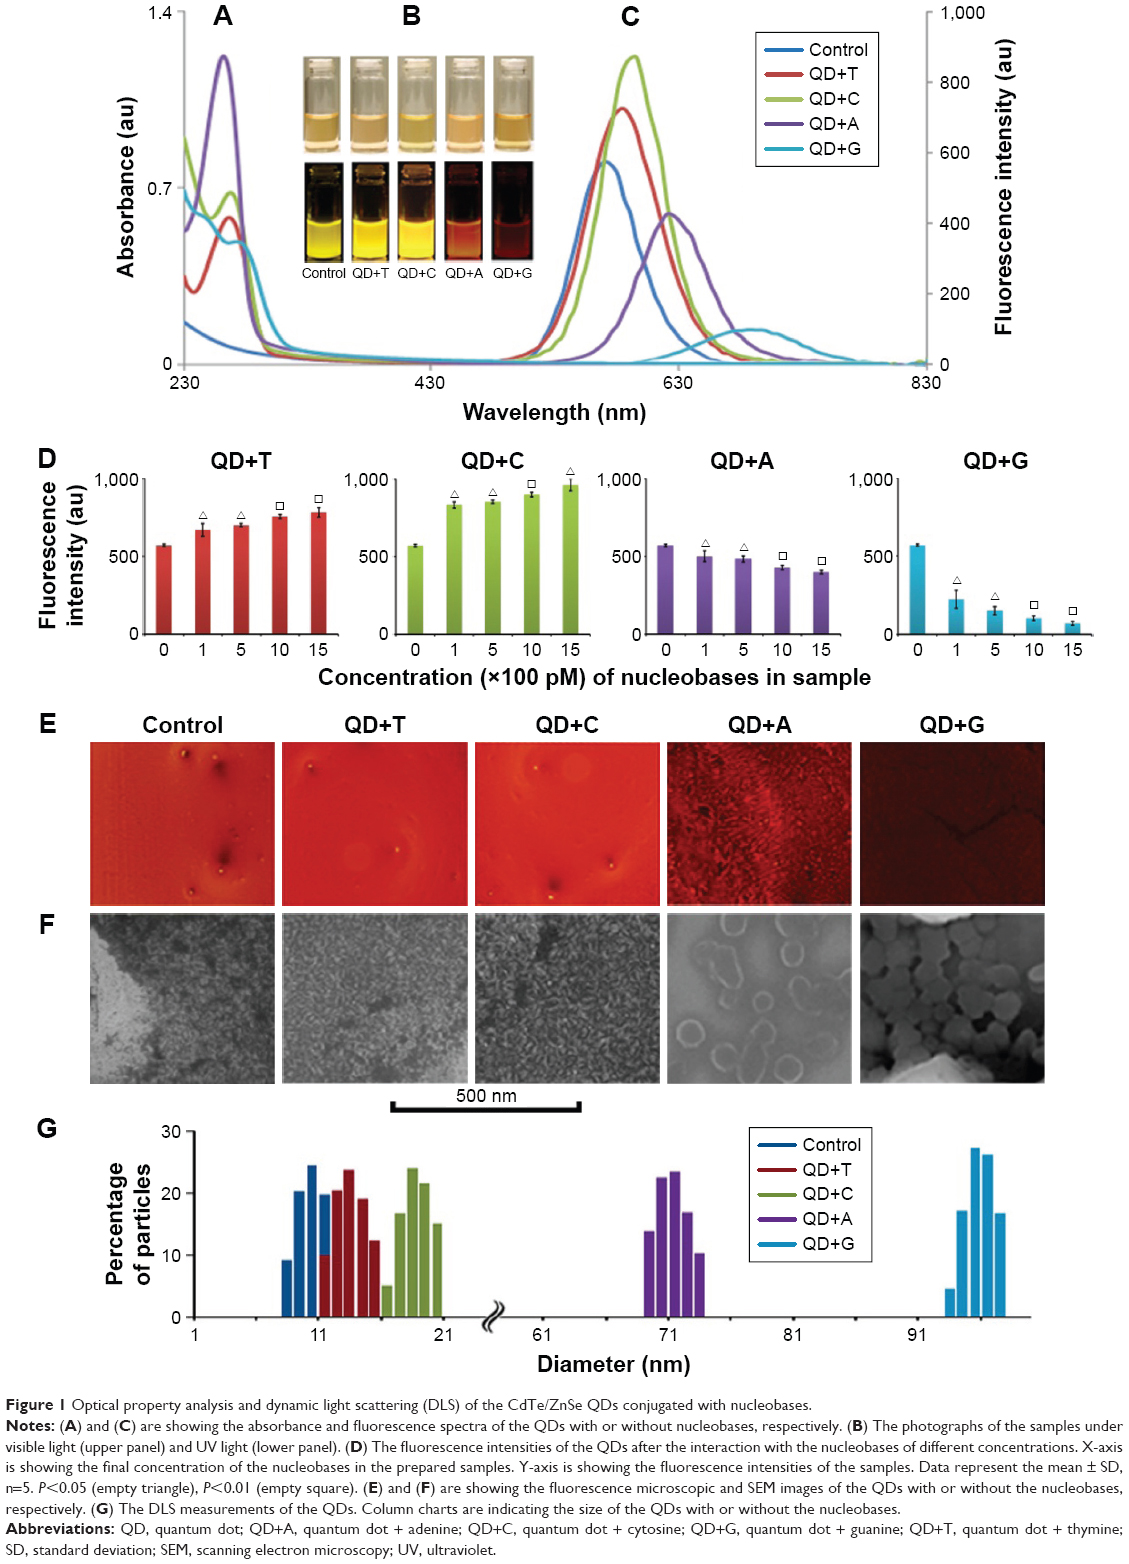 | Figure 1 Optical property analysis and dynamic light scattering (DLS) of the CdTe/ZnSe QDs conjugated with nucleobases. |
The fluorescence intensity of the CdTe/ZnSe QD nucleobase conjugates was studied also by fluorescence microscopy. A drop of 1 μL volume of the QDs (1 mM) without or with the nucleobases (1 nM) was put on a glass slide and, after drying, the fluorescence of the samples was observed by a fluorescence microscope. The fluorescence microphotographs (Figure 1E) were quantified using software Adobe Photoshop (San Jose, CA, USA). The mean histogram value (grayscale) was considered to be proportional to the mean intensity of the micrograph. After conjugations with the nucleobases, the changes in the intensities of the QDs were found to be similar to the result obtained from fluorescent spectrophotometry. As compared to control, the mean intensities of the QDs were found to be increased and decreased after the conjugation with the pyrimidines and purines, respectively. The highest and lowest intensities were found in the cases of C (17% increase) and G (73% decrease), as compared to control. All these fluorescent data indicated that the purine and pyrimidine bases show different behavior to the QDs.
SEM and DLS
The structures and size of the CdTe/ZnSe core/shell QDs with or without the nucleobases were observed using SEM technique. The results (Figure 1F) showed that the sizes of the QDs with purines were much bigger than that of pyrimidines, which could be the possible reason of the red shift of the fluorescent emission maxima of the QD–purine conjugates. These results were further analyzed by DLS measurements. The observed sizes of the QD–nucleobase conjugates were in good agreement with the SEM data. According to the results, the DLS measurement (Figure 1G) showed that the sizes of the QD, QD+T, and QD+C were 10±2, 13±2, and 18±2 nm, respectively. However, the QD+A and QD+G were found to be significantly bigger (71±2 and 95±2 nm, respectively) than the control (only QDs). From these results, it can be concluded that the nucleobases conjugated with the QDs to form new nanoconstructs. The bigger size of QDs with purine bases led to a significant red shift of the fluorescence emission maxima; however, the fluorescence intensity was decreased (compared to control) in this case. On the contrary, the QDs conjugated with pyrimidine bases showed a slight increase in size which caused a smaller shift of the fluorescent emission maxima (Figure 1).
The measurement of zeta potential (or charge density) was carried out to provide important information about the binding capacity of the formed nanoconjugates. The results showed that the QD+G and QD+A nanoconstructs have significantly lower zeta potential as compared to control, whereas QD+T and QD+C did not show significant changes in zeta potential (Table 2). In the case of A and G, perhaps, there was a formation of chelate bond to the surface of the QDs, thus the bonds were more stable, and H bonds were probably formed between the carboxylic groups of mercaptosuccinic acid of the QDs and the electron pairs of the nitrogen atoms of the purine bases. These phenomena caused a decreased zeta potential as compared to control. In case of T and C, the H bond can also be expected between the carboxylic groups of mercaptosuccinic acid of the QDs and the electron pairs of the nitrogen atoms of the pyrimidine bases but it does not have any big influence on the stability of the particles. In this case, no significant difference in zeta potential was observed because the chelate bond was not formed and thus it can be concluded that the stability would be similar compared to control.
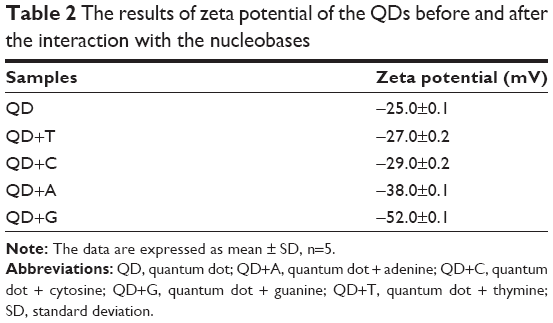 | Table 2 The results of zeta potential of the QDs before and after the interaction with the nucleobases |
FTIR analysis
The FTIR spectra of the CdTe/ZnSe QDs with or without the nucleobases are shown in Figures 2 and S1, respectively. The presence of the nucleobases was proved by the presence of the characteristic peaks in the spectra. In the case of QD+A (Figure 2A), the peaks at 630, 796, and 874 cm−1 can be attributed to the ring deformations. The peaks found at 989, 1,075, 1,144, and 1,301 cm−1 and the strong intensity peaks at 1,385, 1,556, and 1,617 cm−1 can be attributed to ν(C–N) and ν(C–C) vibrations.40 The peaks at 3,298, 3,565, and 3,647 cm−1 were found due to the presence of νs-symmetric (NH2) and νas-asymmetric (NH2) vibrations, respectively. In the spectrum of QD+G (Figure 2B), the peaks at 554, 642, and 776 cm−1 can be attributed to the ring deformations of G, whereas the peaks of middle intensities at 1,040 and 1,257 cm−1 and of strong intensities at 1,370, 1,474, and 1,562 cm−1 can be attributed to ν(C–N) vibrations.41 The very strong peaks at 1,671 and 1,694 cm−1 can be assigned to ν(C–N) and ν(C=O) vibrations. The peaks at 2,837, 3,104, and 3,309 cm−1 were found due to the presence of νs(NH2) and νas(NH2) vibrations, respectively.
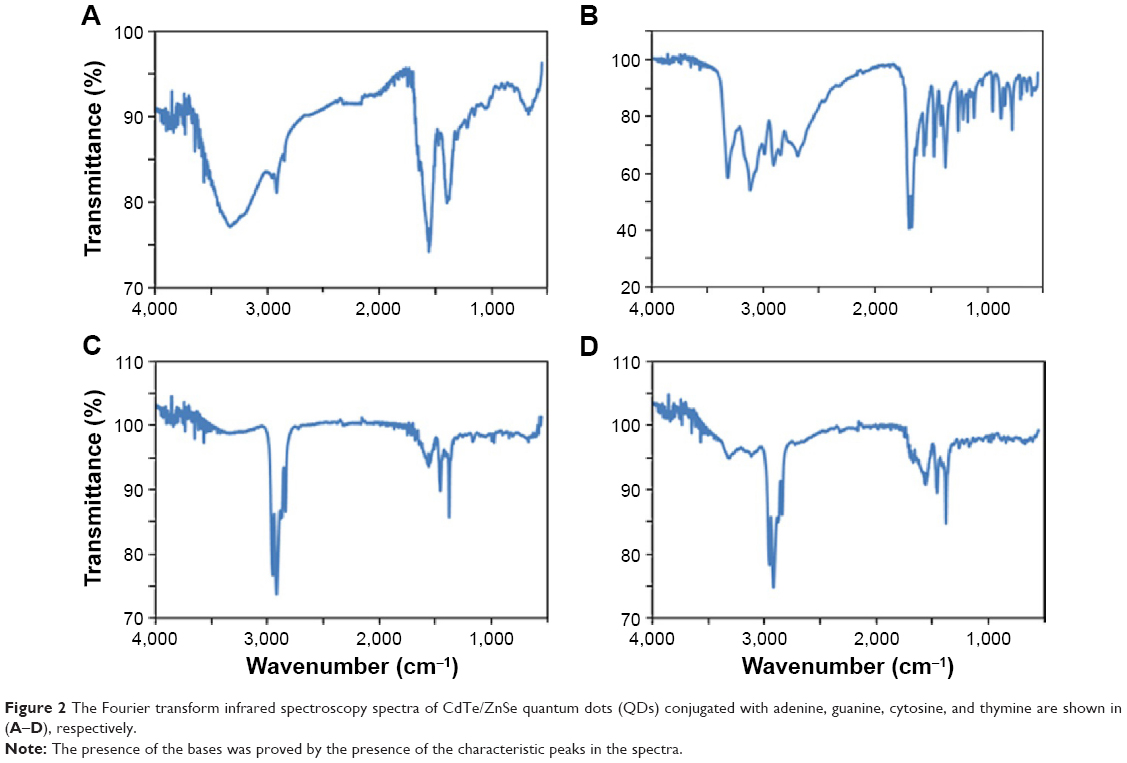 | Figure 2 The Fourier transform infrared spectroscopy spectra of CdTe/ZnSe quantum dots (QDs) conjugated with adenine, guanine, cytosine, and thymine are shown in (A–D), respectively. |
In the spectrum of QD+C (Figure 2C), the peaks at 788, 810, and 972 cm−1 may belong to the ring deformations of C.42 The very strong peaks at 1,375, 1,453, and 1,554 cm−1 can be assigned to ν(C–N) and ν(C=O) vibrations. Rocking N–H vibration can be assigned to the peak found at 1,152 cm−1, and the symmetric and asymmetric vibrations to the peaks at 3,565 and 3,647 cm−1, respectively.
The spectrum of QD+T (Figure 2D) showed the peaks at 599, 642, 768, 836, and 1,035 cm−1, which may belong to the ring deformations, and the very strong peak at 1,375 cm−1 belongs to Kekule ring vibration of T.43 The peaks of methyl rocking, methyl deformation, and methyl stretching can be found in the spectrum at 1,157, 1,204, 1,621, 1,717, 3,097, and 3,295 cm−1. The very weak peaks at 1,841 and 1,901 cm−1 can be assigned to ν(C=O) vibration, whereas the peaks at 3,565 and 3,647 cm−1 can be assigned to νs(NH2) and νas(NH2) vibrations, respectively.
All these QDs conjugated with the nucleobases have also mercaptosuccinic acid on their surface. When we take this into account, there must be overlap of some peaks. In the spectra of all the compounds, there is a peak near to 870 cm−1, which can be characteristic for sulfur-containing compounds and attributable to ν(C–S).44 The very intense peaks near to 1,380 and 1,560 cm−1 can also be attributed to νs(COO) and νas(COO) vibrations, respectively.45,46 In comparison with the infrared (IR) literature data of free organic molecules, there were shifts to lower or higher frequencies, probably due to the coordination of the molecules to the surface of the QDs or some interactions that occur among them.
DPV and SECM
The electrochemical behavior of CdTe/ZnSe QDs in relation to the surface modification by the nucleobases was studied by DPV coupled with adsorptive technique (Figure 3A). The adsorption of the QDs (with or without the nucleobases) was performed by dipping the mercury drop electrode into the test solution for 2 min. The concentrations of the QDs and nucleobases in the test solutions were 1 mM and 1 nM, respectively. For this study, the reduction process was carried out on the surface of the mercury electrode. The changes were monitored in the potential range between 0 and −1.6 V. In this potential range, four reduction signals (C1–C4) were detected. The first cathodic signal was obtained at the potential of −0.35 V. The potentials of other signals (C2–C4) were as follows: C2: −0.53 V; C3: −0.8 V; and C4: −1.07 V. The detected peak potentials did not show any significant correlation with the modifications of the QDs with the nucleobases. On the other hand, the peak intensities depended on the modifications of the QDs. The biggest change in the peak intensity was detected for the QDs modified with G. The highest signals at C1–C4 were detected from unmodified QDs. A significant change in the intensity was clearly observed at peak C3 for the purine bases compared with the pyrimidine bases and control. The second part of the experiment was aimed at explanation of the peak origin (Figure 3B). According to our best knowledge, there is no study in the literature that describes the electrochemical behavior of CdTe/ZnSe QDs in aqueous media. Therefore, we tried to identify the individual peaks according to the individual parts of the QDs. The C1 peak probably can be correlated with the presence of the buffer components. The origin of C2 peak can be correlated with the formation of the nanocrystal structure of the QDs, especially two types of material layers, core and shell, coupled together. This suggestion is made based on the fact that the peak C2 was found only for the CdTe/ZnSe QDs, but not for the individual components. The peak C3 was attributed to the presence of the shell structure of the QDs because the same signal was obtained for pure ZnSe, the shell component of the QDs. The fourth peak (C4) was attributed to the presence of CdTe, the core component of the QDs. All the electrochemical data suggested that the QDs conjugated with A and G behave differently compared with the QDs conjugated with C and T, which is clearly seen from the peak C3. The result was in accordance with the fact that the electrochemical behavior (represented by C3 peak) of the surface of the QDs was directly influenced by the nucleobase modification.
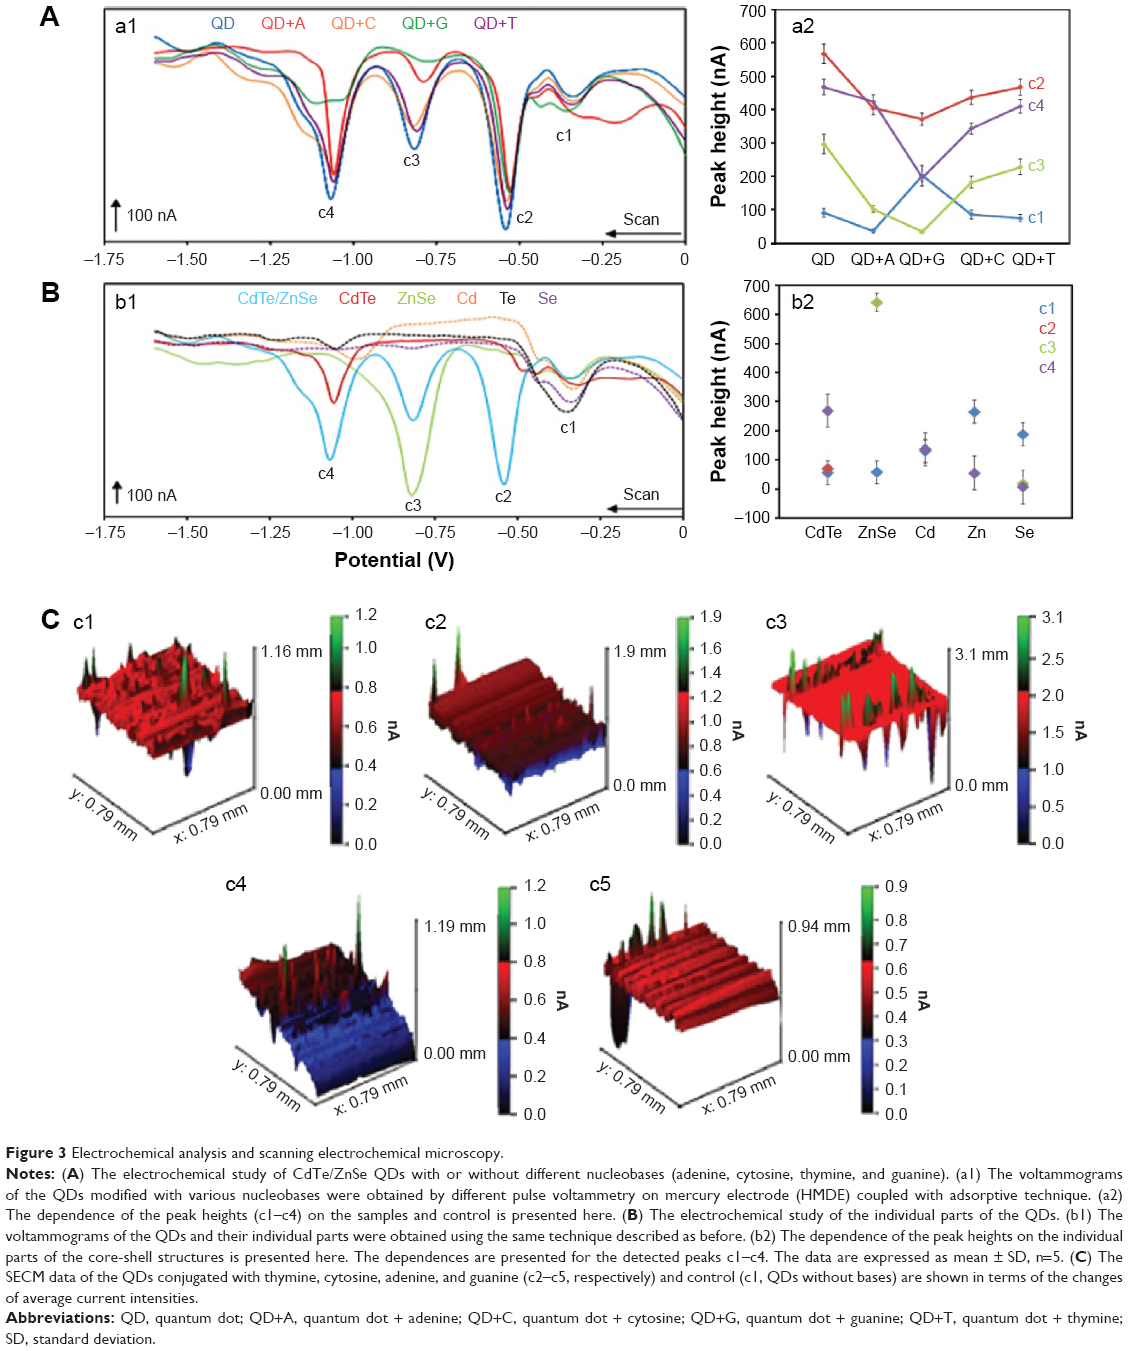 | Figure 3 Electrochemical analysis and scanning electrochemical microscopy. |
The SECM image of the CdTe/ZnSe QDs showed a little inhomogeneity of the obtained signals when the average signal was set to 0 nA (Figure 3C). It means that no anodic or cathodic signals were obtained. The obtained signal 0.1 nA can be considered as a noise. QD+A showed an increase in average current intensity. In this case, the values were increased with an interval from 0.6 to 0.8 nA. QD+G led to a similar increase in the obtained signal. Here, the average current intensity was found to be about 0.25 nA. In contrast, the obtained results from the QDs modified with T and C showed a decrease in the currents (−0.9 and −0.4 nA for QD+T and QD+C, respectively). Taken together, all these results indicated that the purines and pyrimidines show different interactions with the core/shell QDs.
Application of the QDs to detect DNA, damage to DNA, and mutations
To study the ability of the CdTe/ZnSe QDs to detect DNAs directly from biological samples, we applied the QDs to the extracts of PC3 (cancer cells) and PNT1A cells (normal cells) and heated under microwave irradiation using the same conditions as described before. In the case of control, deionized water was added in place of the cell extracts. From the fluorescent emission spectra (Figure 4A), it can be clearly seen that the emission maxima of the QDs were shifted from 570 to 640 nm after the interaction with the DNA from PC3 cell extract. To confirm that the contaminants (biologically relevant metal ions, common organic compounds, and amino acids) originated from the cell lysate had no significant effect on the QD–DNA interactions, we used purified 1 nM DNA (using kit reagents) from the same cell samples (as control DNA) to interact with 1 mM of the QDs. In both of the cases (cell lysate and purified DNA), the emission maxima were found to be at the same wavelength (640 nm), which suggested that the contaminants from the cell lysate have no significant effect on the DNA detection procedure. In the case of PNT1A cells, we found similar results (Figure 4B). We found that the minimum detectable concentration of the DNA was 500 pM (minimum limit of detection, LOD).
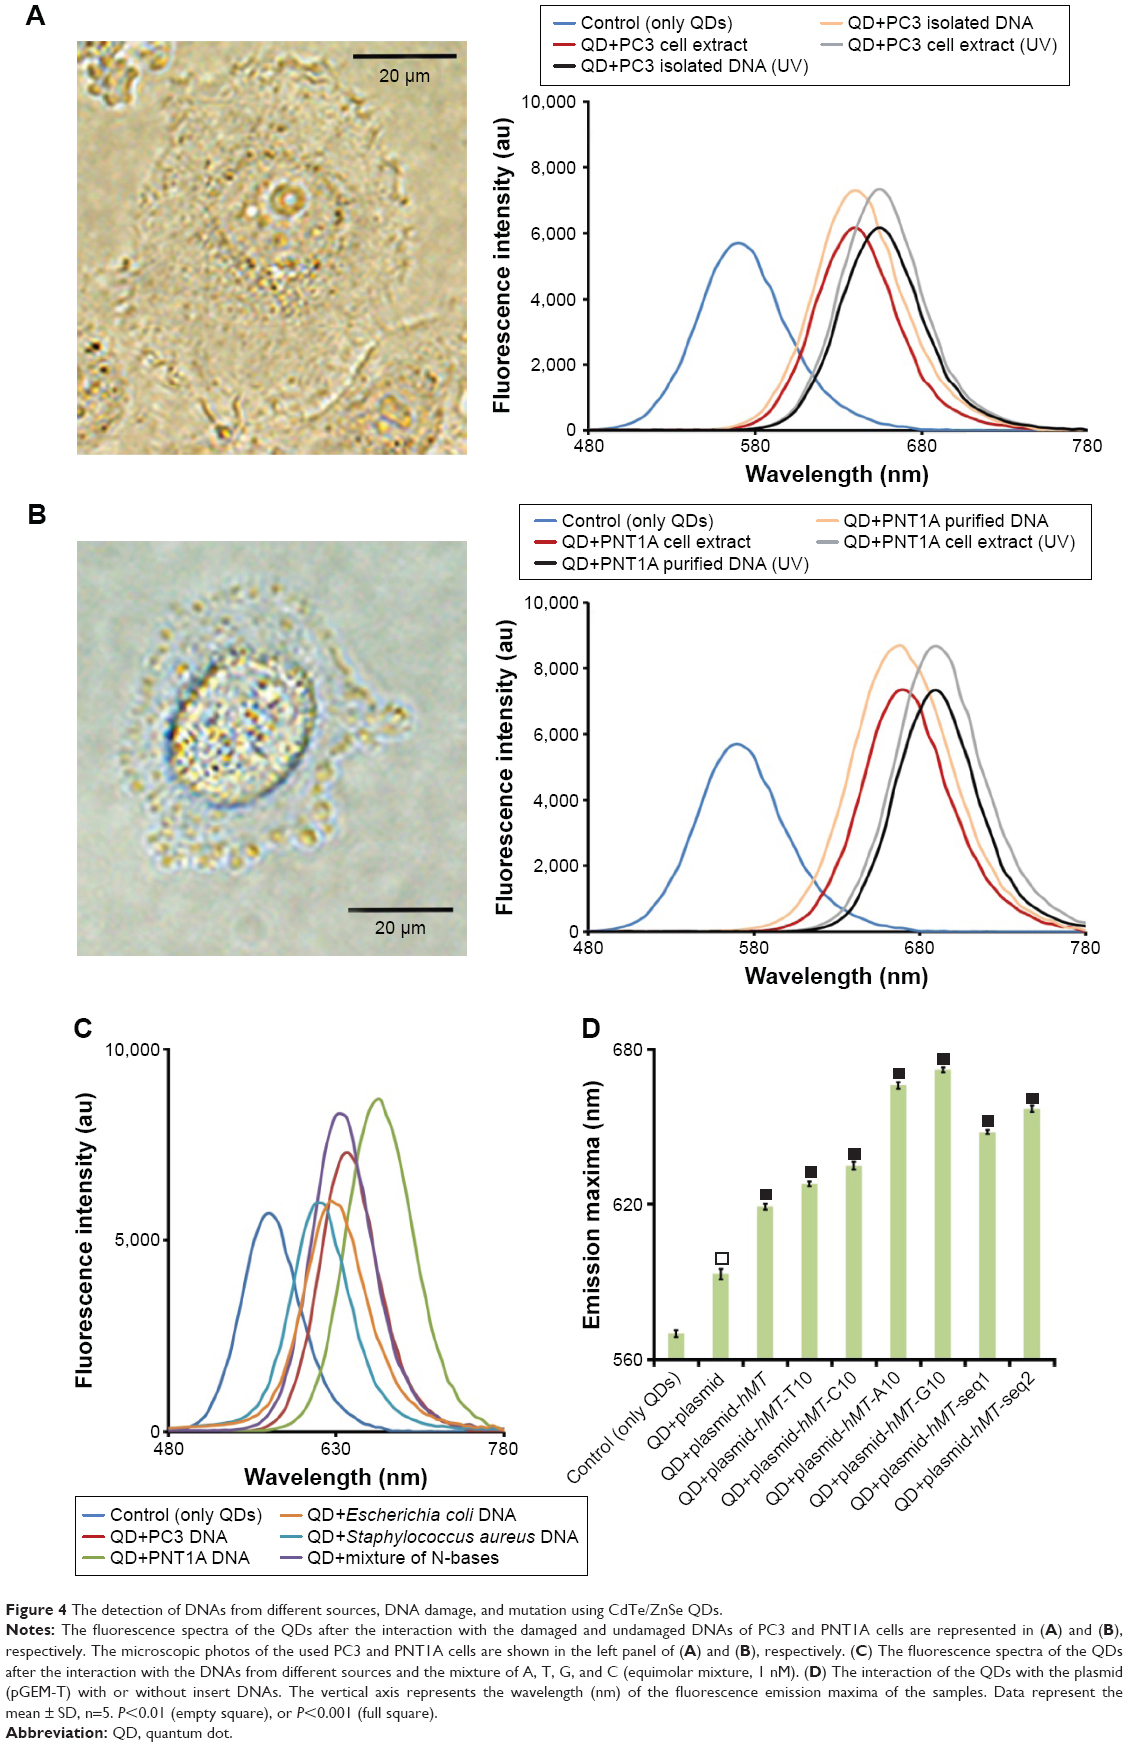 | Figure 4 The detection of DNAs from different sources, DNA damage, and mutation using CdTe/ZnSe QDs. |
To study the ability of the QDs to detect the damage to the DNA molecules (caused by 500 J/m2 UVB irradiation), the QDs (1 mM) were mixed with the aqueous solution of the damaged DNA (1 nM) and heated using microwave irradiation as described before. After the interaction with the damaged DNA (from PC3 cells), the QDs showed the fluorescent emission maxima at 655 nm which was significantly different from that of undamaged DNA–QD conjugate (640 nm). In the case of PNT1A cells, we found similar results (Figure 4A and B). The significant shift of the fluorescence emission maxima of the QDs made this method very efficient and useful to detect the damage to DNA. The occurrence of the DNA damage caused by the UV radiation was confirmed by a comet assay (data not shown).
For a detailed study, we used DNAs (1 nM) from different sources like human cells (PC3 and PNT1A), Gram-positive (S. aureus) and Gram-negative bacteria (E. coli), and the mixture of A, T, G, and C (1 nM for each of the nucleobases) to interact with the QDs (1 mM). We found different emission maxima from different samples (Figure 4C). These results suggest that the proposed DNA detection method is useful to detect the DNAs from any source.
To evaluate the sensitivity of this method to detect mutations, the interactions of the QDs with plasmid with or without insert DNAs were studied (Figure 4D). In the case of the plasmid (pGEM-T) with insert (hMT gene), the fluorescent emission maximum of the QDs was found at 619 nm. We have added different short sequences (10 bp) in the middle of the insert (hMT gene) to introduce a situation analogous to mutation (Table 1). After the interaction of the QDs with the plasmid with modified inserts, clear red shifts of the fluorescence maxima were observed. Different mononucleotide sequences (10 bp) in the inserts showed different interactions with the QDs, which resulted in different emission maxima. The very small change in the sequence between hMT-seq1 and hMT-seq2 also affected the interaction with the QDs which reflected in different emission maxima. Taken together, all these data suggest that this method will help to detect small changes (mutation) in the sequence of DNA.
The proposed method has been found to be more useful than many other reported techniques because this easy-to-handle and less time-consuming QD-based DNA detection method is also capable of detecting DNA damage and mutations. In comparison with the proposed technique, the molecular biology-based DNA detection methods are more laborious and require more careful handling of the samples and time-consuming gel electrophoresis with staining procedure.47 The electrochemical methods also need more careful handling of the samples to get appropriate results48,49 compared with the proposed method. In the case of nanoparticle-based methods, the preparation of the final nanomaterials and their conjugation with the DNA molecules are more complicated50–52 than our proposed method, which also has a better LOD than many other QD-based methods.51–54
Conclusion
In the present work, CdTe/ZnSe core/shell QDs were selected as one of the strongest and most highly luminescent nanoparticles, which were directly synthesized in aqueous medium instead of organic solvents. The interactions of the QDs with important nucleobases (A, G, C, and T) were studied individually using different techniques. The fluorescent spectrophotometry showed a clear red shift of the emission maxima of the QDs after the interaction with nucleobases. The fluorescent intensities of the QDs were also found to be changed after the interaction, which was confirmed by the fluorescence microscopy. The red shifting of the emission maxima was caused by the increased size of the QDs after the interaction with the bases, which was proved by SEM and DLS techniques. The sizes of QD+A or G were found to be much bigger than that of QD+T or C, which was reflected in the shifting of the emission maxima. The FTIR analysis was carried out to prove the presence of the bases by the presence of characteristic peaks in the spectra. Taken together, the obtained results indicated that the purines and pyrimidines show different interactions with the core/shell QDs, and these phenomena were also supported by DPV and SECM.
The observed trend of the size and zeta potential could be interpreted in terms of the ability of nucleobases to interact with the Zn2+ cations on the surface. There are research papers dealing with the synthesis and crystal structures of the complexes of Zn2+ with the nucleobases or some very closely related ligands. The usual coordination mode is via the N7 atom of five-membered ring subcore of purine.55–57 It is always accompanied by at least double synthons of hydrogen bond base pairing, mostly through the parts of six-membered ring subcore. This is also accompanied by π–π interactions between purines and also more closely to the five-membered ring subcore. There can also be the chelating modes (exploiting N3 and N9 atoms) and bridging modes (exploiting N7 and N9 heteroatoms – after deprotonation).58 There are also single reports on complexes with cytosine and uracil. They generally occur through deprotonated (N3) heteroatom located between the C=O (or NH2) groups.59 In both cases, the nucleobases just assist other groups (also eg, in ATP, etc.), and the strength of binding shows very different tendencies depending on overall and detailed conditions. In general, purine nucleobases have more opportunities to interact with Zn2+ in different coordination modes (mono, chelating, bridging) and H-bonds and π–π stacking than pyrimidine ones. It can be demonstrated also by quantum chemical calculations (QCC) theoretical paper.60 The authors report that: 1) coordination of N7 (G) may lead to deprotonation of N1 G, while the coordination to N7 (A; here in ATP) induces the pyramidal character group of NH2 (A) and makes it a good acceptor of proton, 2) G–G reverse Hoogsteen base-pairing is stabilized by polarization and electrostatic effects caused by cation, while such A–A pairing is not influenced by the cation. It follows from the above that much stronger interaction with either zinc cations or carboxylate groups present on the surface of QDs shell is expected for purine bases than pyrimidine ones. This can also be the explanation of shifting and lowering of luminescence in the case of purine bases. The electron overlap between the carboxylates and purines is much higher, which forms stronger bonds among them.
From the literature, it is known that many factors could influence the position of fluorescence response: size, constitution (eg, coming from core/shell to mixed solution QD), temperature, and other factors.61,62 The significant increase in emission wavelength and significant decrease of intensity of G and A can be related to the strong interaction between the nucleobase and shell of the QDs. The band gap is modified by the coordination and thus the non-radiative processes may become stronger. Perhaps, the C and T do not coordinate and there are only hydrogen bonds. Another point is the absorption and luminescence of the nucleobase. This may lead to the uptake of radiation causing the loss of effective absorption. The coordination of G or A to Zn2+ leads to relatively strong modified emission and additional weak emission of lower energy.
Finally, the QDs were applied to prove their ability to detect DNAs and mutations. The results showed that the QDs were able to detect DNAs directly from the extracts of human cancer (PC3) and normal (PNT1A) cells, and the detection was highly efficient even when the concentration of the DNA was extremely low (detection limit of 500 pM). The QDs showed their ability to detect the damage to DNA by shifting the fluorescent emission maxima. The QDs showed their sensitivity to the small changes in the sequence or mutations of the DNA. A clear red shift of the fluorescence emission maxima was found after the interaction of the QDs with the modified or mutated gene insert. Since the individual interactions of the QDs with each of the nucleobases are different, the emission maxima of the QDs after the interaction with entire DNAs should be at different wavelengths in the case of different sequences, and this phenomenon made the QDs sensitive to the changes in the sequences of DNA.
This experiment showed that the CdTe/ZnSe core/shell QDs can be used as a promising nanomaterial to detect DNAs (directly from cell extracts), damages to the DNA, and mutations because of the different types of interaction with different nucleobases, which indicates the possibilities to use this easy assay technique to confirm the presence of living organisms in extreme environments. This novel method will also help to detect small changes (mutation) in the sequence of DNA, which indicates a possible use of this technique in cancer detection.
Highlights
- Individual interactions of CdTe/ZnSe QDs with nucleobases were studied in detail.
- The QDs showed two different types of modifications with purines and pyrimidines.
- The QDs can be applied very easily to detect the mutation of DNA.
- The QDs can also detect DNAs directly from the extracts of human cells.
Acknowledgments
This research was carried out under the project CEITEC 2020 (LQ1601) with financial support from the Ministry of Education, Youth and Sports of the Czech Republic under the National Sustainability Programme II. Further, the financial support from the project IGA TP_01_2015 is highly acknowledged.
Disclosure
The authors report no conflicts of interest in this work.
References
Cao XD, Li CM, Bao HF, Bao QL, Dong H. Fabrication of strongly fluorescent quantum dot-polymer composite in aqueous solution. Chem Mater. 2007;19(15):3773–3779. | ||
Wang XH, Du YM, Ding S, et al. Preparation and third-order optical nonlinearity of self-assembled chitosan/CdSe-ZnS core-shell quantum dots films. J Phys Chem B. 2006;110(4):1566–1570. | ||
Qian HF, Dong CQ, Weng JF, Ren JC. Facile one-pot synthesis of luminescent, water-soluble, and biocompatible glutathione-coated CdTe nanocrystals. Small. 2006;2(6):747–751. | ||
Heger Z, Cernei N, Krizkova S, et al. Paramagnetic nanoparticles as a platform for FRET-based sarcosine picomolar detection. Sci Rep. 2015;5:8868. | ||
Kudr J, Richtera L, Nejdl L, et al. Characterization of carbon dots covered with polyvinylpyrrolidone and polyethylene glycol. Int J Electrochem Sci. 2015;10(10):8243–8254. | ||
Huang S, Qiu HN, Liu Y, et al. Molecular interaction investigation between three CdTe:Zn2+ quantum dots and human serum albumin: a comparative study. Colloid Surf B-Biointerfaces. 2015;136:955–962. | ||
Kumar N, Wiraja C, Palanisamy K, Marsilia E, Xu C. Heat shock mediated labelling of Pseudomonas aeruginosa with quantum dots. Colloid Surf B Biointerfaces. 2016;142:259–265. | ||
Wang Y, Herron N. Nanometer-sized semiconductor clusters – Materials synthesis, quantum size effects, and photophysical properties. J Phys Chem. 1991;95(2):525–532. | ||
Bang J, Yang H, Holloway PH. Enhanced and stable green emission of ZnO nanoparticles by surface segregation of Mg. Nanotechnology. 2006;17(4):973–978. | ||
Nejdl L, Richtera L, Xhaxhiu K, et al. UV tuning of cadmium telluride quantum dots (CdTe QDs) – assessed by spectroscopy and electrochemistry. Int J Electrochem Sci. 2016;11(11):175–188. | ||
Pei DF, Li YC, Huang QR, Ren Q, Li F, Shi TF. Quantum dots encapsulated glycopolymer vesicles: synthesis, lectin recognition and photoluminescent properties. Colloid Surf B Biointerfaces. 2015;127:130–136. | ||
Kucur E, Bucking W, Giernoth R, Nann T. Determination of defect states in semiconductor nanocrystals by cyclic voltammetry. J Phys Chem B. 2005;109(43):20355–20360. | ||
Tmejova K, Hynek D, Kopel P, et al. Structural effects and nanoparticle size are essential for quantum dots-metallothionein complex formation. Colloid Surf B Biointerfaces. 2015;134(1):262–272. | ||
Tmejova K, Hynek D, Kopel P, et al. Study of metallothionein-quantum dots interactions. Colloid Surf B Biointerfaces. 2014;117(1):534–537. | ||
Sapsford KE, Pons T, Medintz IL, Mattoussi H. Biosensing with luminescent semiconductor quantum dots. Sensors. 2006;6(8):925–953. | ||
Sukhanova A, Devy M, Venteo L, et al. Biocompatible fluorescent nanocrystals for immunolabeling of membrane proteins and cells. Anal Biochem. 2004;324(1):60–67. | ||
Dahan M, Levi S, Luccardini C, Rostaing P, Riveau B, Triller A. Diffusion dynamics of glycine receptors revealed by single-quantum dot tracking. Science. 2003;302(5644):442–445. | ||
Heger Z, Cernei N, Blazkova I, et al. gamma-Fe2O3 nanoparticles covered with glutathione-modified quantum dots as a fluorescent nanotransporter. Chromatographia. 2014;77(21–22):1415–1423. | ||
Allen PM, Bawendi MG. Ternary I-III-VI quantum dots luminescent in the red to near-infrared. J Am Chem Soc. 2008;130(29):9240–9241. | ||
Blackman B, Battaglia D, Peng XG. Bright and water-soluble near IR-emitting CdSe/CdTe/ZnSe Type-II/Type-I nanocrystals, tuning the efficiency and stability by growth. Chem Mater. 2008;20(15):4847–4853. | ||
Dabbousi BO, RodriguezViejo J, Mikulec FV, et al. (CdSe)ZnS core-shell quantum dots: Synthesis and characterization of a size series of highly luminescent nanocrystallites. J Phys Chem B. 1997;101(46):9463–9475. | ||
Du YP, Xu B, Fu T, et al. Near-infrared photoluminescent Ag2S quantum dots from a single source precursor. J Am Chem Soc. 2010;132(5):1470–1471. | ||
Hewa-Kasakarage NN, Gurusinghe NP, Zamkov M. Blue-shifted emission in CdTe/ZnSe heterostructured nanocrystals. J Phys Chem C. 2009;113(11):4362–4368. | ||
Mangolini L, Jurbergs D, Rogojina E, Kortshagen U. High efficiency photoluminescence from silicon nanocrystals prepared by plasma synthesis and organic surface passivation. In: Stutzmann M, editor. Physica Status Solidi C – Current Topics in Solid State Physics. Weinheim, Germany: Wiley-V C H Verlag Gmbh; 2006:3975–3978. | ||
Shen S, Zhang Y, Peng L, Du Y, Wang Q. Matchstick-shaped Ag2S-ZnS heteronanostructures preserving both UV/blue and near-infrared photoluminescence. Angew Chem Int Ed Engl. 2011;50(31):7115–7118. | ||
Tsay JM, Pflughoefft M, Bentolila LA, Weiss S. Hybrid approach to the synthesis of highly luminescent CdTe/ZnS and CdHgTe/ZnS nanocrystals. J Am Chem Soc. 2004;126(7):1926–1927. | ||
Zhang CL, Ji XH, Zhang Y, et al. One-pot synthesized aptamer-functionalized CdTe:Zn2+ quantum dots for tumor-targeted fluorescence imaging in vitro and in vivo. Anal Chem. 2013;85(12):5843–5849. | ||
Erogbogbo F, Yong KT, Roy I, et al. In vivo targeted cancer imaging, sentinel lymph node mapping and multi-channel imaging with biocompatible silicon nanocrystals. ACS Nano. 2011;5(1):413–423. | ||
Moulick A, Blazkova I, Milosavljevic V, et al. Application of CdTe/ZnSe quantum dots in in vitro imaging of chicken tissue and embryo. Photochem Photobiol. 2015;91(2):417–423. | ||
Gaponik N, Talapin DV, Rogach AL, et al. Thiol-capping of CdTe nanocrystals: an alternative to organometallic synthetic routes. J Phys Chem B. 2002;106(29):7177–7185. | ||
Wang SP, Mamedova N, Kotov NA, Chen W, Studer J. Antigen/antibody immunocomplex from CdTe nanoparticle bioconjugates. Nano Lett. 2002;2(8):817–822. | ||
Wuister SF, Swart I, van Driel F, Hickey SG, Donega CD. Highly luminescent water-soluble CdTe quantum dots. Nano Lett. 2003;3(4):503–507. | ||
Noh H, Goodman SM, Mohan P, Goodwin AP, Nagpal P, Cha JN. Direct conjugation of DNA to quantum dots for scalable assembly of photoactive thin films. RSC Adv. 2014;4(16):8064–8071. | ||
Samanta A, Deng ZT, Liu Y. Infrared emitting quantum dots: DNA conjugation and DNA origami directed self-assembly. Nanoscale. 2014;6(9):4486–4490. | ||
Onoshima D, Kaji N, Tokeshi M, Baba Y. Nuclease tolerant FRET probe based on DNA-quantum dot conjugation. Anal Sci. 2008;24(2):181–183. | ||
Parak WJ, Gerion D, Zanchet D, et al. Conjugation of DNA to silanized colloidal semiconductor nanocrystalline quantum dots. Chem Mat. 2002;14(5):2113–2119. | ||
Singh NP, McCoy MT, Tice RR, Schneider EL. A simple technique for quantitation of low levels of DNA damage in individual cells. Exp Cell Res. 1988;175(1):184–191. | ||
Van Lanen SG, Oh TJ, Liu W, Wendt-Pienkowski E, Shen B. Characterization of the maduropeptin biosynthetic gene cluster from Actinomadura madurae ATCC 39144 supporting a unifying paradigm for enediyne biosynthesis. J Am Chem Soc. 2007;129(43):13082–13094. | ||
Long GL, Winefordner JD. Limit of detection. Anal Chem. 1983;55(7):A712–A724. | ||
Nowak MJ, Lapinski L, Kwiatkowski JS, Leszczynski J. Molecular structure and infrared spectra of adenine. Experimental-matrix isolation and density functional theory study of adenine N-15 isotopomers. J Phys Chem. 1996;100(9):3527–3534. | ||
Lopes RP, Marques MPM, Valero R, Tomkinson J, de Carvalho L. Guanine: a combined study using vibrational spectroscopy and theoretical methods. Spectr Int J. 2012;27(5–6):273–292. | ||
Kwiatkowski JS, Leszczynski J. Molecular structure and vibrational IR spectra of cytosine and its thio and seleno analogues by density functional theory and conventional ab initio calculations. J Phys Chem. 1996;100(3):941–953. | ||
Aida M, Kaneko M, Dupuis M, et al. Vibrational modes in thymine molecule from an ab initio MO calculation. Spectroc Acta Pt A-Molec Biomolec Spectr. 1997;53(3):393–407. | ||
Kopel P, Travnicek Z, Zboril R, Marek J. Synthesis, X-ray and Mossbauer study of iron(II) complexes with trithiocyanuric acid (ttcH(3)). The X-ray structures of Fe(bpy)(3) (ttcH) center dot 2bpy center dot 7H(2)O and Fe(phen)(3) (ttcH(2))(ClO4) center dot 2CH(3)OH center dot 2H(2)O. Polyhedron. 2004;23(14):2193–2202. | ||
Kopel P, Travnicek Z, Marek J, Korabik M, Mrozinski J. Syntheses and properties of binuclear copper(II) mixed-ligand complexes involving thiodiglycolic acid. The crystal structures of (phen)(2)Cu(mu-tdga)Cu(phen) (NO3)(2)center dot 5H(2)O and (H2O)(pmdien)Cu(mu-tdga)Cu(pmdien)(H2O) (ClO4)(2). Polyhedron. 2003;22(3):411–418. | ||
Kopel P, Kamenicek J, Petricek V, Kurecka A, Kalinska B, Mrozinski J. Syntheses and study on nickel and copper complexes with 1,3,5-benzenetricarboxylic acid. Crystal and molecular structure of Cu3-(mdpta)(3)(btc) (ClO4)(3) center dot 4H(2)O. Polyhedron. 2007;26(3):535–542. | ||
Zhu D, Liu J, Tang Y, Xing D. A reusable DNA biosensor for the detection of genetically modified organism using magnetic bead-based electrochemiluminescence. Sens Actuator B Chem. 2010;149(1):221–225. | ||
Xia F, White RJ, Zuo XL, et al. An electrochemical supersandwich assay for sensitive and selective DNA detection in complex matrices. J Am Chem Soc. 2010;132(41):14346–14348. | ||
Won BY, Shin S, Fu R, Shin SC, Cho DY, Park HG. A one-step electrochemical method for DNA detection that utilizes a peroxidase-mimicking DNAzyme amplified through PCR of target DNA. Biosens. Bioelectron. 2011;30(1):73–77. | ||
Feng XL, Xu QL, Liu LB, Wang S. A new light-harvesting conjugated polyelectrolyte microgel for DNA and enzyme detections. Langmuir. 2009;25(24):13737–13741. | ||
Zhao YJ, Zhao XW, Tang BC, et al. Quantum-dot-tagged bioresponsive hydrogel suspension array for multiplex label-free DNA detection. Adv Funct Mater. 2010;20(6):976–982. | ||
He Y, Su S, Xu TT, et al. Silicon nanowires-based highly-efficient SERS-active platform for ultrasensitive DNA detection. Nano Today. 2011;6(2):122–130. | ||
Loo AH, Sofer Z, Bousa D, Ulbrich P, Bonanni A, Pumera M. Carboxylic carbon quantum dots as a fluorescent sensing platform for DNA detection. ACS Appl Mater Interfaces. 2016;8(3):1951–1957. | ||
Wang X, Lou XH, Wang Y, et al. QDs-DNA nanosensor for the detection of hepatitis B virus DNA and the single-base mutants. Biosens Bioelectron. 2010;25(8):1934–1940. | ||
Amo-Ochoa P, Miguel PJS, Castillo O, Sabat M, Lippert B, Zamora F. Interguanine hydrogen-bonding patterns in adducts with water and Zn-purine complexes (purine is 9-methyladenine and 9-methylguanine). Unexpected preference of Zn(II) for adenine-N7 over guanine-N7. J Biol Inorg Chem. 2007;12(4):543–555. | ||
Garcia-Teran JP, Castillo O, Luque A, Garcia-Couceiro U, Roman P, Lloret F. One-dimensional oxalato-bridged Cu(II), Co(II), and Zn(II) complexes with purine and adenine as terminal ligands. Inorg Chem. 2004;43(18):5761–5770. | ||
Mohapatra B, Verma S. Crystal engineering with modified 2-aminopurine and group 12 metal. Cryst Growth Des. 2013;13(7):2716–2721. | ||
Shipman MA, Price C, Gibson AE, Elsegood MRJ, Clegg W, Houlton A. Monomer, dimer, tetramer, polymer: Structural diversity in zinc and cadmium complexes of chelate-tethered nucleobases. Chem Eur J. 2000;6(23):4371–4378. | ||
Amo-Ochoa P, Castillo O, Miguel PJS, Zamora F. Unusual dimeric Zn(II)-cytosine complexes: New models of the interaction of Zn(II) with DNA and RNA. J Inorg Biochem. 2008;102(2):203–208. | ||
Sponer J, Sabat M, Gorb L, Leszczynski J, Lippert B, Hobza P. The effect of metal binding to the N7 site of purine nucleotides on their structure, energy, and involvement in base pairing. J Phys Chem B. 2000;104(31):7535–7544. | ||
Regulacio MD, Han MY. Composition-tunable alloyed semiconductor nanocrystals. Accounts Chem Res. 2010;43(5):621–630. | ||
Kinkead B, Hegmann T. Effects of size, capping agent, and concentration of CdSe and CdTe quantum dots doped into a nematic liquid crystal on the optical and electro-optic properties of the final colloidal liquid crystal mixture. J Mater Chem. 2010;20(3):448–458. |
Supplementary material
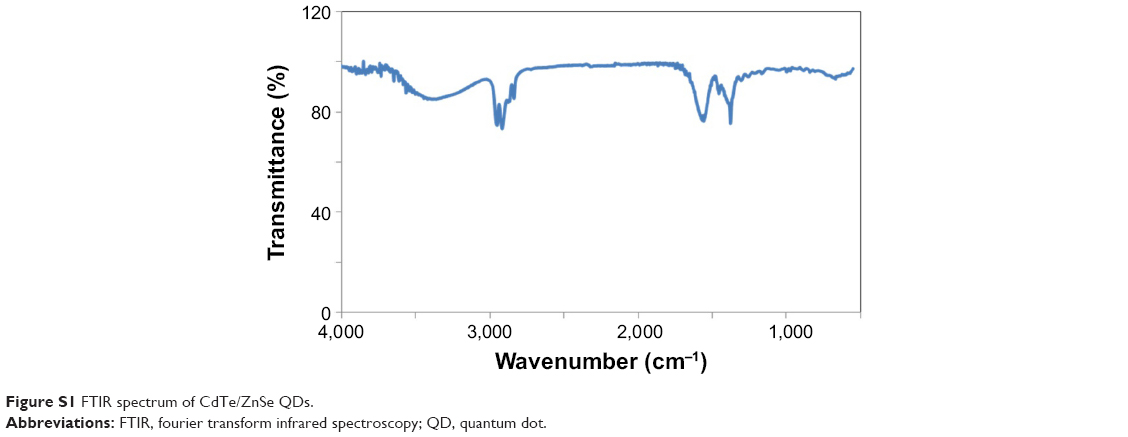 | Figure S1 FTIR spectrum of CdTe/ZnSe QDs. |
 © 2017 The Author(s). This work is published and licensed by Dove Medical Press Limited. The
full terms of this license are available at https://www.dovepress.com/terms
and incorporate the Creative Commons Attribution
- Non Commercial (unported, 3.0) License.
By accessing the work you hereby accept the Terms. Non-commercial uses of the work are permitted
without any further permission from Dove Medical Press Limited, provided the work is properly
attributed. For permission for commercial use of this work, please see paragraphs 4.2 and 5 of our Terms.
© 2017 The Author(s). This work is published and licensed by Dove Medical Press Limited. The
full terms of this license are available at https://www.dovepress.com/terms
and incorporate the Creative Commons Attribution
- Non Commercial (unported, 3.0) License.
By accessing the work you hereby accept the Terms. Non-commercial uses of the work are permitted
without any further permission from Dove Medical Press Limited, provided the work is properly
attributed. For permission for commercial use of this work, please see paragraphs 4.2 and 5 of our Terms.