Back to Journals » International Journal of Chronic Obstructive Pulmonary Disease » Volume 12
Use of the forced-oscillation technique to estimate spirometry values
Authors Yamamoto S, Miyoshi S ![]() , Katayama H, Okazaki M, Shigematsu H, Sano Y, Matsubara M, Hamaguchi N
, Katayama H, Okazaki M, Shigematsu H, Sano Y, Matsubara M, Hamaguchi N ![]() , Okura T, Higaki J
, Okura T, Higaki J
Received 11 June 2017
Accepted for publication 29 August 2017
Published 3 October 2017 Volume 2017:12 Pages 2859—2868
DOI https://doi.org/10.2147/COPD.S143721
Checked for plagiarism Yes
Review by Single anonymous peer review
Peer reviewer comments 2
Editor who approved publication: Prof. Dr. Richard Russell
Shoichiro Yamamoto,1 Seigo Miyoshi,1 Hitoshi Katayama,1 Mikio Okazaki,2 Hisayuki Shigematsu,2 Yoshifumi Sano,2 Minoru Matsubara,3 Naohiko Hamaguchi,1 Takafumi Okura,1 Jitsuo Higaki1
1Department of Cardiology, Pulmonology, Hypertension, and Nephrology, 2Department of Cardiovascular and Thoracic Surgery, Ehime University Graduate School of Medicine, Toon, 3Department of Internal Medicine, Sumitomo Besshi Hospital, Niihama, Japan
Purpose: Spirometry is sometimes difficult to perform in elderly patients and in those with severe respiratory distress. The forced-oscillation technique (FOT) is a simple and noninvasive method of measuring respiratory impedance. The aim of this study was to determine if FOT data reflect spirometric indices.
Patients and methods: Patients underwent both FOT and spirometry procedures prior to inclusion in development (n=1,089) and validation (n=552) studies. Multivariate linear regression analysis was performed to identify FOT parameters predictive of vital capacity (VC), forced VC (FVC), and forced expiratory volume in 1 second (FEV1). A regression equation was used to calculate estimated VC, FVC, and FEV1. We then determined whether the estimated data reflected spirometric indices. Agreement between actual and estimated spirometry data was assessed by Bland–Altman analysis.
Results: Significant correlations were observed between actual and estimated VC, FVC, and FEV1 values (all r>0.8 and P<0.001). These results were deemed robust by a separate validation study (all r>0.8 and P<0.001). Bias between the actual data and estimated data for VC, FVC, and FEV1 in the development study was 0.007 L (95% limits of agreement [LOA] 0.907 and -0.893 L), -0.064 L (95% LOA 0.843 and -0.971 L), and -0.039 L (95% LOA 0.735 and -0.814 L), respectively. On the other hand, bias between the actual data and estimated data for VC, FVC, and FEV1 in the validation study was -0.201 L (95% LOA 0.62 and -1.022 L), -0.262 L (95% LOA 0.582 and -1.106 L), and -0.174 L (95% LOA 0.576 and -0.923 L), respectively, suggesting that the estimated data in the validation study did not have high accuracy.
Conclusion: Further studies are needed to generate more accurate regression equations for spirometric indices based on FOT measurements.
Keywords: forced expiratory volume in 1 second, forced-oscillation technique, forced vital capacity, spirometry, vital capacity
Introduction
Pulmonary function testing is used to evaluate respiratory mechanics and physiology in children and adults suspected of having respiratory disease. Spirometry is the most commonly used pulmonary function test and has the advantage of being readily available in both inpatient and outpatient settings. Diagnosis of COPD requires spirometry. Spirometry can be used to evaluate other obstructive pulmonary diseases, including asthma and restrictive pulmonary disease, such as interstitial lung disease (ILD). Unfortunately, spirometry can sometimes be difficult to perform in elderly and/or cognitively impaired patients and those with severe respiratory distress, because it requires maximum effort during forced expiratory maneuvers.1 Therefore, there is a need for physiologically accurate and easily performed methods of assessment of pulmonary mechanics in these patient populations.
The forced-oscillation technique (FOT) is a simple, noninvasive procedure that measures respiratory impedance.2 Because FOT does not require the forced expiratory maneuvers needed to generate spirometry data, it can be performed easily in pediatric patients3,4 and adults who are unable to perform spirometry.2,5 It has been reported that FOT measurements may be more sensitive than forced expiratory volume in 1 second (FEV1) for measuring the effects of bronchodilator drugs in patients with COPD and asthma.6–8 Further, FOT measurements have been used to assess abnormal function in the distal airway, even in the setting of normal spirometry.9,10 Finally, it has been reported that breath changes in reactance at 5 Hz (X5) might be associated with severity of ILD and physiologic abnormality.11
Although several reports have analyzed the value of FOT in assessment of pulmonary disease, it remains unclear whether FOT measurements can predict specific spirometric indices, such as vital capacity (VC), forced VC (FVC), and FEV1. Previous reports have shown significant correlations between spirometric indices and FOT measurements in patients with asthma,12 COPD,13 and ILD.11,14 However, the correlation coefficients were relatively low, and each report included only a small number of patients.
The aim of the present study was to evaluate the relationship between FOT measurements and spirometry data in both healthy subjects and patients with various respiratory diseases. To this end, we generated regression equations for VC, FVC, and FEV1 based on FOT measurements and used them to calculate estimated VC, FVC, and FEV1 values. We then determined whether the estimated data reflected spirometric indices.
Patients and methods
Study population
The development data set consisted of 1,708 consecutive patients who simultaneously underwent FOT measurements and spirometry at Ehime University Hospital between January 1, 2010 and December 31, 2015. The validation data set consisted of 1,287 subjects who simultaneously underwent FOT measurements and spirometry at Sumitomo Besshi Hospital between April 1, 2013 and March 31, 2016. FOT measurements had been performed routinely to some degree in patients who visited the respiratory division of each of the participating institutions.
Subjects were excluded if they were unable to perform spirometry at the time of the FOT measurements, if they were aged younger than 17 years, or if they were not Japanese. Subjects whose spirometry performance did not meet American Thoracic Society (ATS)/European Respiratory Society (ERS) spirometry criteria15 were also excluded.
The study protocol was approved by the ethical committees of Ehime University Hospital and Sumitomo Besshi Hospital. The need for patient consent was waived, in view of the retrospective nature of the study. Our manuscript data was deidentified, and did not require patient consent to review.
Forced oscillometry
Respiratory impedance was measured using a commercially available multifrequency FOT device (MostGraph-01; Chest MI, Tokyo, Japan) as previously reported12–14 and following standard recommendations.16,17 Briefly, oscillatory signals generated by a loudspeaker at 0.25-second intervals were applied to the respiratory system through a mouthpiece during tidal breathing at rest. Mouth pressure and flow signals were measured, and the values of resistance and reactance to the oscillatory frequency were obtained. During the procedure, the subjects used a nose clip with the cheeks firmly supported while sitting with the neck in a comfortable, neutral posture. We measured resistance at 5 Hz (R5), resistance at 20 Hz (R20), X5, and resonant frequency (Fres) where the reactance crossed zero and the elastic and inertial forces were equal in magnitude and opposite in direction. The low-frequency reactance area (ALX), which is the integral of reactance from R5 to Fres, was also measured. Each oscillatory index was expressed in the whole-breath, inspiratory, and expiratory phases. The oscillatory index in the whole-breath phase was used. FOT was performed prior to spirometry.
Spirometry
Spirometry was performed according to the method described in the ATS/ERS guidelines.15 Pulmonary function indices, including VC, FVC, and FEV1, were measured by spirometry. The indices were calculated as percentages of predicted normal values. Predicted normal values for VC, FVC, and FEV1 were calculated using the equation devised by the Japanese Respiratory Society, as previously reported.18
Definition
All patients with ILD were diagnosed in accordance with the clinical criteria established by the current ATS/ERS guidelines.19 Diagnoses of asthma were based on clinical history and historical evidence of reversible airway obstruction. COPD and chronic bronchitis were diagnosed according to Global Initiative for Obstructive Lung Disease criteria.20 Acute bronchitis was diagnosed based on a previously reported definition.21 Diagnosis of sarcoidosis was based on clinical findings and histologic evidence of noncaseating epithelioid cell granuloma after excluding known causes of granulomatous disease according to the ATS/ERS/World Association of Sarcoidosis and Other Granulomatous Disorders guidelines.22
Calculation of estimated VC, FVC, and FEV1
In the development study, we identified parameters predictive of VC, FVC, and FEV1 using anthropometric variables (age, sex, height, body weight) with and without FOT indices. Using the results, we determined two types of regression equations and calculated the estimated VC, FVC, and FEV1.
Equation 1 for estimated VC, FVC, and FEV1 was: L = numeric constant + age × (regression coefficient of age) + sex (1 if female, 2 if male) × (regression coefficient of sex) + height (cm) × (regression coefficient of height) + body weight (kg) × (regression coefficient of body weight).
Equation 2 for estimated VC, FVC, and FEV1 was: L = numeric constant + age × (regression coefficient of age) + sex (1 if female, 2 if male) × (regression coefficient of sex) + height (cm) × (regression coefficient of height) + body weight (kg) × (regression coefficient of body weight) + R5 × (regression coefficient of R5) + R20 × (regression coefficient of R20) + X5 × (regression coefficient of X5) + Fres × (regression coefficient of Fres) + ALX × (regression coefficient of ALX).
In this analysis, we generated equations for VC, FVC, and FEV1 including all predictive variables uniformly (equation 1 for all anthropometric variables and equation 2 for all anthropometric variables and FOT indices), whether these variables were statistically significant predictors or not.
Validation study
Using a separate validation data set (obtained from Sumitomo Besshi Hospital), we sought correlations between spirometry and MostGraph-01 data. In addition, the equations derived from the development study were evaluated by determining the correlation coefficients between the actual and estimated data.
Statistical analysis
Results are reported as mean ± SD. Correlations between variables were determined using Pearson’s correlation coefficient. Correlation statistics were interpreted as slight (<0.2), fair (0.2–0.4), moderate (0.4–0.6), substantial (0.6–0.8), or almost perfect (>0.8) agreement.23 Multivariate linear regression analysis was used to identify parameters predictive of VC, FVC, and FEV1, with age, sex, height, body weight, R5, R20, X5, Fres, and ALX included as independent variables. The bias of the equations was expressed as the mean difference between the estimated data and the actual data (estimated data – actual data). The root-mean-square-error (RMSE) was calculated as the square root of (sum of squared errors of the estimate/n). The agreement between the equations was evaluated by Bland–Altman plots using 95% limits of agreement (LOA), which were calculated as average difference ± two SDs. The 95% CIs were computed for all variables. All tests were two-tailed, and a P-value <0.05 was considered to be statistically significant. Statistical analysis was performed using SPSS version 22 for Windows (IBM, Armonk, NY, Japan).
Results
Clinical characteristics of patients in the development study
Of the 1,708 subjects identified, 1,608 underwent spirometry at the same time as MostGraph-01 examination. a total of 502 subjects with suboptimal spirometry data, 13 aged younger than 17 years, and four who were not Japanese were excluded, leaving data from 1,089 subjects (615 male, 474 female) for inclusion in the final analysis (Figure 1). The characteristics of the study subjects are presented in Table 1. The majority of patients in the development study had malignant lung tumors, asthma, COPD, or ILD.
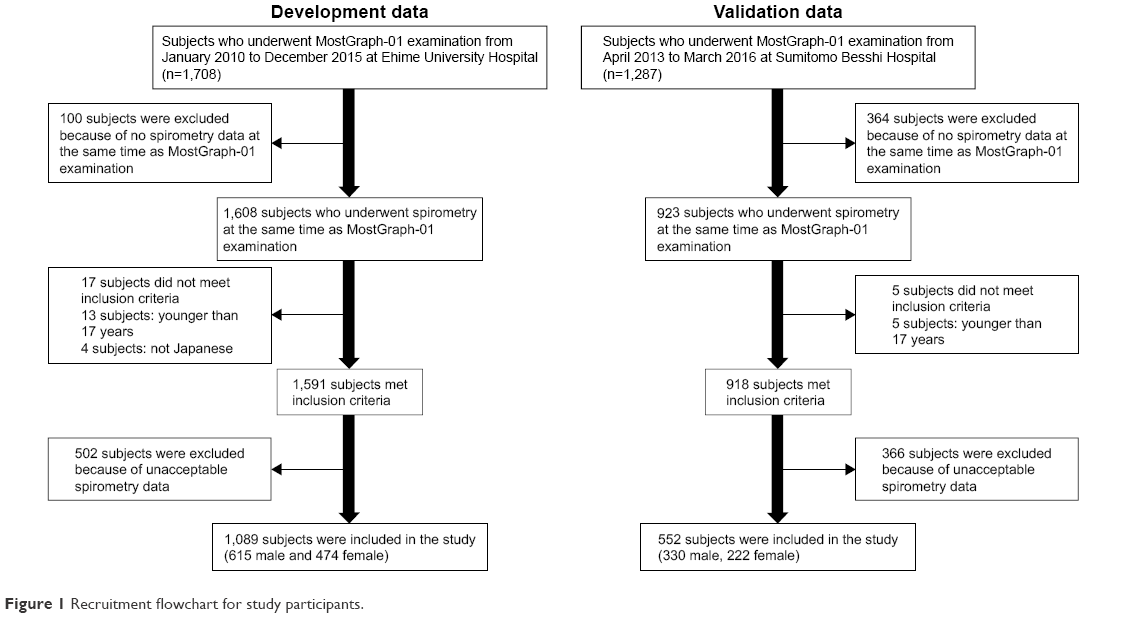 | Figure 1 Recruitment flowchart for study participants. |
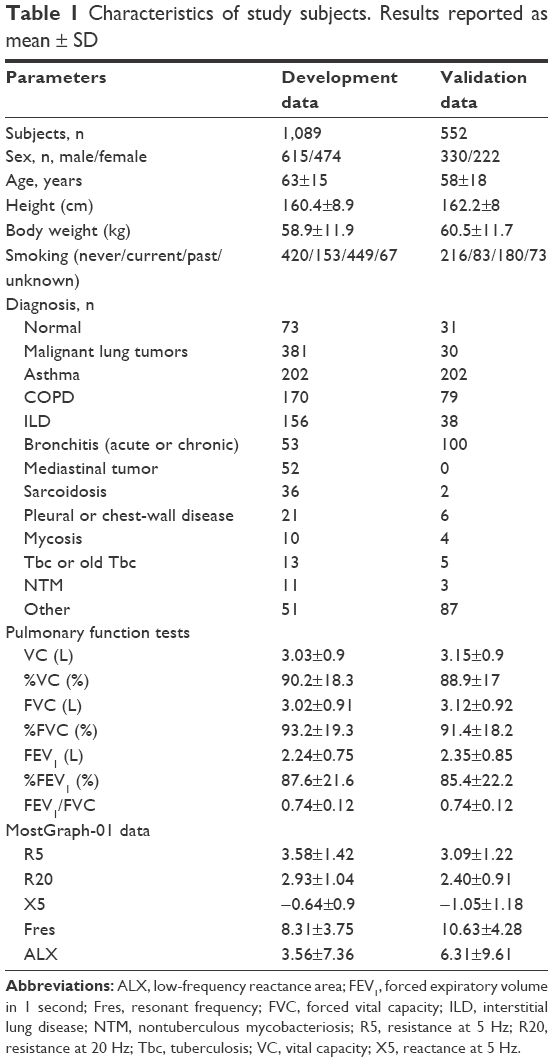 | Table 1 Characteristics of study subjects. Results reported as mean ± SD |
Correlations between spirometry and MostGraph-01 data in the development study
Statistically significant correlations were observed between most spirometry and MostGraph-01 parameters (Table 2). However, FEV1/FVC showed modest correlations with all MostGraph-01 parameters. R5 and R20 showed fair or moderate correlations with VC, %VC, FVC, %FVC, FEV1, and %FEV1. X5, Fres, and ALX demonstrated moderate or substantial correlations with VC, %VC, FVC, %FVC, FEV1, and %FEV1.
 | Table 2 Correlations between spirometry and MostGraph-01 data |
Calculation of estimated VC, FVC, and FEV1
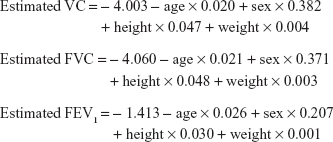
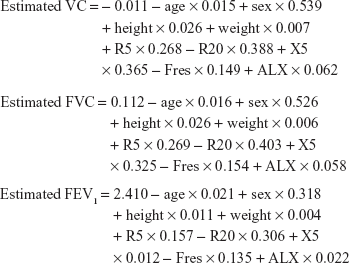
We identified parameters predictive of VC, FVC, or FEV1, with age, sex, height, and body weight with and without FOT parameters as independent variables. Multivariate linear regression analysis using only anthropometric variables showed that almost all parameters correlated significantly with VC, FVC, and FEV1, with the exception of body weight with FVC and FEV1. Multivariate analysis including the FOT parameters also showed that almost all parameters correlated significantly with VC, FVC, and FEV1, with the exception of X5 and FEV1 (Tables 3–5). Based on these results, we generated regression equations, and calculated the estimated VC, FVC, and FEV1:
Equation 1
|
Equation 2
|
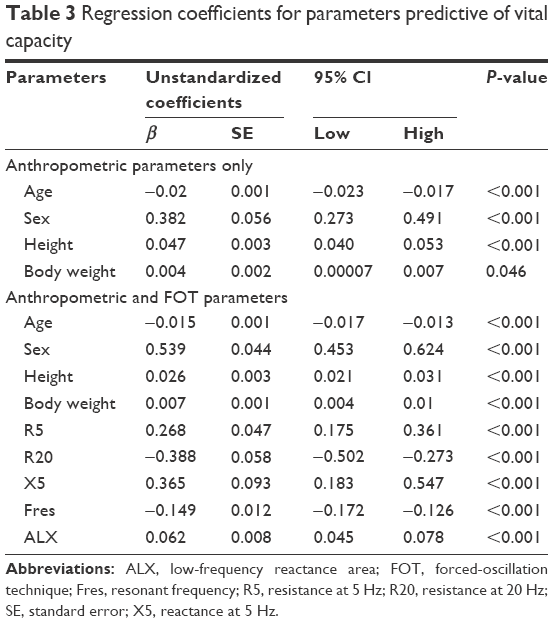 | Table 3 Regression coefficients for parameters predictive of vital capacity |
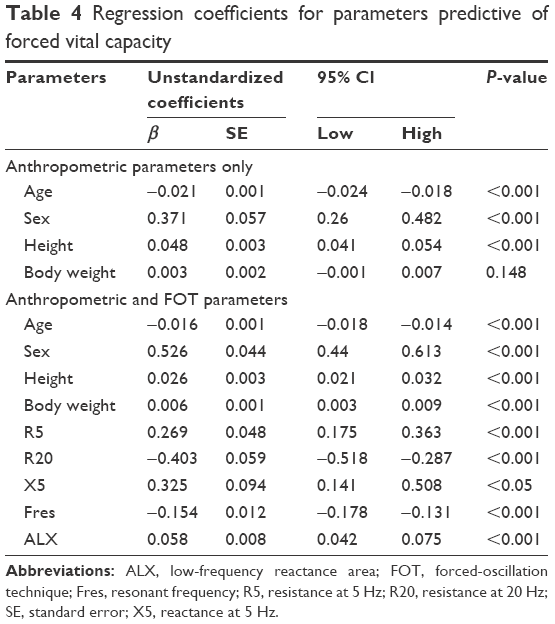 | Table 4 Regression coefficients for parameters predictive of forced vital capacity |
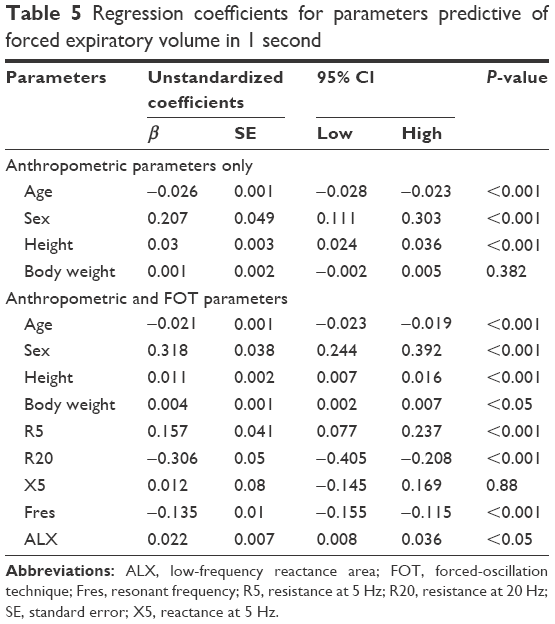 | Table 5 Regression coefficients for parameters predictive of forced expiratory volume in 1 second |
Correlations between actual and estimated VC, FVC, and FEV1
We observed statistically significant correlations between actual and estimated VC, FVC, and FEV1 in the analyses using equations 1 and 2 (all P<0.001; Figure 2A–F; Table 6). Estimated VC, FVC, and FEV1 derived from equation 2 demonstrated almost perfect correlation with actual VC (r=0.867), FVC (r=0.867), and FEV1 (r=0.857), while estimated VC, FVC, and FEV1 derived from equation 1 demonstrated substantial correlation with actual VC (r=0.745), FVC (r=0.741), and FEV1 (r=0.711). In addition, estimated VC, FVC, and FEV1 using equation 2 had smaller RMSE values than those obtained using equation 1. The Bland–Altman plots are shown in Figure 3. The bias of equation 1 was 0.075 L for VC, 0.058 L for FVC, and −0.095 L for FEV1. The 95% LOAs for equation 1 were 1.279 and −1.129 L for VC, 1.281 and −1.166 L for FVC, and 0.963 and −1.152 L for FEV1. In contrast, the bias of equation 2 was 0.007 L for VC, −0.064 L for FVC, and −0.039 L for FEV1. The 95% LOAs for equation 2 were 0.907 and −0.893 L for VC, 0.843 and −0.971 L for FVC, and 0.735 and −0.814 L for FEV1.
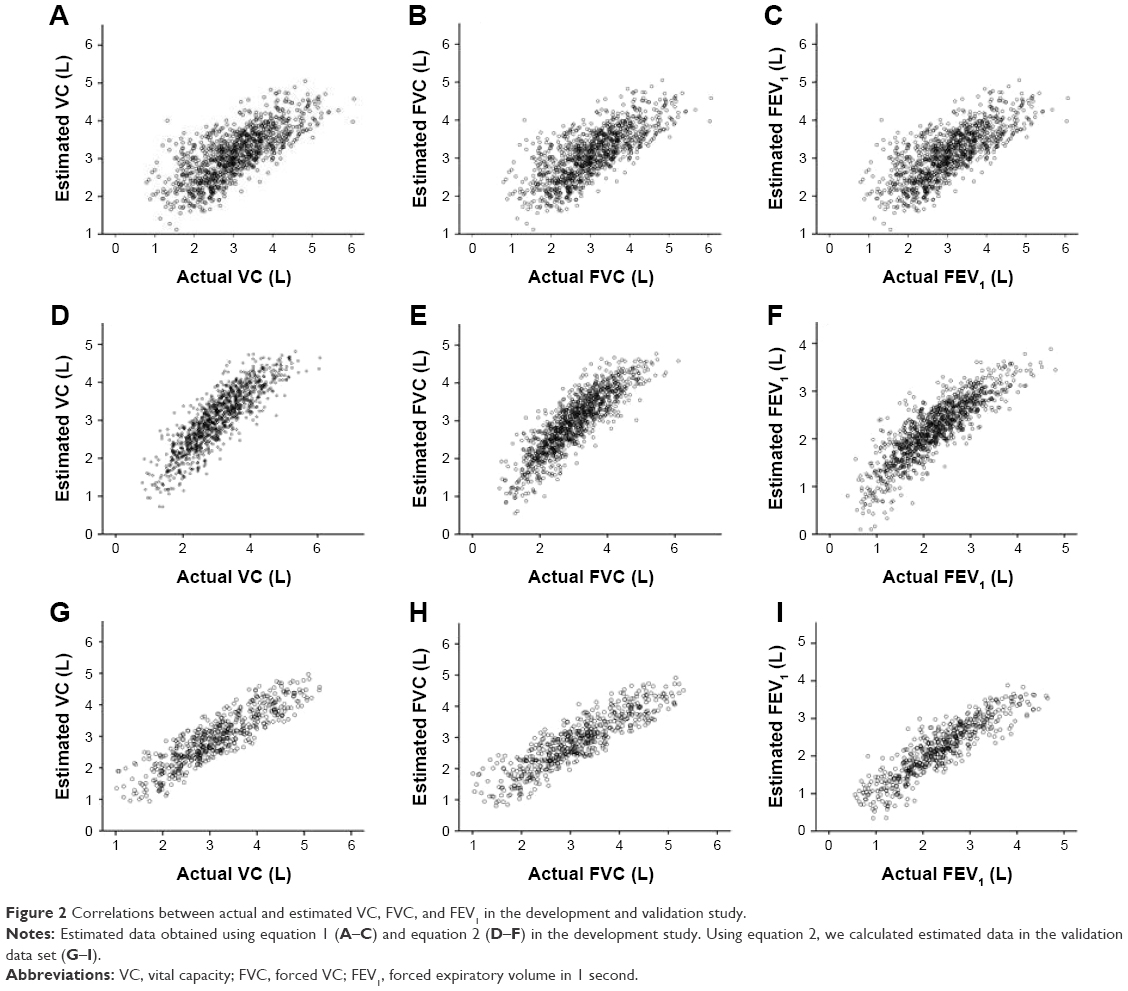 | Figure 2 Correlations between actual and estimated VC, FVC, and FEV1 in the development and validation study. |
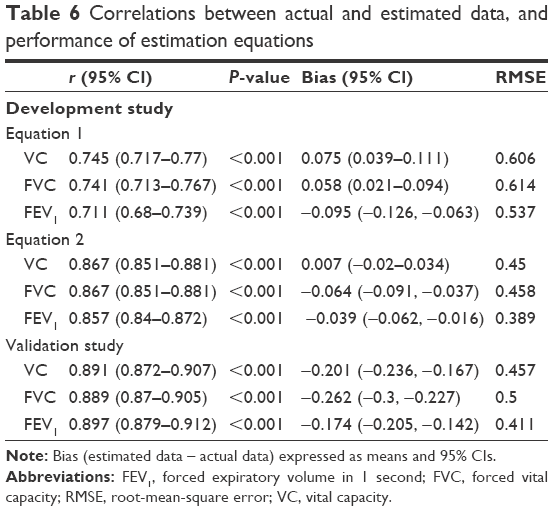 | Table 6 Correlations between actual and estimated data, and performance of estimation equations |
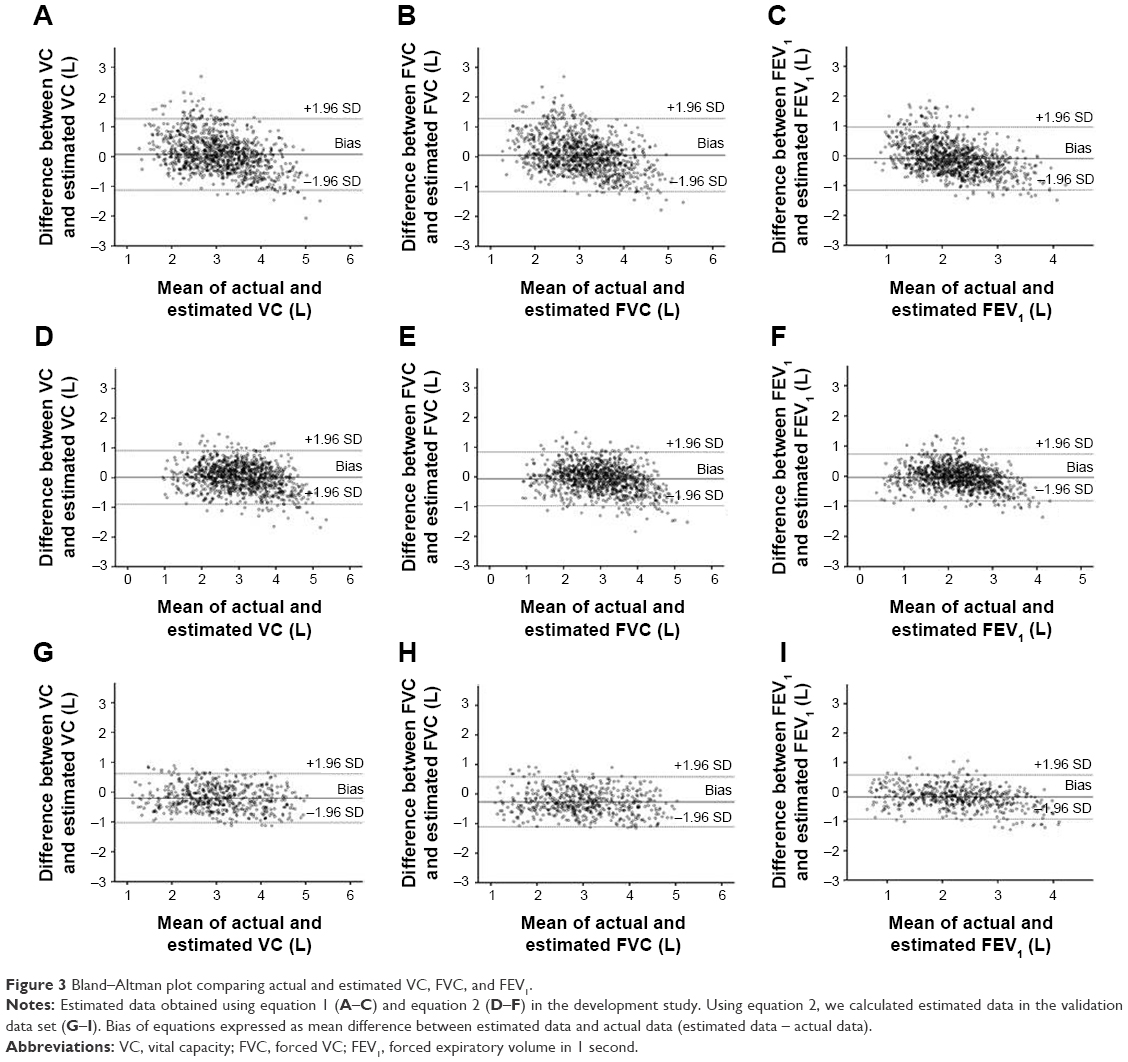 | Figure 3 Bland–Altman plot comparing actual and estimated VC, FVC, and FEV1. |
Validation study
Based on the development-study results, we evaluated the validity of equation 2 in the validation study. After exclusion of subjects with suboptimal spirometry data, the validation study comprised 552 subjects (330 male, 222 female; Figure 1). The characteristics of these patients are shown in Table 1.
There were statistically significant correlations between all spirometry and MostGraph-01 parameters (Table 2). FEV1/FVC showed slight or moderate correlations with all MostGraph-01 parameters. R5 and R20 showed slight or fair correlations with VC, %VC, FVC, %FVC, FEV1, and %FEV1. X5, Fres, and ALX demonstrated moderate or substantial correlations with VC, %VC, FVC, %FVC, FEV1, and %FEV1.
Using equation 2 derived from the development data set, we calculated estimated VC, FVC, and FEV1 for all patients in the validation data set, and assessed correlations between actual and estimated VC, FVC, and FEV1 values. We observed statistically significant correlations between actual and estimated VC, FVC, and FEV1 values (all P<0.001; Figure 2G–I, Table 6). Estimated VC, FVC, and FEV1 demonstrated almost perfect correlation with actual VC (r=0.891), FVC (r=0.889), and FEV1 (r=0.897). However, the bias between estimated and actual data for VC, FVC, and FEV1 was −0.201 L, −0.262 L, and −0.174 L, respectively. The 95% LOAs were 0.62 and −1.022 L for VC, 0.582 and −1.106 L for FVC, and 0.576 and −0.923 L for FEV1 (Figure 3).
Discussion
This study evaluated the hypothesis that FOT measurements correlate significantly with spirometry data. We used FOT measurements to develop regression equations to estimate VC, FVC, and FEV1, and compared estimated values with spirometry values. Our results demonstrated that estimated VC, FVC, and FEV1 correlated significantly with actual data in both the development and validation studies. However, the estimated data in the validation study still did not show high accuracy. To our knowledge, this is the first study of whether FOT indices predict spirometry parameters.
Previous reports have shown that some FOT parameters are associated with spirometry values. A significant correlation of %FEV1 and FEV1/FVC values with Rrs and Xrs parameters has been demonstrated in patients with asthma.12 In addition, significant correlations have been found between breath changes in X5 and %FVC, %FEV1, and FEV1/FVC in patients with COPD.13 In patients with ILD, it has been reported that X5, Fres, and ALX correlate with %FVC and %FEV1.14 Sugiyama et al also reported a significant inverse correlation between breath changes in X5 and %VC.11 However, correlation coefficients in these previous reports showed only fair–moderate agreement. Shirai and Kurosawa reported that FOT is not a surrogate test for spirometry, because the tests are not identical.16 Consistently with previous reports, the present study demonstrated that most FOT indices are significantly correlated with spirometric indices, but the correlation is only fair–moderate. Therefore, other parameters that reflect spirometry more accurately are required.
In order to solve this problem, we generated regression equations to estimate VC, FVC, and FEV1 based on FOT measurements. First, we compared the accuracy of an equation built on anthropometric values and FOT indices (equation 2) with that of an equation using anthropometric values alone (equation 1). Estimated VC, FVC, and FEV1 derived from equations 1 and 2 correlated significantly with actual VC, FVC, and FEV1. However, correlation coefficients for VC, FVC, and FEV1 using equation 2 were higher than those using equation 1. Estimated VC, FVC, and FEV1 using equation 2 had lower RMSE than values obtained using equation 1. Bland–Altman plots showed that 95% LOAs for equation 2 were less broad than those of equation 1. These results suggest that adding the FOT indices as independent variables increased the ability of an equation to estimate VC, FVC, and FEV1.
Next, we assessed the accuracy of equations derived from the development study in a separate data set. Estimated VC, FVC, and FEV1 correlated significantly with actual VC, FVC, and FEV1, and the correlation coefficients for each parameter demonstrated almost perfect agreement in the validation study. However, as shown in Table 6 and Figure 3, mean differences between the estimated data and actual data in the validation study were not small. The regression equations in the present study may be incomplete. However, spirometry is sometimes difficult to perform in elderly patients, those with cognitive impairment, and those with severe respiratory distress.1 A previous report that evaluated the quality of spirometry in subjects aged 65 years or older showed that spirometry was performed correctly by only 415 of 1,242 patients (33.4%).24 The method used to assess pulmonary function in our study may be a useful approach in such patients.
Limitations
There are several limitations to this study. First, the development and validation studies were retrospective in nature. Second, no children were evaluated. Third, we used the MostGraph-01, but not the MasterScreen IOS-J (CareFusion, San Diego, CA, USA) to measure respiratory impedance. It has been reported that these devices do not necessarily generate identical impedance values, and differences between the devices should be taken into consideration when evaluating clinical data.25 Fourth, this study included only Japanese subjects. Further studies are needed to evaluate whether our findings can be extrapolated to other populations. Fifth, our analysis used the oscillatory index in the whole-breath phase, but not the inspiratory or expiratory phases, even though it has been reported that breath changes in FOT data may be useful in assessing respiratory diseases.11,13,26 Sixth, we used raw FOT values in subjects of various ages. This is because definitive predictive equations have not yet been established. Reference values for MostGraph-01 measurements in middle-aged and elderly Japanese individuals have now been published.27 However, in that study, 44.8% of the population had abnormal spirometric findings, and it was unclear how many subjects had abnormal chest-radiography findings. Therefore, it is uncertain if the findings of that study can be used as reference values for MostGraph-01 measurements. Seventh, in the present study, we evaluated whether it is possible to generate regression equations for spirometry data based on FOT measurements in both healthy subjects and patients with various respiratory diseases. However, the estimated data in the validation study still did not demonstrate high accuracy. The present analyses including the healthy subjects and patients with various respiratory diseases might be one of the reasons the estimated data were less accurate. If we had generated regression equations for spirometric indices for each respiratory disease, estimated data might have been more accurate.
Conclusion
Our findings suggest that while there is a significant correlation between estimated spirometry values derived from FOT measurements and actual values, estimated values are still not identical to actual values. Further studies are needed to generate more accurate regression equations for spirometric indices based on FOT measurements.
Data sharing statement
Our manuscript data are freely available upon request.
Acknowledgment
We would like to thank Editage (www.editage.jp) for English-language editing.
Disclosure
JH has received research grants from Takeda, Mochida, Pfizer, MSD, Astellas, Japan Boehringer Ingelheim, Daiichi Sankyo, and Dainippon Sumitomo. He has also received speaker honoraria from Takeda, Interscience, Mochida, Pfizer, MSD, Astellas, Japan Boehringer Ingelheim, Dainippon Sumitomo, and Teijin. The authors report no other conflicts of interest in this work.
References
Kubota M, Shirai G, Nakamori T, Kokubo K, Masuda N, Kobayashi H. Low frequency oscillometry parameters in COPD patients are less variable during inspiration than during expiration. Respir Physiol Neurobiol. 2009;166(2):73–79. | ||
Bickel S, Popler J, Lesnick B, Eid N. Impulse oscillometry: interpretation and practical applications. Chest. 2014;146(3):841–847. | ||
Komarow HD, Skinner J, Young M, et al. A study of the use of impulse oscillometry in the evaluation of children with asthma: analysis of lung parameters, order effect, and utility compared with spirometry. Pediatr Pulmonol. 2012;47(1):18–26. | ||
Takeda T, Oga T, Niimi A, et al. Relationship between small airway function and health status, dyspnea and disease control in asthma. Respiration. 2010;80(2):120–126. | ||
Tomalak W, Czajkowska-Malinowska M, Radliński J. Application of impulse oscillometry in respiratory system evaluation in elderly patients. Pneumonol Alergol Pol. 2014;82(4):330–335. | ||
Houghton CM, Woodcock AA, Singh D. A comparison of lung function methods for assessing dose-response effects of salbutamol. Br J Clin Pharmacol. 2004;58(2):134–141. | ||
Houghton CM, Woodcock AA, Singh D. A comparison of plethysmography, spirometry and oscillometry for assessing the pulmonary effects of inhaled ipratropium bromide in healthy subjects and patients with asthma. Br J Clin Pharmacol. 2005;59(2):152–159. | ||
Borrill ZL, Houghton CM, Woodcock AA, Vestbo J, Singh D. Measuring bronchodilation in COPD clinical trials. Br J Clin Pharmacol. 2005;59(4):379–384. | ||
Oppenheimer BW, Goldring RM, Herberg ME, et al. Distal airway function in symptomatic subjects with normal spirometry following World Trade Center dust exposure. Chest. 2007;132(4):1275–1282. | ||
Pisi R, Tzani P, Aiello M, et al. Small airway dysfunction by impulse oscillometry in asthmatic patients with normal forced expiratory volume in the 1st second values. Allergy Asthma Proc. 2013;34(1):e14–e20. | ||
Sugiyama A, Hattori N, Haruta Y, et al. Characteristics of inspiratory and expiratory reactance in interstitial lung disease. Respir Med. 2013;107(6):875–882. | ||
Shirai T, Mori K, Mikamo M, et al. Respiratory mechanics and peripheral airway inflammation and dysfunction in asthma. Clin Exp Allergy. 2013;43(5):521–526. | ||
Mikamo M, Shirai T, Mori K, et al. Predictors of expiratory flow limitation measured by forced oscillation technique in COPD. BMC Pulm Med. 2014;14:23. | ||
Fujii M, Shirai T, Mori K, et al. Inspiratory resonant frequency of forced oscillation technique as a predictor of the composite physiologic index in interstitial lung disease. Respir Physiol Neurobiol. 2015;207:22–27. | ||
Miller MR, Hankinson J, Brusasco V, et al. Standardisation of spirometry. Eur Respir J. 2005;26(2):319–338. | ||
Shirai T, Kurosawa H. Clinical application of the forced oscillation technique. Intern Med. 2016;55(6):559–566. | ||
Oostveen E, MacLeod D, Lorino H, et al. The forced oscillation technique in clinical practice: methodology, recommendations and future developments. Eur Respir J. 2003;22(6):1026–1041. | ||
Kubota M, Kobayashi H, Quanjer PH, Omori H, Tatsumi K, Kanazawa M. Reference values for spirometry, including vital capacity, in Japanese adults calculated with the LMS method and compared with previous values. Respir Investig. 2014;52(4):242–250. | ||
[No authors listed]. American Thoracic Society/European Respiratory Society international multidisciplinary consensus classification of the idiopathic interstitial pneumonias. Am J Respir Crit Care Med. 2002;165(2):277–304. | ||
Global Initiative for Chronic Obstructive Lung Disease. Global Strategy for the Diagnosis, Management, and Prevention of Chronic Obstructive Pulmonary Disease. Bethesda (MD): GOLD; 2010. | ||
Albert RH. Diagnosis and treatment of acute bronchitis. Am Fam Physician. 2010;82(11):1345–1350. | ||
Hunninghake GW, Costabel U, Ando M, et al. ATS/ERS/WASOG statement on sarcoidosis. Sarcoidosis Vasc Diffuse Lung Dis. 1999;16(2):149–173. | ||
Landis JR, Koch GG. The measurement of observer agreement for categorical data. Biometrics. 1977;33(1):159–174. | ||
Czajkowska-Malinowska M, Tomalak W, Radliński J. Quality of spirometry in the elderly. Pneumonol Alergol Pol. 2013;81(6):511–517. | ||
Tanimura K, Hirai T, Sato S, et al. Comparison of two devices for respiratory impedance measurement using a forced oscillation technique: basic study using phantom models. J Physiol Sci. 2014;64(5):377–382. | ||
Paredi P, Goldman M, Alamen A, et al. Comparison of inspiratory and expiratory resistance and reactance in patients with asthma and chronic obstructive pulmonary disease. Thorax. 2010;65(3):263–267. | ||
Abe Y, Shibata Y, Igarashi A, et al. Reference values of MostGraph measures for middle-aged and elderly Japanese individuals who participated in annual health checkups. Respir Investig. 2016;54(3):148–155. |
 © 2017 The Author(s). This work is published and licensed by Dove Medical Press Limited. The
full terms of this license are available at https://www.dovepress.com/terms
and incorporate the Creative Commons Attribution
- Non Commercial (unported, 3.0) License.
By accessing the work you hereby accept the Terms. Non-commercial uses of the work are permitted
without any further permission from Dove Medical Press Limited, provided the work is properly
attributed. For permission for commercial use of this work, please see paragraphs 4.2 and 5 of our Terms.
© 2017 The Author(s). This work is published and licensed by Dove Medical Press Limited. The
full terms of this license are available at https://www.dovepress.com/terms
and incorporate the Creative Commons Attribution
- Non Commercial (unported, 3.0) License.
By accessing the work you hereby accept the Terms. Non-commercial uses of the work are permitted
without any further permission from Dove Medical Press Limited, provided the work is properly
attributed. For permission for commercial use of this work, please see paragraphs 4.2 and 5 of our Terms.