")
Back to Journals » Medical Devices: Evidence and Research » Volume 7
Use of a radio frequency shield during 1.5 and 3.0 Tesla magnetic resonance imaging: experimental evaluation
Authors Favazza C, King D, Edmonson H, Felmlee J, Rossman P, Hangiandreou N, Watson R, Gorny K
Received 31 May 2014
Accepted for publication 2 July 2014
Published 29 October 2014 Volume 2014:7 Pages 363—370
DOI https://doi.org/10.2147/MDER.S68657
Checked for plagiarism Yes
Review by Single anonymous peer review
Peer reviewer comments 3
Christopher P Favazza, Deirdre M King, Heidi A Edmonson, Joel P Felmlee, Phillip J Rossman, Nicholas J Hangiandreou, Robert E Watson, Krzysztof R Gorny
Department of Radiology, Mayo Clinic, Rochester, MN, USA
Abstract: Radiofrequency (RF) shields have been recently developed for the purpose of shielding portions of the patient's body during magnetic resonance imaging (MRI) examinations. We present an experimental evaluation of a commercially available RF shield in the MRI environment. All tests were performed on 1.5 T and 3.0 T clinical MRI scanners. The tests were repeated with and without the RF shield present in the bore, for comparison. Effects of the shield, placed within the scanner bore, on the RF fields generated by the scanner were measured directly using tuned pick-up coils. Attenuation, by as much as 35 dB, of RF field power was found inside the RF shield. These results were supported by temperature measurements of metallic leads placed inside the shield, in which no measurable RF heating was found. In addition, there was a small, simultaneous detectable increase (~1 dB) of RF power just outside the edges of the shield. For these particular scanners, the autocalibrated RF power levels were reduced for scan locations prescribed just outside the edges of the shield, which corresponded with estimations based on the pick-up coil measurements. Additionally, no significant heating during MRI scanning was observed on the shield surface. The impact of the RF shield on the RF fields inside the magnet bore is likely to be dependent on the particular model of the RF shield or the MRI scanner. These results suggest that the RF shield could be a valuable tool for clinical MRI practices.
Keywords: radiofrequency shield, magnetic resonance imaging, radiofrequency attenuation
Introduction
Recently, radiofrequency (RF) shields have been designed and developed for use during magnetic resonance imaging (MRI).1–3 Many RF shields are now commercially available. These shields purportedly improve MRI by reducing phase wrap and other image artifacts, enabling acquisitions with smaller fields of view, and were approved by the US Food and Drug Administration in 2004 for this purpose. The manufacturer of the shield (Accusorb MRI®; MWT Materials Inc., Passaic, NJ, USA) has also suggested potential future use for shielding implanted devices and has shown preliminary data from their ongoing research; however, these shields have yet to be approved for such use.
Despite recent developments of RF shields and a growing motivation to use them, to date there are no published peer-reviewed studies that systematically characterize clinical RF shields in the MRI environment. There are numerous published reports on investigations on the measurement and management of RF fields as related to heating of devices,4–8 RF dosimetry,9 field homogeneities,10–12 and optimization of fast field-cycling MRI;13 however, there are no reports on the impact of a commercially available RF shield. The purpose of this study was to investigate the performance of a commercially available RF shield, designed to wrap around a patient’s torso, using a clinically relevant geometry and MRI scanner. Here we present results showing the effects of the shield on the RF field by direct and indirect measurements at both 1.5 T and 3.0 T. The RF field was directly measured both inside and outside of the boundaries of the shield placed within the MRI scanner bore. Additionally, the perturbations of the RF field were indirectly assessed through several additional measurements, including: metallic lead heating inside the shield, changes in automated RF power calibration for imaging outside the shield, and heating of the shield itself.
Materials and methods
For all of the following experiments, an Accusorb MRI Standard Torso Wrap RF shield (MRI M-06, MWT Materials Inc.) was placed within the bore of both 1.5 T and 3.0 T scanners (Signa HDXt, GE Healthcare, Waukesha, WI, USA). All measurements were repeated at both field strengths.
RF field measurements
To measure RF field perturbations caused by placement of the RF shield within the scanner bore, two single-loop RF pick-up coils were constructed and tuned to 64 MHz (1.5 T) and 128 MHz (3.0 T). The scanner RF power output, also called the transmit gain (TG), were set to clinically relevant levels observed on each scanner (based on our clinical experience). The TG was set to 150 and 95 (in units of 0.1 dB, relative to the calibrated power supply of the scanner) at 1.5 T and 3.0 T, respectively. One millisecond RF pulses at a constant power output were continually executed at one-second intervals, and the induced voltages in the pick-up coils were measured as peak-to-peak voltages on an oscilloscope. A set of baseline measurements was first acquired without the RF shield present inside the bore. In a second set of measurements, the RF shield was wrapped around a 28 cm diameter acrylic tube for stability and centered at isocenter inside the bore (Figure 1). Measurements were acquired at 2 cm increments along the z-axis of the bore. At each position, one measurement was obtained with the pick-up coil oriented in a horizontal position, and a second after a 90° rotation of the coil. At each position, the voltage in the bore was determined as: , where Vx and Vy are orthogonal voltage measurements.
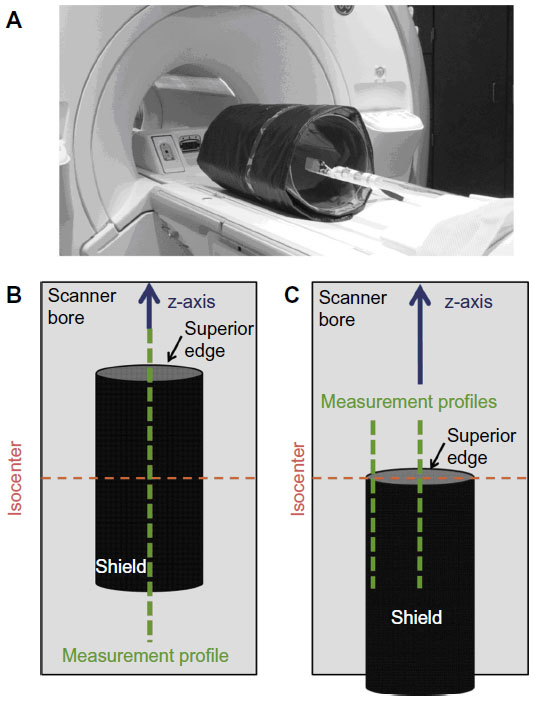 | Figure 1 Experimental setup for direct measurements of RF attenuation. |
Additional sets of measurements were performed to better assess the impact on the RF field near the edges of the shield. For these measurements, the superior edge of the shield, as indicated in Figure 1, was positioned at the magnet’s isocenter (where the main magnetic field and RF amplitude are both highest and most uniform). Measurements, as described above, were subsequently repeated along the z-axis at the bore isocenter and along the interior wall of the shield (ie, laterally offset 14 cm relative to the z-axis), where the greatest RF field perturbations are expected.
Metallic lead heating
Suppression of the RF field inside the shield should translate into a reduction of RF-induced heating of metallic leads. To investigate this, we measured temperature increases at the tips of metallic leads placed in a head-and-torso ASTM phantom (ASTM F2182-11) filled with gelled saline.14 Three 18-gauge, 40 cm long, straight copper wires were placed parallel to the scanner z-axis, positioned 20 cm apart, and completely submerged in the ASTM phantom, as depicted in Figure 2. The wires were fully insulated except for the 5 mm long bare tips. Fluoroptic temperature probes (STF-2, model 750; LumaSense Inc., Santa Clara, CA, USA) were positioned at the tip of each of the wires and a fourth probe was used to monitor the ambient temperature of the phantom. A 4-echo spin echo pulse sequence was subsequently executed for 6 minutes and 25 seconds to generate RF heating. The relevant pulse sequence parameters are listed in Table 1. TG was held constant at each field strength, 15.8 dB at 1.5 T and 13.3 dB at 3.0 T.
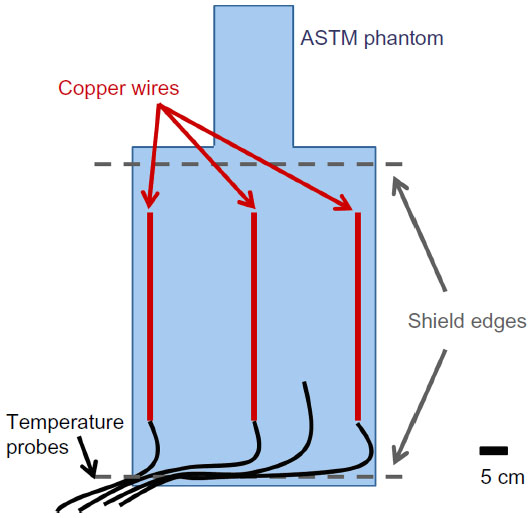 | Figure 2 Schematic of the experimental set-up for RF heating of metallic lead measurements, which shows the positions of the copper wires relative to the phantom, RF shield, and fluoroptic temperature probes. |
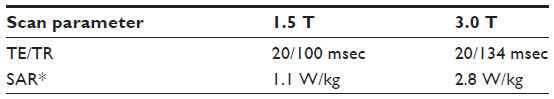 | Table 1 Scan parameters |
Temperature history at each probe location was sampled at one-second intervals. The imaging sequence was first executed without the RF shield, and subsequently repeated with the shield wrapped tightly around the phantom (ie, when wrapped, the opposing edges of the shield were brought into contact with negligible overlap) and covering the wires (see Figure 2).
Changes to scanner RF output caused by the RF shield
Introducing an RF shield into the bore is expected to influence the TG of the scanner established during auto-prescan. To investigate this effect, the shield was again wrapped around the 28 cm diameter tube and placed in the bore with its superior edge at the isocenter (see Figure 1C). An elongated dimethyl silicone-gadolinium fluid-filled cuboid phantom (16×16×38 cm3, Model 2413456; Dielectric Corporation, Lake Mills, IA, USA) was placed partially inside (10 cm) the shield. Single axial slices were prescribed in the phantom at 2 cm increments from the edge of the shield, ranging from the isocenter (edge of the shield) to a 20 cm distance from the edge of the shield. For each slice, the scanner’s auto-prescan routine was executed and the corresponding TG was recorded. Baseline measurements were also acquired without the shield present in the bore.
Heating of the surface of the RF shield
To evaluate RF heating of the shield’s surface, the shield was tightly wrapped around the ASTM phantom, and four fluoroptic probes were attached to the shield at selected locations. Probe pairs were placed 2 cm from the superior edge and in the center of the shield, with one probe on each of the exterior and interior surfaces. The set-up was placed directly on the scanner bed and advanced into the bore with the superior edge of the shield positioned 15.5 cm from the isocenter. The probe positions and experimental set-up are shown in Figure 3. A 4-echo RF spin echo pulse sequence was performed. The relevant pulse sequence parameters were the same as listed in Table 1. TG was held constant at each field strength, 14.0 dB at 1.5 T and 13.1 dB at 3.0 T. Temperature history at each probe location was sampled at one-second intervals.
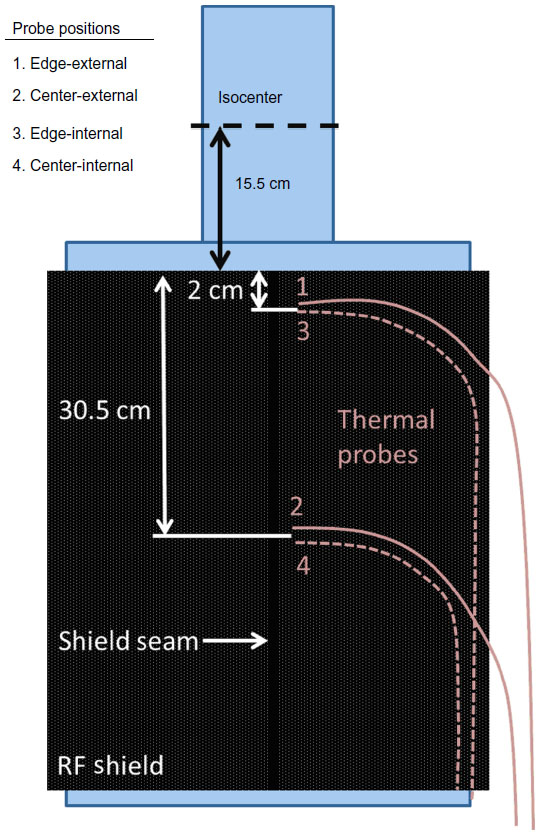 | Figure 3 Schematic of the experimental set-up used to measure heating of the surface of the RF shield. |
Results
RF field measurements
The shield substantially attenuated the RF field within its boundaries. Figure 4 shows the voltages induced in a pick-up coil along the z-axis of the bore with the RF shield centered at the isocenter. The maximum RF power attenuation at the shield’s center was approximately 35 dB at 1.5 T and 30 dB at 3.0 T (Table 2). However, this maximum attenuation was achieved only near the center of the shield, whereas at the edges of the shield, the attenuation factor dropped to a range between 6 and 10 dB.
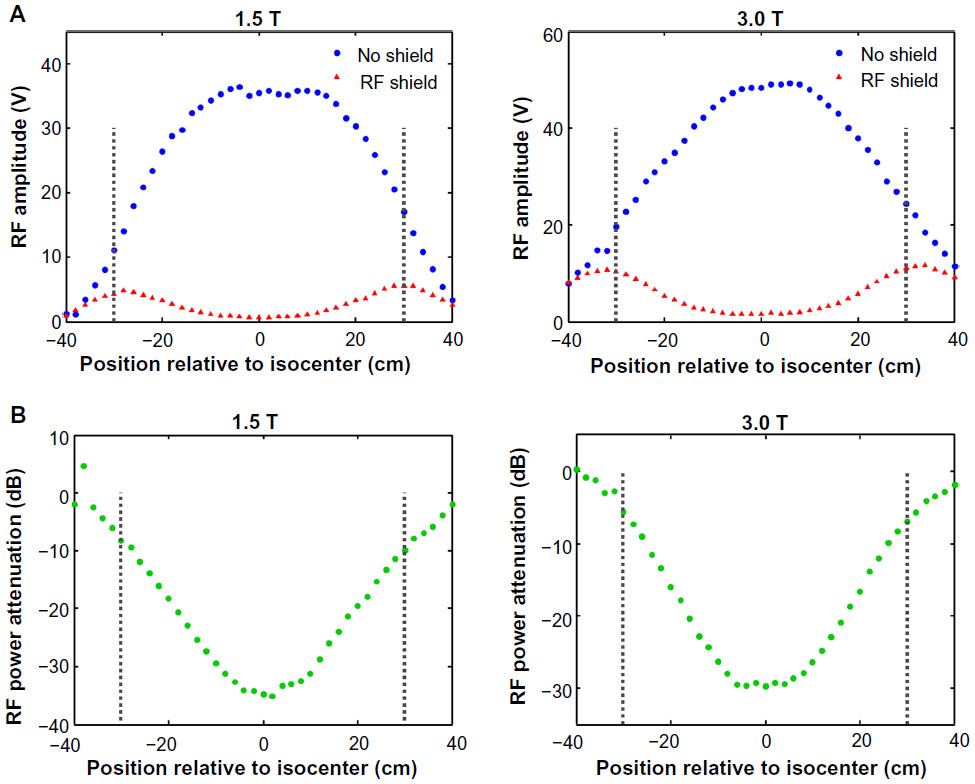 | Figure 4 Effects of the shield on the RF field inside the scanner bore. |
 | Table 2 Isocenter radiofrequency amplitude and attenuation |
In both 1.5 T and 3.0 T experiments, increases in RF power near the edges of the RF shield were observed. At 1.5 T and as shown in Figure 5, voltages induced in a pick-up coil increased maximally between 8 and 16 cm from the superior edge of the shield. At 1.5 T, RF amplitude increases of up to 3.5 V were recorded by the pick-up coil. At 3.0 T, RF amplitude increases of up to 7.6 V were recorded. This corresponds to maximal increases of RF power of approximately 1 dB at both field strengths.
 | Figure 5 Pick-up coil measurements of the effects on RF field near shield edges (A) along the central line of the bore and (B) along the shield wall (ie, 14 cm laterally away from central line). |
Metallic lead heating
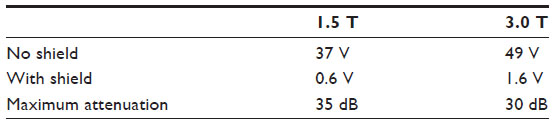
As shown in Figure 6, the shield suppressed RF heating in the metallic leads at both 1.5 T and 3.0 T. Without the shield, maximal temperature increases of about 4.5°C at 1.5 T and 3°C at 3.0 T were measured at 1.5 T and 3.0 T. With the added protection of the RF shield, heating was reduced to about 0.2°C at 1.5 T and 0.5°C at 3.0 T. Notably, the metallic leads near the edges of the phantom and correspondingly closer to the bore wall demonstrated greater heating than the center wire.
 | Figure 6 RF heating of metallic leads submerged in the ASTM head-and-torso phantom with and without the RF shield wrapped around the phantom and enclosing the leads: (A) 1.5 T and (B) 3.0 T. |
Changes in TG caused by the RF shield
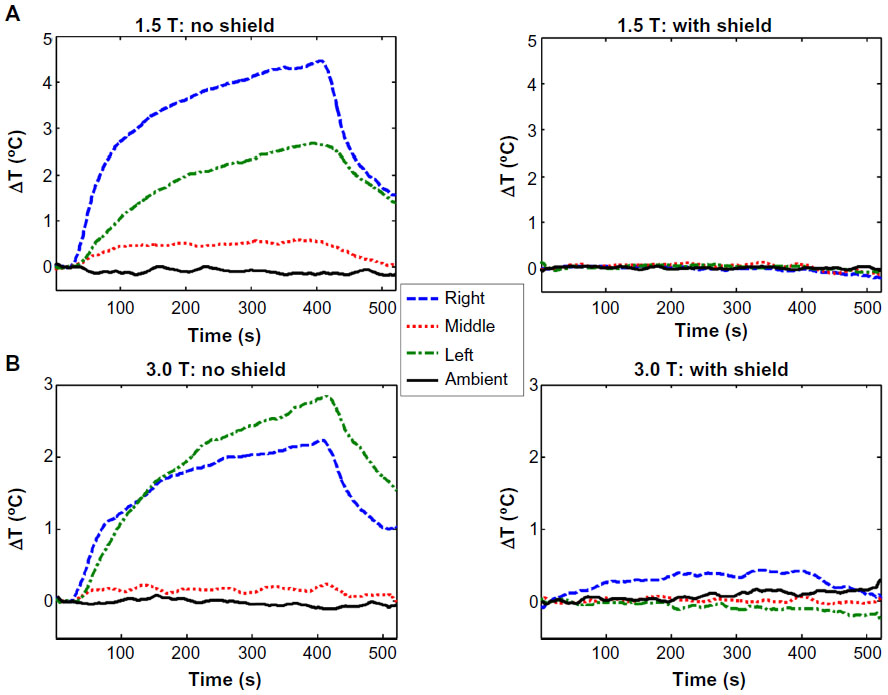
Figure 7 shows changes in how the scanner calibrates TG caused by introduction of the RF shield into the scanner bore. Consistent with the pick-up coil measurements (see section on RF field measurements) these changes vary as a function of slice position relative to the superior edge of the shield. Initially, with the slice position immediately adjacent to the edge, the TG values increase slightly as compared with the same slice position with the shield absent. However, as the slice position is prescribed farther away from the edge, the calibrated TG values decrease. Figure 7 also displays the expected TG changes as estimated from the pick-up coil measurements. These values were estimated as follows:, where and correspond to the changes in RF power along the z-axis and shield wall as measured with the pick-up coils. The estimated changes in TG trend well with the actual TG values established during the auto-prescan routine.
 | Figure 7 Changes in auto-prescan TG caused by placing the RF shield inside the scanner versus the distance, along the scanner’s long axis, between the prescribed scan location (axial slice) and the shield’s edge, for (A) 1.5 T and (B) 3.0 T. |
Heating of the surface of the RF shield
During execution of the 4-echo spin echo pulse sequence, the temperature increases of the shield’s exterior surface at thermal probe locations rose maximally by 2.9°C at 1.5 T and 2.3°C at 3.0 T, as shown in Figure 8. The most rapid heating occurred during the earliest portion of the scan.
 | Figure 8 RF heating of the shield’s surface caused by magnetic resonance imaging at (A) 1.5 T and (B) 3.0 T. |
Discussion
The results demonstrate the Accusorb MRI RF shield efficiently attenuates RF radiation within the volume enclosed by its boundaries. When the shield is formed into a cylindrical tube, the attenuation data show that within the central volume enclosed by the shield (±18 cm from center), RF power is reduced by at least 20 dB at 1.5 T and 17 dB at 3.0 T. As a result, the effective local specific absorption rate levels inside the RF shield are less than 1% (1.5 T) and 2% (3.0 T) of those without the shield.
Due to the presence of the shield, the RF field is redistributed inside the scanner bore. We found RF power increases maximally by approximately 1 dB (Figure 5) just outside the shield’s edges. When the imaging location is prescribed in the affected region just outside the shield’s edge, these particular scanners adjusted output power during its auto-prescan routine to compensate for these local RF field changes. The pick-up coil measurements were corroborated by the compensatory changes in TG values in the presence of the shield. With the imaging slice positioned near the superior edge of the shield, the required TG reduces by as much as 0.5 dB at 1.5 T and as much as 1 dB at 3 T. These results suggest the scanner compensates with lower RF power output to account for the redistributed RF field in these regions. Consequently, if the imaging slice (or the center slice of a multislice image stack) is prescribed 10 cm from the shield edge, the scanner will compensate for the increases in RF power in this region by lowering its output power (see Figure 7). However, if the slice is prescribed immediately adjacent to the shield edge (a clinically unlikely scenario), the scanner will compensate by increasing its output power.
Using the RF shield, there was very minimal heating in the metallic leads. In these experiments, the wire leads were 40 cm in length, and therefore extended just beyond the most protective 36 cm long central region of the RF shield. It is therefore reasonable to expect greater suppression of RF heating if a larger shield is used or if the metallic leads are shorter.
In general, many factors can affect RF heating of wire leads: wire length and diameter, thickness of insulation, orientation, position (in the bore and the phantom), shape of the phantom, and a host of scan parameters and potential physiological factors.15,16 The tested wire configuration was used to further validate the RF attenuation data and was not optimized for maximum RF heating. This, however, represents a limitation of our RF heating tests. The heating in the center wire was negligible, even without the protection of the RF shield, because the wire was placed near the isocenter at a virtual ground plane, which precluded eddy current induction and the resulting ohmic heating. An important aspect of this experiment is that the wires were entirely contained within the shield. More investigations will be necessary to gauge temperature suppression for alternative configurations, including one that maximizes RF heating in the absence of the RF shield.
Similarly, we did not perform RF heating measurements with leads present in regions near the edge outside of the shield. Our RF power measurements show that the RF power is increased by as much as 26% in these regions, which would increase heating if wires extend this far. For thorough evaluation of the shield’s ability to prevent RF heating in metallic leads, more experiments with different lead-shield configurations should be investigated. Further simulations, once validated by corresponding experimental measurements, would play an important role in investigating an exhaustive set of lead-shield configurations, similar to the current approach for safety testing devices.4 However, this is beyond the scope of this paper.
Additionally, the exterior surfaces of the shield do not display large increases in temperature. In the tested configuration, the modest surface temperature rise of less than 3°C would not pose a safety risk to patients. Moreover, surface fans (which were not used during these experiments) are routinely used to blow cooling air over the patient and this process would be expected to cool the shield as well.
Conclusion
The results from the described experiments indicate that the Accusorb MRI RF shield effectively attenuates RF radiation within its boundaries when it is placed inside the scanner bore, both at 1.5 T and 3.0 T field strengths. This attenuation, however, is accompanied by measurable increases in the RF power near the outside edges of the shield. The significant RF attenuation within the volume enclosed by the shield suggests that it is capable of satisfying the technical claims of the manufacturer; however, increased RF power near the shield ends should be carefully noted, and the extent and magnitude of this effect could perhaps vary between particular scanner models from different vendors. As a result of its RF-attenuating properties, the shield is a capable tool to prevent RF heating in metallic leads, when the leads are carefully encompassed within the shield’s volume. Our results show significant reduction in RF field amplitude within the RF shield using geometry and configuration designed to mimic patient care situations. These data represent the first experimental measurements documenting the effectiveness of an RF shield at 1.5 T and 3.0 T.
Disclosure
The authors have no conflicts of interest to disclose and have no relationship with the vendor of the RF shield investigated (Accusorb MRI) or any other manufacturer of RF shielding devices.
References
AccusorbMRI (homepage on the Internet). Available from: http://www.accusorb.com/index.html. Accessed August 25, 2014. | |
Inman DM, Maschino SE. RF shielding in MRI for safety of implantable medical devices. 2008. Available from: http://www.google.com/patents/US20080023010. Accessed March 12, 2014. | |
Dörr T, Weiss I. Shielding apparatus and shielding structures for magnetic resonance imaging and method for operating a magnetic resonance imaging scanner. 2012. Available from: http://www.google.com/patents/EP2446923A1?cl=en. Accessed March 12, 2014. | |
Wilkoff BL, Albert T, Lazebnik M, et al. Safe magnetic resonance imaging scanning of patients with cardiac rhythm devices: a role for computer modeling. Heart Rhythm. 2013;10(12):1815–1821. | |
Liu Y, Shen J, Kainz W, Qian S, Wu W, Chen J. Numerical investigations of MRI RF field induced heating for external fixation devices. Biomed Eng Online. 2013;12(1):12. | |
Gorny KR, Presti MF, Goerss SJ, et al. Measurements of RF heating during 3.0-T MRI of a pig implanted with deep brain stimulator. Magn Reson Imaging. 2013;31(5):783–788. | |
Gorny KR, Bernstein MA, Felmlee JP, et al. Calorimetric calibration of head coil SAR estimates displayed on a clinical MR scanner. Phys Med Biol. 2008;53(10):2565–2576. | |
Gorny KR, Bernstein MA, Watson RE. 3 Tesla MRI of patients with a vagus nerve stimulator: initial experience using a T/R head coil under controlled conditions. J Magn Reson Imaging. 2010;31(2):475–481. | |
Qian D, El-Sharkawy A-MM, Bottomley PA, Edelstein WA. An RF dosimeter for independent SAR measurement in MRI scanners. Med Phys. 2013;40(12):122303. | |
Nehrke K, Börnert P. DREAM – a novel approach for robust, ultrafast, multislice B(1) mapping. Magn Reson Med. 2012;68(5):1517–1526. | |
Sled JG, Pike GB. Standing-wave and RF penetration artifacts caused by elliptic geometry: an electrodynamic analysis of MRI. IEEE Trans Med Imaging. 1998;17(4):653–662. | |
Fleysher R, Fleysher L, Inglese M, Sodickson D. TROMBONE: T1-relaxation-oblivious mapping of transmit radio-frequency field (B1) for MRI at high magnetic fields. Magn Reson Med. 2011;66(2):483–491. | |
Gilbert KM, Scholl TJ, Chronik BA. RF coil loading measurements between 1 and 50 MHz to guide field-cycled MRI system design. Concepts Magn Reson Part B Magn Reson Eng. 2008;33B(3):177–1191. | |
ASTM F2182-11. Standard test method for measurement of radio frequency induced heating on or near passive implants during magnetic resonance. Available from: http://www.astm.org/Standards/F2182.htm. Accessed August 25, 2014. | |
Mattei E, Triventi M, Calcagnini G, et al. Complexity of MRI induced heating on metallic leads: experimental measurements of 374 configurations. Biomed Eng Online. 2008;7:11. | |
Armenean C, Perrin E, Armenean M, Beuf O, Pilleul F, Saint-Jalmes H. RF-induced temperature elevation along metallic wires in clinical magnetic resonance imaging: influence of diameter and length. Magn Reson Med. 2004;52(5):1200–1206. |
 © 2014 The Author(s). This work is published and licensed by Dove Medical Press Limited. The full terms of this license are available at https://www.dovepress.com/terms.php and incorporate the Creative Commons Attribution - Non Commercial (unported, v3.0) License.
By accessing the work you hereby accept the Terms. Non-commercial uses of the work are permitted without any further permission from Dove Medical Press Limited, provided the work is properly attributed. For permission for commercial use of this work, please see paragraphs 4.2 and 5 of our Terms.
© 2014 The Author(s). This work is published and licensed by Dove Medical Press Limited. The full terms of this license are available at https://www.dovepress.com/terms.php and incorporate the Creative Commons Attribution - Non Commercial (unported, v3.0) License.
By accessing the work you hereby accept the Terms. Non-commercial uses of the work are permitted without any further permission from Dove Medical Press Limited, provided the work is properly attributed. For permission for commercial use of this work, please see paragraphs 4.2 and 5 of our Terms.