Back to Journals » Diabetes, Metabolic Syndrome and Obesity » Volume 14
Urine Uric Acid Excretion Levels are Positively Associated with Obesity and Abdominal Obesity in Type 2 Diabetes Patients without Chronic Kidney Disease
Authors Liu F, Chen S, Zhao W, Chen M, Ke J, Zhang Z ![]() , Lu J, Li L
, Lu J, Li L ![]()
Received 23 August 2021
Accepted for publication 16 November 2021
Published 1 December 2021 Volume 2021:14 Pages 4691—4703
DOI https://doi.org/10.2147/DMSO.S335558
Checked for plagiarism Yes
Review by Single anonymous peer review
Peer reviewer comments 3
Editor who approved publication: Professor Ming-Hui Zou
Fengjing Liu, Si Chen, Weijing Zhao, Mingyun Chen, Jiangfeng Ke, Zhihui Zhang, Junxi Lu, Lianxi Li
Department of Endocrinology and Metabolism, Shanghai Jiao Tong University Affiliated Sixth People’s Hospital, Shanghai Clinical Center for Diabetes, Shanghai Diabetes Institute, Shanghai Key Laboratory of Diabetes Mellitus, Shanghai Key Clinical Center for Metabolic Disease, Shanghai, People’s Republic of China
Correspondence: Lianxi Li
Department of Endocrinology and Metabolism, Shanghai Jiao Tong University Affiliated Sixth People’s Hospital, 600 Yishan Road, Shanghai, 200233, People’s Republic of China
Tel +86 21 64369181x58337
Email [email protected]
Purpose: We aimed to investigate whether urine uric acid excretion (UUAE) levels are associated with obesity and abdominal obesity in patients with type 2 diabetes (T2D).
Methods: There were 2785 type 2 diabetic patients in this cross-sectional study. Obesity was defined as BMI ≥ 25 kg/m2, and abdominal obesity was defined as waist circumference (WC) ≥ 90 cm for men and WC ≥ 80 cm for women based on World Health Organization (WHO) recommendations for Asians. Chronic kidney disease (CKD) was defined as the estimated glomerular filtration rate (eGFR) < 60 mL/min/1.73m2 and/or urinary albumin excretion (UAE) ≥ 300 mg/24h. 24-h UUAE was determined enzymatically using a single 24-hour urine collection. All the subjects were stratified into quartiles based on UUAE levels. Both obesity and abdominal obesity were compared among the UUAE quartile groups, respectively. Furthermore, the associations of UUAE with obesity and abdominal obesity were analyzed in both CKD and non-CKD patients, respectively.
Results: There was an obvious increased trend in both obesity prevalence (36.2%, 41.5%, 46.3%, and 63.4%, respectively, p < 0.001 for trend) and abdominal obesity prevalence (58.1%, 61.2%, 64.7%, and 75.8%, respectively, p < 0.001 for trend) in patients with T2D across the UUAE quartiles after controlling for age, sex and diabetes duration. Multiple logistic regression analyses revealed independent associations between UUAE quartiles and obesity (p < 0.001) and abdominal obesity (p < 0.001) in all patients. However, UUAE was significantly associated with obesity and abdominal obesity only in the T2D patients without CKD (p < 0.001 in model 1, model 2, model 3 and model 4, respectively).
Conclusion: Increased UUAE levels were significantly associated with the presence of obesity, especially abdominal obesity in T2D patients without CKD.
Keywords: urine uric acid excretion, type 2 diabetes, obesity, abdominal obesity, chronic kidney disease
Introduction
With the rapid development of the economy, the prevalence of obesity around the world continues to rise, putting not only normal people but also patients with diabetes at risk of metabolic syndrome. When serum uric acid (SUA) as a metabolite of purine exceeds 420 umol/L, hyperuricemia occurs. More and more clinical studies have shown that hyperuricemia may be a predictor of many metabolic disorders, such as type 2 diabetes (T2D),1 hypertension,2,3 obesity,4–6 metabolic syndrome,7–10 and obesity-related fatty liver.11,12
Over the past ten years, epidemiological and clinical studies have shown that SUA levels are strongly correlated with obesity.4–6 A longitudinal population-based epidemiological study showed that high SUA levels increase the risk of obesity.6 Some reports have also manifested that body mass index (BMI) is strongly positively correlated with SUA.13 Furthermore, weight loss from bariatric surgery is associated with reduced incidence of hyperuricemia and gout.14 A previous study also demonstrated a decrease in SUA levels in overweight patients receiving either weight loss from a low-energy diet or an insulin-sensitizing agent.15 Likewise, a recent study by our team also found that SUA levels were markedly associated with obesity in T2D.4 Overall, these studies have consistently demonstrated that elevated SUA levels are clearly associated with obesity in both healthy and diabetic populations.
Urine uric acid test is a non-invasive examination. Increased SUA levels usually accompany increased levels of uric acid in the urine. Although various studies have explored the relationship between SUA and obesity, there was a lack of data on the relationship between urine uric acid excretion (UUAE) and obesity in both healthy and clinical populations. Recently, a few studies investigated the association of UUAE with metabolic disorders such as diabetes16 and uric acid stone.17 Our recent studies also found that UUAE was independently associated with chronic kidney disease (CKD),18 diabetic retinopathy (DR),19 and NAFLD in hospitalized patients with T2D.20 However, to date, the relationship between UUAE and obesity, including abdominal obesity, has not been investigated in both general and diabetic populations.
Therefore, our primary aim is to explore the association between UUAE and obesity and abdominal obesity in Chinese inpatients with T2D. As far as we know, this is the first study specifically to evaluate the association between UUAE and obesity in T2D.
Methods
Study Design and Population
This was a cross-sectional study. The study protocol was approved by the ethics committee of Shanghai Jiao Tong University Affiliated Sixth People’s Hospital and in accordance with the Declaration of Helsinki. Written informed consent was obtained from all subjects. The anonymity of all the patients was preserved.
A total of 3598 inpatients with type 2 diabetes from hospitalized patients in the department of Endocrinology and Metabolism of Shanghai Jiao Tong University Affiliated Sixth People’s Hospital from January 2007 to June 2009 were consecutively observed. Exclusion criteria included: those taking any drug that might affect uric acid metabolism, such as losartan, allopurinol, benzbromarone and furosemide; the patients who had extreme outliers, and the patients without complete clinical data such as UUAE, height, weight, and waist circumference et al. Eventually, 2785 patients were included in the final analysis (Figure 1). All patients received a low-purine diabetic diet.
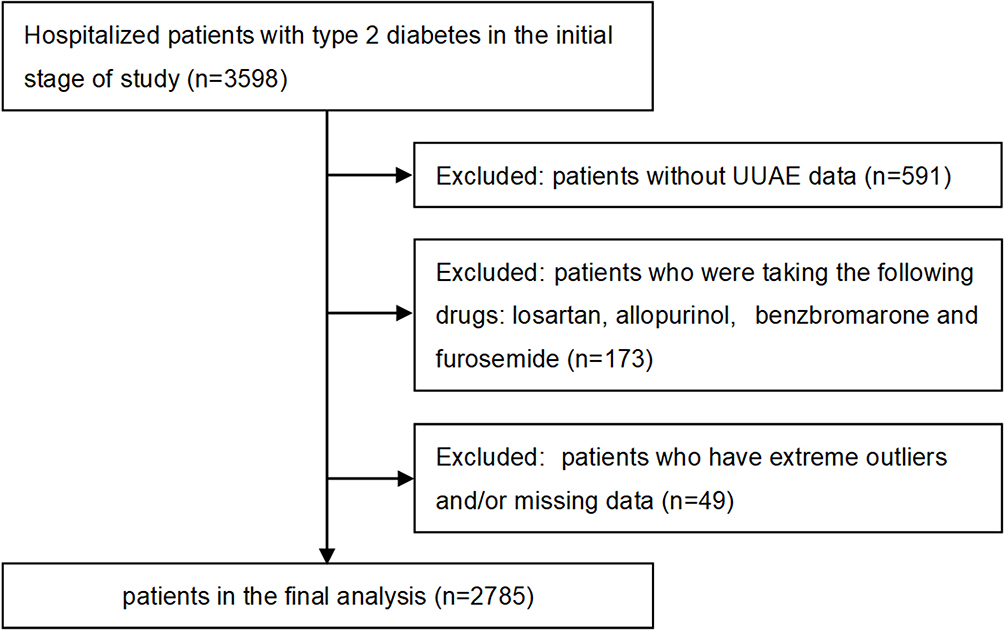 |
Figure 1 Flowchart for inclusion of participants. |
Diagnostic Criteria
T2D was diagnosed according to the 1999 World Health Organization (WHO) criteria. Obesity was defined as BMI≥25 kg/m2 based on the Asia-Pacific criteria set by the WHO.21,22 Mild obesity was defined as a BMI of 25–30 kg/m2, moderate obesity as a BMI of 30–35 kg/m2, and severe obesity as BMI above 35 kg/m2.4 Abdominal obesity was defined as a waist circumference of ≥90 cm for men and ≥80 cm for women based on the WHO recommendations for Asians.22 Mild abdominal obesity was defined as a WC value of 90–100 cm for men and 80–90 cm for women, moderate abdominal obesity as 100–110 cm for men and 90–100 cm for women, severe abdominal obesity as ≥110 cm for men and ≥100 cm for women. According to our previous studies,18 CKD was defined as the estimated glomerular filtration rate (eGFR, as calculated by MDRD formula) <60 mL/min/1.73m2 and/or a Urinary albumin excretion (UAE)≥300mg/24h.
Physical Examination and Laboratory Measurements
All subjects were consulted by physicians and gave a history of diabetes and hypertension (HTN) and medications including lipid-lowering drugs (LLDs), antihypertensive agents (AHAs), insulin or insulin analogues (IIAs), and oral hypoglycaemic drugs, such as metformin, sulfonylureas (SUs), glycosidase inhibitors (GIs), thiazolidinediones (TZDs), as well as alcohol consumption and smoking habits. Smoking status was defined as current smoking or not smoking.
Physical examinations included weight, height, waist circumference, hip circumference, and blood pressure. Body weight was measured in light clothing without shoes to the nearest half kilogram. Height, waist and hip circumference were measured to the nearest half centimeter. Body mass index (BMI) was calculated as body mass/height2 (kg/m2). Waist–hip ratio was calculated as the ratio of waist-to-hip circumference (cm). Blood pressure was measured by a physician using a standard mercury sphygmomanometer after the subject had been seated for at least 10 minutes.
Venous blood samples were drawn after an overnight fast and 2 h after breakfast. We obtained a single 24-hour urine collection from the participants to assess UUAE. The laboratory evaluations included: (1) diabetes evaluation index: fasting plasma glucose (FPG), 2-hour postprandial plasma glucose (2h PPG), fasting C-peptide (FCP), 2-hour postprandial C-peptide (2 h PCP) and glycosylated hemoglobin A1C (HbA1C); (2) routine laboratory tests for liver function, renal function and blood lipids; (3) serum inflammation index: white blood cell count (WBCC) and C-reactive protein (CRP); (4) Urine uric acid excretion (UUAE) and urinary albumin excretion (UAE).
Statistical Analysis
Statistical analysis was performed using SPSS software for Windows (SPSS Statistics Version 23.0, SPSS Inc). Quantitative data were showed as mean ± standard deviation (SD) or expressed as medians (interquartile range). Qualitative variables were expressed as percentage. One-way analysis of variance (ANOVA) with Least Significant Difference (LSD) was used to compare normally distributed continuous variables. The Kruskal–Wallis H-test or Mann–Whitney U-test were used for continuous variables not distributed normally. The prevalence data was analyzed by the chi-square test. Both binary logistic and general linear regressions with stepwise backwards variable selection were applied to compare differences in the variables while controlling for other factors. A 2-sided p < 0.05 was considered to be statistically significant.
Results
Characteristics of the Enrolled Patients
A total of 2785 type 2 diabetic patients were analyzed in our study. According to 24-h UUAE, we divided all subjects into four groups: <2211, 2211–2841, 2842–3591, and >3591umol/24h. Table 1 compares the characteristics of the enrolled patients in different groups.
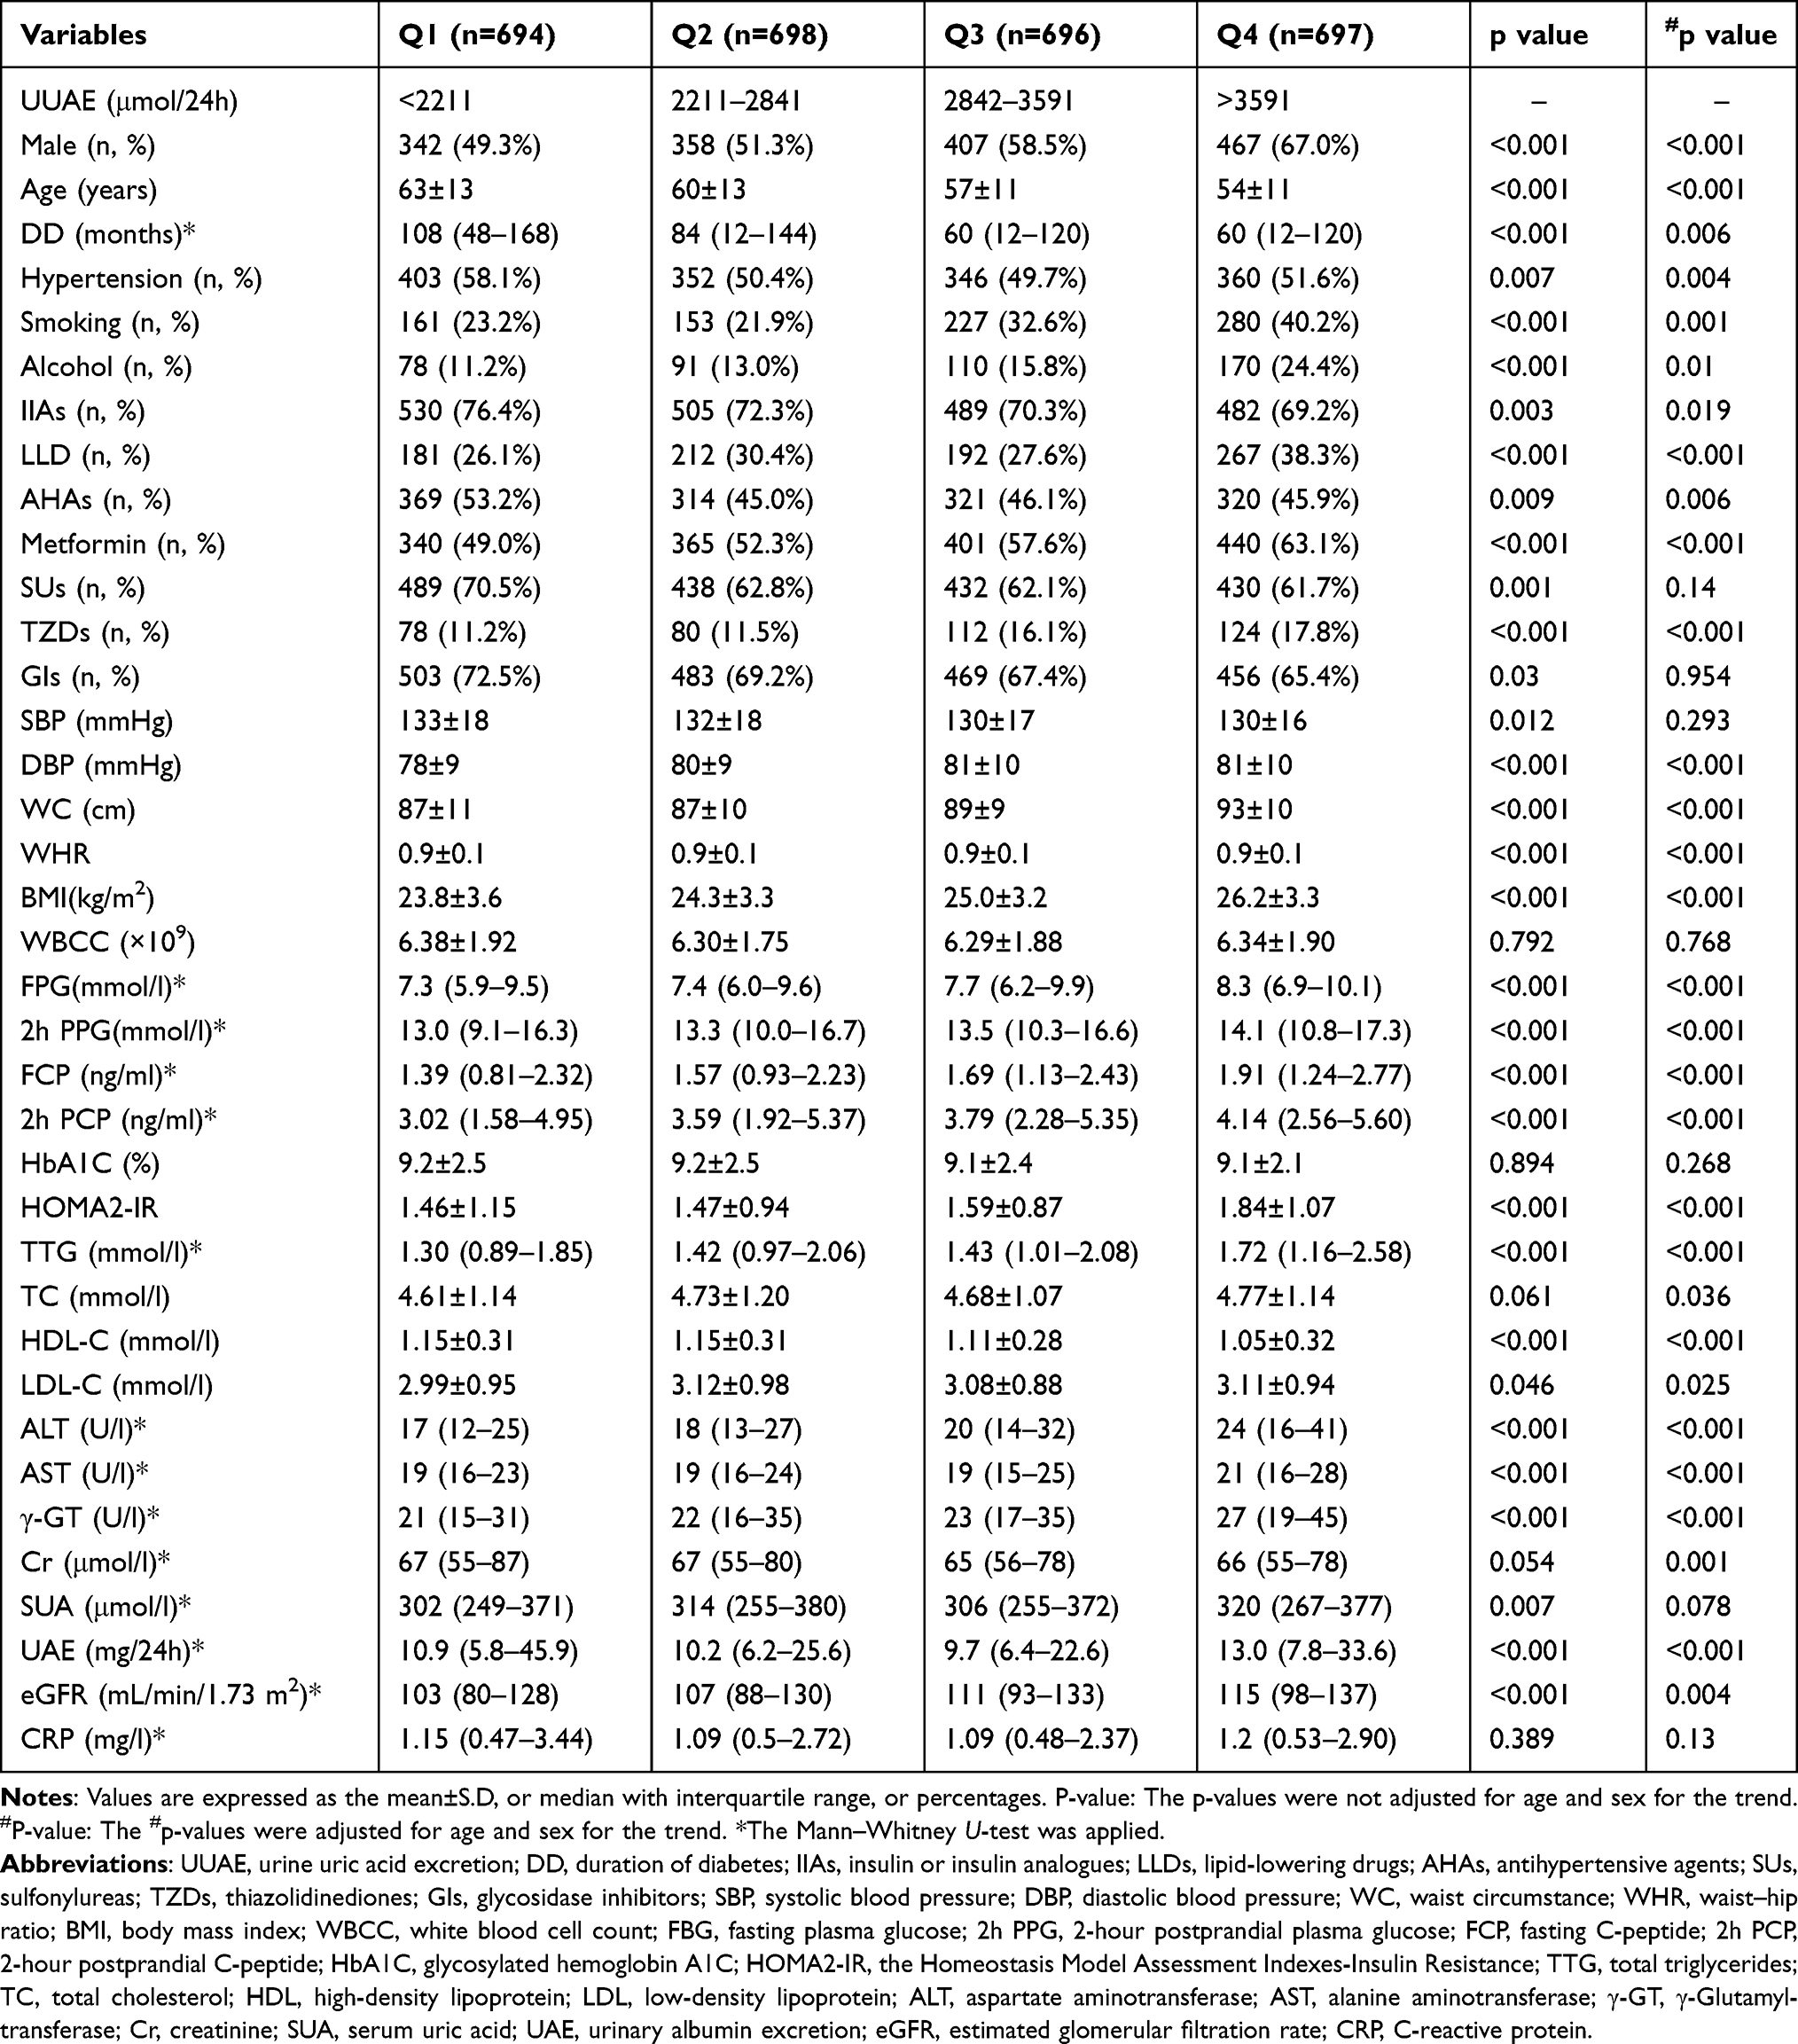 |
Table 1 Characteristics of the Patients According to UUAE Quartiles |
Whether adjusted for age and sex or not, the patients with T2D in the higher UUAE quartiles were more likely to be male, younger, smoker and drinker; have shorter DD; and have a lower percentage of HTN. In terms of therapeutic medication, the patients with T2D in the higher UUAE quartiles had higher percentage use of LLDs and metformin and TZDs; have lower percentage use of IIAs and AHAs. In terms of laboratory measurement, the higher UUAE was accompanied by the higher DBP, WC, BMI, FPG, 2 h PPG, FCP, 2 h PCP, HOMA2-IR, TTG, LDL-C, ALT, AST, γ-GT, UAE, and eGFR; and the lower HDL-C. There was no significant difference among groups in WBCC, CRP, Cr, TC, and HbA1C.
Table 2 shows the comparison of characteristics between men and women subjects. Whether adjusted for age or not, UUAE in male patients was significantly higher than that in female patients. Moreover, male patients had significantly higher Cr, SUA, HbA1C, WC, ALT, γ-GT, and WBCC than female patients; significantly lower cholesterol level, FCP and 2 h PCP. However, there was no significant difference in BMI and eGFR and DBP, FPG, 2 h PPG, UAE, AST and HOMA2-IR between sexes. Compared to female subjects, the male patients were more likely to be younger, smoker and drinker; have shorter DD; and have a lower percentage of HTN. In terms of therapeutic medication, the male patients had lower percentage use of SUs and AHAs and GIs; have no significant difference in use of IIAs, LLD, metformin, TZDs and AHAs.
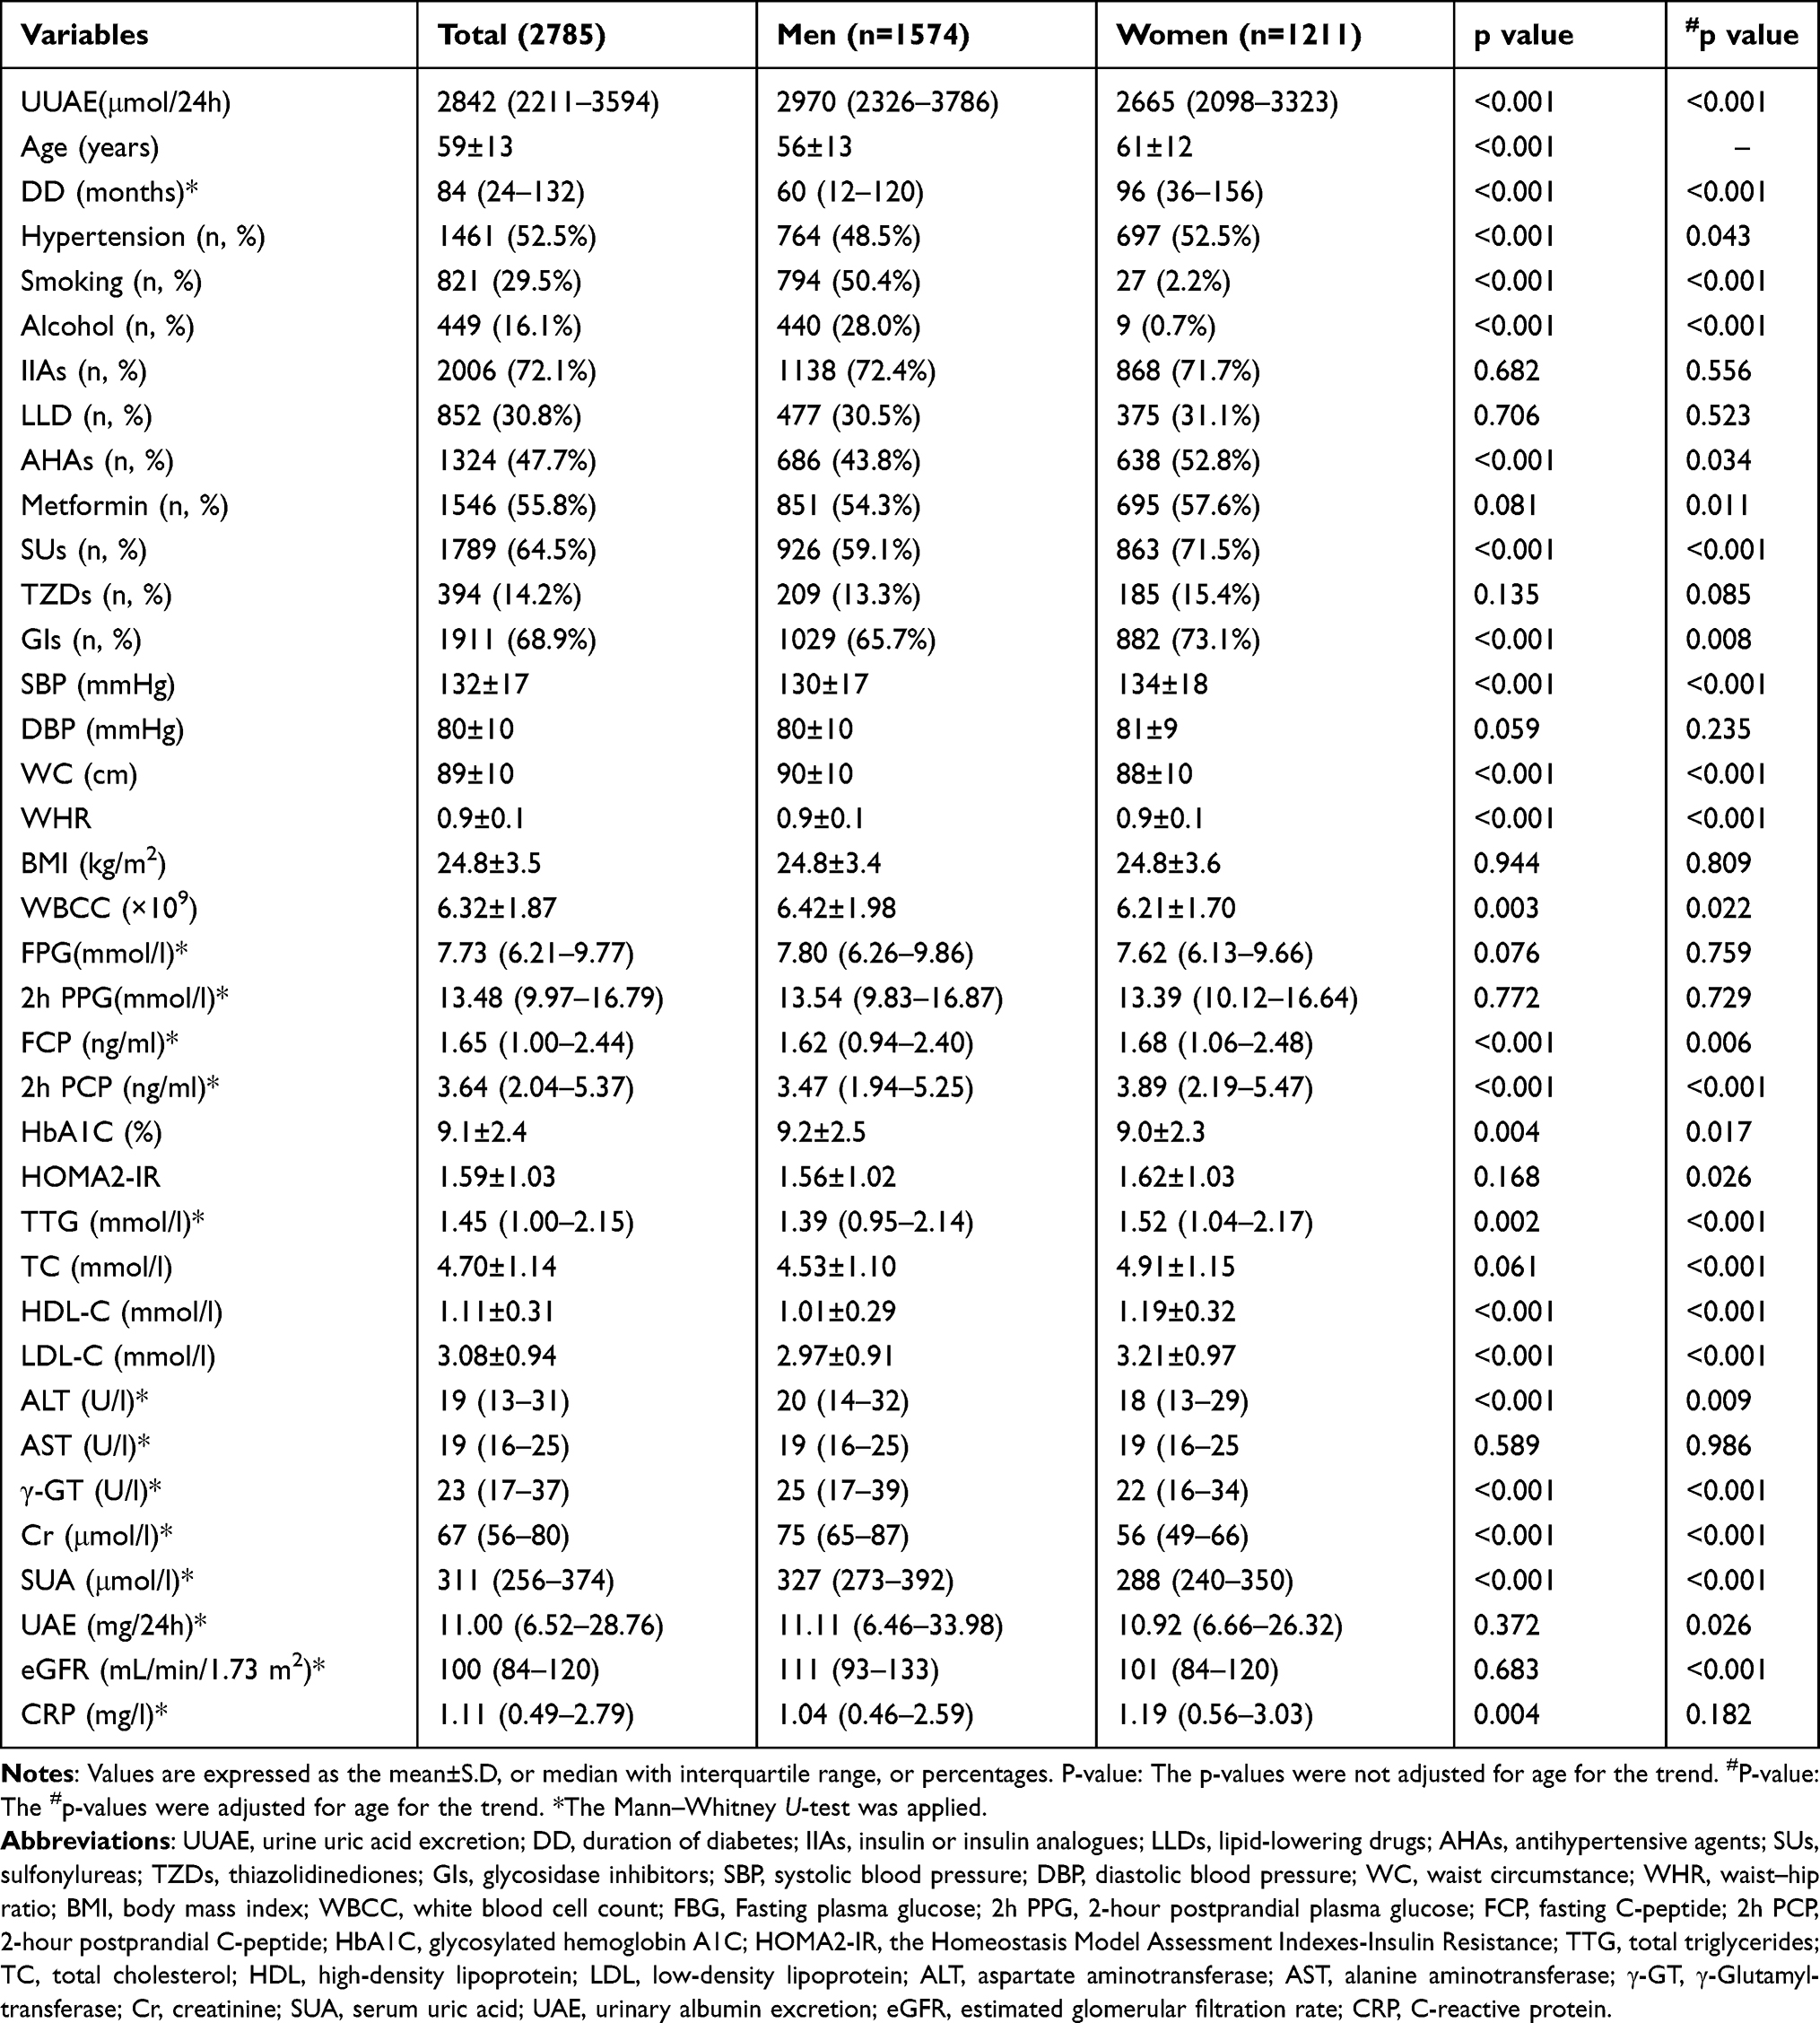 |
Table 2 Comparison of Characteristics Between Men and Women Subjects |
Prevalence of Obesity and Abdominal Obesity in T2D Patients
According to the diagnostic criteria of obesity and abdominal obesity, the prevalence of obesity and abdominal obesity in T2D is shown in Figure 2. The prevalence of obesity was 46.4% in the female, 47.2% in the male, and 46.9% in the total subjects, respectively (Figure 2A). The prevalence of abdominal obesity was 79.8% in the female, 53.5% in the male, and 64.9% in all subjects, respectively (Figure 2B). The prevalence of abdominal obesity in female patients was significantly higher than that in male patients (p < 0.001, Figure 2B). However, there was no significant difference in the prevalence of obesity in patients between the sexes. The prevalence of obesity had no significant association with age and DD in T2D (Figure 2C and E). However, the prevalence of abdominal obesity clearly increased with increased age in T2D patients (p = 0.038, Figure 2D) but was not related to the DD (Figure 2D and F).
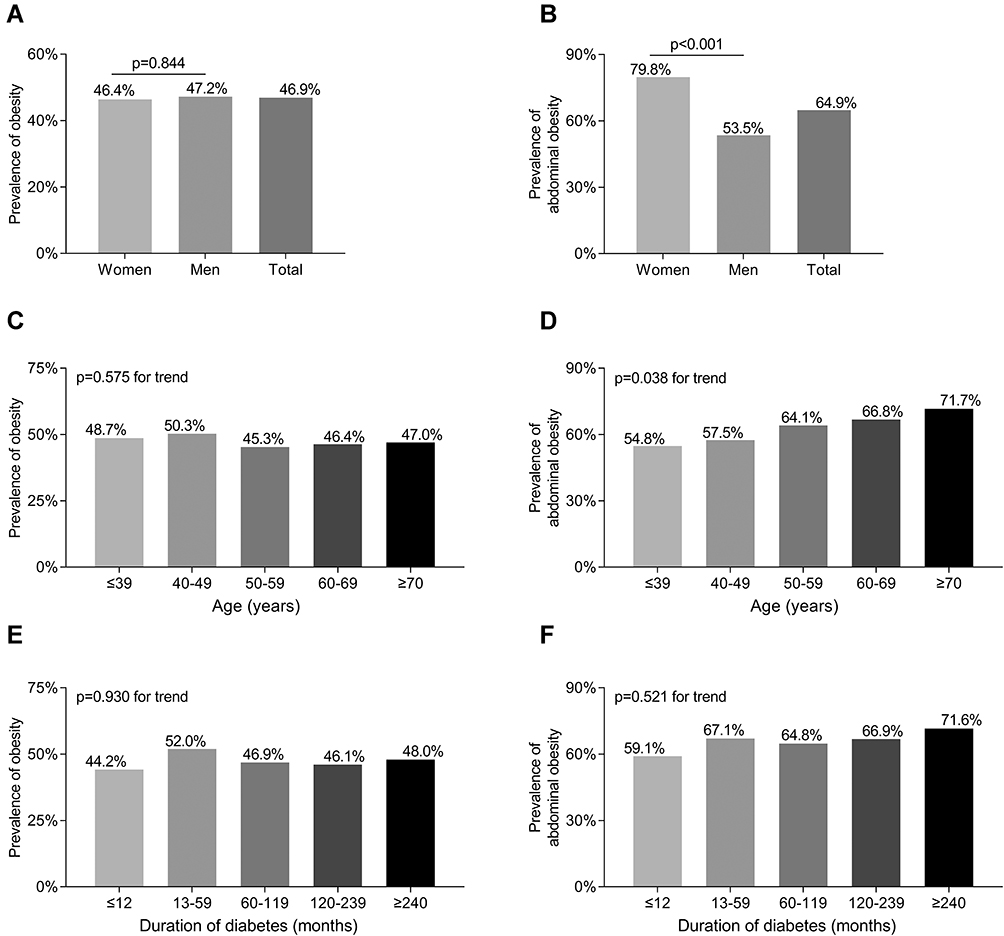 |
Figure 2 Prevalence of obesity in T2D. (A) Comparison of the obesity prevalence between men and women with T2D after adjusting for age and DD. (B) Prevalence of abdominal obesity prevalence between men and women with T2D after adjusting for age and DD. (C) Prevalence of obesity stratified by age in T2D. (D) Prevalence of abdominal obesity stratified by age in T2D. (E) Prevalence of obesity stratified by DD in T2D. (F) Prevalence of abdominal obesity stratified by DD in T2D. |
Comparisons of Obesity and Abdominal Obesity Prevalence Among the UUAE Quartiles
The prevalence of obesity and abdominal obesity among the UUAE quartiles are shown in Figure 3. After adjusting for age, sex, and DD, there was a significantly increased trend in the prevalence of obesity and abdominal obesity across the UUAE quartiles (36.2%, 41.5%, 46.3%, and 63.4% for obesity prevalence, respectively, p <0.001 for trend; 58.1%, 61.2%, 64.7%, and 75.8% for abdominal obesity prevalence, respectively, p <0.001 for trend) in T2D (Figure 3A and C). Furthermore, the prevalence of moderate-severe obesity and abdominal obesity in the fourth UUAE quartile was obviously higher than in the other three UUAE quartiles (all p < 0.001) (Figure 3B and D).
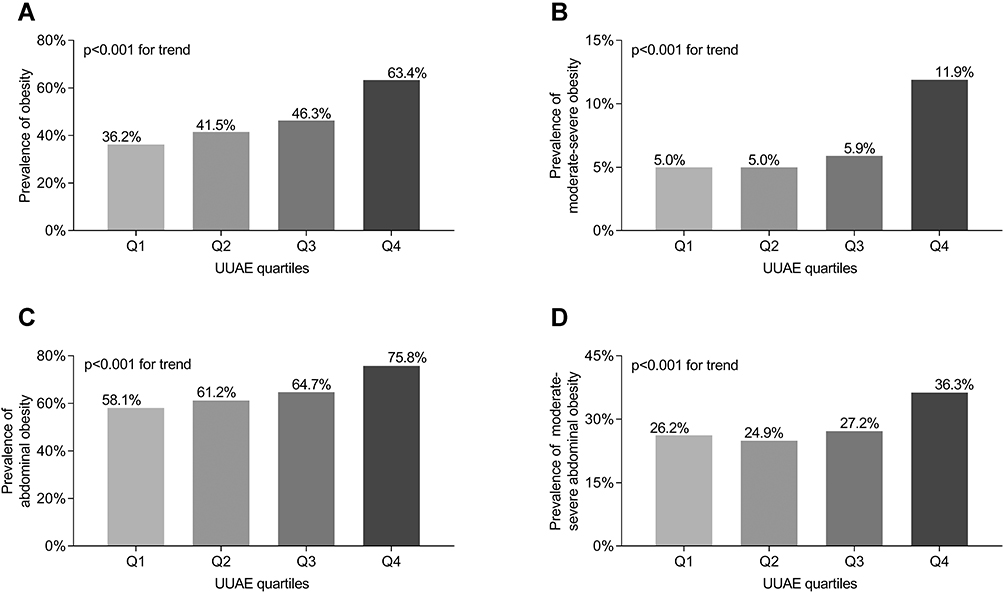 |
Figure 3 Comparisons of obesity prevalence and UUAE levels. (A) Comparison of the prevalence of obesity among the UUAE quartile groups after adjusting for age, sex, and DD. (B) Comparison of the prevalence of moderate-severe obesity among the UUAE quartile groups after adjusting for age, sex, and DD. (C) Comparison of the prevalence of abdominal obesity among the UUAE quartile groups after adjusting for age, sex, and DD. (D) Comparison of the prevalence of moderate-severe abdominal obesity among the UUAE quartile groups after adjusting for age, sex, and DD. |
Comparisons of UUAE Levels Between the Patients with and without Obesity/Abdominal Obesity
Figure 4 shows the difference in UUAE levels between the patients with and without obesity/abdominal obesity. The levels of UUAE were significantly increased in obese patients with T2D compared with those without obesity, and the same was found in abdominal obesity (p < 0.001, Figure 4A and C). In addition, the diabetic patients with moderate-severe obesity or abdominal obesity were more likely to have higher UUAE levels (p < 0.001, Figure 4B and D).
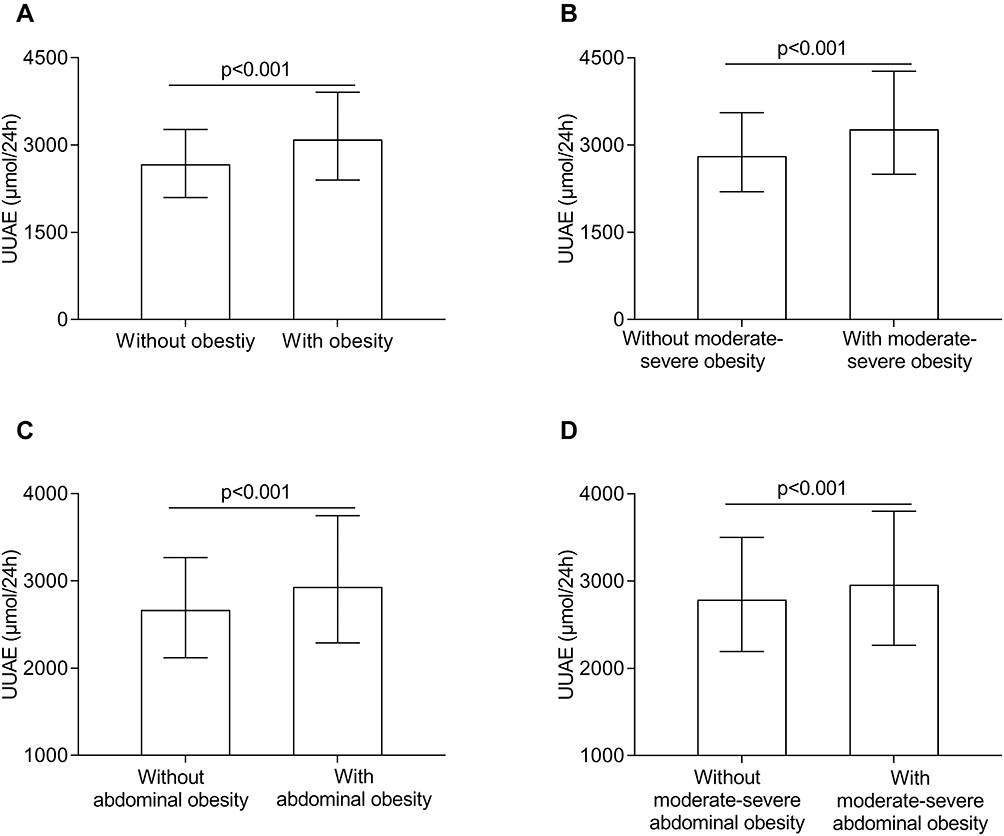 |
Figure 4 Comparisons of UUAE levels. (A) Comparison of UUAE levels between the patients with and without obesity after adjusting for age, sex, and DD. (B) Comparison of UUAE levels between the patients with and without moderate-severe obesity after adjusting for age, sex, and DD. (C) Comparison of UUAE levels between the patients with and without abdominal obesity after adjusting for age, sex, and DD. (D) Comparison of UUAE levels between the patients with and without moderate-severe abdominal obesity after adjusting for age, sex, and DD. |
Associations of UUAE Quartiles with Obesity and Abdominal Obesity
We constructed four models to assess the associations of the UUAE quartiles with obesity and abdominal obesity using multiple logistic regression analyses. Model 1 was the unadjusted model, model 2 adjusted for age, sex, DD, HTN, smoking and alcohol drinking; model 3 further adjusted for DBP, SBP, and the use of LLDs, IIAs, AHAs, metformin, SUs, TZDs, and GIs; and model 4 additional adjusted for laboratory results, including WBCC, CRP, ALT, AST, γ-GT, TC, TTG, HDL-C, LDL-C, HbA1C, FPG, 2 h PPG, FCP, 2 h PCP, Cr, eGFR, SUA, UAE, and HOMA2-IR. Table 3 shows the associations of UUAE quartiles with obesity and abdominal obesity in T2D. Binary logistic regression models showed that UUAE quartiles were independently related to the presence of obesity (model 1, p < 0.001 for trend) and abdominal obesity (model 1, p <0.001 for trend). After further adjusting for other confounders (model 2, model 3, and model 4), UUAE quartiles still had an independent association with obesity (p < 0.001 for trend in model 2, model 3 and model 4, respectively) and abdominal obesity (p < 0.001 for trend in model 2, model 3, and in model 4, respectively).
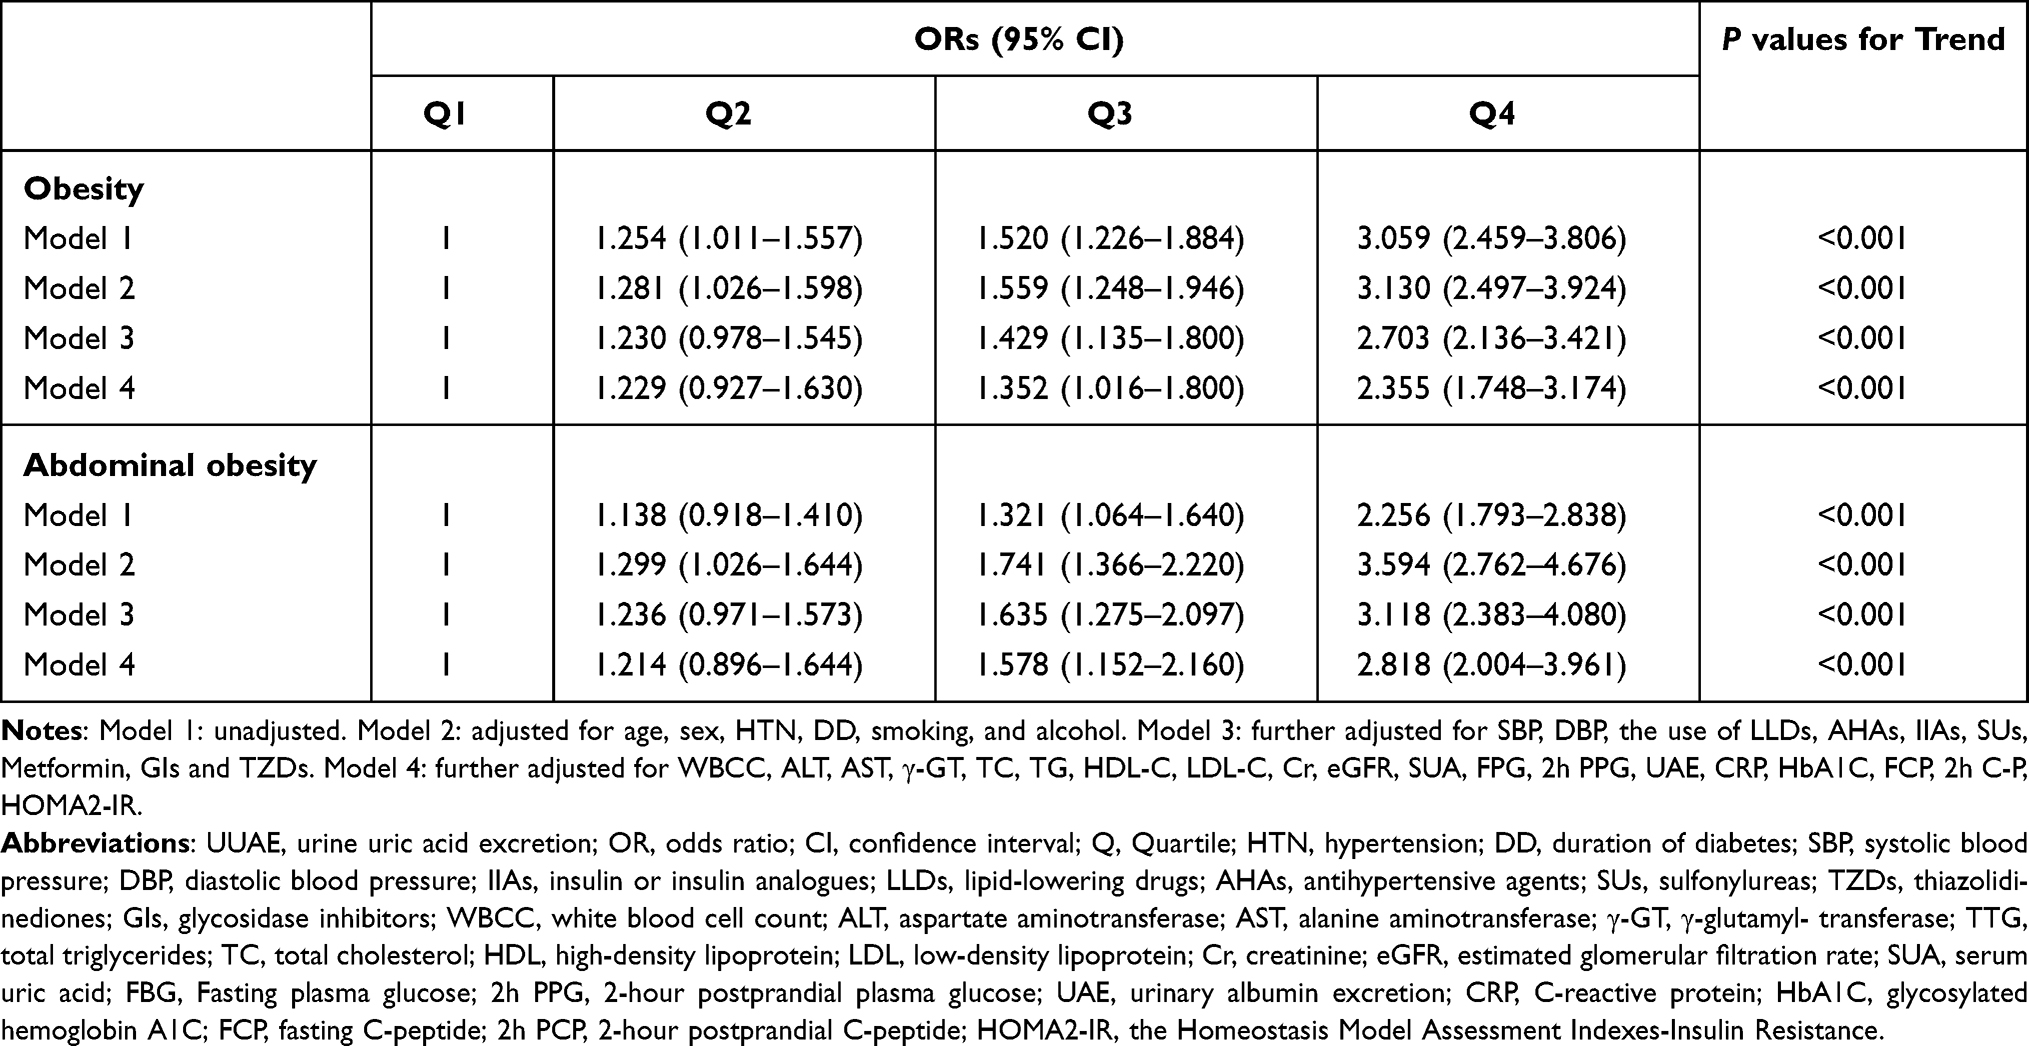 |
Table 3 Association of UUAE Quartiles with Obesity and Abdominal Obesity |
Association of UUAE with Obesity and Abdominal Obesity Among CKD and Non-CKD Patients
To eliminate the influence of CKD on UUAE, we further analyzed the relationship between UUAE and obesity and abdominal obesity in the CKD group and the non-CKD group using the same model above by multiple logistic regression analyses. Table 4 shows the associations of UUAE with obesity and abdominal obesity in T2D with CKD and without CKD. The results showed that UUAE was significantly related to obesity and abdominal obesity only in the non-CKD population (p < 0.001 in model 1, model 2, model 3 and model 4, respectively).
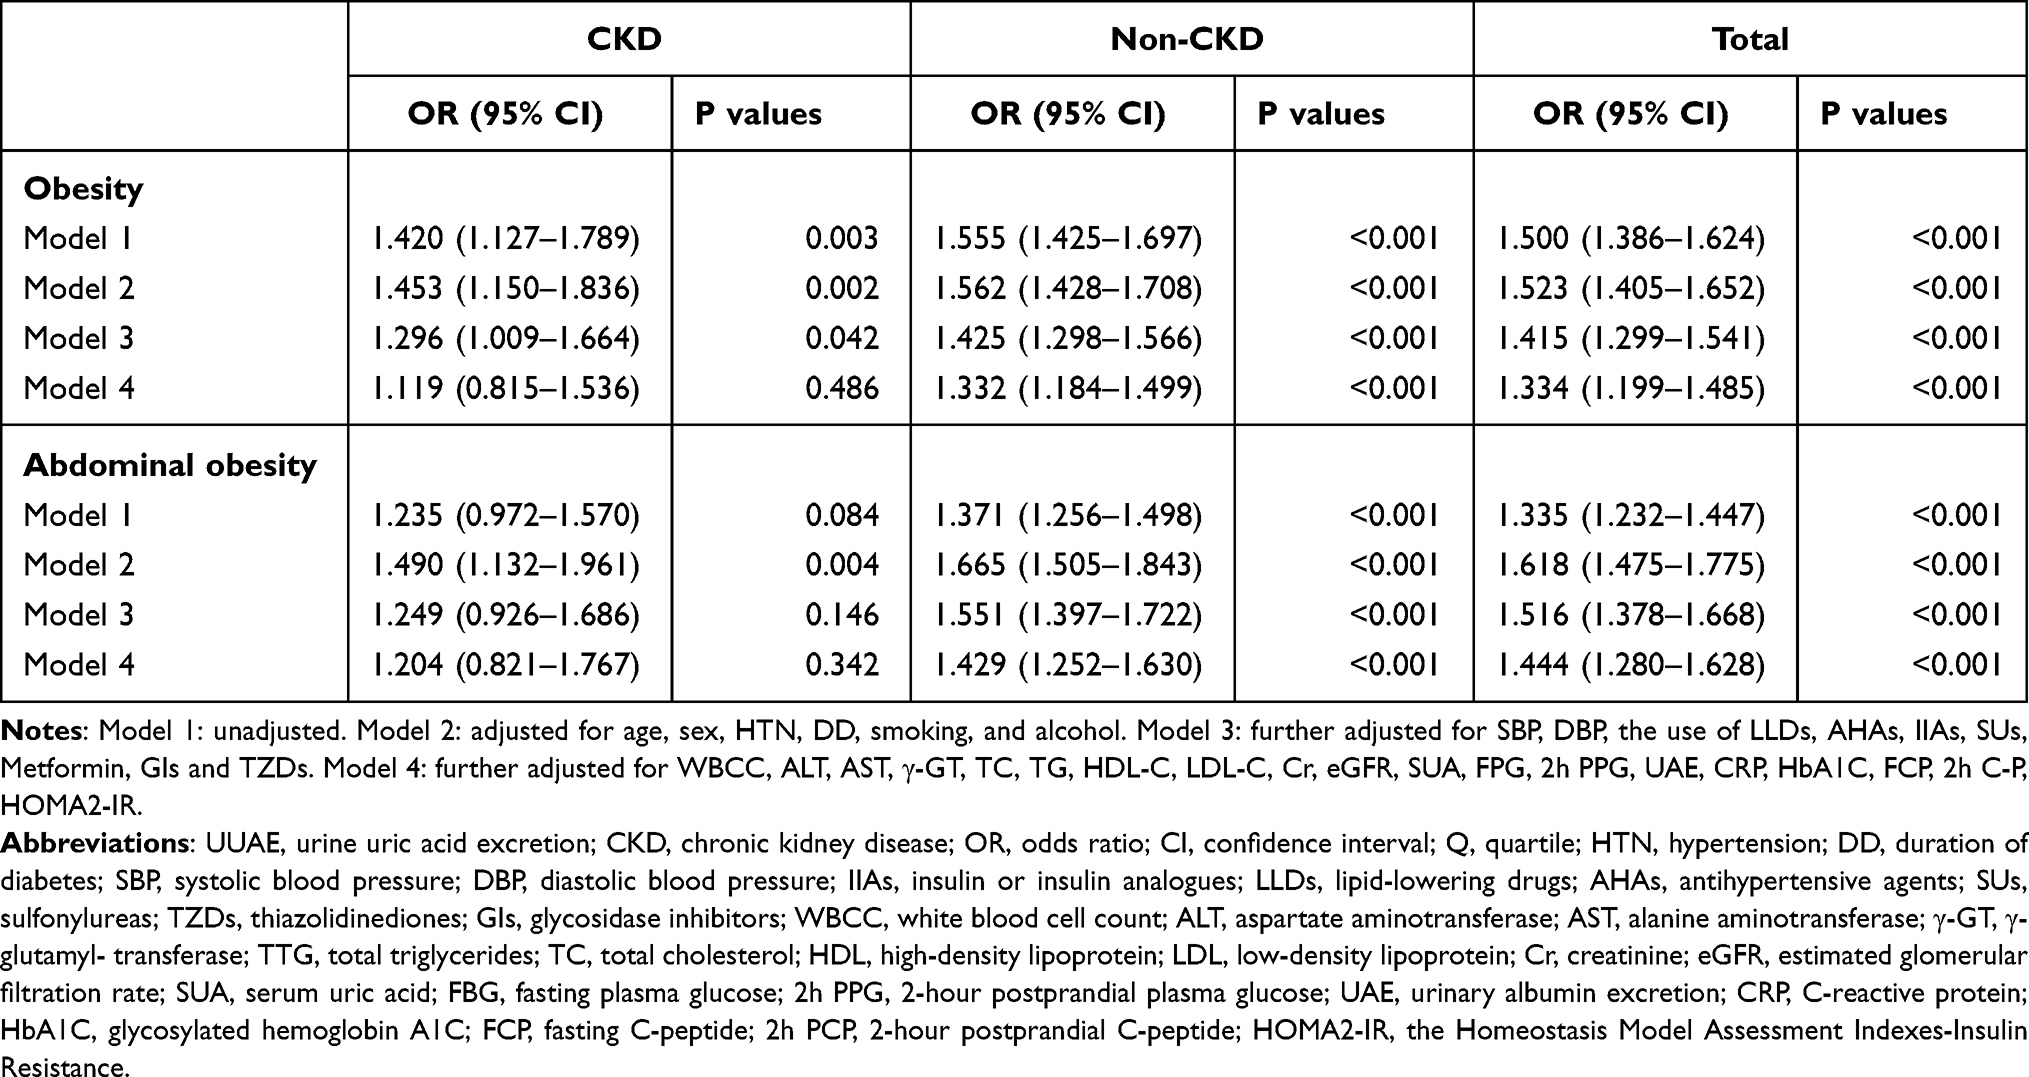 |
Table 4 Association of UUAE with Obesity and Abdominal Obesity Among CKD and Non-CKD Patients |
Discussion
We conducted this cross-sectional study to investigate whether the levels of UUAE are related to obesity in T2D patients. As a matter of fact, we discovered a strong positive association between increased UUAE levels and obesity, especially abdominal obesity in T2D patients. From above results, it is evident that the excretion of uric acid raised markedly in obese patients with T2D compared with patients without obesity. Moreover, the prevalence of obesity and abdominal obesity increased significantly across the UUAE quartiles increase. To the best of our knowledge, the association between UUAE and obesity and diabetes has not been investigated before.
The prevalence of obesity and abdominal obesity in T2D patients reported by different studies was quite different, which was mainly due to differences in study populations and the definition of obesity. In the United Kingdom, the prevalence of obesity in T2D patients in the north of Liverpool was 52% using the definition of BMI≥30kg/m2.23 In Taiwan, the prevalence of obesity using the definition of BMI≥25kg/m2 was 39.3% and 41.7% in the diabetic men and women, respectively.24 In Shanghai, obesity was present in 6.7% of adults with T2D when the criteria were defined as BMI≥30kg/m2.25 In our study, the prevalence of obesity using the definition of BMI ≥ 25 kg/m2 was 46.4% in women and 47.2% in men, which were a little higher than the results from a study in Taiwan patients with T2D.24
A cross-sectional study performed in Northwest Ethiopia found that the prevalence of abdominal obesity was 61% in T2D patients, which was very close to our results of 64.9%.26 Another study investigated the prevalence of central obesity in a German population with T2D using the WHO 1999 definition for obesity, and found that the prevalence of central obesity was 50.9% in 4020 participants.27 Of the diabetic patients in Shanghai downtown, 64.9% of women, 38.6% of men, 58.4% of total were categorized as abdominal obesity using the same definition as ours (defined as WC ≥ 90cm for males and WC ≥ 80cm for females),25 which was lower than our results. The prevalence of abdominal obesity in our study was 79.8% of women, 53.5% of men, 64.9% of total inpatients with T2D. The possible reasons for this difference may be related to different study populations. Additionally, consistent with previous studies,28 our findings showed that abdominal obesity is more prevalent in females than in males. Moreover, our survey indicated that the prevalence of abdominal obesity peaked in the elder age groups. The changes in hormones and physical activity levels may be responsible for this difference.
Exogenous UA comes from ingested food, including excessive intake of fructose, fatty foods and alcohol consumption. Excessive fructose intake is an important cause of obesity. Fructose intake increases serum uric acid, and the kidney compensates for increased uric acid excretion in order to maintain a stable level of serum uric acid. Many studies have investigated the relationship between hyperuricemia and obesity and diabetes. Clinical observation shows that obese people are often accompanied by hyperuricemia and are more likely to develop diabetes. Recently, more and more studies have repeatedly proved that there is an independent association between SUA levels and obesity in the general and diabetic population. For example, two recent studies showed that SUA was significantly correlated with central obesity in elderly women.4,29 Another study among the Bangladeshi adults also indicated a significantly positive relationship between SUA and obesity.30 Furthermore, a recent study performed in T2D population found that obesity was significantly associated with hyperuricemia in Ethiopia T2D patients.31 More importantly, high SUA levels also predict the development and progression of obesity in the general population in a prospective study.32 The articles we have published also showed that SUA levels are closely associated with obesity, BMI and WC in Chinese inpatients with T2D.4,8
Although the association between SUA levels and obesity, including abdominal obesity, has been investigated and confirmed, the relationship between UUAE levels and obesity is scarcely reported in both healthy and diabetic populations. Several studies observed an association between UUAE levels and disorders accompanied by obesity. For example, a study described how uric acid excretion predicts increased blood pressure among American adolescents of African descent.33 Our previous study also found that UUAE is associated with nonalcoholic fatty liver disease in patients with T2D.20 In the present study, the close associations of UUAE levels with obesity and abdominal obesity were observed in T2D patients even after controlling for some confounding factors.
A possible explanation for the association between UUAE and obesity may be that UUAE levels are closely related to some risk factors of obesity, such as dyslipidemia and insulin resistance. In our study, increased FCP, 2 h PCP, and HOMA2-IR were more prevalent in patients with higher UUAE quartiles, indicating that insulin resistance is more severe across the UUAE quartiles. Likewise, higher BMI, WHR and TTG, and lower HDL-C levels were more observed in patients with higher UUAE quartiles, which may suggest the more severe obesity and dyslipidemia in T2D patients with higher UUAE quartiles. Based on epidemiologic, clinical, and experimental studies, obesity is closely associated with insulin resistance and plays a critical role in the pathogenesis of T2D. Moreover, increased circulating levels of lipids have also been related to insulin resistance in the muscle and liver.34 Low-grade inflammation of white adipose tissue (WAT) resulting from the activation of the innate immune system in obese patients leads to insulin resistance.35 Obesity is related to oxidative stress, and uric acid is a strong free radical scavenger, about 60% of the free radicals in the body are scavenged by uric acid. Therefore, hyperuricemia in obese patients is itself a protective mechanism, and the increase in uric acid helps the clearance of free radicals in the body. When obese, the balance is broken, and the increase in uric acid cannot be completely removed, which leads to hyperuricemia.
Interestingly, the strongly positive associations between UUAE and obesity and abdominal obesity were still observed in T2D patients even after controlling for multiple risk factors for obesity. A possible explanation may be that increased UUAE levels are accompanied by compensatory elevation of SUA levels. A longitudinal study demonstrated that high serum uric acid levels increase the risk of obesity.6 Purine catabolism in adipose tissue could be enhanced in obesity.36 Two previous studies have shown that uric acid generation causes mitochondrial oxidative stress that stimulates fat accumulation, independent of excessive caloric intake. An elevated uric acid also independently predicts the development of obesity.37,38 Therefore, uric acid might contribute to obesity, insulin resistance and diabetes.
Evidence illustrates that the GFR deterioration was associated with progressive impairment in uric acid excretion.39,40 To eliminate the influence of GFR on UUAE, we further analyzed the association between UUAE and obesity and abdominal obesity in the CKD group and non-CKD group. Finally, we found that UUAE was significantly related to obesity and abdominal obesity only in the non-CKD population. EGFR declined in CKD patients, which in turn affects the results of UUAE. Therefore, UUAE only had predictive value for obesity and abdominal obesity in the non-CKD population.
Additionally, some studies have shown that the GFR of diabetic patients was also affected by some cardiometabolic risk factors, such as higher SUA, low HDL-C, high Triglycerides/HDL-C ratio, and high risk of hypertension.41,42 Similarly, in the present study, we also found that there was a significant increase in eGFR across the UUAE quartiles accompanied by gradually increased TG, DBP, and SUA levels. Therefore, increased UUAE may be associated with more and severe cardiovascular metabolic risk factors.
Although this study uses strict inclusion and exclusion criteria, including medical history, routine laboratory tests and possible confounding factors, there were still some limitations. First of all, in a cross-sectional study, it is difficult to determine the causal relationship between obesity and urine uric acid excretion. Secondly, because the study subjects were patients with T2D, the study discovered may not be applicable to other populations, and thus do not reflect a population. Further studies are needed to extrapolate the clear association. Third, the UUAE levels were affected by some factors, such as genetic factors, diet and drugs. Therefore, the volatility in UUAE could not be minimized. However, we have eliminated the influence of these factors as much as possible, such as diet and drugs.
In summary, increased UUAE is independently associated with the presence of obesity and abdominal obesity in T2D patients without CKD. UUAE may be a strong predictor of future obesity and abdominal obesity. Patients with increased UUAE levels in T2D without CKD may be considered early intervention for obesity. Further prospective studies should attempt to investigate whether UUAE would be useful for predicting obesity and abdominal obesity in T2D and the general population.
Acknowledgments
The authors thanked the patients who participated in the study. This study was supported by grants from the National Key Research and Development Plan (grant numbers 2018YFC1314900 and 2018YFC1314905) and the National Natural Science Foundation of China (grant number 81170759 and 81770813).
Disclosure
This study protocol was approved by the ethics committee of Shanghai Jiao Tong University Affiliated Sixth People’s Hospital. The approval number is 2018-KY-018(K). The date on which the approval was granted is 2018-05-16. It conforms to the provisions of the Declaration of Helsinki (as revised in Fortaleza, Brazil, October 2013). The authors declare no conflict of interest. The datasets used or analysed during the current study are available from the corresponding author on reasonable request.
References
1. Wang T, Bi Y, Xu M, et al. Serum uric acid associates with the incidence of type 2 diabetes in a prospective cohort of middle-aged and elderly Chinese. Endocrine. 2011;40(1):109–116. doi:10.1007/s12020-011-9449-2
2. Ali N, Mahmood S, Islam F, et al. Relationship between serum uric acid and hypertension: a cross-sectional study in Bangladeshi adults. Sci Rep. 2019;9(1):9061. doi:10.1038/s41598-019-45680-4
3. Cui LF, Shi HJ, Wu SL, et al. Association of serum uric acid and risk of hypertension in adults: a prospective study of Kailuan corporation cohort. Clin Rheumatol. 2017;36(5):1103–1110. doi:10.1007/s10067-017-3548-2
4. Chen MY, Zhao CC, Li TT, et al. Serum uric acid levels are associated with obesity but not cardio-cerebrovascular events in Chinese inpatients with type 2 diabetes. Sci Rep. 2017;7:40009. doi:10.1038/srep40009
5. Liu DM, Jiang LD, Gan L, Su Y, Li F. Association between serum uric acid level and body mass index in sex- and age- specific groups in southwestern China. Endocr Pract. 2019;25(5):438–445. doi:10.4158/EP-2018-0426
6. Zheng R, Chen C, Yang T, Chen Q, Lu R, Mao Y. Serum uric acid levels and the risk of obesity: a Longitudinal Population-Based Epidemiological Study. Clin Lab. 2017;63(10):1581–1587. doi:10.7754/Clin.Lab.2017.170311
7. Li LX, Dong XH, Li MF, et al. Serum uric acid levels are associated with hypertension and metabolic syndrome but not atherosclerosis in Chinese inpatients with type 2 diabetes. J Hypertens. 2015;33(3):
8. Li Q, Yang Z, Lu B, et al. Serum uric acid level and its association with metabolic syndrome and carotid atherosclerosis in patients with type 2 diabetes. Cardiovasc Diabetol. 2011;10:72. doi:10.1186/1475-2840-10-72
9. Bonakdaran S, Kharaqani B. Association of serum uric acid and metabolic syndrome in type 2 diabetes. Curr Diabetes Rev. 2014;10(2):113–117. doi:10.2174/1573399810666140228160938
10. Ali N, Miah R, Hasan M, et al. Association between serum uric acid and metabolic syndrome: a cross-sectional study in Bangladeshi adults. Sci Rep. 2020;10(1):7841. doi:10.1038/s41598-020-64884-7
11. Liu CQ, He CM, Chen N, et al. Serum uric acid is independently and linearly associated with risk of nonalcoholic fatty liver disease in obese Chinese adults. Sci Rep. 2016;6:38605. doi:10.1038/srep38605
12. Yu H, Zhao L, Liu L, Li Y, Sun J, Liu Y. Relationship between serum uric acid level and nonalcoholic fatty liver disease in type 2 diabetes patients. Medicines. 2021;100(33):e26946.
13. Wang H, Wang L, Xie R, et al. Association of serum uric acid with body mass index: a Cross-Sectional Study from Jiangsu Province. China Iran J Public Health. 2014;43(11):1503–1509.
14. Maglio C, Peltonen M, Neovius M, et al. Effects of bariatric surgery on gout incidence in the Swedish Obese Subjects study: a non-randomised, prospective, controlled intervention trial. Ann Rheum Dis. 2017;76(4):688–693. doi:10.1136/annrheumdis-2016-209958
15. Tsunoda S, Kamide K, Minami J, Kawano Y. Decreases in serum uric acid by amelioration of insulin resistance in overweight hypertensive patients: effect of a low-energy diet and an insulin-sensitizing agent. Am J Hypertens. 2002;15(8):697–701. doi:10.1016/S0895-7061(02)02953-9
16. Erdberg A, Boner G, van Dyk DJ, Carel R. Urine uric acid excretion in patients with insulin-dependent diabetes mellitus. Nephron. 1992;60(2):134–137. doi:10.1159/000186728
17. Curhan GC, Taylor EN. 24-h uric acid excretion and the risk of kidney stones. Kidney Int. 2008;73(4):489–496. doi:10.1038/sj.ki.5002708
18. Li LX, Wang AP, Zhang R, et al. Decreased urine uric acid excretion is an independent risk factor for chronic kidney disease but not for carotid atherosclerosis in hospital-based patients with type 2 diabetes: a cross-sectional study. Cardiovasc Diabetol. 2015;14:36. doi:10.1186/s12933-015-0199-y
19. Li LX, Lu JX, Shuai HP, et al. Decreased urine uric acid excretion is associated with diabetic retinopathy but not with lower limb atherosclerosis in hospitalized patients with type 2 diabetes. Atherosclerosis. 2015;242(1):13–18. doi:10.1016/j.atherosclerosis.2015.06.051
20. Zhao CC, Wang AP, Li LX, et al. Urine uric acid excretion is associated with nonalcoholic fatty liver disease in patients with type 2 diabetes. J Diabetes Complications. 2016;30(6):1074–1080. doi:10.1016/j.jdiacomp.2016.04.017
21. Li MF, Ren Y, Zhao CC, et al. Prevalence and clinical characteristics of lower limb atherosclerotic lesions in newly diagnosed patients with ketosis-onset diabetes: a cross-sectional study. Diabetol Metab Syndr. 2014;6:71. doi:10.1186/1758-5996-6-71
22. Kanazawa M, Yoshiike N, Osaka T, Numba Y, Zimmet P, Inoue S. Criteria and classification of obesity in Japan and Asia-Oceania. World Rev Nutr Diet. 2005;94:1–12. doi:10.1159/000088200
23. Daousi C, Casson IF, Gill GV, MacFarlane IA, Wilding JP, Pinkney JH. Prevalence of obesity in type 2 diabetes in secondary care: association with cardiovascular risk factors. Postgrad Med J. 2006;82(966):280–284. doi:10.1136/pmj.2005.039032
24. Tseng CH. Body mass index and blood pressure in adult type 2 diabetic patients in Taiwan. Circ J. 2007;71(11):1749–1754. doi:10.1253/circj.71.1749
25. Lu B, Yang Y, Song X, et al. An evaluation of the international diabetes federation definition of metabolic syndrome in Chinese patients older than 30 years and diagnosed with type 2 diabetes mellitus. Metabolism. 2006;55(8):1088–1096. doi:10.1016/j.metabol.2006.04.003
26. Biadgo B, Melak T, Ambachew S, et al. The prevalence of metabolic syndrome and its components among type 2 diabetes mellitus patients at a tertiary hospital, Northwest Ethiopia. Ethiop J Health Sci. 2018;28(5):645–654. doi:10.4314/ejhs.v28i5.16
27. Koehler C, Ott P, Benke I, Hanefeld M. Comparison of the prevalence of the metabolic syndrome by WHO, AHA/ NHLBI, and IDF definitions in a German population with type 2 diabetes: the Diabetes in Germany (DIG) Study. Horm Metab Res. 2007;39(9):632–635. doi:10.1055/s-2007-985816
28. Wang H, Wang J, Liu MM, et al. Epidemiology of general obesity, abdominal obesity and related risk factors in urban adults from 33 communities of Northeast China: the CHPSNE study. BMC Public Health. 2012;12:967. doi:10.1186/1471-2458-12-967
29. Wang HJ, Shi LZ, Liu CF, Liu SM, Shi ST. Association between uric acid and metabolic syndrome in elderly women. Open Med. 2018;13:172–177. doi:10.1515/med-2018-0027
30. Ali N, Perveen R, Rahman S, et al. Prevalence of hyperuricemia and the relationship between serum uric acid and obesity: a study on Bangladeshi adults. PLoS One. 2018;13(11):e0206850. doi:10.1371/journal.pone.0206850
31. Arersa KK, Wondimnew T, Welde M, Husen TM. Prevalence and determinants of hyperuricemia in type 2 diabetes mellitus patients attending Jimma Medical Center, Southwestern Ethiopia, 2019. Diabetes Metab Syndr Obes. 2020;13:2059–2067. doi:10.2147/DMSO.S252825
32. Zhong X, Zhang D, Yang L, Du Y, Pan T. The relationship between serum uric acid within the normal range and β-cell function in Chinese patients with type 2 diabetes: differences by body mass index and gender. Peer J. 2019;7:e6666. doi:10.7717/peerj.6666
33. Mrug S, Mrug M, Morris AM, et al. Uric acid excretion predicts increased blood pressure among American adolescents of African descent. Am J Med Sci. 2017;353(4):336–341. doi:10.1016/j.amjms.2017.01.008
34. Yazıcı D, Sezer H. Insulin resistance, obesity and lipotoxicity. Adv Exp Med Biol. 2017;960:277–304.
35. Kahn SE, Hull RL, Utzschneider KM. Mechanisms linking obesity to insulin resistance and type 2 diabetes. Nature. 2006;444(7121):840–846. doi:10.1038/nature05482
36. Tsushima Y, Nishizawa H, Tochino Y, et al. Uric acid secretion from adipose tissue and its increase in obesity. J Biol Chem. 2013;288(38):27138–27149. doi:10.1074/jbc.M113.485094
37. Masuo K, Kawaguchi H, Mikami H, Ogihara T, Tuck ML. Serum uric acid and plasma norepinephrine concentrations predict subsequent weight gain and blood pressure elevation. Hypertension. 2003;42(4):474–480. doi:10.1161/01.HYP.0000091371.53502.D3
38. Johnson RJ, Nakagawa T, Sanchez-Lozada LG, et al. Sugar, uric acid, and the etiology of diabetes and obesity. Diabetes. 2013;62(10):3307–3315. doi:10.2337/db12-1814
39. Takahashi S, Tanaka M, Furuhashi M, et al. Fatty liver index is independently associated with deterioration of renal function during a 10-year period in healthy subjects. Sci Rep. 2021;11(1):8606. doi:10.1038/s41598-021-88025-w
40. Oh TR, Choi HS, Kim CS, et al. Hyperuricemia has increased the risk of progression of chronic kidney disease: propensity score matching analysis from the KNOW-CKD study. Sci Rep. 2019;9(1):6681. doi:10.1038/s41598-019-43241-3
41. Di Bonito P, Mozzillo E, Esposito M, et al. Non-albuminuric reduced eGFR phenotype in children and adolescents with type 1 diabetes. Diabetes Res Clin Pract. 2019;155:107781. doi:10.1016/j.diabres.2019.07.005
42. Di Bonito P, Mozzillo E, Rosanio FM, et al. Albuminuric and non-albuminuric reduced eGFR phenotypes in youth with type 1 diabetes: factors associated with cardiometabolic risk. Nutr Metab Cardiovasc Dis. 2021;31(7):2033–2041. doi:10.1016/j.numecd.2021.03.019
 © 2021 The Author(s). This work is published and licensed by Dove Medical Press Limited. The
full terms of this license are available at https://www.dovepress.com/terms
and incorporate the Creative Commons Attribution
- Non Commercial (unported, 3.0) License.
By accessing the work you hereby accept the Terms. Non-commercial uses of the work are permitted
without any further permission from Dove Medical Press Limited, provided the work is properly
attributed. For permission for commercial use of this work, please see paragraphs 4.2 and 5 of our Terms.
© 2021 The Author(s). This work is published and licensed by Dove Medical Press Limited. The
full terms of this license are available at https://www.dovepress.com/terms
and incorporate the Creative Commons Attribution
- Non Commercial (unported, 3.0) License.
By accessing the work you hereby accept the Terms. Non-commercial uses of the work are permitted
without any further permission from Dove Medical Press Limited, provided the work is properly
attributed. For permission for commercial use of this work, please see paragraphs 4.2 and 5 of our Terms.