Back to Journals » Diabetes, Metabolic Syndrome and Obesity » Volume 12
Urinary biomarkers for diagnosing poststroke depression in patients with type 2 diabetes mellitus
Authors Liang ZH, Jia YB, Li ZR, Li M, Wang ML, Yun YL, Yu LJ, Shi L, Zhu RX
Received 9 May 2019
Accepted for publication 4 July 2019
Published 13 August 2019 Volume 2019:12 Pages 1379—1386
DOI https://doi.org/10.2147/DMSO.S215187
Checked for plagiarism Yes
Review by Single anonymous peer review
Peer reviewer comments 2
Editor who approved publication: Prof. Dr. Antonio Brunetti
Zi-Hong Liang,1 Yan-Bo Jia,2 Zi-Ru Li,1 Min Li,1 Mei-Ling Wang,1 Yong-Li Yun,1 Li-Jun Yu,1 Lei Shi,1 Run-Xiu Zhu1
1Department of Neurology, Inner Mongolia Autonomous Region People’s Hospital, Huhhot, Inner Mongolia, People’s Republic of China; 2Department of Orthopaedics, The Second Affiliated Hospital of Inner Mongolia Medical University, Huhhot, Inner Mongolia, People’s Republic of China
Background: Depression can seriously affect the quality of life of type 2 diabetes mellitus (T2DM) patients after stroke. However, there were still no objective methods to diagnose T2DM patients with poststroke depression (PSD). Therefore, we conducted this study to deal with this problem.
Methods: Gas chromatography-mass spectroscopy (GC-MS)-based metabolomics profiling method was used to profile the urinary metabolites from 83 nondepressed T2DM patients after stroke and 101 T2DM patients with PSD. The orthogonal partial least-squares discriminant analysis was conducted to explore the metabolic differences in T2DM patients with PSD. The logistic regression analysis was performed to identify the optimal and simplified biomarker panel for diagnosing T2DM patients with PSD. The receiver operating characteristic curve analysis was used to assess the diagnostic performance of this biomarker panel.
Results: In total, 23 differential metabolites (7 decreased and 16 increased in T2DM patients with PSD) were found. A panel consisting of pseudouridine, malic acid, hypoxanthine, 3,4-dihydroxybutyric acid, fructose and inositol was identified. This panel could effectively separate T2DM patients with PSD from nondepressed T2DM patients after stroke. The area under the curve was 0.965 in the training set and 0.909 in the validation set. Meanwhile, we found that the galactose metabolism was significantly affected in T2DM patients with PSD.
Conclusion: Our results could be helpful for future development of an objective method to diagnose T2DM patients with PSD and provide novel ideas to study the pathogenesis of depression.
Keywords: type 2 diabetes mellitus, post-stroke depression, metabolite, metabolomics
Introduction
Type 2 diabetes mellitus (T2DM) has become an expanding global health problem, which imposes a huge economic burden to the individual and society. Obesity is one of the main risk factors of T2DM.1 In China, the number of T2DM patients is rapidly increasing.2 These patients are usually at high risk for diabetic complications, such as stroke.3 Meanwhile, T2DM patients usually suffer from a variety of mental health problems.4 Depression, a common mental disorder, is also a common complication of stroke.5 Nowadays, poststroke depression (PSD) has become a serious problem for T2DM patients. However, there were still no objective methods to diagnose T2DM patients with PSD. Currently, the diagnosis of depression in T2DM patients after stroke mainly depends on the subjective method (such as Self-Rating Depression Scale). But, due to the considerably complex and diverse clinical symptoms of depression, this method unavoidably results in a considerable error rate.6 A feasible method to solve this problem is to identify some disease-specific biomarkers to support objective diagnosis.
Metabolomics, the comprehensive analysis of the unique chemical fingerprints in a biological sample that specific cellular processes leave behind, has been widely used to identify the disease-specific biomarkers.7–9 The nuclear magnetic resonance, liquid chromatography-mass spectroscopy and gas chromatography-mass spectroscopy (GC-MS) are three different analytical techniques for nontargeted metabonomic mapping. Each analytical technique has both advantages and disadvantages. As the first hyphenated technique to be developed, GC-MS has helped many researchers identify disease-specific biomarkers. Our group has also successfully used this method to study the antidepressant-like effects of diterpene ginkgolides and identify some potential biomarkers for bipolar disorder.10–13
In this study, a GC-MS-based metabolomic platform will be used to profile the metabolites in the urine samples from 83 nondepressed T2DM patients after stroke and 101 T2DM patients with PSD. The first purpose of our work is to identify the differential metabolites in T2DM patients with PSD relative to nondepressed T2DM patients after stroke and the second purpose is to identify some biomarkers for objectively diagnosing PSD in T2DM patients.
Methods
Subject recruitment
The protocol of this study was reviewed and approved by Ethical Committee of Inner Mongolia People’s Hospital (Inner Mongolia, China). This study was conducted in accordance with the Declaration of Helsinki. The included patients were informed about the purpose of this study and provided the written informed consents. We used the diagnostic criteria for ischemic stroke revised by the fourth National Conference on Cerebrovascular Diseases to diagnose stroke in T2DM patients. Meanwhile, we used the Hamilton Depression Rating Scale (HDRS) score to assess the depressive symptoms of T2DM patients after stroke. Patients with HDRS score >17 were assigned into the experiment group, and the nondepressed T2DM patients were assigned into the control group. Patients were excluded if they had any preexisting physical or other mental disorders and/or illicit drug use. Finally, there were 83 nondepressed T2DM patients after stroke in the control group and 101 T2DM patients with PSD in the experiment group. The detailed information of these included patients is described in Table 1.
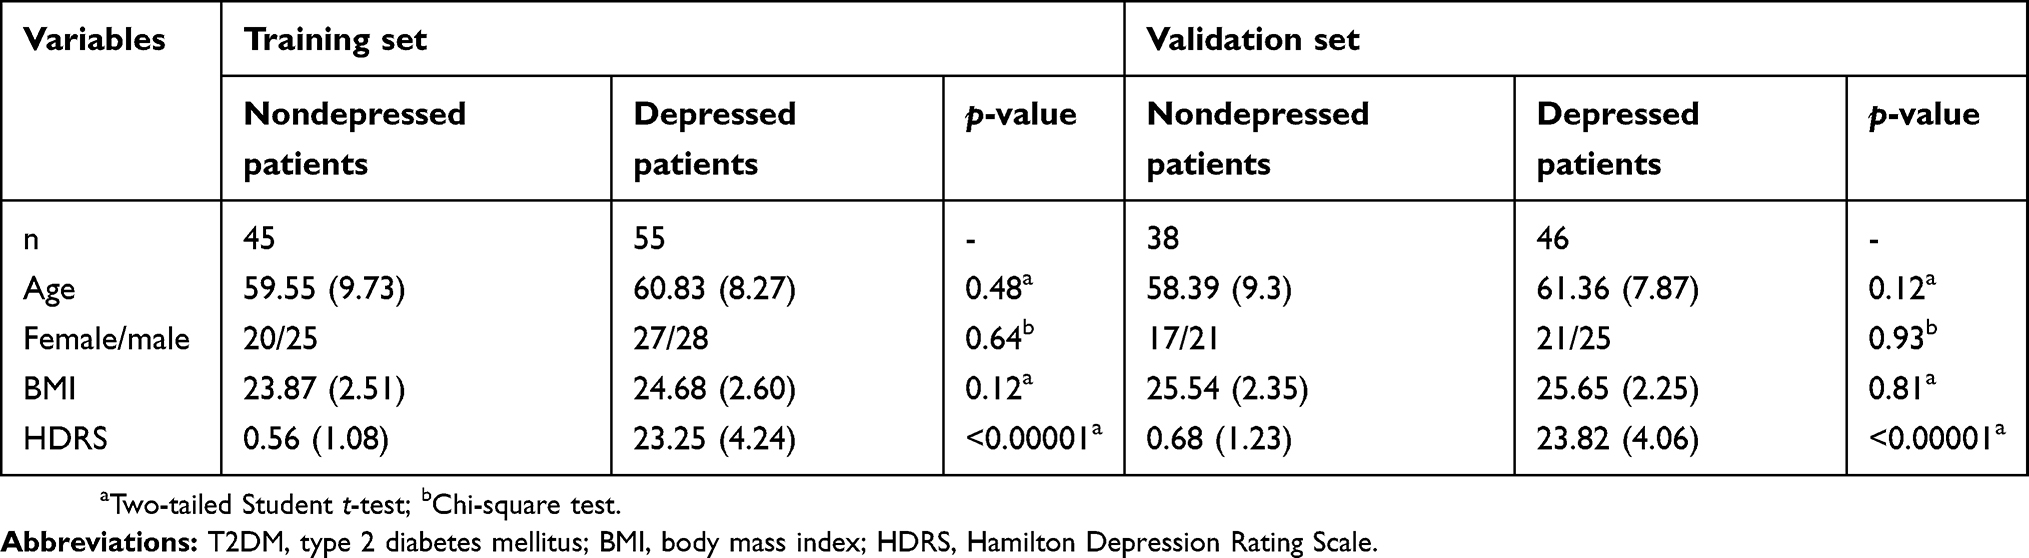 |
Table 1 Clinical details of nondepressed and depressed T2DM patients after stroke |
Experimental design
The included patients were randomly divided into the training set and validation set. The training set including 45 patients in the control group and 55 patients in the experiment group was used to identify the differential metabolites and potential biomarkers. In clinical practice, it was critical to use the independent samples to validate the results obtained from the training set. Thus, the validation set including 38 patients in the control group and 46 patients in the experiment group was used to independently validate the diagnostic performance of these potential biomarkers. Each patient should provide the morning (9 am–10 am) urine samples. The samples were carefully collected using a sterile cup and then transferred into the sterile tube. After centrifugation (1500 g ×10 mins), the obtained supernatant was equally divided and then stored at −80°C for later analysis. The procedure for GC-MS analysis was conducted according to our previous studies.14,15
Statistical analysis
The SIMCAP +14.0 software was used to analyze the metabolic data, and the Pareto scaling was used here to normalize the data. First, we used the orthogonal partial least-squares discriminant analysis (OPLS-DA) to visualize the discrimination between the two groups.16 The two parameters (R2Y and Q2Y) were used to assess the quality of the built OPLS-DA model (goodness-of-fit and predictability). Meanwhile, a 399-iteration permutation test was conducted to rule out the nonrandom separation. Based on the coefficient loading plots from the model, we identified the differential metabolites responsible for the discrimination between the two groups. Based on the number of samples used to build the model, a correlation coefficient of |r| >0.380 was used as a cutoff value here.17
Second, to obtain an optimal and simplified biomarker panel, we used stepwise logistic regression analysis based on the Akaike’s information criterion (AIC) rule to further analyze the identified differential metabolites. Then, we used the receiver operating characteristic (ROC) curve analysis to evaluate the diagnostic performance of this biomarker panel. The area under the curve (AUC) was the evaluation index. If the value of AUC was >0.9, then the diagnostic performance of this biomarker panel was excellent.18 Meanwhile, we used Pearson correlation analysis to assess the correlations between HDRS score and these identified potential biomarkers. The SPSS 19.0 was used in this step.
Finally, to check whether the differential metabolites were still significantly different between the two groups, the nonparametric Mann–Whitney U test and Benjamini–Hochberg false discovery rate were used here. Meanwhile, we used the MetaboAnalyst 3.0 to analyze the affected pathways in T2DM patients with PSD and built metabolite–metabolite interaction network.19 The gplots package (R software) was applied here to generate heatmap using the differential metabolites to visualize the metabolite differences within the data set.
Results
OPLS-DA model construction and validation
First, to explore whether there were metabolic differences between the control group and experiment group, we used the training set to build the OPLS-DA model. The results showed that the two groups could be separated with little overlap (Figure 1A). The positive values of R2Y (58.7%) and Q2Y (50.6%) suggested the robust metabolic differences between the two groups. Second, we used the validation set to independently evaluate the diagnostic performance of the built model. The results showed that 35 of 38 patients in the control group and 42 of 46 patients in the experiment group were correctly predicted by the model (Figure 1B). Meanwhile, the results of 399-item permutation test indicated that the model was not overfitted, as the original values of R2 and Q2 were higher than their permutated values (Figure 1C). These results demonstrated that the metabolic differences had the promise as an objective diagnostic test for T2DM patients with PSD.
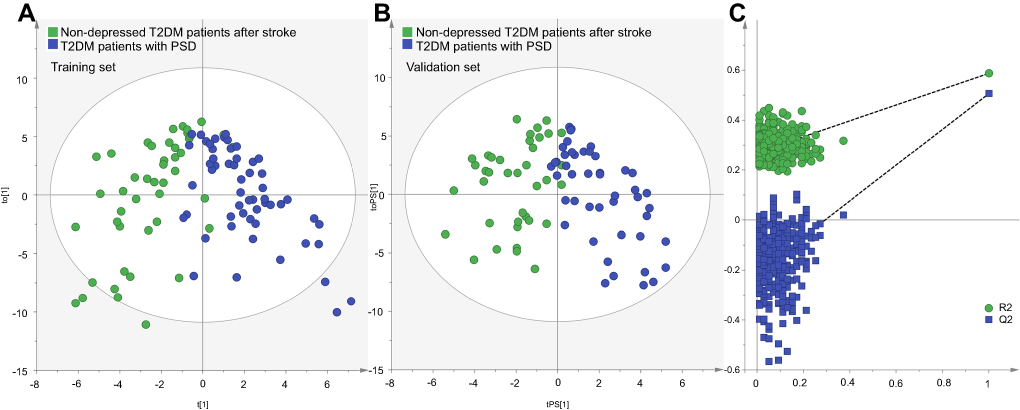 |
Figure 1 Metabolomic analysis of urine samples from the two groups: (A) OPLS-DA model built with training set (green dot, nondepressed T2DM patients after stroke; blue dot, T2DM patients with PSD); (B) T-predicted scatter plot built with validation set (green dot, nondepressed T2DM patients after stroke; blue dot, T2DM patients with PSD); (C) 399-item permutation test.Abbreviations: T2DM, type 2 diabetes mellitus; PSD, post-stroke depression; OPLS-DA, orthogonal partial least-squares discriminant analysis. |
Differential metabolite identification
The loading coefficient plot showed that there were 23 differential metabolites with |r|>0.380 (Figure 2). As compared to nondepressed T2DM patients after stroke, the T2DM patients with PSD were characterized by higher levels of 2-methyl-3-hydroxybutyric acid, citric acid, inositol, sucrose, lactic acid, methylsuccinic acid, sorbitol, vanillic acid, 3,4-dihydroxybutyric acid, threitol, hydroxylamine, D-glucose, myristic acid, azelaic acid, fructose and palmitic acid, along with lower levels of tyrosine, hypoxanthine, aminoethanol, pseudouridine, malic acid, n-methylnicotimide and indoxyl sulphate. The heatmap showed that these differential metabolites could effectively discriminate the two groups (Figure 3).
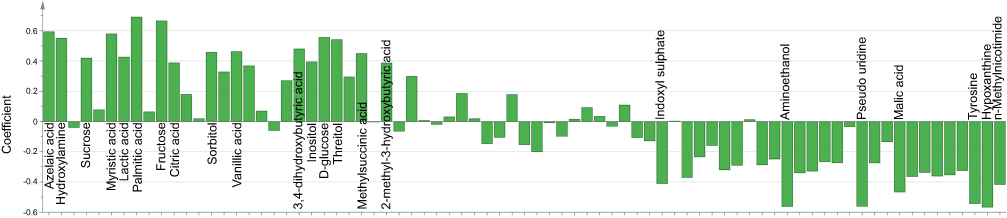 |
Figure 2 Correlation coefficients of the differential metabolites. |
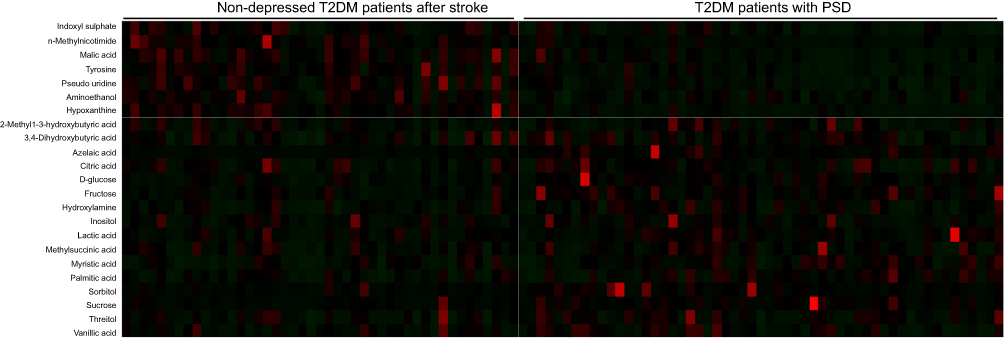 |
Figure 3 Heatmap constructed using molecular features of the differential metabolites.Abbreviations: T2DM, type 2 diabetes mellitus; PSD, post-stroke depression. |
The nonparametric Mann–Whitney U test was used to obtain the p-value of these differential metabolites identified by OPLS-DA model, and the Benjamini–Hochberg false discovery rate was used to adjust the p-value. The results showed that most of the differential metabolites remained significantly changed. The detailed information of these differential metabolites is described in Table 2. Furthermore, we found that the galactose metabolism in T2DM patients with PSD was significantly affected (p-value<0.05, impact >0, and FDR <0.1) (Figure 4A). The metabolite–metabolite interaction analysis showed that there were eight differential metabolites closely related with galactose metabolism (Figure 4B).
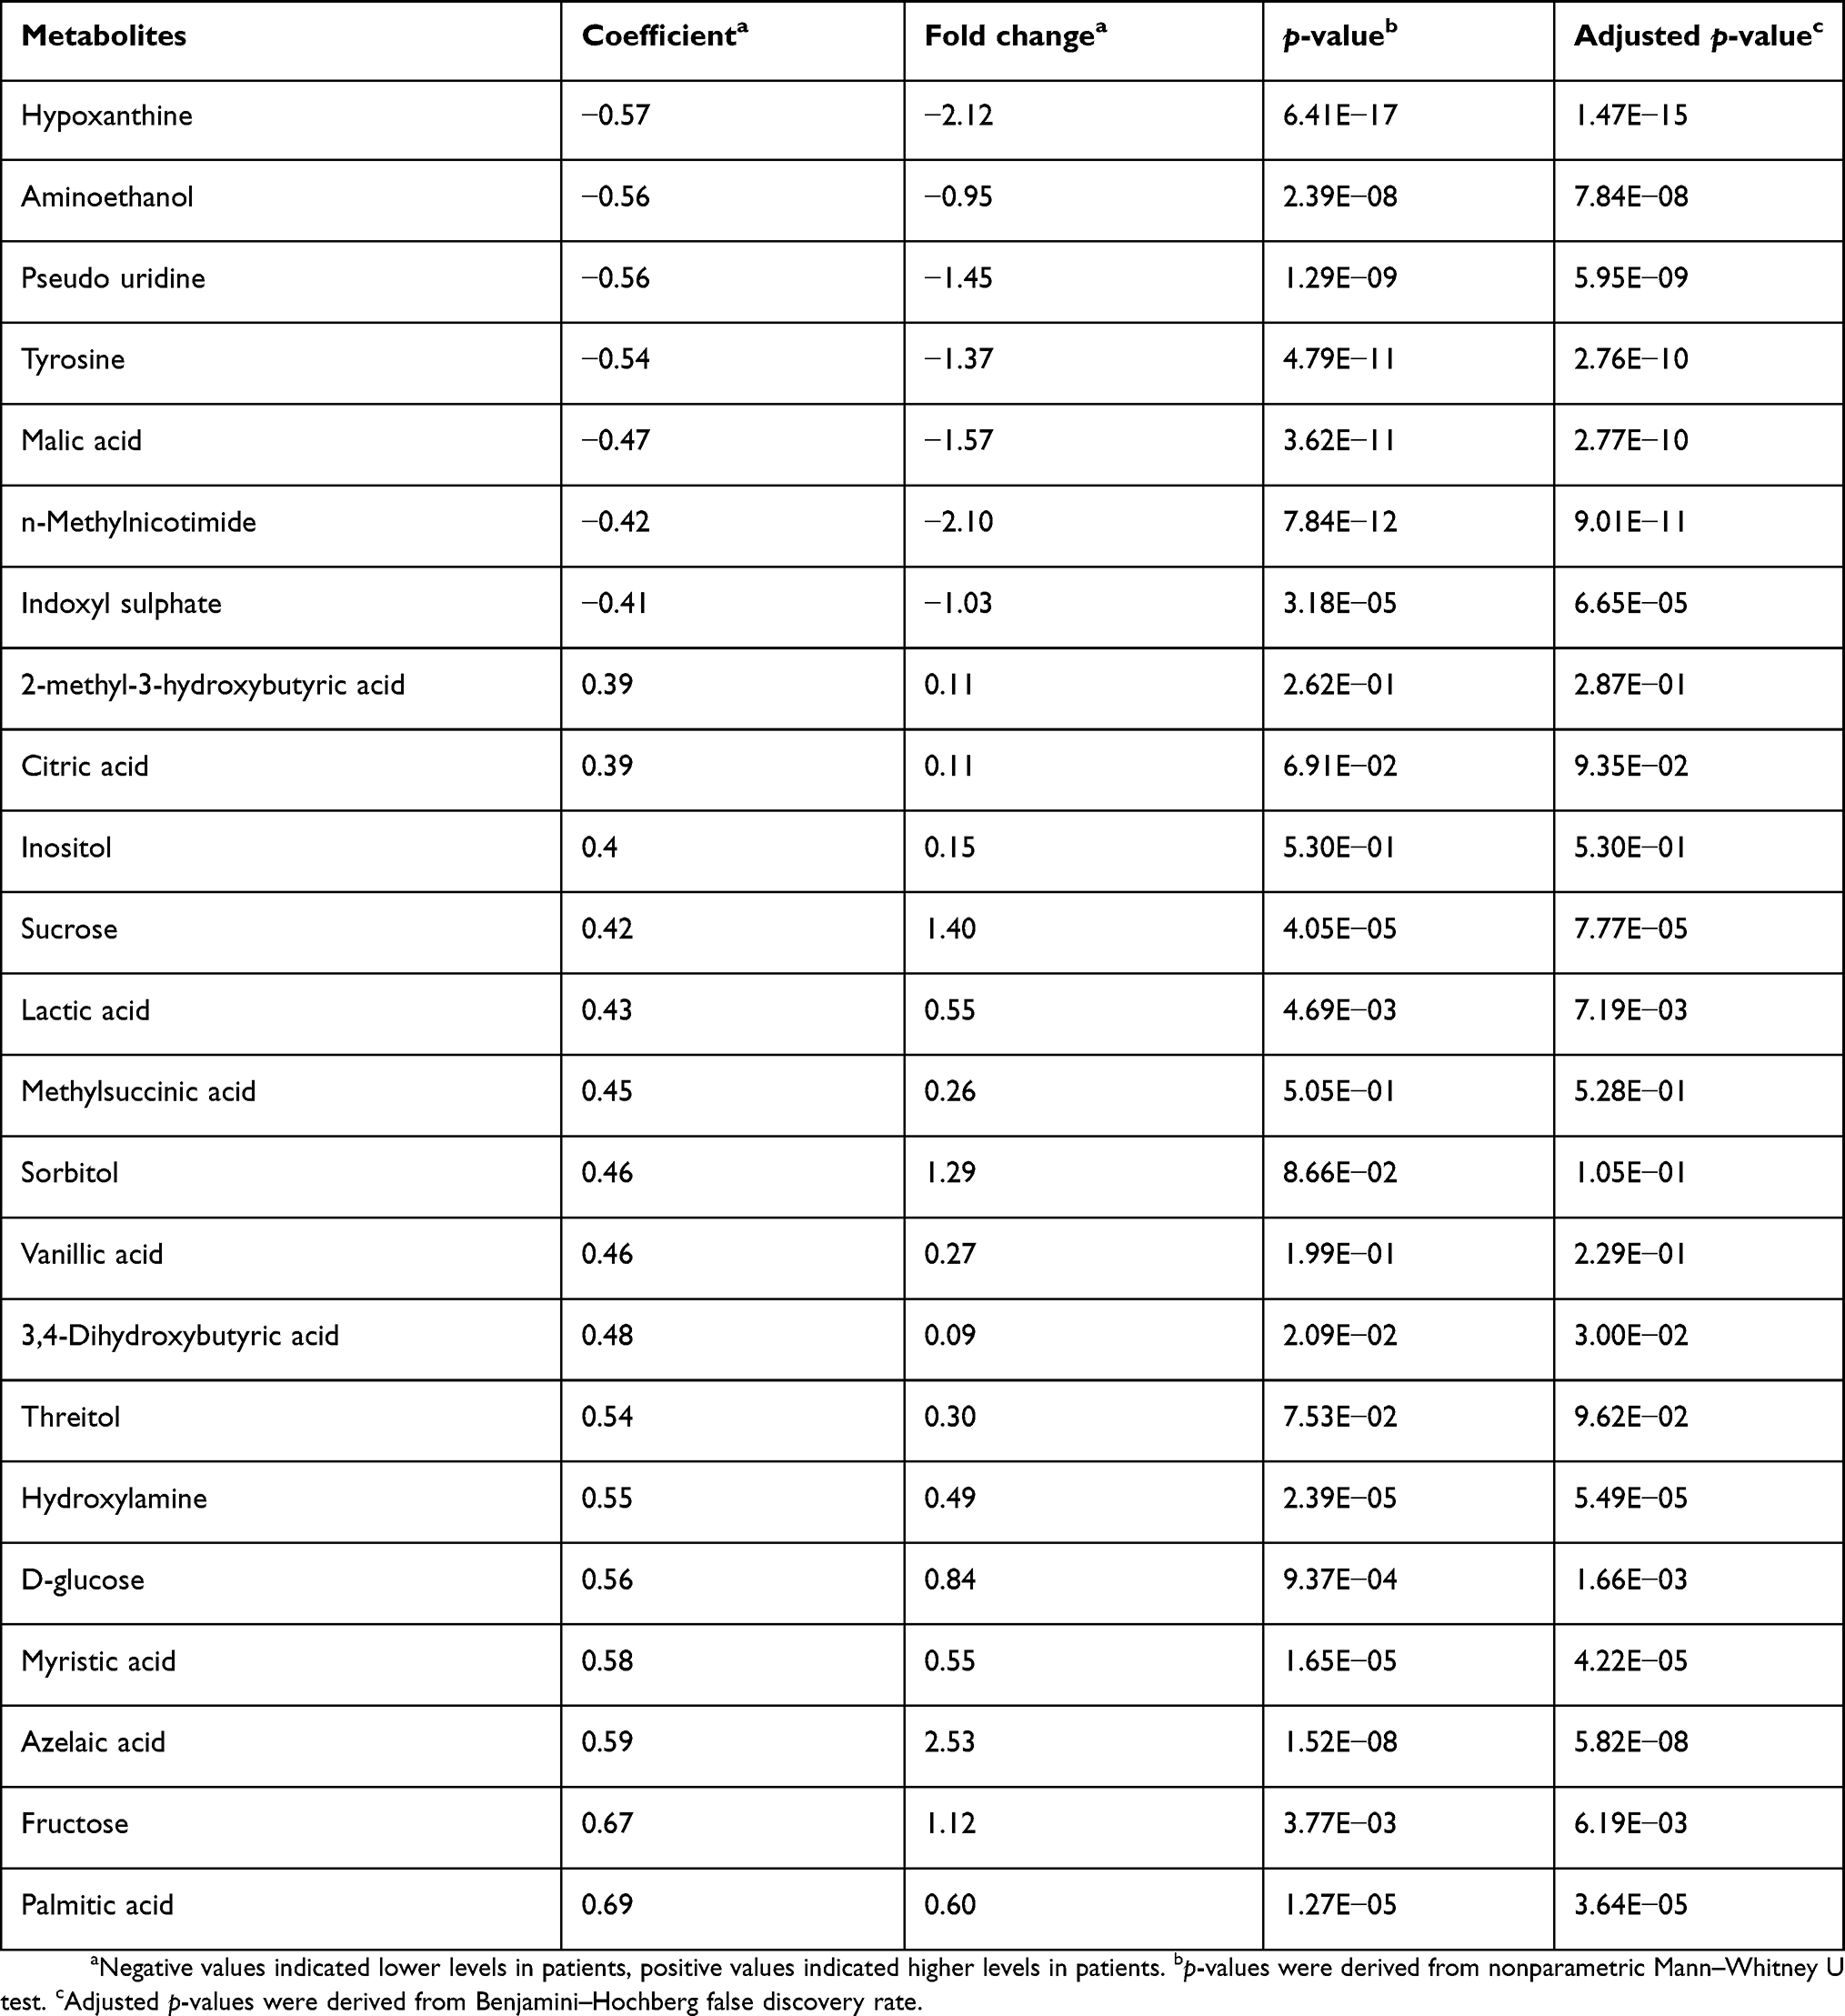 |
Table 2 Differentiated metabolites responsible for the discrimination between two groups |
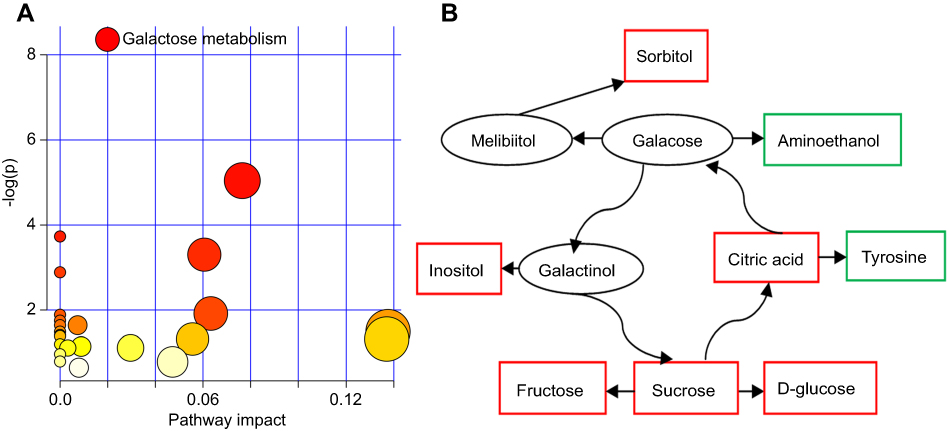 |
Figure 4 Pathway analysis of the differential metabolites: (A) galactose metabolism was significantly affected (p-value<0.05, impact>0 and false discovery rate (FDR)<0.1); (B) metabolite–metabolite interaction analysis of the differential metabolites. |
Potential biomarker panel identification
To obtain a simplified biomarker panel, the identified 23 differential metabolites were used as variables to conduct logistic regression analysis. The value of AIC was smallest when there were six differential metabolites in the model (Figure 5A). The six differential metabolites were pseudouridine, malic acid, hypoxanthine, 3,4-dihydroxybutyric acid, fructose and inositol. The biomarker panel consisting of these six differential metabolites could effectively discriminate the two groups, which indicated that the most significant deviations between the control group and experiment group could be described by these metabolites. Meanwhile, the Pearson correlation analysis showed that there was no significant relationship between HDRS score and these potential biomarkers.
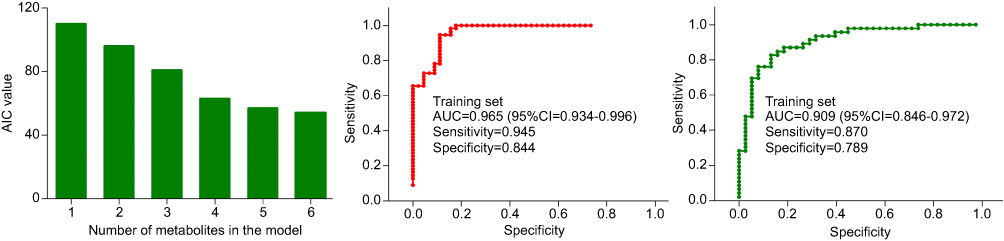 |
Figure 5 Results of logistic regression analysis and receiver operating characteristic curve analysis.Abbreviations: AIC, Akaike’s information criterion; AUC, area under the curve. |
To quantitatively analyze the diagnostic performance of this biomarker panel, two steps were conducted. First, we used the training set to do ROC analysis. The results showed that this biomarker panel could effectively distinguish T2DM patients with PSD from nondepressed T2DM patients after stroke. The AUC value was 0.965 (95% CI: 0.934–0.996), and the specificity and sensitivity were 84.4% and 94.5%, respectively (Figure 5B). Second, we used the validation set to do ROC analysis. The results showed that this biomarker panel could also effectively discriminate the blinded samples from the validation set. The AUC value was 0.909 (95% CI: 0.846–0.972), and the specificity and sensitivity were 78.9% and 87.0%, respectively (Figure 5C). These results showed that this biomarker panel might be a “good” classifier of T2DM patients with PSD and nondepressed T2DM patients after stroke.
Discussion
Depression is a disease with unclear pathogenesis.20,21 Using GC-MS-based metabolomics platform, we successfully identified 23 differential metabolites responsible for the discrimination between T2DM patients with PSD and nondepressed T2DM patients after stroke. Furthermore, we identified a potential biomarker panel, which was consisted of six differential metabolites: pseudouridine, malic acid, hypoxanthine, 3,4-dihydroxybutyric acid, fructose and inositol. This panel had a good diagnostic performance for the diagnosis of T2DM patients with PSD in both training set (AUC=0.965) and validation set (AUC=0.909). Considering the noninvasive and convenience of urine sample collection, these results demonstrated that the clinical applicability of this panel showed great promise and should be explored further.
Generally speaking, the multivariate analysis had some advantages in identifying the potential significance of subtle metabolic differences over the univariate analysis.22 Here, the significantly changed levels of 2-methyl-3-hydroxybutyric acid, citric acid, inositol, methyl succinic acid, sorbitol, vanillic acid and threitol were not found by the nonparametric Mann–Whitney U test. However, the OPLS-DA still identified these metabolites as the differential metabolites responsible for the discrimination between the two groups. Our previous metabolomic studies also found similar results.10,12,23
As an energy-providing nutrient, galactose was a key substrate for the biosynthesis of many macromolecules.24–26 Coelho et al reported that the biological importance of galactose was beyond its importance as a metabolite and a nutrient, and it could be beneficial in a number of diseases, particularly in those affecting the human brain.27 Galactose metabolism was important for preventing the accumulation of galactose and galactose metabolite. Thus, galactose metabolism was very important for health. Here, we found that the galactose metabolism was significantly affected in the T2DM patients with PSD, and many differential metabolites had a close relationship with galactose metabolism. Previous studies also reported that the disorders of galactose metabolism were found in the depressed paients.28,29 These results suggested that galactose metabolism had a crucial role in the pathogenesis of depression.
Jones reported that azelaic acid could inhibit the generation of ROS.30 Other researchers found that the level of azelaic acid was significantly increased in patients with neuropsychiatric disorders.31,32 In this study, we also identified the significantly changed azelaic acid in depressed patients. These findings were consistent with the increased oxidative stress status in depressed patients.33 Meanwhile, the significantly changed levels of tyrosine were observed in T2DM patients with PSD in this study. Our previous study found that this metabolite could be a candidate diagnostic biomarker for depression.14 Another study using a depressive animal model reported that the depressive behavior was related with significantly changed metabolites in the tyrosine–phenylalanine pathway.34 These results suggested an important role of tyrosine in the onset of depression.
Limitations should be mentioned here. First, the number of included T2DM patients after stroke was relatively small; then the results should be verified and supported by future studies. Second, all patients were from the same city, which might limit the applicability of our conclusion. Third, in this study, we only explored the differences in urine samples between the two groups; other biosamples should also be studied to ensure the physiological relationship between these differential metabolites and disease pathogenesis. Finally, only one kind of analytical techniques was used here, and future studies should apply the use of multiple analytical techniques to further investigate the metabolomic differences in T2DM patients with PSD.
In conclusion, our study found 23 differential metabolites responsible for the discrimination between T2DM patients with PSD and nondepressed T2DM patients after stroke and identified a potential biomarker panel for the diagnosis of T2DM patients with PSD. Meanwhile, we found that the galactose metabolism was significantly affected in T2DM patients with PSD. However, limited by the relatively small number of samples, our conclusion was still needed for future studies to verify and support.
Acknowledgment
This project is funded by the Health Family Planning Research Program of Inner Mongolia Autonomous Region (Grant No. 201703005), the Natural Science Foundation of Inner Mongolia Autonomous Region of China (Grant No. 2016MS0884), and the Foundation Project of the Inner Mongolia Autonomous Region People’s Hospital (Grant No. 201551).
Disclosure
The authors declare no financial or other conflicts of interest in this work.
References
1. Caballero B. The global epidemic of obesity: an overview. Epidemiol Rev. 2007;29(1):1–5. doi:10.1093/epirev/mxm012
2. Yang W, Lu J, Weng J, et al. Prevalence of diabetes among men and women in China. N Engl J Med. 2010;362(12):1090–1101. doi:10.1056/NEJMoa0908292
3. DeFronzo RA, Ferrannini E, Groop L, et al. Type 2 diabetes mellitus. Nat Rev Dis Primers. 2015;1:15019.
4. Fisher EB, Thorpe CT, Devellis BM, Devellis RF. Healthy coping, negative emotions, and diabetes management: a systematic review and appraisal. Diabetes Educ. 2007;33(6):1080–1103. doi:10.1177/0145721707309808
5. Liu Z, Cai Y, He J. High serum levels of 8-OHdG are an independent predictor of post-stroke depression in Chinese stroke survivors. Neuropsychiatr Dis Treat. 2018;14:587–596. doi:10.2147/NDT.S155144
6. Mitchell AJ, Vaze A, Rao S. Clinical diagnosis of depression in primary care: a meta-analysis. Lancet. 2009;374:609–619. doi:10.1016/S0140-6736(09)60879-5
7. Kaddurah-Daouk R, Kristal BS, Weinshilboum RM. Metabolomics: a global biochemical approach to drug response and disease. Annu Rev Pharmacol Toxicol. 2008;48:653–683. doi:10.1146/annurev.pharmtox.48.113006.094715
8. Hou L, Wei X, Zhuo Y, et al. GC-MS-based metabolomics approach to diagnose depression in hepatitis B virus-infected patients with middle or old age. Aging (Albany NY). 2018;10(9):2252. doi:10.18632/aging.101446
9. Chen J, Bai SJ, Li W, et al. Urinary biomarker panel for diagnosing patients with depression and anxiety disorders. Transl Psychiatry. 2018;8(1):192. doi:10.1038/s41398-018-0245-0
10. Bai S, Zhang X, Chen Z, et al. Insight into the metabolic mechanism of Diterpene Ginkgolides on antidepressant effects for attenuating behavioural deficits compared with venlafaxine. Sci Rep. 2017;7(1):9591. doi:10.1038/s41598-017-10391-1
11. Hu Q, Shen P, Bai S, et al. Metabolite-related antidepressant action of diterpene ginkgolides in the prefrontal cortex. Neuropsychiatr Dis Treat. 2018;14:999–1011. doi:10.2147/NDT.S161351
12. Liang Z, Bai S, Shen P, et al. GC-MS-based metabolomic study on the antidepressant-like effects of diterpene ginkgolides in mouse hippocampus. Behav Brain Res. 2016;314:116–124. doi:10.1016/j.bbr.2016.08.001
13. Chen J, Liu Z, Fan S, et al. Combined application of NMR-and GC-MS-based metabonomics yields a superior urinary biomarker panel for bipolar disorder. Sci Rep. 2014;4:5855. doi:10.1038/srep05855
14. Zheng P, Chen J, Huang T, et al. A novel urinary metabolite signature for diagnosing major depressive disorder. J Proteome Res. 2013;12(12):5904–5911. doi:10.1021/pr400939q
15. Shao WH, Fan SH, Lei Y, et al. Metabolomic identification of molecular changes associated with stress resilience in the chronic mild stress rat model of depression. Metabolomics. 2013;9(2):433–443. doi:10.1007/s11306-012-0460-2
16. Bylesjö M, Rantalainen M, Cloarec O, et al. OPLS discriminant analysis: combining the strengths of PLS-DA and SIMCA classification. J Chemom. 2006;20(8–10):341–351. doi:10.1002/cem.1006
17. Cloarec O, Dumas ME, Trygg J, et al. Evaluation of the orthogonal projection on latent structure model limitations caused by chemical shift variability and improved visualization of biomarker changes in 1H NMR spectroscopic metabonomic studies. Anal Chem. 2005;77(2):517–526. doi:10.1021/ac048803i
18. Greiner M, Pfeiffer D, Smith RD. Principles and practical application of the receiver-operating characteristic analysis for diagnostic tests. Prev Vet Med. 2000;45:23–41. doi:10.1016/S0167-5877(00)00115-X
19. Xia J, Wishart DS. Using MetaboAnalyst 3.0 for comprehensive metabolomics data analysis. Curr Protoc Bioinformatics. 2016;55:
20. Chen J, Zheng P, Liu Y, et al. Sex differences in gut microbiota in patients with major depressive disorder. Neuropsychiatr Dis Treat. 2018;14:647–655. doi:10.2147/NDT.S159322
21. Chen Z, Li J, Gui S, et al. Comparative metaproteomics analysis shows altered fecal microbiota signatures in patients with major depressive disorder. Neuroreport. 2018;29(5):417–425. doi:10.1097/WNR.0000000000000985
22. MacIntyre DA, Jimenez B, Lewintre EJ, et al. Serum metabolome analysis by 1 H-NMR reveals differences between chronic lymphocytic leukaemia molecular subgroups. Leukemia. 2010;24(4):788–797. doi:10.1038/leu.2009.295
23. Zheng P, Wang Y, Chen L, et al. Identification and validation of urinary metabolite biomarkers for major depressive disorder. Mol Cell Proteomics. 2013;12(1):207–214. doi:10.1074/mcp.M112.021816
24. Liu B, Tu Y, He W, et al. Hyperoside attenuates renal aging and injury induced by D-galactose via inhibiting AMPK-ULK1 signaling-mediated autophagy. Aging (Albany NY). 2018;10(12):4197–4212. doi:10.18632/aging.101723
25. Liu G, Hale GE, Hughes CL. Galactose metabolism and ovarian toxicity. Reprod Toxicol. 2000;14(5):377–384.
26. Chen WK, Tsai YL, Shibu MA, et al. Exercise training augments Sirt1-signaling and attenuates cardiac inflammation in D-galactose induced-aging rats. Aging (Albany NY). 2018;10(12):4166–4174. doi:10.18632/aging.101714
27. Coelho AI, Berry GT, Rubio-Gozalbo ME. Galactose metabolism and health. Curr Opin Clin Nutr Metab Care. 2015;18(4):422–427. doi:10.1097/MCO.0000000000000189
28. Gibson SA, Korade Ž, Shelton RC. Oxidative stress and glutathione response in tissue cultures from persons with major depression. J Psychiatr Res. 2012;46(10):1326–1332. doi:10.1016/j.jpsychires.2012.06.008
29. Christensen L, Somers S. Comparison of nutrient intake among depressed and nondepressed individuals. Int J Eat Disord. 1996;20(1):105–109. doi:10.1002/(SICI)1098-108X(199607)20:1<105::AID-EAT12>3.0.CO;2-3
30. Jones DA. Rosacea, reactive oxygen species, and azelaic acid. J Clin Aesthetic Dermatol. 2009;2(1):26–30.
31. Chen J, Xie J, Zeng L, et al. Urinary metabolite signature in bipolar disorder patients during depressive episode. Aging (Albany NY). 2019;11(3):1008–1018. doi:10.18632/aging.101805
32. Maes M. The cytokine hypothesis of depression: inflammation, oxidative & nitrosative stress (IO&NS) and leaky gut as new targets for adjunctive treatments in depression. Neuro Endocrinol Lett. 2008;29(3):287–291.
33. Stefanescu C, Ciobica A. The relevance of oxidative stress status in first episode and recurrent depression. J Affect Disord. 2012;143(1–3):34–38. doi:10.1016/j.jad.2012.05.022
34. Zheng S, Yu M, Lu X, et al. Urinary metabonomic study on biochemical changes in chronic unpredictable mild stress model of depression. Clinica Chimica Acta. 2010;411(3–4):204–209. doi:10.1016/j.cca.2009.11.003
 © 2019 The Author(s). This work is published and licensed by Dove Medical Press Limited. The
full terms of this license are available at https://www.dovepress.com/terms
and incorporate the Creative Commons Attribution
- Non Commercial (unported, 3.0) License.
By accessing the work you hereby accept the Terms. Non-commercial uses of the work are permitted
without any further permission from Dove Medical Press Limited, provided the work is properly
attributed. For permission for commercial use of this work, please see paragraphs 4.2 and 5 of our Terms.
© 2019 The Author(s). This work is published and licensed by Dove Medical Press Limited. The
full terms of this license are available at https://www.dovepress.com/terms
and incorporate the Creative Commons Attribution
- Non Commercial (unported, 3.0) License.
By accessing the work you hereby accept the Terms. Non-commercial uses of the work are permitted
without any further permission from Dove Medical Press Limited, provided the work is properly
attributed. For permission for commercial use of this work, please see paragraphs 4.2 and 5 of our Terms.