Back to Journals » Nanotechnology, Science and Applications » Volume 14
Uptake and Intracellular Trafficking Studies of Multiple Dye-Doped Core-Shell Silica Nanoparticles in Lymphoid and Myeloid Cells
Authors Sola F ![]() , Canonico B, Montanari M, Volpe A, Barattini C, Pellegrino C, Cesarini E, Guescini M, Battistelli M
, Canonico B, Montanari M, Volpe A, Barattini C, Pellegrino C, Cesarini E, Guescini M, Battistelli M ![]() , Ortolani C, Ventola A, Papa S
, Ortolani C, Ventola A, Papa S
Received 18 November 2020
Accepted for publication 22 January 2021
Published 8 March 2021 Volume 2021:14 Pages 29—48
DOI https://doi.org/10.2147/NSA.S290867
Checked for plagiarism Yes
Review by Single anonymous peer review
Peer reviewer comments 2
Editor who approved publication: Professor Israel Rubinstein
Federica Sola,1,2 Barbara Canonico,1 Mariele Montanari,1 Angela Volpe,2 Chiara Barattini,1,2 Chiara Pellegrino,2 Erica Cesarini,1 Michele Guescini,1 Michela Battistelli,1 Claudio Ortolani,1 Alfredo Ventola,2 Stefano Papa1
1Department of Biomolecular Sciences, University of Urbino Carlo Bo, Urbino, PU, 61029, Italy; 2AcZon Srl, Monte San Pietro, BO, 40050, Italy
Correspondence: Barbara Canonico
Department of Biomolecular Sciences, University of Urbino Carlo Bo, Via Ca’ Le Suore 2-4, Urbino, PU, 61029, Italy
Tel +39 0722 304280
Email [email protected]
Introduction: Since most biologically active macromolecules are natural nanostructures, operating in the same scale of biomolecules gives the great advantage to enhance the interaction with cellular components. Noteworthy efforts in nanotechnology, particularly in biomedical and pharmaceutical fields, have propelled a high number of studies on the biological effects of nanomaterials. Moreover, the determination of specific physicochemical properties of nanomaterials is crucial for the evaluation and design of novel safe and efficient therapeutics and diagnostic tools. In this in vitro study, we report a physicochemical characterisation of fluorescent silica nanoparticles (NPs), interacting with biological models (U937 and PBMC cells), describing the specific triggered biologic response.
Methods: Flow Cytometric and Confocal analyses are the main method platforms. However TEM, NTA, DLS, and chemical procedures to synthesize NPs were employed.
Results: NTB 700 NPs, employed in this study, are fluorescent core-shell silica nanoparticles, synthesized through a micelle-assisted method, where the fluorescence energy transfer process, known as FRET, occurs at a high efficiency rate. Using flow cytometry and confocal microscopy, we observed that NTB 700 NP uptake seemed to be a rapid, concentration-, energy- and cell type-dependent process, which did not induce significant cytotoxic effects. We did not observe a preferred route of internalization, although their size and the possible aggregated state could influence their extrusion. At this level of analysis, our investigation focuses on lysosome and mitochondria pathways, highlighting that both are involved in NP co-localization. Despite the main mitochondria localization, NPs did not induce a significant increase of intracellular ROS, known inductors of apoptosis, during the time course of analyses. Finally, both lymphoid and myeloid cells are able to release NPs, essential to their biosafety.
Discussion: These data allow to consider NTB 700 NPs a promising platform for future development of a multifunctional system, by combining imaging and localized therapeutic applications in a unique tool.
Keywords: nanoparticles, uptake, intracellular trafficking, exocytosis, multifunctional tool
Introduction
Nanotechnology, historically defined as research and technology development at the atomic or molecular scale leading to the study and controlled manipulation of materials, devices and systems within a nanometer range, has achieved the status as one of the key technologies of the twenty-first century.1,2 Despite not being a newly discovered concept, nanotechnology and nanomaterials in general are, even today, a fascinating research area with multiple application potentials, especially in biomedical fields such as therapy and diagnostics. Since most biologically active macromolecules are natural nanostructures, operating in the same scale of biomolecules gives the great advantage to enhance the interaction with cellular components, as cell membrane and proteins.1,3 Thanks to their unique features of shape, size and charge, nanoparticles (NPs) appeared to be good candidates in a wide range of applications. Notably, NPs are widely used in biomedical applications as, owing to their small size, they can easily pass through the biological barriers and enter the cells to carry out their function.4 The development of nano-delivery technology, in particular, yields potential to overcome the blood-brain barrier (BBB), which hampers drugs from reaching their site of action and pose a tough challenge to drug delivery into brain. Therefore, NPs bring hope for neurodegenerative diseases, by encapsulating therapeutic molecules might increase the drug transport through the BBB and target relevant regions in the brain for regenerative processes.5,6
In order to apply NPs in drug delivery or imaging fields and reduce their toxicity, it is essential to study their specific endocytosis, exocytosis and clearance mechanisms in target cells.4,7,8 Understanding how NPs enter the cells is a key factor in determining their biomedical functions, biodistribution and toxicity.4,9 Several regulated processes with complex biomolecular interactions are involved in NP cellular uptake. Extracellular material could exploit multiple different cellular entry routes to cross cell plasma membrane, from passive diffusion to active transport. The latter, generally known as endocytosis, is an energy-dependent process used to describe various pathways and mechanisms of how cells communicate with biological environments. The interest for this field of study, currently evolving, is still high and researchers seek to further elucidate how NPs entry into cells and which mechanisms are employed10,11. The endocytic pathways are generally classified into five mechanistically different classes: clathrin-mediated endocytosis, caveolae-mediated endocytosis, clathrin- and caveolae-independent endocytosis, micropinocytosis and phagocytosis.10,12–14 Furthermore, NP intracellular trafficking and fate have a remarkable importance for their success as carriers designed to reach a specific target inside the cell and deliver specific biomolecules such as contrast agents, genes or drugs4,15,16. Once inside the cells, NPs are generally enclosed in intracellular vesicles and delivered through the cytoplasm, maybe trafficked along the endolysosomal network or shuttled with the help of motor proteins and cytoskeletal structures to reach some organelles.
Among sundry nanomaterials, silica NPs showed several advantages (hydrophilicity, stability in biological environment, optical transparency, ease of synthesis and low cost) and many fields of applications, such as cosmetics, food, pharmaceutical and medicine.17–19 Several studies have examined the toxicity of these NPs in different cell lines and amorphous silica NPs are generally considered biocompatible and harmless.18 In particular, the observed adverse effects are size and cell type dependent.20 NTB700 NPs, employed in this study, are fluorescent core-shell silica nanoparticles, synthesized through a micelle-assisted method. The most innovative feature of NTB700 NPs is the ability to be a platform where the fluorescence energy transfer process, known as FRET, occurs at a high efficiency rate.21 Besides being one of the most used “stealth” polymers in the drug delivery field, polyethylene glycol (PEG), part of NP shell, allows to modulate the type and number of functional groups exposed on NP surface11,22. As a consequence, PEG properties lead to the conjugation of several biomolecules on NTB700 NPs in addition to being the primary interface between NPs and cells, by influencing bio-distribution and toxicity.23,24
The present study provides insights about the characterization of fluorescent NP routes of internalization and exocytosis in lymphoid and myeloid cells. Furthermore, these mechanisms are related to the possible detection of cell death features. The use of U937 cells guarantees the possibility to collect data on a homogeneous, numerically plentiful, myeloid population, whereas PBMC cells allow for the simultaneous analysis of NP effects on many and varied important immune cells like B-cells, T-cells, monocytes and natural killer (NK) cells. Studying nanomaterial behaviour in these types of cells is fundamental since they will interact with NPs once introduced into the blood torrent.25
Materials and Methods
Nanoparticle Synthesis and Characterization
Multiple dye-doped nanoparticle (NTB700) preparation was carried out as previously described,21 with the addition of a fifth fluorophore, Cy5.5, to the others already used (TMB, DEB, Rhod and Cy5) to reach an emission wavelength of about 700 nm. Fluorescence characteristics (excitation and emission spectra) of NTB700 were achieved by Agilent Cary 60 UV-Vis spectrophotometer (Agilent Technologies, Santa Clara, CA, USA) and FP-6200 spectrofluorometer (JASCO EUROPE srl., Cremella, Co, Italy). FRET efficiency was calculated considering the emission intensity of the final acceptor and the average intensity of all four donors. NP concentration was estimated from the mass (mg) obtained by drying out all the water of a precise volume (mL) of NP suspension with a SpeedVac Concentrator (Heto-Holten A/S, Alleroed, Denmark). NTB700 size was measured by NanoSight tracking analysis (NTA): each sample was suspended in 1 mL of PBS pH 7.4 (dilution 1:1000) and loaded into the sample chamber of an LM10 unit (NanoSight, Malvern Instruments Ltd, UK). Data were expressed as mean ± SD of the five recordings. For a detailed morphological analysis, NPs were processed for transmission electron microscopy (TEM) observation using the conventional negative staining procedure. NPs isolated and diluted at two different concentrations (1:100, 1:1000) were adsorbed to formvar carbon-coated 200 mesh grids (Agar Scientific Ltd., Stansted, UK) for 10 min. Subsequently, the grids were incubated with 2% (w/v) sodium phosphotungstate for 1 min and the liquid excess was removed with filter paper. After negative staining, specimens were observed by means of a Philips CM10 transmission electron microscope at 80 kV. All physicochemical characteristics of NTB700 are summarized in Table 1.
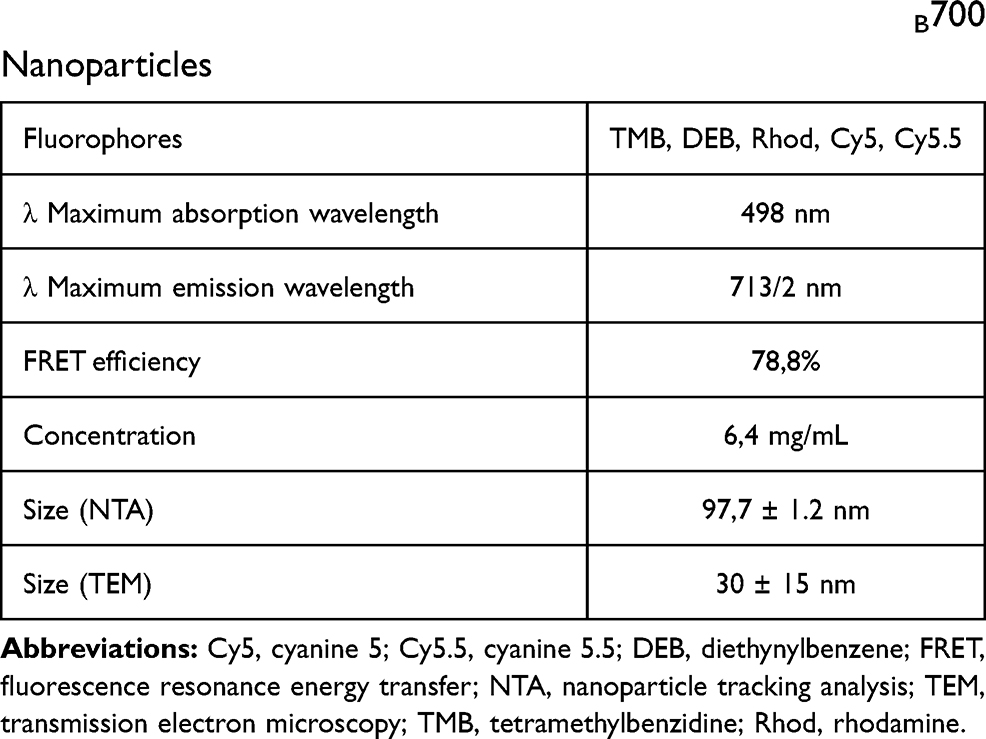 |
Table 1 Summary of Physicochemical Features of NTB700 Nanoparticles |
Nanoparticle pH Reactivity
NTB700 NPs were diluted 1:100 in four solutions at different pH (7.2, 5.5, 4.5 and 2.5) to simulate the various conditions inside the cellular compartments. NP suspensions were removed at different time points (0, 30 and 240 min) and analysed by flow cytometry for both physical and fluorescent properties.
Cell Culture
The U937 cell line (human myelomonocytic cell line; Sigma-Aldrich, St Louis, MO, USA) cells were grown at 37°C in humidified incubator with 5% CO2, in Roswell Park Memorial Institute Medium (RPMI) 1640 (Sigma-Aldrich, St Louis, MO, USA) with stable L-glutamine supplemented with 10% v/v heat-inactivated fetal bovine serum (FBS; Gibco; Thermo Fisher Scientific, Inc., Waltham, MA, USA) and 1% v/v penicillin/streptomycin (Sigma-Aldrich, St Louis, MO, USA).
The experimental protocol was performed according to the Helsinki Declaration of 1975 as revised in 2008 regarding ethical principles for medical research involving human subjects. No specific Ethical approval was required: in fact blood was obtained from healthy volunteers included in the Italian blood donor registry [registered Associazione Volontari Italiani del Sangue (AVIS) donors] and was provided by the S. Maria della Misericordia Hospital in Urbino. A formal agreement exists between the Hospital of Urbino and the Department of Biomolecular Sciences (DISB) for the use of blood and its product for laboratory application and the research in producing in vitro medical diagnostic devices.
Furthermore, human peripheral mononuclear cells (PBMCs) were obtained from buffy coats of anonymized donors, no personal patient information was made available. We employed only buffy coats (not for the treatment of patients but waste products for the blood transfusion center), blood donors were informed that parts of the donation that cannot be used for patient treatment may be used for scientific research and they provided their written consent. PBMCs were obtained by density gradient separation using a Ficoll-PaqueTM Plus solution (GE Healthcare, Little Chalfont, UK) and cultured in RPMI 1640 with stable L-glutamine supplemented with 10% v/v heat-inactivated fetal bovine serum (FBS) and 1% v/v penicillin/streptomycin and incubated at 37°C in humidified incubator with 5% CO2.
Nanoparticle Uptake
NP dispersions were prepared by diluting the stock solution, previously filtered with a 0.22 μm membrane filter (Euroclone SpA, Milan, Italy) under sterile environment, into complete medium used for cell culture at room temperature (to ensure better NP dispersion), immediately prior to the experiments on cells.
U937 and PBMC (5 × 10⁵ cells/well) were seeded separately into 6 or 12-well plates. To assess time-dependent NP internalization, a solution of NTB700 (64 µg/mL) was added to culture medium for different time points. To evaluate concentration-dependence, different concentrations (6.4, 12.8, 64 and 640 µg/mL) of NTB700 NPs were added and incubated for 1 h. Once estimated the better conditions of concentration and time (64 µg/mL for 1 h), all subsequent evaluations were carried out under these conditions.
After the incubation time, cells were collected by centrifuging (1200 rpm, 5 min) to remove the containing NPs medium and washed twice with PBS 1x (10 mM NaPi, 150 mM NaCl, pH 7.3–7.4). The quantification of NP incorporation into cells was carried out by measuring the mean fluorescence intensity (MFI), using a FACSCantoTM II flow cytometer (BD Biosciences), equipped with an argon laser (Blue, Ex 488 nm), a helium-neon laser (Red, Ex 633 nm) and a solid-state diode laser (Violet, Ex 405 nm). For each sample, at least 10,000 events were acquired. Data analyses were performed with Kaluza Analysis 2.1 (Beckman Coulter) and FACSDivaTM softwares (BD Biosciences).
Although a quantitative analysis was carried out in flow cytometry, a qualitative analysis was carried out by confocal microscopy. These analyses were applied by a Leica TCS SP5 II confocal microscope (Leica Microsystem, Germany) with 488, 543 and 633 nm illuminations and oil-immersed objectives. For confocal imaging, cells were seeded on MatTek glass bottom chambers (MatTek Corporation, Bratislava, Slovak Republic). The images were further processed and analysed in ImageJ software (NIH, Bethesda, MD, USA).
Cell Viability
NP toxicity was evaluated using propidium iodide (PI) staining, that is capable of binding and labelling DNA. Live cells, with intact cell membranes, are distinguished by the ability to exclude the dye that easily penetrate dead or damaged cells.26 Cells pellets were resuspended with 300 µL of PBS 1x and 5 µL of 1 mg/mL PI (Sigma-Aldrich, St Louis, MO, USA) was added per sample, incubated for 5 min in the dark at room temperature and analysed on flow cytometer. The % of PI positive cells was calculated using the following equation = [% of PI positive cells (cells exposed to NPs) - % of PI positive cells (cells untreated)].
Nanoparticle Uptake Inhibition
To investigate the energy-dependence of uptake mechanism, cells (5 × 10⁵ cells/well) were pre-incubated at +4°C and with a sodium azide (NaN3) solution (1 mg/mL) for 30 min, followed by the addition of NPs (64 µg/mL) for 2 h and, finally, cells were prepared and analysed by flow cytometry as previously described.
Known inhibitors of various endocytic processes were used to elucidate the mechanism of cellular uptake of NTB700 NPs. Cells (5 × 10⁵ cells/well) were pre-incubated with inhibitors of endocytosis: amiloride (30 µg/mL), chlorpromazine (5 µg/mL), genistein (20 µg/mL) and nocodazole (7.5 µg/mL) for 30 min, followed by the addition of NPs (64 µg/mL) for 2 h and, then, samples analysed by flow cytometry. Negative controls, ie, cells without the presence of drugs and/or NPs were also carried out. Moreover, cell viability was assessed after 2 h of exposure to each of the different inhibitors, including the energy-dependent conditions of +4°C and NaN3, by PI staining. All inhibitors were purchased from Sigma-Aldrich.
Intracellular Trafficking Studies
Cells (5 × 10⁵ cells/well) were exposed to NTB700 NPs (64 µg/mL) at different time points (1–48 h), washed and then stained with various cellular markers. 100 nM of the acidotropic dye LysoTrackerTM Green (LTG) (Thermo Fisher Scientific, Waltham, MA, USA) incubated for 45 min was used to investigate the involvement of lysosomal compartment.27 Mitochondrial features were investigated by Tetramethylrhodamine ethyl ester perchlorate (TMRE) (Sigma-Aldrich, St. Louis, MO, USA) 40 nM, which is a ∆Ψm-specific stain able to selectively enter active mitochondria, was added to the samples 15 min before the acquisition.28 50 μM monodansylcadaverine (MDC) (Sigma-Aldrich, St Louis, MO, USA), that is a specific autophagolysosomes marker typically used to investigate the autophagic machinery, was incubated for 10 min at 37°C.29 MitoSOX Red (Thermo Fisher Scientific) is a florigenic dye specifically targeted to mitochondria in live cells and its oxidation by superoxide (O2-), that is contained in mitochondria, produces a red fluorescence.30 MitoSOX 5 μM was added to the sample 10 min before the time of acquisition. Intracellular reactive oxygen species (ROS) content was measured with 5 μM 5-(and-6)-chloromethyl-2,7ʹ-dichlorodihydrofluorescein diacetate acetyl ester (CM-H2DCFDA, DCFDA) (Molecular Probes, Eugene, OR) incubated for 30 min at 37°C.31 Analyses were then performed by flow cytometry and/or confocal microscopy using the appropriate fluorescence channel.
PBMCs were, furthermore, stained with different monoclonal antibodies to define cell subsets: anti-CD5 (CRIS-1) for T lymphocytes, anti-CD14 (CB14) for monocytes, anti-CD16 (CB16) for natural killer and anti-CD19 (CB19) for B lymphocytes. All monoclonal Abs were produced and conjugated in AcZon (AcZon srl., Monte San Pietro, BO, Italy) with FITC or RPE, in order to have different emission channels compared to NTB700 NPs and perform a multiparametric analysis by flow cytometry. Fluorochrome-conjugated monoclonal antibodies were added to 50 μL of cell pellet, vortexed and then incubated for 20 min at RT. After the incubation time, samples were acquired by flow cytometry.
Colocalization analyses were performed using JACoP plugin in ImageJ software (NIH, Bethesda, MD, USA).32 Pearson’s correlation coefficient (PCC) was used as the parameter to measure colocalization in our samples.
Nanoparticle Release
Cells (5 × 10⁵ cells/well) were exposed to NTB700 NPs (64 µg/mL) for 1 h, harvested and then seeded again with 1 mL of RPMI 1640 complete medium to investigate NP extrusion after 24 h of incubation with fresh medium (NP-free). Cells were collected by centrifuging and both cells and supernatants analysed by flow cytometry, the former with the intracellular probes previously described, the latter with Dako CytoCountTM beads (Thermo Fisher Scientific, Waltham, MA, USA) for the evaluation and count of extracellular vesicles (EV) released by cells:30 300 μL of medium for each sample was carefully dispensed at the bottom of the tube and 25 μL of beads were added. Supernatants were also stained with anti-CD63-FITC (clone TEA3/18) (Immunostep, Spain), a classical marker of exosomes.33
Statistical Analyses
Data are shown as mean (or percentage, as indicated) ± standard deviation (sd) of at least three independent experiments. Analyses of variance (ANOVA) approaches were used to compare values among more than two different experimental groups for data that met the normality assumption. One-way ANOVA or two-way ANOVA were followed by a Bonferroni post-hoc test. The means of two groups were compared by using a T-test. The p values less than 0.05 were considered statistically significant. All statistical analyses were performed using GraphPad Prism 8.4.2 (GraphPad software, San Diego, CA, USA).
Results and Discussion
Characterization of NTB700 Nanoparticles
Based on van Blaaderen’s idea,34 Pellegrino et al presented how AcZon NPs are synthesized.21 NTB700 are core-shell dye-doped silica nanoparticles synthesized through a one-pot, two-steps reaction, known as micelle-assisted method, where surfactant is used to create a nanoreactor within which all the hydrophobic reagents arrange (Figure 1A). Thanks to the addition of ammonia and silane precursor, the base-catalysed hydrolysis of all the trialkoxysilanes takes place and leads to the formation of fluorescent monodisperse nanoparticles. Shell is composed by two different polyethylene glycols (PEG), both terminating with a trialkoxysilane: H3CO-PEG-Sil, the main component which induces stability and solubility in water and H2N-PEG-Sil, functionalized to have amine reactive groups on the shell. To obtain nanoparticles excitable with blue laser and emitting in the near-IR (known as NTB700), five different dyes, summarised in Table 1, were selected to be simultaneously and covalently entrapped into the silica core, so that they are not released over time. The strong interconnection reached inside the core leads to Florescence Resonance Energy Transfer (FRET). The number of fluorophores was modulated to obtain the maximum efficiency of the cascade transfer without inducing the self-quenching phenomenon, NTB700 reached about 80% of FRET efficiency. This value has been calculated considering the emission intensity of the final acceptor and the average intensity of donors as described in Material and Methods.
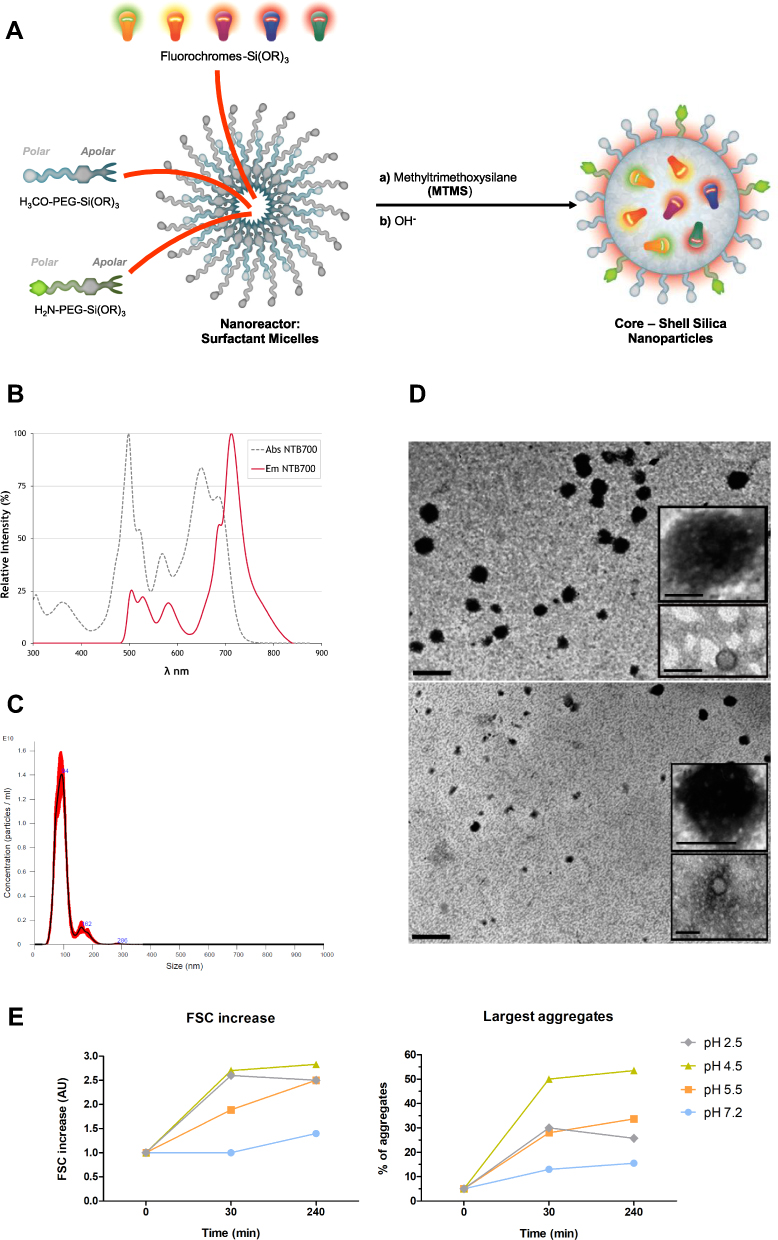 |
Figure 1 Synthesis, physicochemical characterization of NTB700 nanoparticles and pH reactivity. (A) Schematic representation of the synthesis of the core-shell silica nanoparticles, through a micelle-assisted method, where a surfactant is used to create a nanoreactor within which all reagents arrange. The base-catalysed hydrolysis of a silane precursor, along with different dyes functionalized with a trialkoxysilane group, able to covalently link to the silica matrix, leads to the formation of fluorescent monodisperse NPs. (B) Absorption (dotted grey line) and emission spectra (solid red line) of NTB700 nanoparticles. (C) NTB700 diluted 1:1000 analysed using a nanoparticle tracking analysis (NTA), results are represented as mean ± sd; n = 5. (D) Transmission electron microscopy (TEM) analysis of NTB700 diluted 1:100 (above) and 1:1000 (below), insert are enlargements of NP aggregates. Scale bar = 500 nm; insert scale bar = 100 nm. (E) NTB700 diluted 1:100 in buffers at different pH (2.5, 4.5, 5.5 and 7.2) and analysed by flow cytometry at three time points (0, 30 and 240 min) for FSC increase to investigate the presence of aggregates. |
NP size could influence their physicochemical properties and how they gain access into cells7 NTB700 size was characterized by NanoTracking Analysis (NTA), whose results showed NP size around 100 nm (Table 1 and Figure 1C), in contrast to previous results obtained with different technologies, such as dynamic light scattering (DLS) or atomic force microscopy (AFM) (data not shown), which revealed smaller NP size (around 10–20 nm). These differences probably depended on the tip pressure on the PEG shell for AFM technology, which gave us a smaller height of NPs, and, furthermore, we supposed the presence of aggregated form and a lower detection limit for NTA.35 The presence of aggregates was supported also by TEM analysis. Inserts of TEM images in Figure 1D show, indeed, the presence of NP aggregates with an average size of 100–150 nm. As concerning NP fluorescence characteristics, Figure 1B shows the absorbance and fluorescence emission spectra of NTB700 NPs, which are able to be excited with blue laser (488 nm) and emit in the near-IR (~700 nm) exploiting FRET phenomenon.
NTB700 pH Reactivity
Thanks to their small size and large surface-to-volume ratio, NPs possess exclusive and distinct properties that are useful for their numerous applications, which, mostly, need the interaction of nanomaterials with macromolecules like polymers and proteins. Proteins, notably, are charged molecules, and, in the physiological environment, are known to cover NPs immediately, governed by the resultant electrostatic interactions that are known to lead to nonspecific associations that are especially relevant to biological systems. The interaction between NPs and water components may result in the formation, or collapse of aggregates and this is mainly determined by their surface properties (eg, surface charge),36 which is controlled by the solution chemistry, eg, pH, ionic strength and surface coating by natural organic matter.37–42
Kumar et al examined the effect of pH on the interaction of NPs with medium at different pH values approaching the isoelectric point of protein. Interestingly, they found that at pH 9 a much greater amount of protein was required to aggregate all of the NPs as compared to that at pH 5.43 In agreement with such literature, Figure 1E shows that, by decreasing pH, NTB700 aggregation increased, reaching the maximum aggregate number at pH 4.5. These data fitted with the fact that with increasing pH the charge on protein decreases and the surface charge density of the NPs increases, which means more proteins will be required to mediate NP aggregation. However, we have to take in mind that protein content of RPMI medium is moderate in comparison to plasma. This pH-NP crosstalk will be interestingly linked to subcellular localization of nanoparticles, since the different intracellular districts and organelles exhibit different pH values.44
Time- and Concentration-Dependence of NTB700 Nanoparticle Uptake
To characterize how NTB700 nanoparticles are taken up by cells, we quantified their incorporation through flow cytometry, measured by mean intensity fluorescence (MFI) and variation in side scatter (SSC), supported by a qualitative analysis performed by confocal microscopy. The measurements were performed under different conditions: variation of the incubation time in order to see a time-dependence of NP uptake, the use of different concentrations for dose-dependence and modifying energy conditions of cell culture (next paragraph). NTB700 NPs were already internalized after 30 min of incubation at 37°C (Figure 2C), which demonstrated that these NPs translocate rapidly into the cells. The intensity of the side scatter (SSC) could be an index that NPs are taken up into cells, time-, dose- and size-dependently,45 since incorporated NPs change the SSC signal standing for cell granularity in flow cytometry.46 As suggested by Suzuki et al, we observed a variation of U937 SSC during investigated times and a simultaneously slight decrease of FSC values, without a correlation with cell death (Figure 2A and B). U937 cells showed a good tolerance of the uptake process with only the higher NP concentration (>64 µg/mL) presenting high percentage of PI positive cells (Figure 2E). We did not observe a significant change in cell viability and morphology for the cells treated with NTB700 nanoparticle compared to control during time (data not shown). It has been known that NP concentration can impact uptake efficiency,8 therefore the effects of concentration on NP uptake were investigated by applying several concentrations, ranging from 0 to 640 µg/mL, to the cells. As shown in Figure 2D the internalization of NTB700 increased in a concentration-dependent manner when incubated at 37°C.
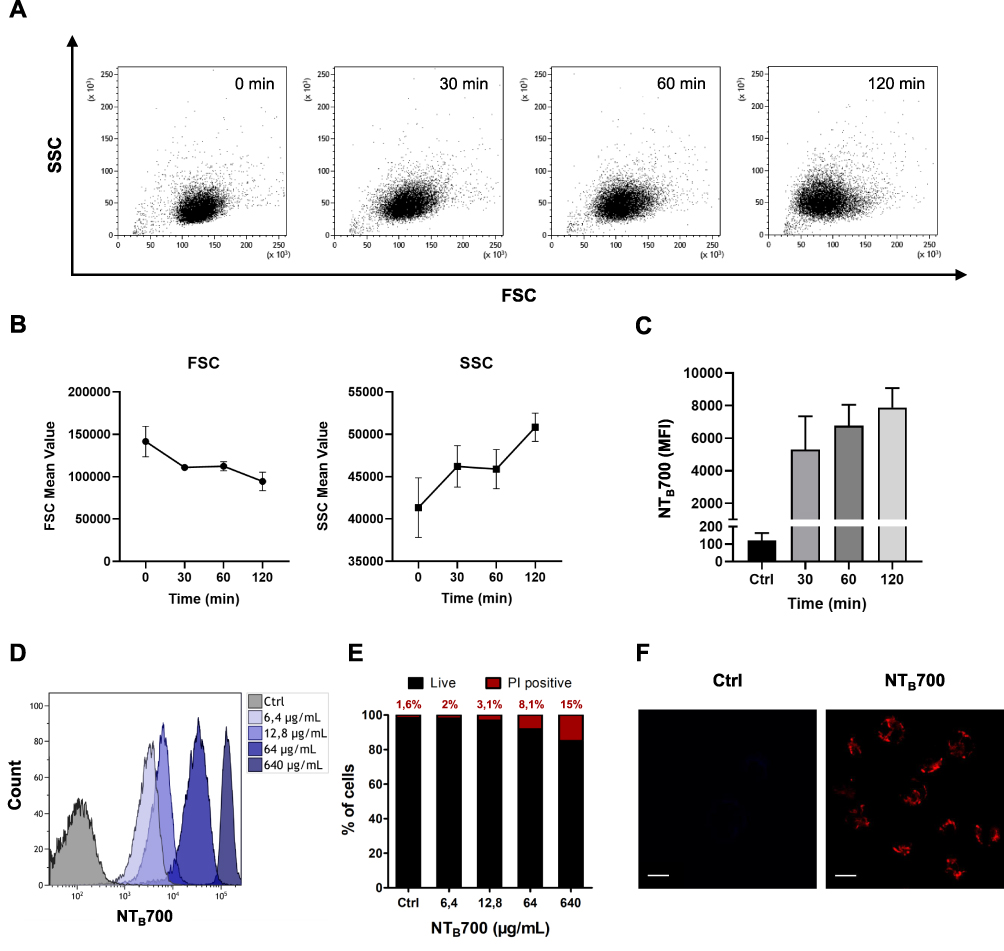 |
Figure 2 Kinetics NTB700 nanoparticle uptake in U937 cells. (A) U937 were incubated with 64 µg/mL NTB700 at several times (0, 30, 60 and 120 min). Dot plots (FSC vs. SSC) representing U937 treated with 64 µg/mL NTB700 nanoparticles during time. (B) FSC slightly decreased during time (above); cellular granularity (SSC values) increased in a time-dependent manner (below). (C) Time-dependence of NTB700 nanoparticle uptake in U937 cells. Mean Fluorescence Intensity (MFI) from the flow cytometry histograms is shown as a function of time. (D) Flow cytometry histogram overlay for cells treated for 1 h with different concentrations of NTB700 nanoparticles (0, 6.4, 64 and 640 µg/mL) (E) Cell viability of U937 loaded with increasing doses of NTB700 nanoparticles (0, 6.4, 64 and 640 µg/mL) determined by membrane permeability assay using Propidium Iodide (PI) and flow cytometry analysis to calculate the percentage of PI positive cells, indicating cell death. (F) U937 incubated for 1 h at 37°C with NTB700 nanoparticles (64 µg/mL), turned out best experimental conditions. Representative confocal images of Ctrl and NTB700 NPs-treated U937 cells. NTB700 in red. Scale bar = 10 µm. At least 10,000 events were analysed by flow cytometry for each experimental condition. |
NTB700 NP uptake into cells was further confirmed by confocal microscopy. Figure 2F shows U937 treated with nanoparticles (in red) and no fluorescence was detectable in the nuclei. NP fluorescence did not appear diffuse into cytoplasm but seems to be more internalized in round shapes, as indicating their localization into vesicles or organelles inside the cells. Flow cytometry data and images collected at different times allowed us to select the best experimental conditions (1 h incubation time and a concentration of 64 µg/mL) to be used in further studies.
Temperature- and Energy-Dependence of NTB700 Nanoparticle Uptake
NP entry and headway into cells is an active process, which requires energy to be performed,8 and it is widely known that active processes, in general, are inhibited at low temperature, because several proteins and enzymes are sensitive to temperature.47,48 In order to investigate whether NTB700 NP uptake was energy-dependent, the internalization of NPs was measured by flow cytometry at either 37°C (control) or +4°C. As expected, NP uptake in U937 at +4°C resulted in a very strong inhibition (greater than 90%), as shown in Figure 3. Several research groups with different types of NPs have reported the same behaviour.7,8,49,50 Eg, Dos Santos et al observed a stronger reduction of carboxylated-modified polystyrene (PS-COOH) NPs in different cell lines, in particular for those with a smaller diameter.7 Zeng et al showed a clear reduction of NP accumulation in MDA-MB468 cells.49 Furthermore, pre-treatment of cells with sodium azide (NaN3), which disturbs the production of ATP by blocking the electron transport chain, resulted in a clear reduced NP internalization. Nevertheless, NTB700 uptake decrease is less significant compared to the effect of temperature we observed. Other researchers obtained similar results.8,51 As proposed by Penaloza et al, NaN3, by inhibiting the ATP synthesis, reduces the intracellular content of ATP but cells could compensate by using exogenous ATP and allow NP entry.8 Nonetheless, our data, in agreement with earlier studies, indicated that NTB700 nanoparticles are internalized by an active energy-dependent process.
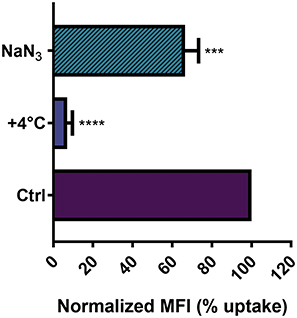 |
Figure 3 Effect of temperature and energy depletion on NTB700 nanoparticle internalization in U937. Cells were incubated with NTB700 (64 µg/mL) under different condition: control (NPs incubated at 37°C), +4°C and sodium azide (NaN3). The percentage of nanoparticle uptake was measured by MFI, determined through flow cytometry (2 independent replicas of 3 experiments), normalized with NP MFI values in normal condition at 37°C (Ctrl is 100% uptake). Asterisks denote a statistically significant difference effect of temperature and energy with their respective control (***p < 0.001, ****p = < 0.0001). At least 10,000 events were analysed by flow cytometry for each experimental condition. |
Investigation of NTB700 Nanoparticle Uptake Mechanism and Intracellular Fate: U937 Tumoral Cells
Future applications of fluorescent nanoparticles could be live cells labelling agents or drug carriers and both require knowledge of nanoparticle entry route and intracellular fate. Given the temperature- and energy-dependence of NTB700 uptake in U937 cells, we hypothesized that an endocytosis mechanism was responsible of their internalization. Furthermore, the images of NTB700 nanoparticles inside cells (Figure 2F) suggested that the intracellular fluorescence was contained in vesicles, likely endosomes, compatible with cell entry through one of the possible endocytic mechanisms. In order to study how NTB700 NPs gain access into cells, we pre-incubated cells with some inhibitors of the main routes of endocytosis, before the addition of NPs. Based on what is reported in literature and according to the manufacturer’s protocols, we used a different concentration for each pharmaceutical inhibitor (chlorpromazine, genistein, amiloride and nocodazole) (Table 2). NP uptake inhibition was measured only at short time, to avoid triggering the activation of other endocytic mechanisms to compensate the blockage of specific uptake pathways.7,52 In the course of this type of experiments, it is also required to assess the cellular toxicity of each pharmacological inhibitors employed, as a quality step prior to their co-incubation with NPs.7 Hence, we performed a cell viability assay through a PI staining after 2 h 30 min of exposure (by miming 30 min of pre-incubation with the inhibitor and 2h of co-incubation with both, inhibitor and NPs) to each different inhibitor, including the beforehand studied conditions of temperature and energy depletion with NaN3. The flow cytometry results (Figure 4A) showed the percentage of PI positive cells: this measurement highlighted the absence of a significant cell damage (≤10% cytotoxicity).
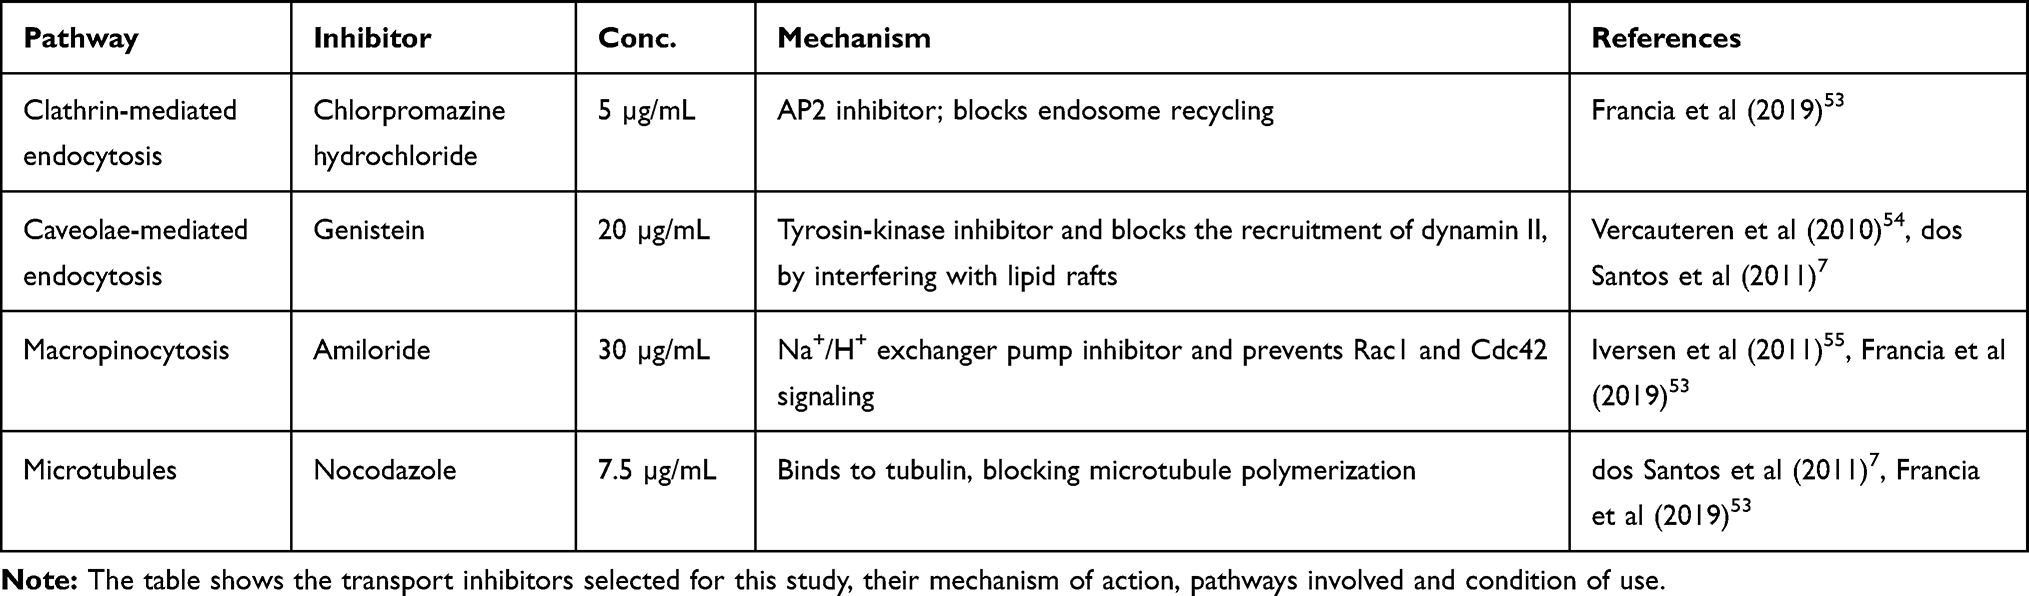 |
Table 2 Uptake Pathways and Inhibition Conditions |
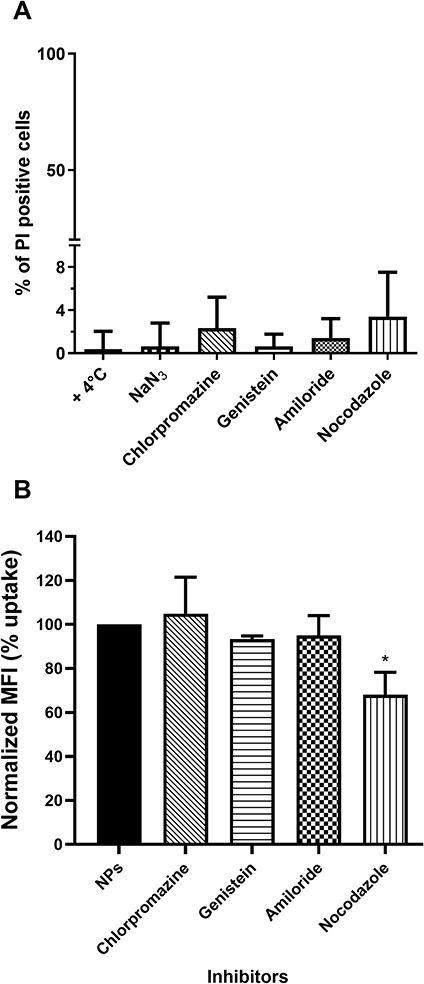 |
Figure 4 Effect of pharmacological inhibitors on cell viability and NTB700 endocytosis in U937 cells. (A) Cell viability assay performed through propidium iodide (PI) staining, analysed by flow cytometry, after 2 h 30 min of exposure to each one of the different inhibitors. Percentage of PI positive cells was calculated respect to control (untreated). (B) Effect of inhibitors on NTB700 internalization in U937. Cells were pre-treated with each one of the inhibitors (chlorpromazine, genistein, amiloride, nocodazole) for 30 min, followed by 2 h of exposure to NPs, in the presence of the same inhibitor, then washed and analysed by flow cytometry. Normalized MFI (mean fluorescence intensity) was calculated compared to “NPs” which is reported as 100% uptake (cells incubated with NPs in normal condition, at 37°C without inhibitors). Mean values and sd of 2 independent replicas of 3 experiments. Asterisks denote a statistically significant difference (*p < 0.05) between nocodazole and NPs. At least 10,000 events were analysed by flow cytometry for each experimental condition. |
Chlorpromazine is a cationic amphiphilic drug which interferes with clathrin-mediated endocytosis at multiple levels, as reported in Table 2.53 Genistein is a tyrosin-kinase inhibitor that blocks the recruitment of dynamin II and causes local disruption of actin filaments, by interfering with lipid rafts, and disturbs the caveolae-mediated endocytosis.7,54 NTB700 uptake and its inhibition was evaluated by measurement of intracellular fluorescence by flow cytometry and was compared to that for control cells, that had been exposed to NTB700 in the absence of drug (Figure 4B). Results showed no significant reduction of NP uptake for either chlorpromazine and genistein, thus indicated that NTB700 do not enter the cells via clathrin- and caveolae-mediated endocytosis. Similarly, we observed a lack of inhibition upon amiloride treatment, which is an inhibitor of micropinocytosis by blocking the Na+/H+ exchanger pump and the resulting acidification interferes with the cytosolic pH close to the cell membrane where macropinosomes form and blocks other signaling essential for micropinocytosis.53,55 A statistically significant inhibition was instead observed for nocodazole treatment, which is a microtubule disruptor by blocking their polymerization. It is notably known that the cytoskeleton plays an important role in several cellular events, including endocytosis and trafficking of vesicles inside the cell.7 Our results showed that NTB700 enter the cells probably exploiting several routes of internalization, because no one of these investigated vias was more involved than the others, and once inside the cells, free or entrapped in vesicles, NPs are translocated along microtubule-depending shuttles. Among all methods employed to study NP internalization, the use of pharmacological inhibitors is often chosen thanks to their fast action and ease of use. Nevertheless, inhibitors have shown several limits such as poor specificity, toxicity and many researchers reported that their efficacy could be highly cell line dependent.7,53–56
After internalization via one or more of the endocytic pathways, nanoparticles are transported and trafficked along the endolysosomal network within plasma-membrane bounded compartments, vesicles, to reach their destination. These vesicles travel in complex trafficking patterns and it is a hard goal to completely detail the intracellular events that take place once nanoparticles are inside the cells.10,12 NPs can reach several intracellular compartments: among these endosome or lysosome, mitochondria, nucleus, endoplasmic reticulum, and Golgi apparatus.57,58 However, at this level of analysis, our investigation focuses on lysosome and mitochondria pathways. Since lysosomes deal with the digestion of the foreign material taken up by the cells from outside,59 it is important to understand their involvement in NP uptake and management. To confirm that NP reached lysosomes, we investigated whether nanoparticles colocalized with LysoTrackerTM green (LTG), a permeable dye which stains acidic compartments in live cells (lysosomes), by confocal microscopy. As shown in Figure 5A, NTB700 partially colocalized with these organelles, to indicate that NPs were internalized and trafficked to lysosomes.
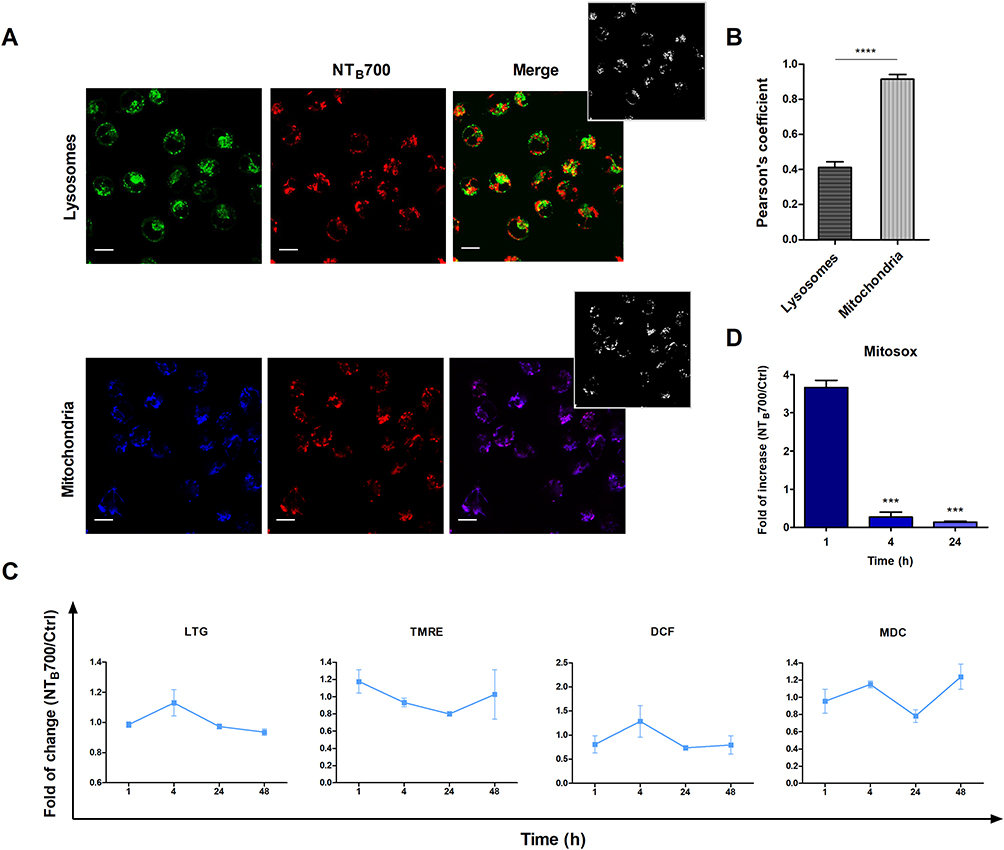 |
Figure 5 Lysosomes and mitochondria involvement in NTB700 uptake in U937 cells. (A) Representative confocal images of lysosomal (above) and mitochondria (below) involvement in U937 cells incubated for 1 h at 37°C with NTB700 (64 µg/mL) and then stained with LTG and TMRE. Figure shows LTG (green), TMRE (blue), NTB700 nanoparticles (red) and merged images (on the right); orange and violet indicate colocalization. Scale bars: 10 µm. Insert: binary version of merged images. The colocalization mask was generated by Image J software to show colocalization pixel. (B) Pearson’s colocalization coefficient (PCC) of LTG and TMRE with NTB700 in U937 cells. Pearson’s coefficients were derived from three completely independent experiments with >10 fields per experiment contributing to the cumulative result. Each value is expressed as PCC ± sd; asterisks denote a statistically significant difference (****p < 0.0001) between strains. (C) Flow cytometry analysis of lysosomes (LTG), mitochondria (MTG), ROS production (DCF) and autophagolysosomes formation (MDC) expressed as fold of change calculated as the ratio between cells incubated with NPs (64 µg/mL) and control cells. 1 value indicates no differences between treated and untreated. (D) Flow cytometry analysis of O2- production (MitoSOX) expressed as fold of change calculated as the ratio between cells incubated with NPs (64 µg/mL) and control cells at different time points (1, 4 and 24 h). Asterisks denote a statistically significant difference (***p < 0.001) between strains. At least 10,000 events were analysed by flow cytometry for each experimental condition. |
Interestingly, we observed an almost complete colocalization with other important organelles, which have unique features and participate to numerous cell functions:60 mitochondria. We stained U937, previously loaded with NPs, by using TMRE (tetramethylrhodamine, ethyl ester), which is a cell-permeant and cationic dye sequestered by active mitochondria. We performed a colocalization analysis, by using JACoP plugin in ImageJ,32 and Pearson’s correlation coefficient (PCC) was used as a standard to measure colocalization between NTB700 NPs fluorescence and fluorescence of LTG and TMRE, respectively. Histogram in Figure 5B shows an almost complete colocalization of NPs with mitochondria, with a PCC value of about 0.91 ± sd. This behaviour is quite evident in the colocalization masks in which pixels with positive signals for both probes are shown in white. Since the observed marked involvement of mitochondria after NTB700 internalization, we decided to further investigate the effect of NPs on these organelles, which also participate in the production and management of reactive oxygen species (ROS). After 1 h of incubation with NTB700, we observed a substantial stability in ROS content (mainly H2O2), detected by CM-H2DCFDA (DCF), whereas after 4 h, we could observe a moderate ROS increase, combined with a mild drop of mitochondrial membrane potential (MMP), this drop was further accentuated at 24 h and then rose again after 48 h, the last time of our analyses (Figure 5C). Besides mitochondria status, DCF fluorescence informed us that H2O2 had turned approximately to the starting values. The contemporary evaluation of the contribute of O2- to the ROS pool by MitoSOX is shown in Figure 5D and depicted a scenario in which during the first phase of NP uptake and the concomitant mitochondria internalization, the main produced component of ROS was O2-. After 4 h, this oxygen radical significantly dropped, highlighting an increased level of hydrogen peroxide. Superoxide and/or hydrogen peroxide can be generated from the major sites at high rates both in the mitochondrial matrix and on the cytosolic side of the mitochondrial inner membrane.61 Therefore, U937 cells exposed to NTB700 NPs (at this concentration) showed to have antioxidant defences capable of overcoming oxidative stress and recovering the redox balance, minimizing cytotoxicity (as demonstrated by PI test). Usually, the amount of ROS generated, and the related oxidative stress, are correlated with the nanomaterial concentration to which cells are exposed. Generally, the mitochondrial membrane hyperpolarization is associated with ROS production, although, a part of literature about NP uptake reveal a decrease in ROS production, as effect of the size of foreign material internalized by the cells.62
LTG (specific for lysosome network) and MDC (labelling acidic endosomes, lysosomes, and, particularly, late-stage autophagosomes) demonstrated an almost complementary trend, during the time-course investigated (Figure 5C). Of note, data collected after 48 h for these two parameters, confirmed a restoration of a balanced intracellular status (data not shown). Furthermore, the cross-evaluation of these data, allowed us to ascribe the increase of MDC fluorescence to acidic endosomes, and late-stage autophagosomes, since LTG fluorescence did not peak, but it reached a plateau already at 24 h, lasting up to 48 h. Such scenario suggested the involvement of the secretory/autophagic pathway, including the exosome release. In fact, exosome biogenesis occurs during the process of endosomal maturation. This process starts with endocytosis and ends with the degradation of the endosomal content by fusion with lysosomes. However, during endosomal maturation, endosomes no longer fuse with small endocytic vesicles. These multivesicular endosomes are also called late endosomes or multivesicular bodies (MVB). At this point, intraluminal vesicles can be degraded by lysosomes or released to the extracellular environment as exosomes.63 NP release in the extracellular medium was analysed in tumour myeloid cells, whereas specific step of the process was investigated on normal counterparts: peripheral blood mononuclear cells (PBMCs) (see next paragraphs).
Investigation of NTB700 Nanoparticle Uptake Mechanism and Intracellular Fate: Peripheral Blood Mononuclear Cells (PBMCs)
Working with peripheral blood mononuclear cells (PBMCs) gives the great advantage to perform a simultaneous analysis of NP effects on several important immune cells such as B-cells, T-cells, monocytes and natural killer (NK) cells. Furthermore, studying nanomaterial behaviour in these types of cells is crucial since they will interact with NPs once introduced into the blood torrent.25 We investigated NTB700 behaviour in PBMC, based on results previously obtained on tumoral U937 cell line. Firstly, we incubated PBMCs with NTB700 (64 µg/mL, as best beforehand condition) for different times, from 1 h to 48 h. We observed that fluorescence (=internalized NPs) increased in a time-dependent manner, both for lymphocytes and monocytes (gating strategy based on morphological features on FSC vs. SSC dot plot), as for U937 cells (Figure 6A), even if for lymphocytes was not so evident because of the lower fluorescence signal. NPs are foreign agents and monocytes, which are described as “professional” phagocytic cells, are expected to directly participate in NP internalization, degradation and removing from bloodstream and tissues, thanks to their immune activity.46,64 As expected, monocytes showed, indeed, the strongest fluorescent signal increase, therefore a much larger NP entry (Figure 6A). Interestingly, after 48 h of incubation with NPs, both lymphocyte and monocyte populations showed a decreased fluorescence. The maximum NPs uptake was at 24 h and then, after a plateau, the exocytic pathway started to overbear the endocytic one and NPs were released from the cells. The various cell types were identified by staining with monoclonal antibodies, specific for PBMC subpopulations: CD5 for T lymphocytes, CD19 for B lymphocytes, CD16 for NK cells and CD14 for monocytes.65 Among lymphocyte subpopulations, NK cells (CD16+) showed the highest NP internalization (Figure 6B). Confocal analysis confirmed NP internalization in PBMC cells (Figure 6C), and after 4 h of incubation, we did not observe different intensities of fluorescence (data not shown). Given that each NP has its own characteristic and each cell type reacts differently to external influences, interactions between NPs and one cell type cannot be generalized. Studying immunomodulatory effects of engineered NPs is challenging and of high importance.66 Among the different PBMC subsets, as previously showed, we observed a higher amount of NPs and a contemporary increase autophagosome formation/single cell in monocytes (Figure 7B). Monodansylcadaverine (MDC) staining, a specific autophagolysosome marker, was used to investigate the involvement of the autophagic machinery in NTB700 uptake to investigate whether NPs/cell incubation may trigger autophagy. Wu et al67 observed that induction of autophagy by Superparamagnetic Iron Oxide Nanoparticles (SPIONs) had an important role in the survival and function of human monocyte cells, as they form the first line of defence in the body’s immune system and the door for NPs into the human body. In monocytes, we also had a contemporary decrease of MMP during time and a higher production of ROS compared to lymphocytes (Figure 7B and C), more evident at 4 h of incubation with NTB700. Furthermore, the ROS decrease after 4 h may depend on the clearance of damaged mitochondria, where NPs colocalized. These findings correlate with those ones from TMRE and LTG fluorescence and suggested an ongoing mitophagic pathway (that further investigations will clarify).
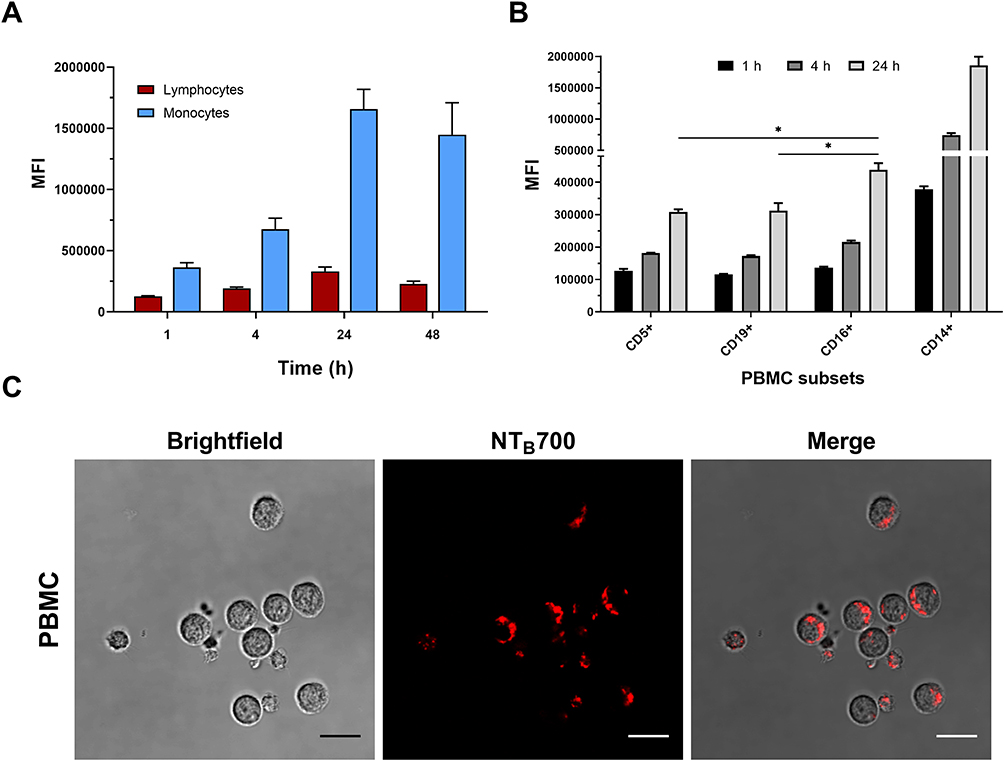 |
Figure 6 Kinetics of NTB700 uptake and confocal images of NP internalized in peripheral blood mononuclear cells (PBMCs). (A) PBMCs were incubated at 37°C with 64 µg/mL NTB700 at different time points (1, 4, 24 and 48 h). Lymphocyte (red) and monocyte (light blue) populations were selected through a gating strategy on FSC vs. SSC dot plot (Figure S1). Mean Fluorescence Intensity (MFI) from the flow cytometry histograms is shown as a function of time in hours. (B) PBMCs were incubated at 37°C with 64 µg/mL NTB700 at different time points (1, 4 and 24 h), washed and then stained with several mAbs to identify four PBMC subsets: CD5+ (T lymphocytes), CD19+ (B lymphocytes), CD16+ (NK cells) and CD14+ (monocytes). Asterisks denote a statistically significant difference (*p < 0.05) between 24 h strains. (C) Light and fluorescent images of PBMCs incubated for 1 h at 37°C with NTB700 nanoparticles (64 µg/mL). Representative confocal images of NTB700 nanoparticles uptake in PBMCs: brightfield (on the left), fluorescent nanoparticles inside cells (in the middle) and merged images (on the right). NTB700 in red. Scale bar = 10 µm. At least 10,000 events were analysed by flow cytometry for each experimental condition. Error bars represent sd. |
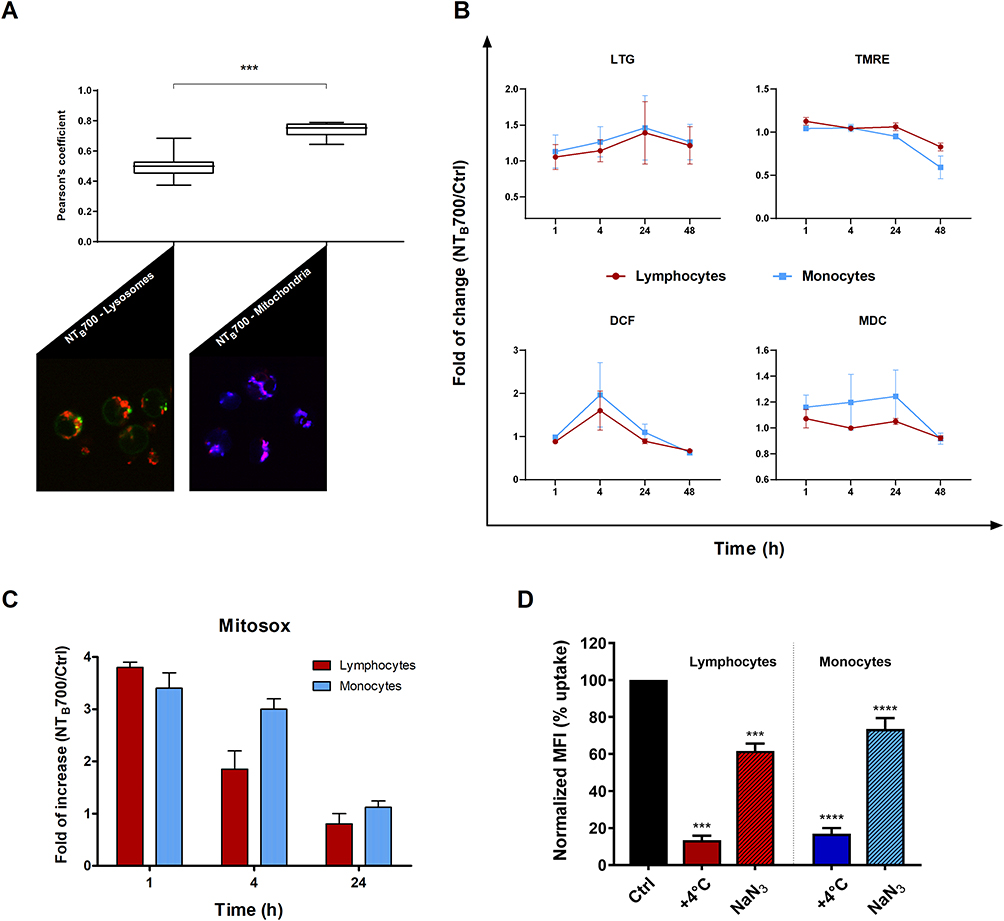 |
Figure 7 Assessment of lysosomes and mitochondria involvement in NTB700 uptake in PBMCs. (A) Pearson’s colocalization coefficient (PCC) of lysosomes (LTG) and mitochondria (TMRE) with NTB700 in PBMC cells. Pearson’s coefficients were derived from three completely independent experiments with >10 fields per experiment contributing to the cumulative result. Each value is expressed as PCC ± sd; (***p < 0.001). Below representative confocal images of lysosome (left) and mitochondria (right) colocalization in PBMC cells incubated for 1 h at 37°C with NTB700 nanoparticles (64 µg/mL) and then stained with LTG and TMRE. Figure shows LTG (green), TMRE (blue), NTB700 nanoparticles (red) and, respectively, orange and violet indicate colocalization. (B) Flow cytometry analysis of PBMCs incubated at 37°C with 64 µg/mL NTB700 at different time points (1, 4, 24 and 48 h) washed and then stained LTG, TMRE, DCF and MDC. Fold of change, calculated as the ratio between cells incubated with NPs and control cells (w/o NPs), from the flow cytometry histograms is shown as a function of time in hours. 1 value indicates no differences between treated and untreated. (C) Flow cytometry analysis of O2- production (MitoSOX) expressed as fold of change calculated as the ratio between cells incubated with NPs (64 µg/mL) and control cells at different time points (1, 4 and 24 h). Mean values and sd of 2 independent replicas of 3 experiments. Asterisks denote a statistically significant difference (***p < 0.001) between strains. (D) Effect of temperature and energy depletion on NTB700 nanoparticle internalization in PBMC. Cells were incubated with NTB700 (64 µg/mL) under different condition: control (NPs incubated at 37°C), +4°C and sodium azide (NaN3). The percentage of nanoparticle uptake was measured by MFI, determined through flow cytometry (2 independent replicas of 3 experiments), normalized with NP MFI values in normal condition at 37°C (Ctrl is 100% uptake). In red (on the left) lymphocyte data and in blue/light blue (on the right) monocyte data. Asterisks denote a statistically significant difference (***p < 0.001; ****p < 0.001) compared to control. At least 10,000 events were analysed by flow cytometry for each experimental condition. |
As previously investigated on U937, we observed a different amount of colocalization of NPs with two important organelles, such as lysosomes and mitochondria, in PBMCs (Figure 7A). The colocalization is higher with mitochondria but not as much as we stated for U937 (PCC value of about 0.74 ± sd), where we showed an almost complete colocalization with a PCC value near 1. The pharmacological inhibitors we used for U937 cells, to investigate NP endocytosis, did not give significant results for PBMC (data not shown), maybe because the heterogeneity of the populations made this analysis more complicated. On the contrary, the effect of temperature and energy depletion on NTB700 entry in PBMC gave the results we guessed: a strong inhibition depending on temperature and a lower decrease in internalized fluorescence concerning NaN3 treatment (Figure 7D). Our data indicated that NTB700 nanoparticles in myeloid and lymphoid cells are internalized by an active energy-dependent process, as for the monocyte immortalized tumour cell line beforehand investigated.
NTB700 Nanoparticle Release: From Tumoral to Normal Counterparts
Compared to the investigations of NP endocytic pathways, relatively little effort has been done to study NP excretion from cells. How NPs evolve inside the cells before the extrusion is less discussed, although such information would provide fundamental guidance in their design for practical drug/imaging applications to evaluate their biosafety.14,68 NPs may be excreted from cells due to a dynamic intracellular transport and trafficking process, through vesicles, or directly translocated from the cytoplasm across cell membrane into the extracellular space, which is much less favoured than vesicles-mediated exocytosis.10 It is known that both endo- and exocytosis processes occur simultaneously. As suggested by Sakhtianchi et al,68 the most common approach to study NP release is to seed cells, previously incubated with NPs, with fresh medium (NP-free). U937 were exposed to NTB700 (64 µg/mL) for 1 h, harvested and then seeded again with NP-free medium. The supernatants removed after 1 h of incubation and after 24 h of incubation with NP-free medium were then analysed by flow cytometry, following the addition of Dako CytoCountTM beads as internal control (Figure 8A).69 Results showed that there is always an amount of extracellular vesicles (EVs) secreted by the cells (without treatment) and also in medium without cells, as it is well known FBS contains a significant amount of EVs.70 Cells treated with NTB700 and then exposed to NP-free medium had higher number of EVs compared to control cells, maybe because the presence of NPs inside the cells stimulated the exocytic process. The analysis of the fluorescence of the extruded vesicles confirmed that NPs were released from cells after 24 h (Figure 8B).
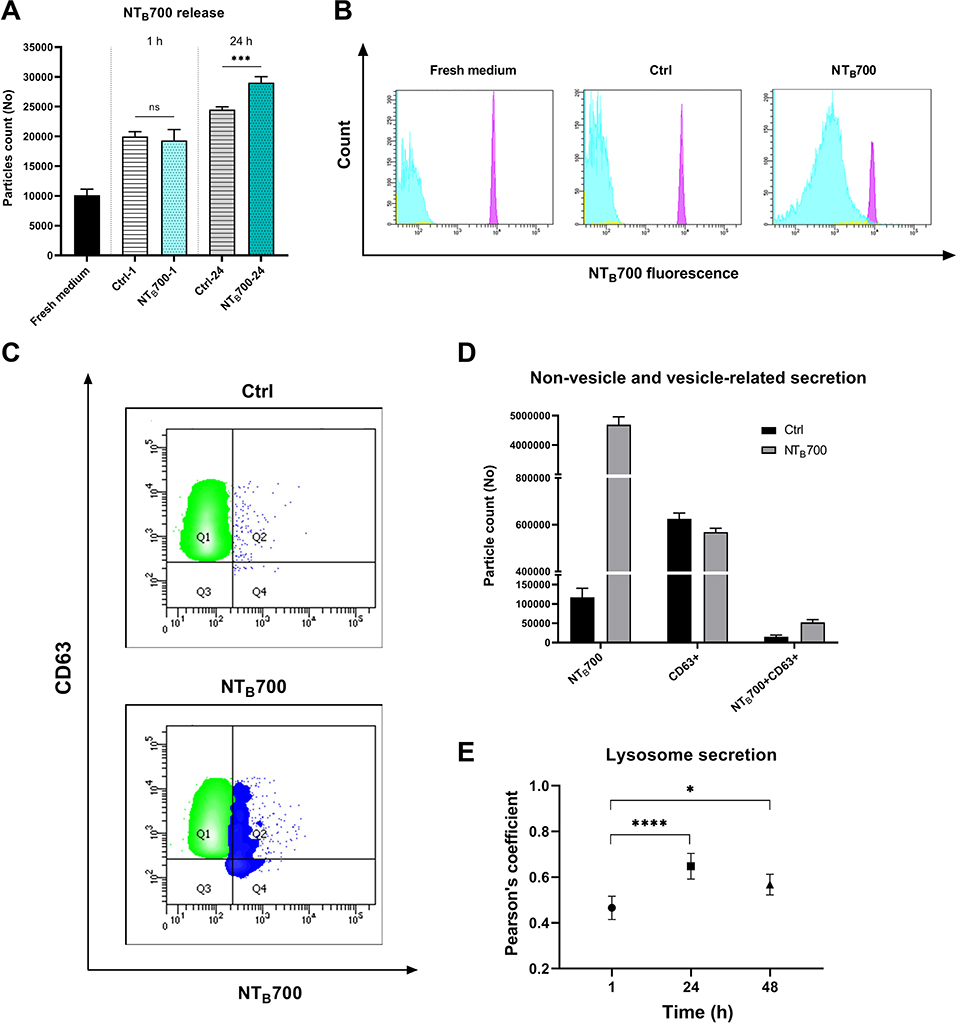 |
Figure 8 NTB700 release studies in U937 and PBMC. U937 were incubated with NTB700 (64 µg/mL) for 1 h, harvested and then seeded again with fresh medium (NP-free). The supernatants of all conditions (treatment of 1 h and 24 h after incubation in fresh medium following 1 h of NTB700 treatment) have been analysed by flow cytometry. (A) Histogram shows the quantification of extracellular vesicles (EVs) counted by using Dako CytoCountTM beads in fresh medium and released by the cells in 1 h of treatment or after 24 h of incubation in fresh medium following 1 h of NTB700 treatment or control cells, in the same experimental conditions. Asterisks denote a statistically significant difference (***p < 0.001) between 24 h strains. (B) Flow cytometry histograms showing the fluorescence of particles in NTB700 channel (violet peak represents Dako Cyto CountTM beads, light blue peak represents particles released based on gates in FSC vs SSC dot plot). Cells incubated with NPs presented a marked peak in NTB700 fluorescence channel (histogram on the right) compared to fresh medium and control cells (without NPs), which showed the ability of cells to excrete NPs after their internalization. (C) Flow cytometry contouring plots (fluorescence of particles in NTB700 channel vs. CD63 fluorescence) of supernatants of control (above) and treated cells (below) after 24 h in fresh medium, presenting in green CD63+ particles and in blue NTB700+particles. (D) Non-vesicle and vesicle-related secretion. PBMCs were incubated with NTB700 (64 µg/mL) for 1 h, harvested and then seeded again with fresh medium (NP-free). The supernatants have been analysed by flow cytometry. Histogram shows the quantification of extracellular vesicles (EVs) counted by using Dako CytoCountTM beads and CD63+ particles released by the cells after 24 h of incubation in fresh medium following 1 h of NTB700 treatment or control cells in the same experimental conditions w/o NPs. (E) Pearson’s colocalization coefficient (PCC) of LTG with NTB700 in PBMC varying during time to investigate lysosome particle secretion. Pearson’s coefficients were derived from three completely independent experiments with >10 fields per experiment contributing to the cumulative result. Each value is expressed as PCC ± sd; Asterisks denote a statistically significant difference (*p < 0.5, ****p < 0.0001) between strains. At least 50,000 events were analysed by flow cytometry for each experimental condition. |
Also PBMC after NTB700 exposure for different time points (1, 4 and 24 h) were seeded with fresh medium to investigate more in deep NP release on normal counterparts Mediums were stained both with Dako CytoCountTM and CD63 monoclonal antibody, a typical exosome marker to study the EVs secreted by the cells during the incubation in fresh medium (w/o NPs).33 Results in Figure 8D showed that NTB700 were released partially by the endosomal route (CD63+), visually evident in dot plots in Figure 8C, and directly into the extracellular space (EV with only NTB700 fluorescence). Furthermore, the confocal images colocalization studies between NTB700 and LTG (lysosomal dye) of PBMC loaded with NPs and then incubated in fresh medium indicated that the colocalization varied during time. After 24 h the colocalization between NTB700 and lysosomes increased compared to early time points (Figure 8E), suggesting that NPs are taken up into endocytic compartments, which are firstly transported and only later fused with lysosomal compartments. Hsiao et al and Rawi et al reported similar kinetics in their studies.20,71 These results indicated that also the lysosomal exocytosis was involved in NP extrusion from cells. In terms of biosafety, these data indicated the ability of cells (both tumoral and normal) to remove NPs once internalized. It has a considerably importance in the perspective of NTB700 future employments, such as imaging or drug delivery, in particular for in vivo applications.
Conclusion
In this study, we investigated the cellular uptake and intracellular fate of multiple dye-doped silica NPs, NTB700, into lymphoid and myeloid cells (U937 tumoral cell line and PBCMs). Results showed that the internalization process is time-, concentration-, energy- and cell type-dependent. Among the immune cells we examined, monocytes, described as “professional” phagocytic cells, strongly participate in NP internalization. We observed, both with NTA and TEM, a partially aggregated form of NPs, present together with the monodisperse one, which is also influenced by pH. The aggregation increased at low pH, compared to physiological one, and this will influence their internalization, trafficking inside the cells and, as a consequence, their release. Our results highlighted that NTB700 NPs did not have a preferred route of internalization, once inside the cells NPs were transported within plasma-membrane bounded vesicles along microtubules to organelles, as lysosomes and, in particular, mitochondria, but without affecting cell viability (Figure 9). Cells did not go to death but we may hypothesize a slight arrest of cell growth. As concerning ROS formation (both species hydrogen peroxide and superoxide), in general, we observed that quantitively the ROS produced by PBMCs were in lower amount than U937, which are the tumoral counterparts. This finding might suggest the use of NPs in combination with other drug treatments to potentiate their cytotoxic effect. As previously mentioned, the toxic potential of NPs is dependent on their size and shape, which determined their propensity to induce the generation of ROS. Usually, following exposure to NPs, the intracellular generation of ROS sharply increases but, in our model, although an initial ROS overexpression was detected, mitochondrial respiration was not substantially impaired. Cells were viable after 72 h, and we can affirm that absolutely lack catastrophic consequences of the studied NPs on cells, due to moderate and temporary ROS increase. Further experiments will take into account intracellular antioxidant pool. However, the permanence of mild H2O2 content up to 48–72 h propelled us to remind that H2O2 might act as a signaling molecule or lead to oxidative damage of biomolecules, depending on the cellular context, its local concentration, and the kinetics of its production and elimination.72 Finally, both lymphoid and myeloid cells were able to release NPs and this is essential for their biosafety and future developments (Figure 9). In particular in PBMCs, we studied several ways of releases of NTB700 from cells, both conventional and unconventional secretion systems, suggesting that lysosomal fusion could be triggering by an autophagy event. In conclusion, all these data allow to consider NTB700 nanoparticles promising platform for future development of multifunctional systems. Exploiting the functional groups on the shell surface, we would conjugate a cytotoxic drug, in addition to the targeting molecule, to combine imaging and therapeutic applications in a unique tool. Further experiments are planned to adequately investigate these aspects.
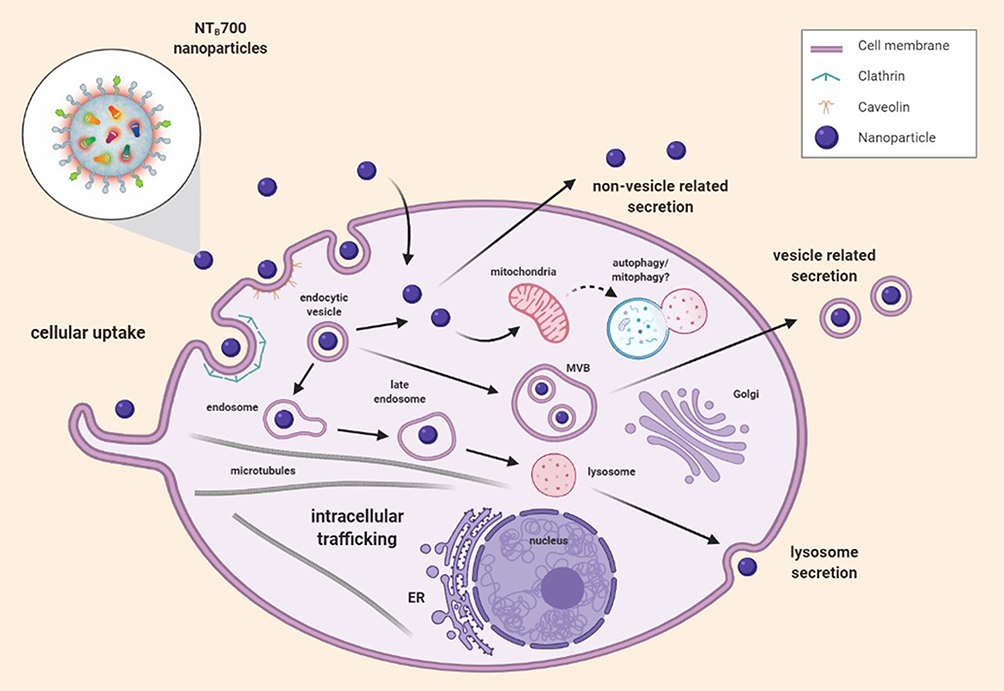 |
Figure 9 Representative scheme of NTB700 uptake, intracellular trafficking pathways and release. |
Acknowledgments
We want to thank the transfusion Center of The Hospital of Urbino “S. Maria della Misericordia”, in particular Dr Giuseppe Furlò. Furthermore, our gratitude also goes to AcZon srl for providing the NPs, object of our study.
Disclosure
Federica Sola, Angela Volpe, Chiara Barattini, Chiara Pellegrino, and Alfredo Ventola are employees of Aczon srl. Stefano Papa (Professor at University of Urbino) has a collaboration with Aczon srl, and Alfredo Ventola is the manager of Aczon srl. AcZon srl provided some materials needed for the study; however, AcZon srl had no influence on results generated in this work. The authors report no other potential conflicts of interest for this work.
References
1. McNeil SE. Nanotechnology for the biologist. J Leukoc Biol. 2005;78(3):585–594. doi:10.1189/jlb.0205074
2. Nagamune T. Biomolecular engineering for nanobio/bionanotechnology. Nano Converg. 2017;4(1):9. doi:10.1186/s40580-017-0103-4
3. Mahapatro A, Singh DK. Biodegradable nanoparticles are excellent vehicle for site directed in-vivo delivery of drugs and vaccines. J Nanobiotechnology. 2011;9(1):55. doi:10.1186/1477-3155-9-55
4. Foroozandeh P, Aziz AA. Insight into cellular uptake and intracellular trafficking of nanoparticles. Nanoscale Res Lett. 2018;13(1):1–12. doi:10.1186/s11671-018-2728-6
5. Saraiva C, Praça C, Ferreira R, Santos T, Ferreira L, Bernardino L. Nanoparticle-mediated brain drug delivery: overcoming blood-brain barrier to treat neurodegenerative diseases. J Control Release. 2016;235:34–47. doi:10.1016/j.jconrel.2016.05.044
6. Luo Y, Yang H, Zhou YF, Hu B. Dual and multi-targeted nanoparticles for site-specific brain drug delivery. J Control Release. 2020;317:195–215. doi:10.1016/j.jconrel.2019.11.037
7. Dos santos T, Varela J, Lynch I, Salvati A, Dawson KA, Schnur JM. Effects of transport inhibitors on the cellular uptake of carboxylated polystyrene nanoparticles in different cell lines. Schnur JM, ed. PLoS One. 2011;6(9):e24438. doi:10.1371/journal.pone.0024438
8. Peñaloza JP, Márquez-Miranda V, Cabaña-Brunod M, et al. Intracellular trafficking and cellular uptake mechanism of PHBV nanoparticles for targeted delivery in epithelial cell lines. J Nanobiotechnology. 2017;15(1):1. doi:10.1186/s12951-016-0241-6
9. Liu X, Wu F, Tian Y, et al. Size dependent cellular uptake of rod-like bionanoparticles with different aspect ratios. Sci Rep. 2016;6(1):1–10. doi:10.1038/srep24567
10. Donahue ND, Acar H, Wilhelm S. Concepts of nanoparticle cellular uptake, intracellular trafficking, and kinetics in nanomedicine. Adv Drug Deliv Rev. 2019;143:68–96. doi:10.1016/j.addr.2019.04.008
11. Ding L, Lian Y, Lin Z, Zhang Z, Wang X. Long-term quantitatively imaging intracellular chloride concentration using a core-/shell-structured nanosensor and time-domain dual-lifetime referencing method. ACS Sens. 2020;5(12):3971–3978. doi:10.1021/acssensors.0c01671
12. Panariti A, Miserocchi G, Rivolta I. The effect of nanoparticle uptake on cellular behavior: disrupting or enabling functions? Nanotechnol Sci Appl. 2012;5(1):87–100. doi:10.2147/NSA.S25515
13. Kou L, Sun J, Zhai Y, He Z. The endocytosis and intracellular fate of nanomedicines: implication for rational design. Asian J Pharm Sci. 2013;8(1):1–10. doi:10.1016/j.ajps.2013.07.001
14. Oh N, Park JH. Endocytosis and exocytosis of nanoparticles in mammalian cells. Int J Nanomedicine. 2014;9(SUPPL.1):51–63. doi:10.2147/IJN.S26592
15. Wang Y, Chen L, Liu P. Biocompatible triplex Ag@SiO 2@mTiO 2 core-shell nanoparticles for simultaneous fluorescence-SERS bimodal imaging and drug delivery. Chem Eur J. 2012;18(19):5935–5943. doi:10.1002/chem.201103571
16. Wang F, Xu G, Gu X, et al. Realizing highly chemoselective detection of H2S in vitro and in vivo with fluorescent probes inside core-shell silica nanoparticles. Biomaterials. 2018;159:82–90. doi:10.1016/j.biomaterials.2018.01.009
17. Chu Z, Huang Y, Tao Q, Li Q. Cellular uptake, evolution, and excretion of silica nanoparticles in human cells. Nanoscale. 2011;3(8):3291–3299. doi:10.1039/c1nr10499c
18. Blechinger J, Bauer AT, Torrano AA, Gorzelanny C, Bräuchle C, Schneider SW. Uptake kinetics and nanotoxicity of silica nanoparticles are cell type dependent. Small. 2013;9(23):3970–3980. doi:10.1002/smll.201301004
19. Sriramulu D, Reed EL, Annamalai M, Venkatesan TV, Valiyaveettil S. Synthesis and characterization of superhydrophobic, self-cleaning NIR-reflective silica nanoparticles. Sci Rep. 2016;6(1):1–10. doi:10.1038/srep35993
20. Hsiao I-L, Gramatke AM, Joksimovic R, Sokolowski M, Gradzielski M, Haase A. Size and cell type dependent uptake of silica nanoparticles. J Nanomed Nanotechnol. 2014;05:06. doi:10.4172/2157-7439.1000248
21. Pellegrino C, Volpe A, Juris R, et al. Multiple dye doped core-shell silica nanoparticles: outstanding stability and signal intensity exploiting FRET phenomenon for biomedical applications. J Nanomater Mol Nanotechnol. 2018;s6. doi:10.4172/2324-8777.s6-003
22. Zhang X, Chen F, Turker MZ, et al. Targeted melanoma radiotherapy using ultrasmall 177Lu-labeled α-melanocyte stimulating hormone-functionalized core-shell silica nanoparticles. Biomaterials. 2020;241(August 2019):119858. doi:10.1016/j.biomaterials.2020.119858
23. Jokerst JV, Lobovkina T, Zare RN, Gambhir SS. Nanoparticle PEGylation for imaging and therapy. Nanomedicine. 2011;6(4):715–728. doi:10.2217/nnm.11.19
24. Zucker RM, Ortenzio J, Degn LL, Lerner JM, Boyes WK. Biophysical comparison of four silver nanoparticles coatings using microscopy, hyperspectral imaging and flow cytometry. Zelikin AN, ed. PLoS One. 2019;14(7):e0219078. doi:10.1371/journal.pone.0219078
25. De La Cruz GG, Rodríguez-Fragoso P, Reyes-Esparza J, Rodríguez-López A, Gómez-Cansino R, Rodriguez-Fragoso L. Interaction of nanoparticles with blood components and associated pathophysiological effects. In: Gomes AC, Sarria MP, editors. Unraveling the Safety Profile of Nanoscale Particles and Materials – from Biomedical to Environmental Applications. InTechOpen; 2018:37–59. doi10.5772/intechopen.69386
26. Johnson S, Nguyen V, Coder D. Assessment of cell viability. Curr Protoc Cytom. 2013;64(1):
27. Chazotte B. Labeling lysosomes in live cells with lysotracker. Cold Spring Harb Protoc. 2011;6:2. doi:10.1101/pdb.prot5571
28. Canonico B, Cesarini E, Montanari M, et al. Rapamycin re-directs lysosome network, stimulates ER-remodeling, involving membrane CD317 and affecting exocytosis, in campylobacter jejuni-lysate-infected U937 cells. Int J Mol Sci. 2020;21(6):2207. doi:10.3390/ijms21062207
29. Vázquez CL, Colombo MI. Assays to assess autophagy induction and fusion of autophagic vacuoles with a degradative compartment, using monodansylcadaverine (MDC) and DQ-BSA. Methods Enzymol. 2009. doi:10.1016/S0076-6879(08)03606-9
30. Canonico B, Cesarini E, Salucci S, et al. Defective autophagy, mitochondrial clearance and lipophagy in niemann-pick type B lymphocytes. PLoS One. 2016;11(10):e0165780. doi:10.1371/journal.pone.0165780
31. Eruslanov E, Kusmartsev S. Identification of ROS using oxidized DCFDA and flow-cytometry. Methods Mol Biol. 2010;594:57–72. doi:10.1007/978-1-60761-411-1_4
32. Bolte S, Cordelières FP. A guided tour into subcellular colocalization analysis in light microscopy. J Microsc. 2006;224(3):213–232. doi:10.1111/j.1365-2818.2006.01706.x
33. Luchetti F, Canonico B, Arcangeletti M, et al. Fas signalling promotes intercellular communication in T cells. Badley AD, ed. PLoS One. 2012;7(4):e35766. doi:10.1371/journal.pone.0035766
34. van Blaaderen A, Vrij A. Synthesis and characterization of monodisperse colloidal organo-silica spheres. J Colloid Interface Sci. 1993;156(1):1–18. doi:10.1006/jcis.1993.1073
35. Filipe V, Hawe A, Jiskoot W. Critical evaluation of nanoparticle tracking analysis (NTA) by NanoSight for the measurement of nanoparticles and protein aggregates. Pharm Res. 2010;27(5):796–810. doi:10.1007/s11095-010-0073-2
36. Morgan JJ, Wiley J. Aquatic Chemistry Chemical Equilibria and Rates in Natural Waters. A Wiley-Interscience Publication; 1996.
37. Baalousha M, Motelica-Heino M, Le Coustumer P. Conformation and size of humic substances: effects of major cation concentration and type, pH, salinity, and residence time. Colloids Surf A Physicochem Eng Asp. 2006;272(1–2):48–55. doi:10.1016/j.colsurfa.2005.07.010
38. Lead JR, Wilkinson KJ. Aquatic colloids and nanoparticles: current knowledge and future trends. Environ Chem. 2006;3(3):159–171. doi:10.1071/EN06025
39. Nowack B, Bucheli TD. Occurrence, behavior and effects of nanoparticles in the environment. Environ Pollut. 2007;150(1):5–22. doi:10.1016/j.envpol.2007.06.006
40. Boxall ABA, Tiede K, Chaudhry Q. Engineered nanomaterials in soils and water: how do they behave and could they pose a risk to human health? Nanomedicine. 2007;2(6):919–927. doi:10.2217/17435889.2.6.919
41. Christian P, Von Der Kammer F, Baalousha M, Hofmann T. Nanoparticles: structure, properties, preparation and behaviour in environmental media. Ecotoxicology. 2008;17(5):326–343. doi:10.1007/s10646-008-0213-1
42. Spooner RA, Smith DC, Easton AJ, Roberts LM, Lord JM. Retrograde transport pathways utilised by viruses and protein toxins. Virol J. 2006;3(1):26. doi:10.1186/1743-422X-3-26
43. Kumar S, Aswal VK, Callow P. PH-dependent interaction and resultant structures of silica nanoparticles and lysozyme protein. Langmuir. 2014;30(6):1588–1598. doi:10.1021/la403896h
44. Casey JR, Grinstein S, Orlowski J. Sensors and regulators of intracellular pH. Nat Rev Mol Cell Biol. 2010;11(1):50–61. doi:10.1038/nrm2820
45. Suzuki H, Toyooka T, Ibuki Y. Simple and easy method to evaluate uptake potential of nanoparticles in mammalian cells using a flow cytometric light scatter analysis. Environ Sci Technol. 2007;41(8):3018–3024. doi:10.1021/es0625632
46. Busch W, Bastian S, Trahorsch U, et al. Internalisation of engineered nanoparticles into mammalian cells in vitro: influence of cell type and particle properties. J Nanoparticle Res. 2011;13(1):293–310. doi:10.1007/s11051-010-0030-3
47. Iacopetta BJ, Morgan EH. The Kinetics of Transferrin Endocytosis and Iron Uptake from Transferrin in Rabbit Reticulocytes. J Biol Chem.1983;258(15):9108-9115.
48. Saraste J, Palade GE, Farquhar MG. Temperature-sensitive steps in the transport of secretory proteins through the golgi complex in exocrine pancreatic cells. Proc Natl Acad Sci U S A. 1986;83(17):6425–6429. doi:10.1073/pnas.83.17.6425
49. Zeng X, Zhang Y, Nyström AM. Endocytic uptake and intracellular trafficking of bis-MPA-based hyperbranched copolymer micelles in breast cancer cells. Biomacromolecules. 2012;13(11):3814–3822. doi:10.1021/bm301281k
50. Faklaris O, Joshi V, Irinopoulou T, et al. Photoluminescent diamond nanoparticles for cell labeling: study of the uptake mechanism in mammalian cells. ACS Nano. 2009;3(12):3955–3962. doi:10.1021/nn901014j
51. Bozavikov P, Rajshankar D, Lee W, McCulloch CA. Particle size influences fibronectin internalization and degradation by fibroblasts. Exp Cell Res. 2014;328(1):172–185. doi:10.1016/j.yexcr.2014.06.018
52. Fiorentino I, Gualtieri R, Barbato V, et al. Energy independent uptake and release of polystyrene nanoparticles in primary mammalian cell cultures. Exp Cell Res. 2015;330(2):240–247. doi:10.1016/j.yexcr.2014.09.017
53. Francia V, Reker-Smit C, Boel G, Salvati A. Limits and challenges in using transport inhibitors to characterize how nano-sized drug carriers enter cells. Nanomedicine. 2019;14(12):1533–1549. doi:10.2217/nnm-2018-0446
54. Vercauteren D, Vandenbroucke RE, Jones AT, et al. The use of inhibitors to study endocytic pathways of gene carriers: optimization and pitfalls. Mol Ther. 2010;18(3):561–569. doi:10.1038/mt.2009.281
55. Iversen TG, Skotland T, Sandvig K. Endocytosis and intracellular transport of nanoparticles: present knowledge and need for future studies. Nano Today. 2011;6(2):176–185. doi:10.1016/j.nantod.2011.02.003
56. Lehman SE, Morris AS, Mueller PS, Salem AK, Grassian VH, Larsen SC. Silica nanoparticle-generated ROS as a predictor of cellular toxicity: mechanistic insights and safety by design. Environ Sci Nano. 2016;3(1):56–66. doi:10.1039/c5en00179j
57. Liu C-G, Han Y-H, Kankala RK, Wang S-B, Chen A-Z. Subcellular performance of nanoparticles in cancer therapy. Int J Nanomedicine. 2020;15:675–704. doi:10.2147/IJN.S226186
58. Cao Y, Long J, Liu L, et al. A review of endoplasmic reticulum (ER) stress and nanoparticle (NP) exposure. Life Sci. 2017;186:33–42. doi:10.1016/j.lfs.2017.08.003
59. Cooper GM. Lysosomes. Sinauer Associates; 2000. Available from: https://www.ncbi.nlm.nih.gov/books/NBK9953/.
60. Pathak RK, Kolishetti N, Dhar S. Targeted nanoparticles in mitochondrial medicine. Wiley Interdiscip Rev Nanomed Nanobiotechnol. 2015;7(3):315–329. doi:10.1002/wnan.1305
61. Brand MD. Mitochondrial generation of superoxide and hydrogen peroxide as the source of mitochondrial redox signaling. Free Radic Biol Med. 2016;100:14–31. doi:10.1016/j.freeradbiomed.2016.04.001
62. Hao N, Yang H, Li L, Li L, Tang F. The shape effect of mesoporous silica nanoparticles on intracellular reactive oxygen species in A375 cells. New J Chem. 2014;38(9):4258–4266. doi:10.1039/c4nj00736k
63. Ortega FG, Roefs MT, de Miguel Perez D, et al. Interfering with endolysosomal trafficking enhances release of bioactive exosomes. Nanomedicine. 2019;20:102014. doi:10.1016/j.nano.2019.102014
64. Pfaller T, Colognato R, Nelissen I, et al. The suitability of different cellular in vitro immunotoxicity and genotoxicity methods for the analysis of nanoparticle-induced events. Nanotoxicology. 2010;4(1):52–72. doi:10.3109/17435390903374001
65. Lai L, Alaverdi N, Maltais L, Morse HC
66. Oostingh GJ, Casals E, Italiani P, et al. Problems and challenges in the development and validation of human cell-based assays to determine nanoparticle-induced immunomodulatory effects. Part Fibre Toxicol. 2011;8(1):8. doi:10.1186/1743-8977-8-8
67. Wu Q, Jin R, Feng T, et al. Iron oxide nanoparticles and induced autophagy in human monocytes. Int J Nanomedicine. 2017;12:3993–4005. doi:10.2147/IJN.S135189
68. Sakhtianchi R, Minchin RF, Lee KB, Alkilany AM, Serpooshan V, Mahmoudi M. Exocytosis of nanoparticles from cells: role in cellular retention and toxicity. Adv Colloid Interface Sci. 2013;201–202:18–29. doi:10.1016/j.cis.2013.10.013
69. Canonico B, Luchetti F, Arcangeletti M, Guescini M, Degli Esposti M, Papa S. Flow cytometric analyses disclose intercellular communications in FasL-stimulated T cells: results and trouble shooting. Cytom Part A. 2012;81 A(1):5–8. doi:10.1002/cyto.a.21151
70. Shelke GV, Lässer C, Gho YS, Lötvall J. Importance of exosome depletion protocols to eliminate functional and RNA-containing extracellular vesicles from fetal bovine serum. J Extracell Vesicles. 2014;3(1):24783. doi:10.3402/jev.v3.24783
71. Al-Rawi M, Diabaté S, Weiss C. Uptake and intracellular localization of submicron and nano-sized SiO 2 particles in HeLa cells. Arch Toxicol. 2011;85(7):813–826. doi:10.1007/s00204-010-0642-5
72. Auten RL, Davis JM. Oxygen toxicity and reactive oxygen species: the devil is in the details. Pediatr Res. 2009;66(2):121–127. doi:10.1203/PDR.0b013e3181a9eafb
 © 2021 The Author(s). This work is published and licensed by Dove Medical Press Limited. The
full terms of this license are available at https://www.dovepress.com/terms
and incorporate the Creative Commons Attribution
- Non Commercial (unported, 3.0) License.
By accessing the work you hereby accept the Terms. Non-commercial uses of the work are permitted
without any further permission from Dove Medical Press Limited, provided the work is properly
attributed. For permission for commercial use of this work, please see paragraphs 4.2 and 5 of our Terms.
© 2021 The Author(s). This work is published and licensed by Dove Medical Press Limited. The
full terms of this license are available at https://www.dovepress.com/terms
and incorporate the Creative Commons Attribution
- Non Commercial (unported, 3.0) License.
By accessing the work you hereby accept the Terms. Non-commercial uses of the work are permitted
without any further permission from Dove Medical Press Limited, provided the work is properly
attributed. For permission for commercial use of this work, please see paragraphs 4.2 and 5 of our Terms.