Back to Journals » OncoTargets and Therapy » Volume 11
Upregulation of the alternative splicing factor NOVA2 in colorectal cancer vasculature
Authors Gallo S, Arcidiacono MV, Tisato V, Piva R, Penolazzi L, Bosi C, Feo CV ![]() , Gafà R
, Gafà R ![]() , Secchiero P
, Secchiero P
Received 20 April 2018
Accepted for publication 25 June 2018
Published 20 September 2018 Volume 2018:11 Pages 6049—6056
DOI https://doi.org/10.2147/OTT.S171678
Checked for plagiarism Yes
Review by Single anonymous peer review
Peer reviewer comments 4
Editor who approved publication: Prof. Dr. Geoffrey Pietersz
Stefania Gallo,1,* Maria Vittoria Arcidiacono,2,* Veronica Tisato,1 Roberta Piva,3 Letizia Penolazzi,3 Cristina Bosi,1 Carlo V Feo,1 Roberta Gafà,1 Paola Secchiero1
1Department of Morphology, Surgery, Experimental Medicine and LTTA Center, University of Ferrara, Ferrara, Italy; 2Institute for Maternal and Child Health, IRCCS “Burlo Garofolo,” Trieste, Italy; 3Department of Biomedical and Specialty Surgical Sciences, University of Ferrara, Ferrara, Italy
*These authors contributed equally to this work
Background: Tumor-specific isoforms generated by alternative splicing (AS) are demonstrated to contribute to tumor progression and can represent potential biomarkers. NOVA2 is an AS factor that in physiological conditions regulates endothelial cells’ (ECs) polarity and vessel lumen maturation, likely by mediating AS of apical–basal polarity regulators. However, NOVA2 expression in tumor ECs and its regulation have never been investigated.
Methods: To elucidate this, 40 colorectal cancer patients were enrolled and NOVA2 expression was investigated by immunohistochemistry in samples bearing both the normal mucosa and the tumor tissue.
Results: NOVA2 was found expressed in ECs of tumor vasculature and, importantly, it was upregulated in tumor ECs with respect to normal mucosa ECs in all cases (P<0.001). The same samples analyzed by immunohistochemistry for the expression HIF1α, a marker of hypoxia, showed a positive and significant association with NOVA2 levels (P=0.045). Of note, NOVA2 was upregulated by hypoxia also in an in vitro ECs model.
Conclusion: Our results provide, for the first time, evidence of NOVA2 expression and upregulation in tumor ECs and highlight hypoxia as a potential regulatory factor. These findings open a completely new perspective to study tumor vasculature and to uncover NOVA2 as a potential source of biomarkers and therapeutic targets based on AS isoforms.
Keywords: NOVA2, tumor angiogenesis, colorectal cancer, hypoxia
Introduction
Alternative splicing (AS) is the mechanism that generates multiple mRNAs from the same gene, leading to proteomic and functional diversity, and it is mediated by AS factors that, by recognizing RNA sequences on immature transcripts, facilitate the inclusion or exclusion of exons and introns.1 NOVA1 and NOVA2 proteins are AS factors initially described to be expressed in a mutually exclusive manner in different central nervous system territories where they regulate AS of genes involved in synaptogenesis and neuron development.2 In addition, NOVA2 expression has been recently revealed in endothelial cells (ECs), adipocytes, and pancreatic beta cells as well.3–6 In particular, it has been demonstrated that in normal endothelium NOVA2 is essential for the establishment of ECs polarity and lumen maturation.4 In a previous study, Giampietro et al,4 using human and murine in vitro endothelial models and an in vivo zebrafish model, demonstrated for the first time that NOVA2 mediates the AS of apical–basal polarity regulators and that NOVA2 depletion resulted in impaired ECs permeability, directional cell migration, and junction architecture. While NOVA1, which is highly related to NOVA2, has been described to be expressed in different tumor types,7 no evidence has been reported about NOVA2 expression in human tumors.
During tumor angiogenesis, the formation of new vessels allows oxygen and nutrient delivery to tumor cells, and it is mostly promoted by hypoxia through the induction of hundreds of genes.8–11 Notably, there is a growing interest in studying tumor angiogenesis, not only to overcome the flaws of current antiangiogenic therapies but also to identify and characterize new tumor-specific endothelial biomarkers for the development of novel therapeutic molecules.
The association of aberrant AS to tumor growth has been described in many cancer types and has been proposed as potential tumor biomarker.12 Nevertheless, NOVA2 expression in tumor vasculature has never been explored. Here, we have investigated NOVA2 expression in a cohort of colorectal cancer (CRC) patients and studied its association with hypoxia.
Materials and methods
Patients and samples
Tissue specimens were collected after obtaining written informed consent permission from 40 CRC patients undergoing curative resection at the University Hospital S. Anna of Ferrara over an 18-month period. Twenty-three patients (57.5%) were male, and 17 (42.5%) were female; the average age was 71±13 years. None of the patients underwent anticancer therapies before surgery. Twenty-five tumors (62.5%) were located in the right colon, 9 (22.5%) in the left colon and 6 (15%) in the rectum. Eight tumors (20%) were classified as mucinous adenocarcinoma and 32 (80%) as conventional adenocarcinoma. Thirty-three tumors (82.5%) were classified as low grade and 7 (18%) as high grade. Tumors were staged according to the TNM eighth edition by American Joint Committee on Cancer: 6 (15%) stage I, 21 (52.5%) stage II, 7 (17.5%) stage III, and 6 (15%) stage IV. Twenty-seven tumors (67.5%) were pN0, 10 (25%) were pN1, and 3 (7.5%) were pN2. Thirty-four tumors (85%) were pM0 and 6 (15%) were pM1.
Seven out of 40 CRC cases (17.5%) showed high microsatellite instability (MSI-H) and presented loss of expression of at least one of the mismatch repair (MMR) proteins by immunohistochemistry, while the remaining cases (82.5%) were microsatellite stable (MSS) without presenting loss of expression of MMR proteins. MMR proteins status was determined by immunohistochemistry using Ventana EnVision method and a 4-antibody panel of MMR proteins including MLH1, MSH2, MSH6, and, in some cases, PMS2; all the antibodies were ready-to-use monoclonal antibodies (MLH1 clone M1; MSH2 clone G219-1129; MSH6 clone 44; PMS2 clone EPR3947, Roche Diagnostics, Risch-Rotkreuz, Switzerland). Tumors demonstrating absolute absence of nuclear staining were classified as negative for protein expression, provided internal controls were positive. To test the MSI status, 4 microsatellite loci (BAT25, BAT26, BAT40, D5S346) were evaluated using a fluorescence-based PCR method. According to the guidelines of the International Workshop of Bethesda, tumors showing instability at ≥30% of microsatellite loci were classified as MSI-H and tumors without detectable MSI were classified as MSS.
An additional patient with rectal cancer (staged as ypT2-N0) undergoing neoadjuvant chemo/radiotherapy was enrolled for a preliminary evaluation of the effect of therapy on NOVA2 expression.
Immunohistochemistry
Tumor sections stained with haematoxylin and eosin were reviewed by two experienced gastrointestinal pathologists for histopathological analysis. For each case, a representative single formalin-fixed paraffin-embedded tissue block including both the tumor tissue and the adjacent normal mucosa was selected. Four micrometer sections were deparaffinized and rehydrated. Then, antigen retrieval and quenching were performed in citric acid (10 mM pH6) and 3% hydrogen peroxide, respectively. Immunohistochemistry for NOVA2, CD31, and HIF1α was performed according to the instructions given in the R&D Staining kit (HRP-DAB System, R&D Systems, Minneapolis, MN, USA). As a negative control, 1 section for each slide was left without primary antibody. The primary antibodies were: anti-NOVA2 (C-16, Santa Cruz Biotechnology, Santa Cruz, CA, USA; dilution 1:50), anti-CD31 (Abcam, Cambridge, UK; dilution 1:25), and anti-HIF1α (H1α 67, Novus Biologicals, Littleton, CO, USA; dilution 1:10). The selected anti-CD31 and anti-HIF1α antibodies have been previously described to positively stain ECs and tumor cells, respectively, in CRC tissues.9,13
NOVA2 expression was quantified by 2 operators using ImageJ (National Institutes of Health, Bethesda, MD, USA) with the Color Deconvolution Plugin. In order to avoid experimental variability between cases, and given that the basal expression of NOVA2 in human colon tissue vessels was uncharacterized, for each patient, we quantified NOVA2 expression in ECs of all the vessels of tumor and adjacent normal mucosa. For each section, the vessels with the same area and the same number of ECs in paired normal mucosa and tumor tissue were analyzed and compared. Then, the measurements were expressed as fold change of integrated optical density of tumoral vs normal ECs of vessels located in the same section. HIF1α intensity was semi-quantified by 2 operators using Histoscore as follows: Histoscore=1× (% weak staining)+2× (% moderate staining)+3× (% strong staining), which ranged from 0 (no nuclear and/or cytoplasmic staining detectable) to 300 (maximum staining intensity), as previously described.14 Considering that the existence of samples with no staining could be due to HIF1α degradation because of tissue manipulation in normoxic conditions,8,15,16 we used only samples with Histoscore >0 (76% of the cases).
In vitro endothelial model
HUVECs (Thermo Fisher Scientific, Rockford, IL, USA) were used from passage 3 to passage 7 as previously described.17 For hypoxia experiment, HUVECs were cultured in both normoxic and hypoxic conditions (1.5% O2 in the hypoxic chamber Xvivo System X3, Biospherix Ltd., Parish, NY, USA).
Total RNA was obtained as previously described.18 Two hundred nanogram of RNA were retrotranscribed and amplified with the Express 1step SS qRT-PCR Universal (Thermo Fisher Scientific). The gene expression analysis was performed according to the “Delta delta Ct Method” normalizing to the POLR2A gene as the housekeeping gene. Taqman assays (Thermo Fisher Scientific) used were: Hs01547115_m1 (for NOVA2), Hs99999905_m1 (for GAPDH), and Hs00172187_m1 (for POLR2A).
Western blot was performed as previously described.19 Ten microgram and 35 μg of proteins were used for NOVA2 and HIF1α analysis, respectively. The following primary antibodies were used: anti-NOVA2 (Sigma-Aldrich, St Louis, MO, USA; 1:250), anti-ACTIN (AC-40, Sigma-Aldrich; 1:1,000), and anti-HIF1α (H1α 67, Novus Biologicals; 1:500).
Statistical analysis
Statistical analyses were performed with the GraphPad Prism version 6.00 (GraphPad Software, La Jolla CA, USA). Values were expressed as mean±SD if distribution was normal or as median (interquartile range) if nonnormal distribution was assessed. Normal distribution was analyzed using the D’Agostino and Pearson omnibus normality test. The Mann–Whitney U test was used to compare NOVA2 data. Confidence level was fixed at 0.05.
Ethics approval and informed consent
The study was approved by the Institutional Review Board of the University of Ferrara and conforms to the Declaration of Helsinki and the Guidelines for Good Clinical Practice.
Results
NOVA2 upregulation in CRC vasculature
As shown in Figure 1A and B, immunohistochemical analyses showed that NOVA2-positive cells were also positive for the endothelial marker CD31 in both normal mucosa and tumor tissue, confirming the endothelial nature of NOVA2. Conversely, non-ECs, such as tumoral and stromal cells, were negative for NOVA2 staining (Figure 1B).
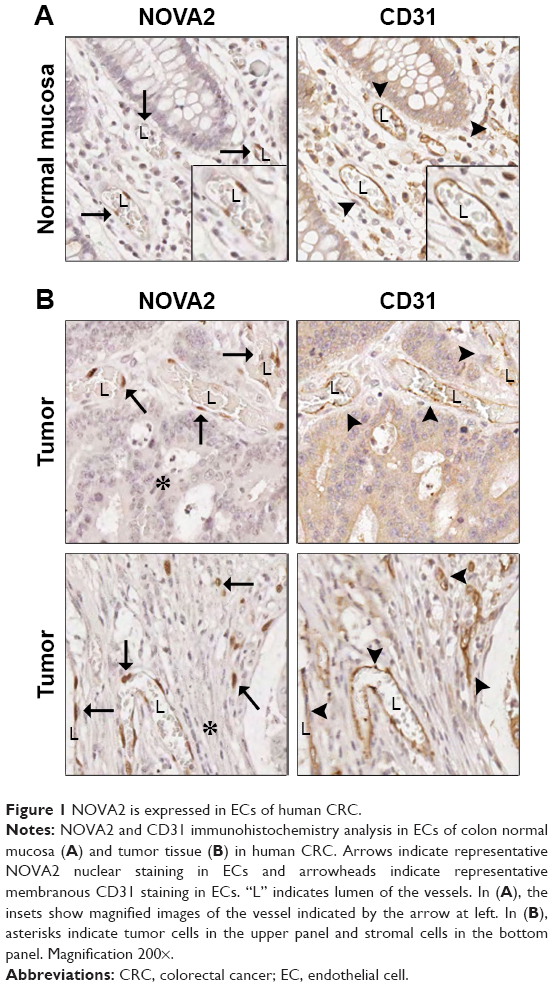 | Figure 1 NOVA2 is expressed in ECs of human CRC. |
To compare NOVA2 expression in the vasculature of normal and tumor tissues, the intensity of NOVA2 staining was quantitatively measured in vessels present in paired adjacent normal mucosa and tumor tissue for each patient. All vessels with the same area and amount of ECs were compared. As shown in Figure 2A and B, NOVA2 was significantly upregulated in tumor ECs compared to normal mucosa ECs (fold change=3.45; P<0.001). Conversely, in the sample from the additional patient who underwent neoadjuvant chemo- and radiotherapy, NOVA2 was downregulated in tumor ECs compared to the paired normal ECs (fold change=0.82).
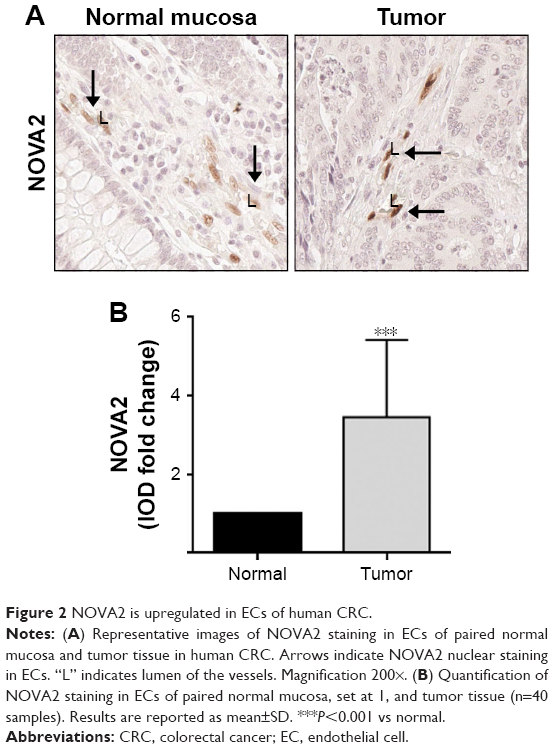 | Figure 2 NOVA2 is upregulated in ECs of human CRC. |
The analysis of correlations between NOVA2 and clinicopathological features of patients, such as tumor location, type, grade, and TNM stage, did not reveal statistically significant results mainly due to the low size of specific subgroups, although the analysis indicated a tendency of NOVA2 level in increasing in N1 stage tumors, in M1 stage tumors, and in MSS tumors (Figure S1).
NOVA2 induction by hypoxia
In order to gain insights into the mechanisms underlying the regulation of NOVA2 expression, and knowing that hypoxia regulates several genes involved in ECs function,8,10 the association between NOVA2 and the hypoxic marker HIF1α was investigated in tumor tissue. For this purpose, we analyzed only the MSS samples (n=33), since high MSI is demonstrated to affect the angiogenesis pathways.20,21 As shown in Figure 3A, low HIF1α levels in the tumor corresponded to low NOVA2 intensity in ECs, while high HIF1α levels corresponded to strong NOVA2 intensity in ECs. To evaluate the association between HIF1α and NOVA2 levels, we semi-quantitatively analyzed HIF1α staining and stratified the levels in 2 groups according to the median value (Histoscore=119). As shown in Figure 3B, tumors with low hypoxia (HIF1α Histoscore<119) were characterized by low NOVA2 levels, while tumors with high hypoxia (HIF1α Histoscore ≥119) resulted in high NOVA2 levels (P=0.045).
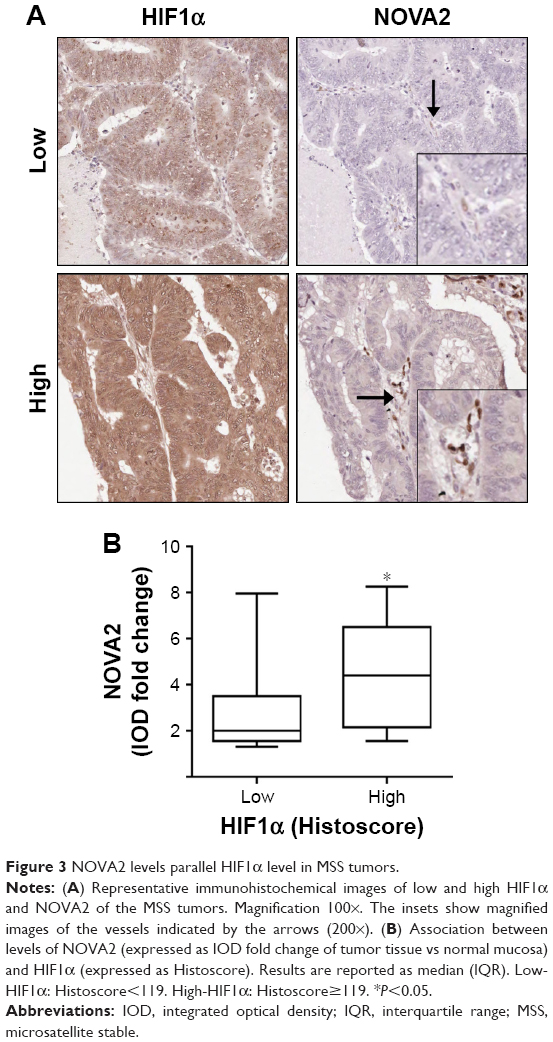 | Figure 3 NOVA2 levels parallel HIF1α level in MSS tumors. |
Finally, we investigated NOVA2 expression in HUVEC in response to hypoxia. The experimental induction of hypoxia was verified at the protein level by the upregulation of HIF1α (Figure 4A, left panel). In addition, hypoxia induction was confirmed also at mRNA level by the upregulation of the expression of GAPDH mRNA (P=0.036), another known marker of hypoxia22 (Figure 4A, right panel). As shown in Figure 4B, hypoxia induced the upregulation of NOVA2 protein (left panel) with a significant increase of NOVA2 mRNA expression (P=0.029) (right panel).
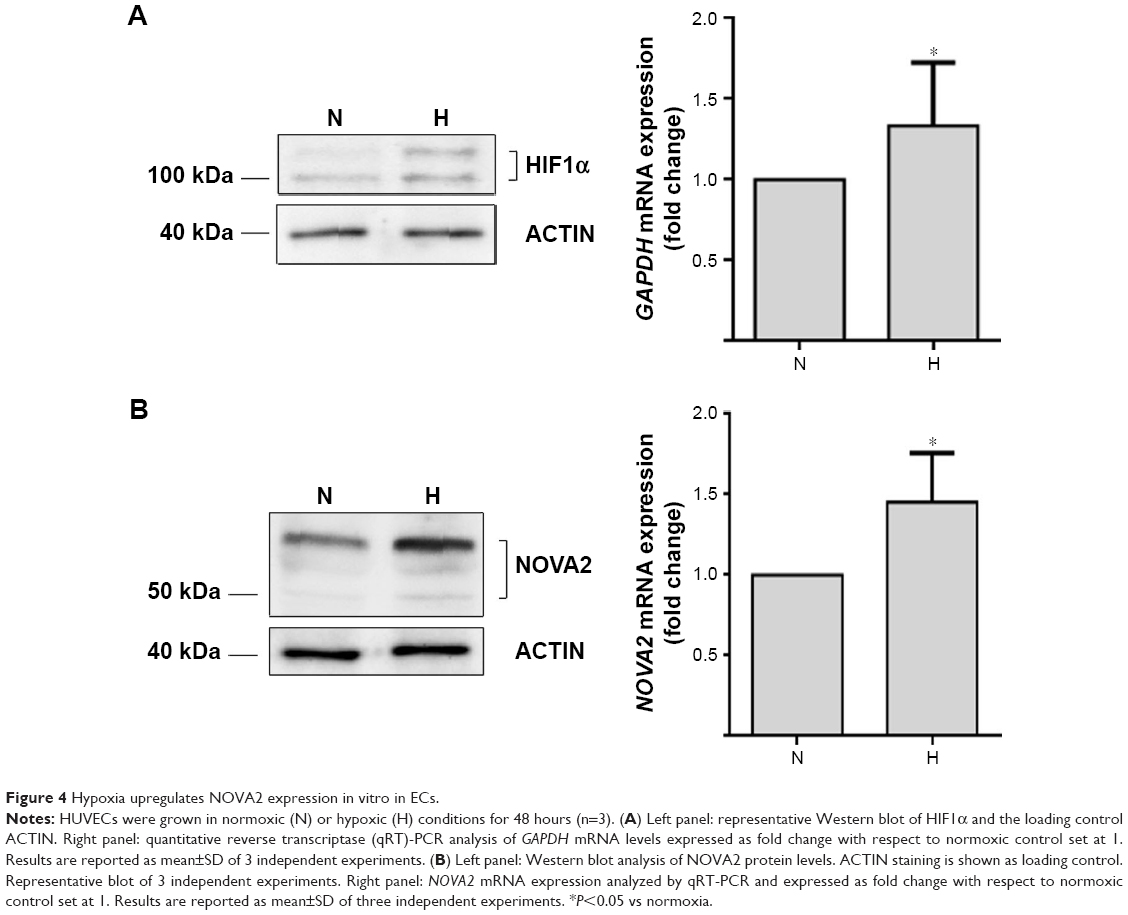 | Figure 4 Hypoxia upregulates NOVA2 expression in vitro in ECs. |
Discussion
This is the first report demonstrating that NOVA2 is expressed in the vasculature of human CRC and, importantly, that NOVA2 is significantly upregulated in tumor ECs. Moreover, high NOVA2 levels are associated with high HIF1α levels, a marker of tumor hypoxia,9 both in CRC tissue and in an in vitro endothelial model.
The cohort of samples used for this pilot study was selected in order to include a variety of tumors types. A preliminary evaluation showed that NOVA2 median value tended to be higher in M1 and N1 stages tumors and in MSS tumors, although the low number of cases certainly did not allow the reaching of statistical significance. Interestingly, the analysis of 1 additional patient, who underwent neoadjuvant chemo- and radiotherapy, showed NOVA2 downregulation in tumor ECs, preliminarily suggesting an effect of therapy on NOVA2 expression.
Hypoxia is a key triggering factor of angiogenesis, which leads to transcriptional activation of hundreds of genes involved in vascular sprouting.10 Moreover, it is known that hypoxia regulates AS pathways in ECs and non-ECs.23–25 Of note, in the current study, we found that NOVA2 was upregulated by hypoxia, providing a new regulatory agent to study the effects of hypoxia on ECs based on AS modulation. NOVA2 correlation with HIF1α was investigated only in the MSS tumors because it is known that, despite high HIF1α levels, MSI-H tumors paradoxically show low levels of VEGF and other angiogenic factors,20,21 suggesting that the high mutational rate may affect the typical angiogenic response to hypoxia.
As is known, AS factors overexpressed in tumors generate tumor-specific isoforms that contribute to the malignant phenotype and are potential tumor antigens.12 NOVA2 belongs to the family of NOVA proteins, initially identified as paraneoplastic disease antigens,3 and NOVA1, highly related to NOVA2, has been described to be expressed in different tumor types.7 Differently from NOVA1, we found NOVA2 overexpression not in tumor cells but rather in tumor vessels. Therefore, NOVA2 overexpression in ECs, through AS modulation of its target genes, might confer a pathogenic phenotype or generate new tumor-specific biomarkers and therapeutic targets at the tumor vasculature level with foremost clinical relevance. An example of aberrant AS in the clinical application is provided by the EDB antigen, a protein domain generated by AS in the FIBRONECTIN1 transcript only in tumor ECs,26 and targeted by the mAb L19 conjugated with therapeutic molecules currently investigated in preclinical and clinical studies.27–30 Thus, the identification of the NOVA2-modulated genes is noteworthy since it may contribute to the development of antiangiogenic drugs that could overcome the flaws of the existing therapies. Indeed, the benefit from the addition of antiangiogenic drugs to chemotherapy is currently limited, mainly because of the onset of drug resistance mechanisms.11,31
Conclusion
In conclusion, we report for the first time NOVA2 upregulation in the tumor vasculature and its direct association with hypoxia. Although we are aware of the limitations of this study, mainly due to the low number of specific subcases, our findings represent the proof of concept for future investigations in larger cohorts and different types of tumor that might allow the discovery of molecular mechanisms that link specific NOVA2 pathways to the reliance of tumor growth from neoangiogenesis.
Data sharing statement
Data will be shared by authors upon request.
Acknowledgments
We acknowledge Professor Giovanni Lanza and Doctor Elisabetta Khun for their scientific support and critical discussion of the manuscript. This work was supported by grants from Associazione Italiana per la Ricerca sul Cancro (AIRC, project 18055, fellowship to SG).
Author contributions
SG performed in vitro experiments and acquired the data; MVA performed tissues experiments and acquired the data; VT discussed the results; RP and LP performed hypoxia experiments and discussed the results; CB, CVF, and RG provided tissues samples and the clinical data and discussed the results; PS organized the study and discussed the results. All authors contributed toward data analysis, drafting and critically revising the paper, gave final approval of the version to be published, and agree to be accountable for all aspects of the work.
Disclosure
The authors report no conflicts of interest in this work.
References
Baralle FE, Giudice J. Alternative splicing as a regulator of development and tissue identity. Nat Rev Mol Cell Biol. 2017;18(7):437–451. | ||
Ule J, Ule A, Spencer J, et al. Nova regulates brain-specific splicing to shape the synapse. Nat Genet. 2005;37(8):844–852. | ||
Yang YY, Yin GL, Darnell RB. The neuronal RNA-binding protein Nova-2 is implicated as the autoantigen targeted in POMA patients with dementia. Proc Natl Acad Sci U S A. 1998;95(22):13254–13259. | ||
Giampietro C, Deflorian G, Gallo S, et al. The alternative splicing factor Nova2 regulates vascular development and lumen formation. Nat Commun. 2015;6:8479. | ||
Juan-Mateu J, Rech TH, Villate O, et al. Neuron-enriched RNA-binding proteins regulate pancreatic β cell function and survival. J Biol Chem. 2017;292(8):3466–3480. | ||
Vernia S, Edwards YJ, Han MS, et al. An alternative splicing program promotes adipose tissue thermogenesis. Elife. 2016;5:e17672. | ||
Xin Y, Li Z, Zheng H, Ho J, Chan MTV, Wu WKK. Neuro-oncological ventral antigen 1 (NOVA1): implications in neurological diseases and cancers. Cell Prolif. 2017;50(4):e12348. | ||
Cockman ME, Masson N, Mole DR, et al. Hypoxia inducible factor-α binding and ubiquitylation by the von Hippel-Lindau tumor suppressor protein. J Biol Chem. 2000;275(33):25733–25741. | ||
Kuwai T, Kitadai Y, Tanaka S, et al. Expression of hypoxia-inducible factor-1α is associated with tumor vascularization in human colorectal carcinoma. Int J Cancer. 2003;105(2):176–181. | ||
Rey S, Semenza GL. Hypoxia-inducible factor-1-dependent mechanisms of vascularization and vascular remodelling. Cardiovasc Res. 2010;86(2):236–242. | ||
Welti J, Loges S, Dimmeler S, Carmeliet P. Recent molecular discoveries in angiogenesis and antiangiogenic therapies in cancer. J Clin Invest. 2013;123(8):3190–3200. | ||
Bonomi S, Gallo S, Catillo M, Pignataro D, Biamonti G, Ghigna C. Oncogenic alternative splicing switches: role in cancer progression and prospects for therapy. Int J Cell Biol. 2013;2013:962038. | ||
Katkoori VR, Manne U, Chaturvedi LS, et al. Functional consequence of the p53 codon 72 polymorphism in colorectal cancer. Oncotarget. 2017;8(44):76574–76586. | ||
Bergadà L, Pallares J, Maria Vittoria A, et al. Role of local bioactivation of vitamin D by CYP27A1 and CYP2R1 in the control of cell growth in normal endometrium and endometrial carcinoma. Lab Invest. 2014;94(6):608–622. | ||
Biswas S, Charlesworth PJ, Turner GD, et al. CD31 angiogenesis and combined expression of HIF-1α and HIF-2α are prognostic in primary clear-cell renal cell carcinoma (CC-RCC), but HIFα transcriptional products are not: implications for antiangiogenic trials and HIFα biomarker studies in primary CC-RCC. Carcinogenesis. 2012;33(9):1717–1725. | ||
Evensen NA, Li Y, Kuscu C, et al. Hypoxia promotes colon cancer dissemination through up-regulation of cell migration-inducing protein (CEMIP). Oncotarget. 2015;6(24):20723–20739. | ||
Voltan R, Zauli G, Rizzo P, et al. In vitro endothelial cell proliferation assay reveals distinct levels of proangiogenic cytokines characterizing sera of healthy subjects and of patients with heart failure. Mediators Inflamm. 2014;2014:257081. | ||
Secchiero P, Voltan R, Rimondi E, et al. The γ-secretase inhibitors enhance the anti-leukemic activity of ibrutinib in B-CLL cells. Oncotarget. 2017;8(35):59235–59245. | ||
Tisato V, Zauli G, Rimondi E, et al. Inhibitory effect of natural anti-inflammatory compounds on cytokines released by chronic venous disease patient-derived endothelial cells. Mediators Inflamm. 2013;2013:423407. | ||
Inoue Y, Miki C, Watanabe H, Ojima E, Kusunoki M. Genomic instability and tissue expression of angiogenic growth factors in sporadic colorectal cancer. Surgery. 2006;139(3):305–311. | ||
Furlan D, Sahnane N, Carnevali I, et al. Up-regulation of the hypoxia-inducible factor-1 transcriptional pathway in colorectal carcinomas. Hum Pathol. 2008;39(10):1483–1494. | ||
Yamaji R, Fujita K, Takahashi S, et al. Hypoxia up-regulates glyceraldehyde-3-phosphate dehydrogenase in mouse brain capillary endothelial cells: involvement of Na+/Ca2+ exchanger. Biochim Biophys Acta. 2003;1593(2–3):269–276. | ||
Weigand JE, Boeckel JN, Gellert P, Dimmeler S. Hypoxia-induced alternative splicing in endothelial cells. PLoS One. 2012;7(8):e42697. | ||
Sena JA, Wang L, Heasley LE, Hu CJ, Cj H. Hypoxia regulates alternative splicing of HIF and non-HIF target genes. Mol Cancer Res. 2014;12(9):1233–1243. | ||
Brady LK, Wang H, Radens CM, et al. Transcriptome analysis of hypoxic cancer cells uncovers intron retention in EIF2B5 as a mechanism to inhibit translation. PLoS Biol. 2017;15(9):e2002623. | ||
Castellani P, Borsi L, Carnemolla B, et al. Differentiation between high- and low-grade astrocytoma using a human recombinant antibody to the extra domain-B of fibronectin. Am J Pathol. 2002;161(5):1695–1700. | ||
Papadia F, Basso V, Patuzzo R, et al. Isolated limb perfusion with the tumor-targeting human monoclonal antibody-cytokine fusion protein L19-TNF plus melphalan and mild hyperthermia in patients with locally advanced extremity melanoma. J Surg Oncol. 2013;107(2):173–179. | ||
Zegers CM, Rekers NH, Quaden DH, et al. Radiotherapy combined with the immunocytokine L19-IL2 provides long-lasting antitumor effects. Clin Cancer Res. 2015;21(5):1151–1160. | ||
Palumbo A, Hauler F, Dziunycz P, et al. A chemically modified antibody mediates complete eradication of tumours by selective disruption of tumour blood vessels. Br J Cancer. 2011;104(7):1106–1115. | ||
Menssen HD, Harnack U, Erben U, Neri D, Hirsch B, Dürkop H. Antibody-based delivery of tumor necrosis factor (L19-TNFα) and interleukin-2 (L19-IL2) to tumor-associated blood vessels has potent immunological and anticancer activity in the syngeneic J558L BALB/c myeloma model. J Cancer Res Clin Oncol. 2018;144(3):499–507. | ||
Kerr RS, Love S, Segelov E, et al. Adjuvant capecitabine plus bevacizumab versus capecitabine alone in patients with colorectal cancer (QUASAR 2): an open-label, randomised phase 3 trial. Lancet Oncol. 2016;17(11):1543–1557. |
Supplementary material
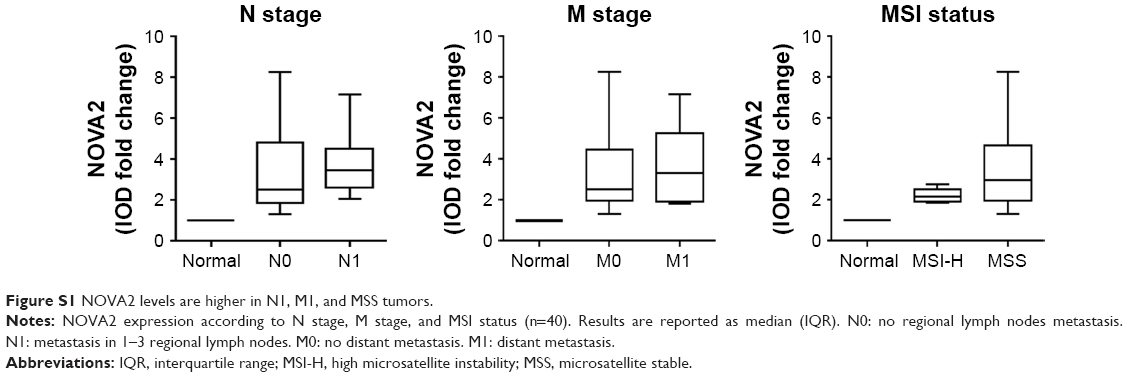 | Figure S1 NOVA2 levels are higher in N1, M1, and MSS tumors. |
 © 2018 The Author(s). This work is published and licensed by Dove Medical Press Limited. The
full terms of this license are available at https://www.dovepress.com/terms
and incorporate the Creative Commons Attribution
- Non Commercial (unported, 3.0) License.
By accessing the work you hereby accept the Terms. Non-commercial uses of the work are permitted
without any further permission from Dove Medical Press Limited, provided the work is properly
attributed. For permission for commercial use of this work, please see paragraphs 4.2 and 5 of our Terms.
© 2018 The Author(s). This work is published and licensed by Dove Medical Press Limited. The
full terms of this license are available at https://www.dovepress.com/terms
and incorporate the Creative Commons Attribution
- Non Commercial (unported, 3.0) License.
By accessing the work you hereby accept the Terms. Non-commercial uses of the work are permitted
without any further permission from Dove Medical Press Limited, provided the work is properly
attributed. For permission for commercial use of this work, please see paragraphs 4.2 and 5 of our Terms.