Back to Journals » OncoTargets and Therapy » Volume 11
Upregulated long non-coding RNAs demonstrate promising efficacy for breast cancer detection: a meta-analysis
Authors Yu G, Zhang W, Zhu L, Xia L
Received 21 September 2017
Accepted for publication 28 November 2017
Published 16 March 2018 Volume 2018:11 Pages 1491—1499
DOI https://doi.org/10.2147/OTT.S152241
Checked for plagiarism Yes
Review by Single anonymous peer review
Peer reviewer comments 2
Editor who approved publication: Dr XuYu Yang
Guozheng Yu,1,2 Wei Zhang,2,3 Linyan Zhu,1,2 Lin Xia2,4
1Department of General Surgery, Huangshi Central Hospital of Edong Healthcare Group, Affiliated Hospital of Hubei Polytechnic University, 2Hubei Key Laboratory of Kidney Disease Pathogenesis and Intervention, 3Department of Clinical Laboratory, 4Department of Medical Oncology, Huangshi Central Hospital of Edong Healthcare Group, Affiliated Hospital of Hubei Polytechnic University, Huangshi, China
Purpose: Focusing on the latest literature, dysregulated long non-coding RNAs (lncRNAs) have been extensively explored in breast cancer (BC) research. The purpose of this meta-analysis is to synthesize the evidence on the diagnostic performance of abnormally expressed lncRNAs for BC.
Materials and methods: Relevant studies were searched in multiple electronic databases. The Quality Assessment of Diagnosis Accuracy Studies II criteria were applied to assess the quality of included studies. The bivariate meta-analysis model was applied to synthesize the diagnostic parameters using Stata 12.0 software. Publication bias was judged in terms of the Deek’s funnel plot asymmetry test.
Results: We included 10 eligible studies, which comprised 835 BC patients and 725 paired controls for this meta-analysis. The pooled sensitivity, specificity, diagnostic odds ratio, likelihood ratio positive, likelihood ratio negative, and area under the curve (AUC) of upregulated lncRNA expression signature in confirming BC were 0.79 (95% CI: 0.70–0.85), 0.80 (95% CI: 0.73–0.85), 14.61 (95% CI: 10.91–19.55), 3.90 (95% CI: 3.03–5.02), 0.27 (95% CI: 0.20–0.36), and 0.86, respectively. Stratified analyses yielded a sensitivity of 0.83 (95% CI: 0.80–0.86) for serum-based analysis, which was higher than plasma-based analysis, whereas plasma-based analysis revealed a greater specificity of 0.88 (95% CI: 0.85–0.91). Moreover, lncRNA-homeotic genes (HOX) transcript antisense RNA showed a pooled specificity of 0.89 (95% CI: 0.84–0.93) and AUC of 0.86, which were superior to performances by lncRNA-metastasis-associated lung adenocarcinoma transcript-1 and -H19 in diagnosing BC. Notably, the analysis based on cancer subtypes demonstrated that lncRNA expression signature could distinguish triple-negative BC (lacks estrogen receptor, progesterone receptor, and human epidermal growth factor receptor 2 expression) from non-triple-negative BC, with an AUC of 0.85.
Conclusion: Upregulated lncRNAs reveal an immense potential as novel non-invasive biomarker(s) that could complement BC diagnosis.
Keywords: lncRNA, breast cancer, diagnosis, meta-analysis
Introduction
Breast cancer (BC) represents 25% of all cancer cases and 15% of all cancer-related deaths among females.1 Clinically, the final diagnosis of BC still depends on histological examinations (gold standard), which is invasive and also accounts for a significant delay in establishing a formal diagnosis. The routine blood markers for BC diagnosis, including carbohydrate antigen 15-3 and carcinoembryonic antigen, are essential in this regard, but the diagnostic efficacy of these biomarkers is still limited.2,3 It is of pivotal importance, therefore, to find non-invasive biomarkers with high sensitivity and specificity, which can be used for BC detection at early stages.
Long non-coding RNA (lncRNA) is one special type of the non-protein coding RNA transcripts with a sequence longer than 200 nucleotides.4 It has been reported that lncRNAs are associated with enhancer regions, and could influence increased activities of neighboring genes.5 LncRNAs have been demonstrated to be differentially expressed in BC tissues compared with non-tumoral tissues.6–8 Moreover, a recent study has confirmed key regulatory roles of lncRNAs in BC biology through diverse mechanisms.9 Of note, emerging evidences have highlighted the potential clinical value of lncRNAs as biomarker(s) in identifying BC.6–8,10–16 However, the clinical utilities of lncRNAs remain uncertain as the published signatures virtually do not overlap. Some fresh viewpoints indicated that the diagnostic accuracy of lncRNAs for BC is yet to be accepted. The aim of this meta-analysis is to estimate the overall pooled efficacy of lncRNAs in confirming BC, so as to offer diagnostic basis for the development of novel biomarkers for BC at the molecular level.
Materials and methods
Literature search
The Preferred Reporting Items for Systematic reviews and Meta-Analyses criteria were used to guide the implementation of this meta-analysis.17 Systematic literature retrieval was undertaken in PubMed, EMBASE, Wed of Science, China National Knowledge Infrastructure, and Wanfang databases till August 1, 2017, with language restriction to English and Chinese. The search terms applied for the electronic databases were: (“long non-coding RNA” or “non-coding RNA” or “lncRNA”) and (“breast” or “mastocarcinoma” or “breast carcinoma” or “breast cancer” or “breast tumor” or “breast neoplasm” or “tumor of breast”) and/or (“sensitivity” or “specificity” or “AUC” or “area under curve” or “ROC” or “Receiver operating characteristic curve” or “diagnosis”). The reference lists of articles were hand-searched for the collection of relevant studies.
Selection of studies
Articles meeting the following criteria were included: 1) clinical studies about lncRNA(s) in human BC; 2) studies that embraced paired cancer-free control(s); 3) studies in which data were available with the diagnostic sensitivity, specificity, or AUC of lncRNA(s) for BC; and 4) English- or Chinese-language publications. Articles not meeting the following criteria were excluded: 1) publications that incorporated <20 participants; 2) studies that aimed to report other types of RNAs rather than lncRNA(s); 3) studies where data were incomplete to enable construction of a 2×2 contingency tables; and 4) letters to the editor, updates, interviews, commentaries, review papers, and animal studies.
Data extraction
Data extracted were values of true positives, true negatives, false positives, and false negatives in diagnostic studies. Where such data were unavailable, the estimated sensitivities and specificities were used to calculate these data to complete the 2×2 tables. Moreover, original author, year of publication, lncRNA type, sample size, sample type, test method, cut-off value, and reference gene were recorded from the included studies. Data from different lncRNA types or evaluation methods were treated as distinct or individual studies in this meta-analysis. We had group discussions and contacted authors for clarification of questions or unclear data when arguments arose.
Quality assessment
Methodological quality of each study was assessed using the Quality Assessment of Diagnostic Accuracy Studies (QUADAS) II criteria.18 The tool includes 14 questions, and the answer of risk for bias could be rated as “No”, “Yes”, or “Unclear”, corresponding to a score of “1”, “0”, and “0”, respectively. The included studies were eliminated if they were judged to be of low quality.
Statistical analyses
The meta-analysis was conducted with Stata 12.0 (Stata Corporation, College Station, TX, USA) and Meta-Disc 1.4 (XI Cochrane Colloquium, Barcelona, Spain) software. We calculated several primary outcomes, including pooled sensitivity, specificity, diagnostic odds ratio (DOR), likelihood ratio positive (LR+), and likelihood ratio negative (LR–) with their corresponding 95% CIs using a bivariate model. The summary receiver operator characteristic (SROC) curve was plotted and the pooled AUC value was calculated. False positive report probability (FPRP) analysis was performed according to the study by Wacholder et al.19 Heterogeneity for each outcome was assessed using Cochran’s Q and I2 statistics (significant level was P<0.05 or I2>50%). The meta-analysis model (fixed or random) was selected depending on the degree of study heterogeneity. Sensitivity analysis was undertaken by excluding each study from the analyses to ascertain its effect on the overall results. Meta-regression test was further conducted to identify the potential sources of study heterogeneity. Publication bias was measured using visual funnel plot and quantitative Deeks’ funnel plot asymmetry test by Stata 12.0 program. Any study not equally distributed in visual funnel plot or P<0.05 in Deeks’ funnel plot asymmetry test was considered to have statistically significant bias.
Results
Characteristics and quality of the included studies
The selection procedure is demonstrated schematically in Figure 1. We identified 484 articles from the online databases based on the search criteria, of which 434 studies were excluded due to irrelevant contents (n=372) or review papers (n=62). In the subsequent stages, 39 of 50 records were identified as basic research (n=20), clinical studies (n=13), or meta-analyses (n=6), and were all eliminated. One study plotted ROC curves of 3-lncRNA signature in predicting the overall survival of BC,20 and was excluded in our analysis as well. Finally, 10 studies 6–8,10–16 were identified that fulfilled our inclusion criteria and thus, were used for statistical analyses.
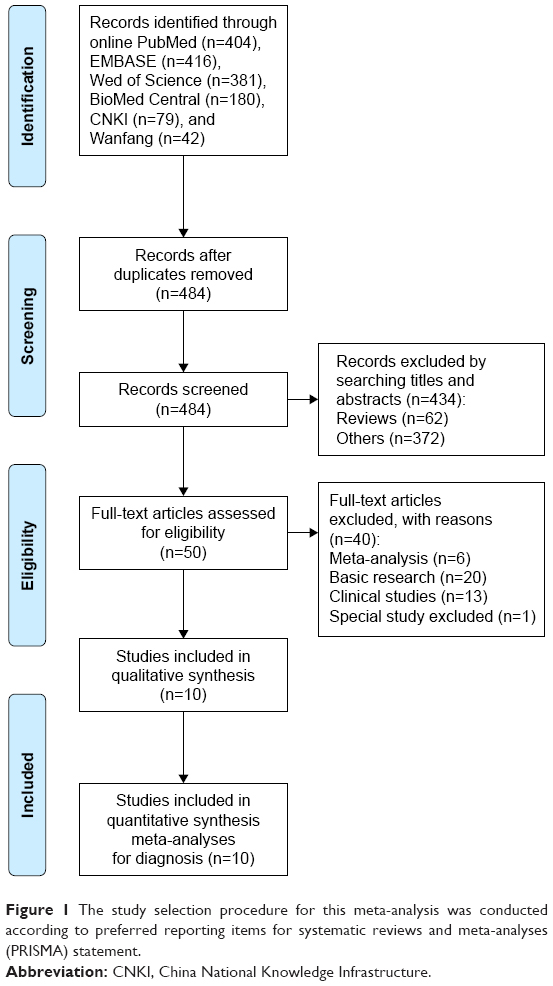 | Figure 1 The study selection procedure for this meta-analysis was conducted according to preferred reporting items for systematic reviews and meta-analyses (PRISMA) statement. |
Study characteristics and quality assessments
Ten diagnostic studies involving 835 BC patients and 725 paired controls were included in the analysis. All study participants were Chinese. The sample size varied from 30 to 120, and all BC patients received definite diagnosis by histopathological examinations of specimens. The lncRNA expression signature included H19, homeotic genes (HOX) transcript antisense RNA (HOTAIR), metastasis-associated lung adenocarcinoma transcript-1 (MALAT1), ANRIL, HIFA-AS2, urothelial carcinoma-associated 1 (UCA1), and RP11-445H22.4, and all revealed upregulated status in BC. The paired controls comprised healthy individuals,7,8,10,11,13–16 and non-BC controls.6,12 Additionally, the specimen types were serum in 4 studies,10–13 plasma in 5 studies,7,8,11,14,16 and urine in 1 study.15 Method of testing in all studies was real-time polymerase chain reaction, and lncRNAs were normalized to β-actin,7,8,14–16 glyceraldehyde-3-phosphate dehydrogenase,6,10–12 and U6.13 Publication languages were confined to English8,11–14 and Chinese.6,7,10,15,16 We also included 1 study on the clinical utility of lncRNA expression signature in distinguishing between triple-negative BC (TNBC, lacks estrogen receptor, progesterone receptor, and human epidermal growth factor receptor 2 expression) and non-TNBC in our subgroup analyses.11 The main features of the included studies are displayed in Table 1.
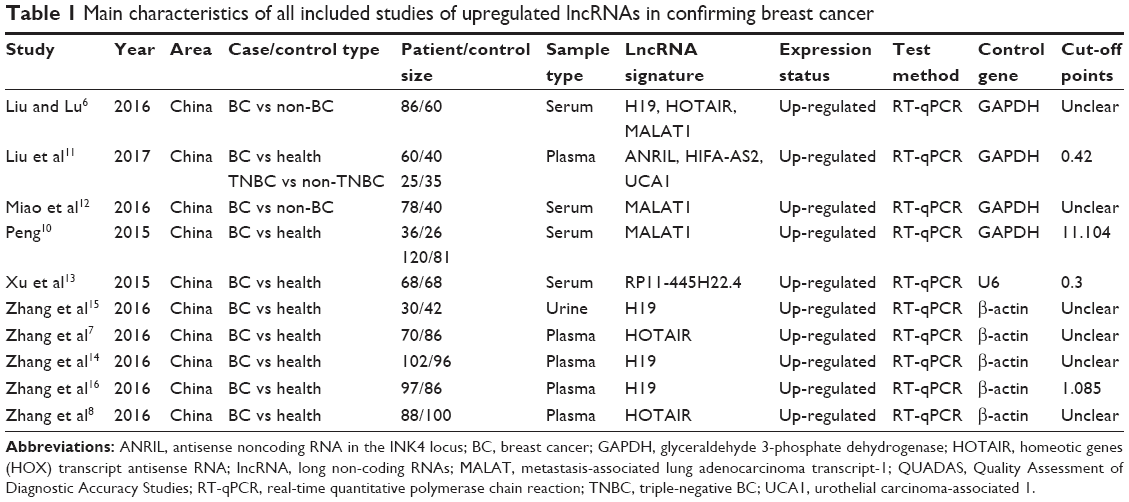 | Table 1 Main characteristics of all included studies of upregulated lncRNAs in confirming breast cancer |
Figure 2 summarizes the proportions of risk of bias in the enrolled studies by QUADAS II checklist, and Table 1 lists the QUADAS scores for each study. As indicated in Table 1, only 1 study received a QUADAS score of 8,12 while all the other studies presented QUADAS scores ≥10, suggesting that the included studies were reliable to be synthesized in the meta-analysis.
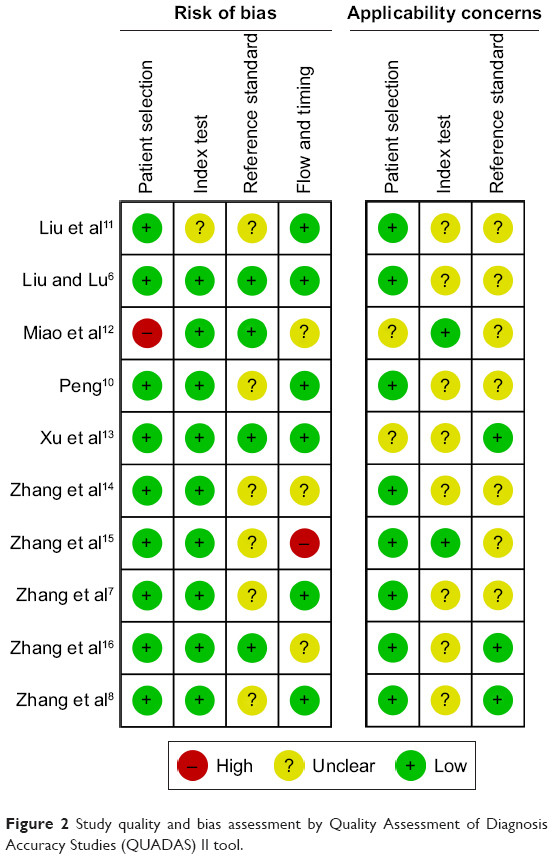 | Figure 2 Study quality and bias assessment by Quality Assessment of Diagnosis Accuracy Studies (QUADAS) II tool. |
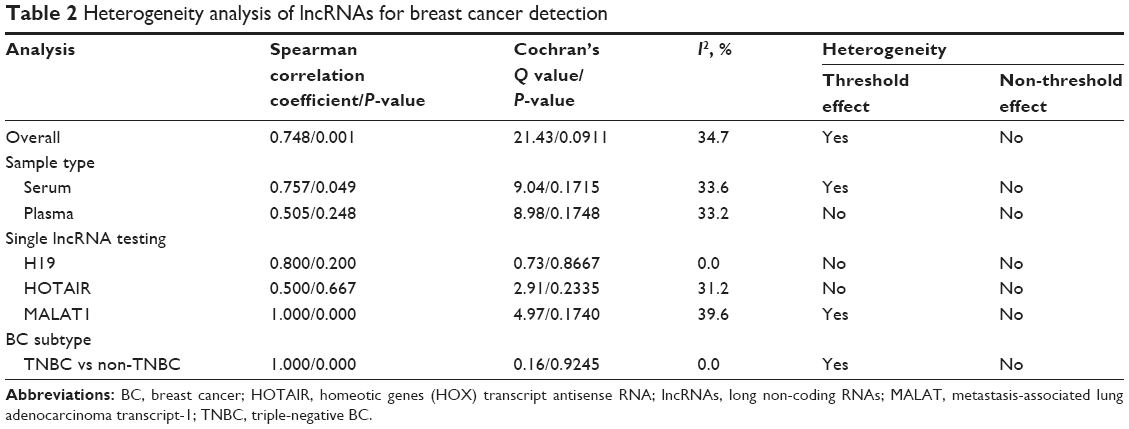
Heterogeneity
Cochran’s Q and I2 tests were conducted to assess heterogeneity generated by non-threshold effect, and Spearman’s correlation coefficient was used to evaluate heterogeneity from threshold effect. In our analysis, the non-threshold effect was not significant among all the pooled effect sizes (Table 2). Nevertheless, the P-values of Spearman’s correlation coefficient in the overall pooled analysis, as well as serum-, MALAT1-, and BC subtype-based analyses were all <0.05, indicating the existence of heterogeneity from threshold effect (Table 2). No heterogeneity was detected in tissue-, H19-, and HOTAIR-based analyses (Table 2).
 | Table 2 Heterogeneity analysis of lncRNAs for breast cancer detection |
Diagnostic performance
Figure 3A and B displays the pooled sensitivity and specificity, respectively, of lncRNA profiling for BC diagnosis by means of forest plots. The overall pooled results for sensitivity, specificity, LR+, LR−, and DOR with 95% CIs were 0.79 (95% CI: 0.70–0.85), 0.80 (95% CI: 0.73–0.85), 3.90 (95% CI: 3.03–5.02), 0.27 (95% CI: 0.20–0.36), and 14.61 (95% CI: 10.91–19.55), respectively. The combined AUC value was estimated to be 0.86 from the SROC curve (Figure 3C), indicating an overall high efficacy as a diagnostic test.
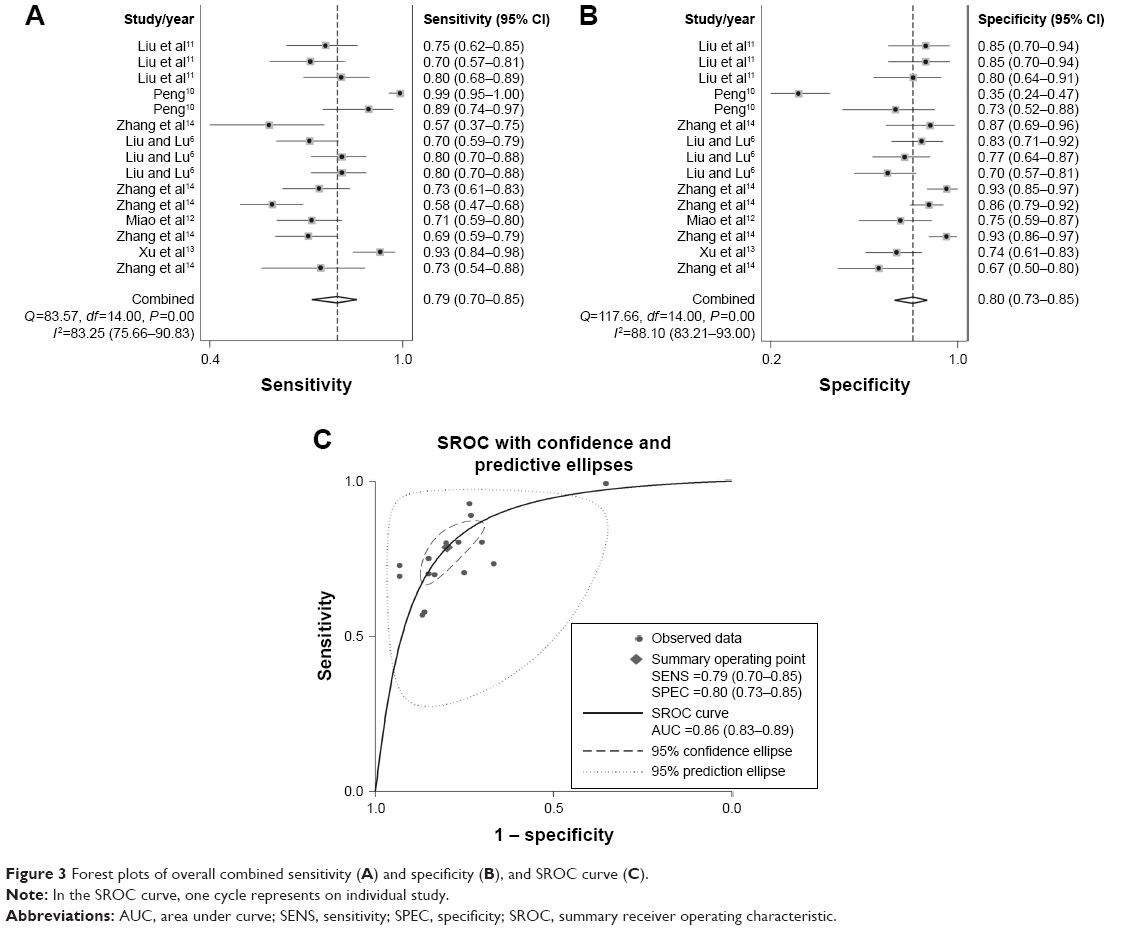 | Figure 3 Forest plots of overall combined sensitivity (A) and specificity (B), and SROC curve (C). |
Subgroup analyses
Subgroup analyses were performed according to particular characteristics such as sample type, single lncRNA testing, and BC subtype. As shown in Table 3, we found differences in serum- and plasma-based analyses, where the estimated AUC values were 0.84 and 0.86, respectively. Of note, the serum-based analysis yielded a sensitivity of 0.83 (95% CI: 0.80–0.86), which was higher than plasma-based analysis, whereas the plasma-based analysis conferred a better specificity of 0.88 (95% CI: 0.85–0.91). In the meta-analyzed data based on single lncRNA testing, lncRNA-HOTAIR manifested a pooled specificity of 0.89 (95% CI: 0.84–0.93) and AUC of 0.86, which were superior to lncRNA-MALAT1 and -H19; however, lncRNA-MALAT1 testing achieved a better sensitivity of 0.83 (95% CI: 0.79–0.87) among these 3 lncRNAs. Moreover, the analysis in terms of cancer subtype suggested that lncRNA expression profile could distinguish TNBC from non-TNBC, with sensitivity, specificity, LR+, LR−, DOR, and AUC of 0.73 (95% CI: 0.62–0.83), 0.80 (95% CI: 0.71–0.87), 3.56 (95% CI: 2.39–5.30), 0.35 (95% CI: 0.23–0.54), 12.26 (95% CI: 5.87–25.59), and 0.85, respectively.
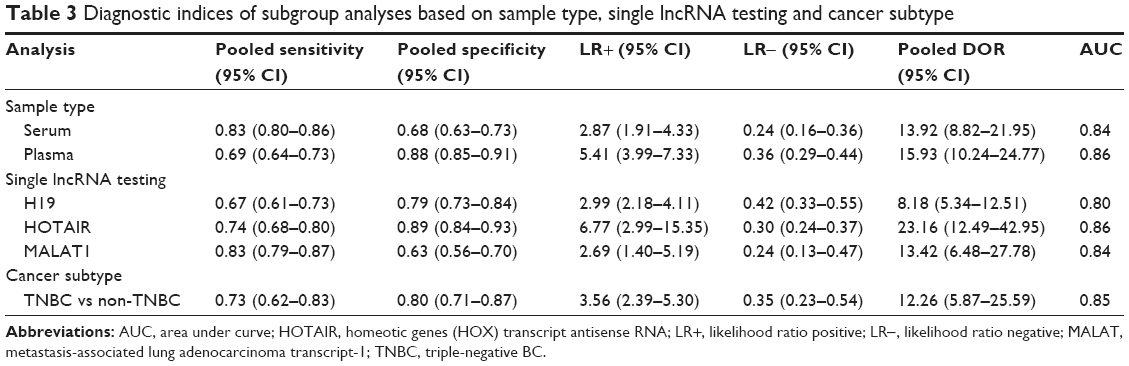 | Table 3 Diagnostic indices of subgroup analyses based on sample type, single lncRNA testing and cancer subtype |
FPRP analysis
FPRP analysis was performed to verify whether the positive findings were real.19 We preset an FPRP value of 0.5, odds ratio of 1.5, and α level of 0.05. When π=0.1 (moderate prior probability), the FPRP value calculated based on our sample sizes was estimated to be 0.46, which was lower than the preset FPRP value of 0.5; when π=0.01 (low prior probability), the FPRP value was 0.81, which was higher than the preset FPRP value (0.5). The analysis revealed that the results were reliable when π=0.1, with moderate prior probability.
Influence analysis and meta-regression
Influence analysis was conducted with Stata 12.0 software. As displayed in Figure 4, no included individual studies were out of the upper or lower CI limits, suggesting that the selected studies had relatively high homogeneity. On the other hand, meta-regression was performed based on the platform of Meta-Disc 1.4 software. Five covariates, including sample types, patient size, control size, reference gene, and QUADAS score were corroborated to confirm the origins of heterogeneity. As shown in Table 4, sample type received the lowest P-value of 0.0442 among the analyses, indicating that different sample types were likely to be the source of study heterogeneity.
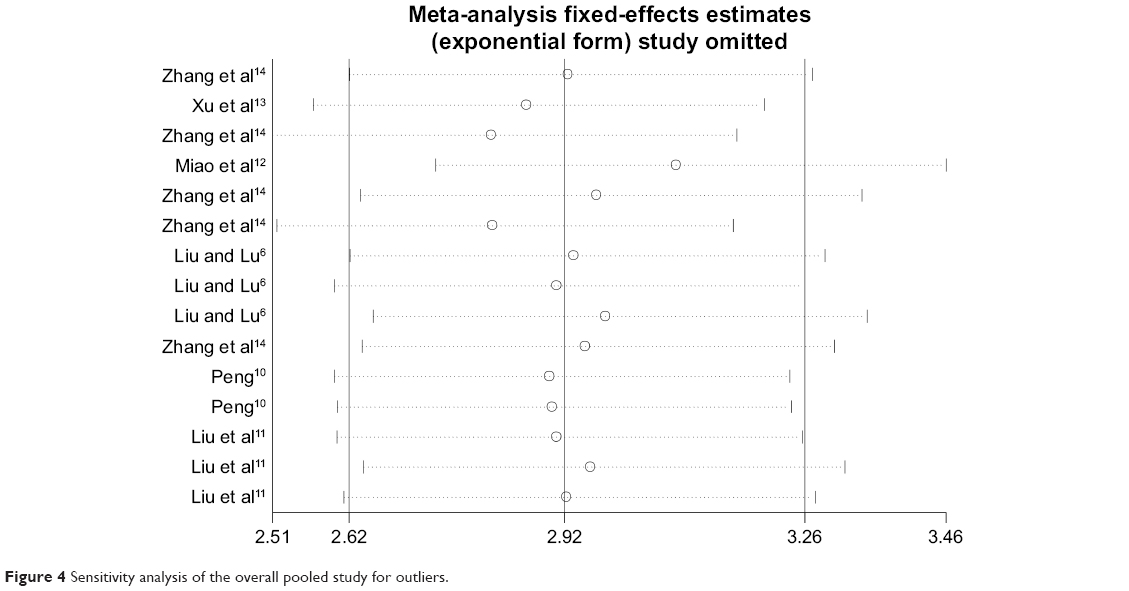 | Figure 4 Sensitivity analysis of the overall pooled study for outliers. |
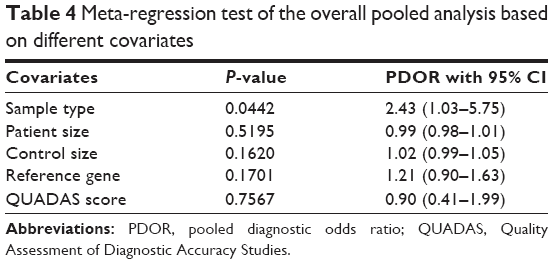 | Table 4 Meta-regression test of the overall pooled analysis based on different covariates |
Publication bias
Publication bias was judged by funnel plot and Deeks’ funnel plot asymmetry test. Funnel plot showed that all included studies were relatively symmetrically distributed (Figure 5A). Moreover, Deeks’ funnel plot asymmetry test with a P-value of 0.185 revealed no proof of publication bias among the overall pooled study (Figure 5B).
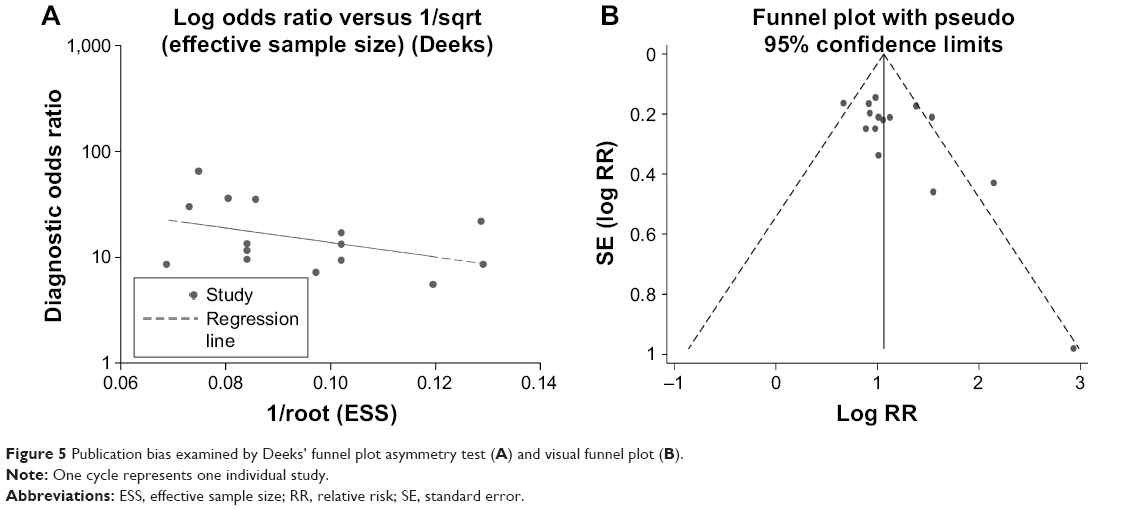 | Figure 5 Publication bias examined by Deeks’ funnel plot asymmetry test (A) and visual funnel plot (B). |
Discussion
BC is one of the most frequently diagnosed cancers that also accounts for most cancer-related deaths among females worldwide.1 Dysregulation of lncRNAs in BC has been highlighted by many investigations.6–8,10–16 In order to examine the reported diagnostic efficacy of abnormally expressed lncRNAs in BC and evaluate whether lncRNA expression signature could be rated as additional molecular marker(s) to aid in BC diagnosis, we meta-analyzed the overall diagnostic accuracy of lncRNAs in BC.
A total of 10 studies were examined to assess the diagnostic value using a bivariate meta-analysis model. This procedure allows reliable validation of a large collection of samples by combining several independent datasets with wide CIs. As expected, lncRNA expression profile harbored a pooled sensitivity of 0.79 and specificity of 0.80, corresponding to a LR+ of 3.90, LR− of 0.27, and DOR of 14.61, showing an overall high diagnostic performance as a test. The AUC value is also a major indicator for a diagnostic test as follows: the ideal position indicative of a perfect test is near the upper-left corner in a SROC curve. In our analysis, the SROC curve revealed an AUC of 0.86, which again indicates that lncRNA expression profile could be a powerful biomarker for BC detection. Similar studies have documented that abnormally expressed lncRNAs could be rated as auxiliary biomarker(s) to aid in gastric cancer (GC) diagnosis, with a combined AUC of 0.80.21 Our data achieved higher efficacy for lncRNA signature in BC than in GC.
In our subgroup analyses by sample type, we found differences between serum-, and plasma-based analyses. The serum-based analysis seemed to achieve a higher sensitivity than plasma-based analysis, whereas the plasma-based analysis conferred a better specificity than the former. In the analysis of single lncRNA testing for BC, lncRNA-HOTAIR manifested a pooled specificity of 0.89 and AUC of 0.86, which were superior to lncRNA-MALAT1 and -H19, yet, lncRNA-MALAT1 testing achieved a better sensitivity than lncRNA-HOTAIR and -H19. Studies have shown that lncRNA-MALAT1, -HOTAIR and -H19 are promising predictors for monitoring cancer prognosis.22–24 We herein compared the diagnostic efficacy of these 3 lncRNAs for BC and showed that they were also promising biomarkers for BC diagnosis. On the other hand, the analysis in terms of BC subtype indicated that lncRNA expression signature (ANRIL, HIFA-AS2, and UCA1) could distinguish TNBC from non-TNBC, with an AUC of 0.85. TNBC represents 10%–20% of all BC cases and yields easier lymphatic metastatic status and poorer clinical outcomes than other BC subtypes.25–27 Our study also provides evidence that lncRNAs are also capable of differentiating TNBC from non-TNBC, which may further help guide therapeutic strategy in the clinic.
The FPRP analysis was undertaken to assess whether we had achieved a convincing conclusion.19 The analysis showed that the results were reliable when analyzed with moderate prior probability, but could not exclude false positives when analyzed with low prior probability. However, the presetting of π, as well as FPRP and odds ratio values were subjective, thus the accuracy of our FPRP analysis was limited and more evidence is needed to confirm our results.
Heterogeneity should be taken into account when interpreting the results of a meta-analysis. Threshold and non-threshold effects contribute to primary causes of heterogeneity in diagnostic studies.28 In the current study, although the study populations consisted of only Chinese, and study designs were similar among studies, the control sources were complicated: some were from healthy individuals and others were non-cancer controls. Additionally, the control gene(s) and cut-off values were different among studies. All these factors may be origins of heterogeneity. Consequently, sensitivity analysis was used to identify the underlying outlier studies that may have contributed to the generation of heterogeneity. However, no obvious studies were identified as outliers, suggesting that the enrolled studies were of high homogeneity. On the other hand, meta-regression analysis was implemented to explore the underlying causes that may have led to heterogeneity. Based on our results, the different sample types seem to be one of the major reasons responsible for the generation of homogeneity.
Our meta-analysis has a couple of limitations that require consideration. First, we may have exaggerated the relative risk because the pooled results are based on only 10 included studies with relatively small sample sizes, which may have introduced a variety of confounding factors to the results. Second, the characteristics of the Chinese population in this meta-analysis do not completely represent the situation in other regions, thus there may be the population bias in the analysis. Finally, our language restrictions may have led to data bias from the publications.
Conclusion
In general, the quantitative meta-analysis confirmed the promising diagnostic efficacy of lncRNA signature as promising biomarker(s) for BC detection. Of note, the different sample types, as well as lncRNA and BC subtypes were associated with different results. In consequence, further studies on the diagnostic performance of lncRNA(s) in BC are warranted.
Acknowledgment
This study was supported by the foundation project of National Health and Family Planning commission (No. WJ2017M211).
Author contributions
All authors contributed toward data analysis, drafting and critically revising the paper, and agree to be accountable for all aspects of the work.
Disclosure
The authors report no conflicts of interest in this work.
References
Torre LA, Bray F, Siegel RL, Ferlay J, Lortet-Tieulent J, Jemal A. Global cancer statistics, 2012. CA Cancer J Clin. 2015;65(2):87–108. | ||
Bates SE, Longo DL. Tumor markers: value and limitations in the management of cancer patients. Cancer Treat Rev. 1985;12(3):163–207. | ||
Duffy MJ, Evoy D, McDermott EW. CA 15-3: uses and limitation as a biomarker for breast cancer. Clin Chim Acta. 2010;411(23–24):1869–1874. | ||
Peng WX, Koirala P, Mo YY. LncRNA-mediated regulation of cell signaling in cancer. Oncogene. 2017;36(41):5661–5667. | ||
Orom UA, Shiekhattar R. Long non-coding RNAs and enhancers. Curr Opin Genet Dev. 2011;21(2):194–198. | ||
Liu YH, Sun SY, Lu CT. Identification of long non-coding RNA expression profile in tissue and serum of breast cancer. Chin J Clinicians (Electronic Edition). 2016;10(12):1710–1713. | ||
Zhang KJ, Zhang Y, Luo ZL, et al. [Long non-coding RNA HOTAIR in plasma as a potential biomarker for breast cancer diagnosis]. J South Med Univ. 2016;36(4):488–492. Chinese. | ||
Zhang Y, Zhang K, Luo Z, Liu L, Wu L, Liu J. Circulating long non-coding HOX transcript antisense intergenic ribonucleic acid in plasma as a potential biomarker for diagnosis of breast cancer. Thorac Cancer. 2016;7(6):627–632. | ||
Malih S, Saidijam M, Malih N. A brief review on long noncoding RNAs: a new paradigm in breast cancer pathogenesis, diagnosis and therapy. Tumour Biol. 2016;37(2):1479–1485. | ||
Peng H. Diagnosis Value of Serum Non Coding RNA on Non-Small Cell Lung Cancer and Breast Cancer and Correlation between miR-574-5p and Breast Cancer Migration [thesis article for PhD]. Beijing: Peking Union Medical College; 2015:1–139. | ||
Liu M, Xing LQ, Liu YJ. A three-long noncoding RNA signature as a diagnostic biomarker for differentiating between triple-negative and non-triple-negative breast cancers. Medicine. 2017;96(9):e6222. | ||
Miao Y, Fan R, Chen L, Qian H. Clinical Significance of Long Non-coding RNA MALAT1 Expression in tissue and serum of breast cancer. Ann Clin Lab Sci. 2016;46(4):418–424. | ||
Xu N, Chen F, Wang F, et al. Clinical significance of high expression of circulating serum lncRNA RP11-445H22.4 in breast cancer patients: a Chinese population-based study. Tumour Biol. 2015;36(10):7659–7665. | ||
Zhang K, Luo Z, Zhang Y, et al. Circulating lncRNA H19 in plasma as a novel biomarker for breast cancer. Cancer Biomar. 2016;17(2):187–194. | ||
Zhang KJ, Zhang Y, Luo ZL, Wu LC, Zhang L, Liu JB. Diagnostic value of urinary lncRNA H19 for breast cancer. Shandong Med J. 2016;56(18):42–44. | ||
Zhang Y, Luo Z, Zhang KJ, Wu LC, Zhang L, Liu JB. Potential value of plasma long non-coding RNA H19 in the diagnosis of breast cancer. Chin J Clin Lab Sci. 2016;34(4):264–267. | ||
Moher D, Liberati A, Tetzlaff J, Altman DG; PRISMA Group. Preferred reporting items for systematic reviews and meta-analyses: the PRISMA statement. Int J Surg. 2010;8(5):336–341. | ||
Whiting P, Rutjes AW, Reitsma JB, Bossuyt PM, Kleijnen J. The development of QUADAS: a tool for the quality assessment of studies of diagnostic accuracy included in systematic reviews. BMC Med Res Methodol. 2003;3:25. | ||
Wacholder S, Chanock S, Garcia-Closas M, El Ghormli L, Rothman N. Assessing the probability that a positive report is false: an approach for molecular epidemiology studies. J Natl Cancer Inst. 2004;96(6):434–442. | ||
Guo W, Wang Q, Zhan Y, et al. Transcriptome sequencing uncovers a three-long noncoding RNA signature in predicting breast cancer survival. Sci Rep. 2016;6:27931. | ||
Cui Z, Chen Y, Xiao Z, et al. Long noncoding RNAs as auxiliary biomarkers for gastric cancer screening: a pooled analysis of individual studies. Oncotarget. 2016;7(18):25791–25800. | ||
Liu FT, Pan H, Xia GF, Qiu C, Zhu ZM. Prognostic and clinicopathological significance of long noncoding RNA H19 overexpression in human solid tumors: evidence from a meta-analysis. Oncotarget. 2016;7(50):83177–83186. | ||
Shuai P, Zhou Y, Gong B, et al. Long noncoding RNA MALAT1 can serve as a valuable biomarker for prognosis and lymph node metastasis in various cancers: a meta-analysis. SpringerPlus. 2016;5(1):1721. | ||
Wang L, Zhao Y, Qin Y, et al. High expression of long non-coding HOX antisense transcript RNA and its clinical significance in cancer tissues: A meta-analysis. Thoracic Cancer. 2017;8(5):387–392. | ||
Basso SM, Santeufemia DA, Fadda GM, Tozzoli R, D’Aurizio F, Lumachi F. Advances in the Treatment of Triple-negative Early Breast Cancer. Medicinal Chemistry (Shariqah (United Arab Emirates)). 2016;12(3):268–272. | ||
Li CY, Zhang S, Zhang XB, Wang P, Hou GF, Zhang J. Clinicopathological and prognostic characteristics of triple- negative breast cancer (TNBC) in Chinese patients: a retrospective study. Asian Pacific Journal of Cancer Prevention: APJCP. 2013;14(6):3779–3784. | ||
Yin WJ, Lu JS, Di GH, et al. Clinicopathological features of the triple-negative tumors in Chinese breast cancer patients. Breast Cancer Research and Treatment. 2009;115(2):325–333. | ||
Huang Y, Qiu L, Mei AL, Li JX. Meta-analysis on the diagnostic value of laser Doppler imaging for burn depth. Zhonghua shao shang za zhi (Chinese journal of burns). 2017;33(5):301–308. |
 © 2018 The Author(s). This work is published and licensed by Dove Medical Press Limited. The
full terms of this license are available at https://www.dovepress.com/terms
and incorporate the Creative Commons Attribution
- Non Commercial (unported, 3.0) License.
By accessing the work you hereby accept the Terms. Non-commercial uses of the work are permitted
without any further permission from Dove Medical Press Limited, provided the work is properly
attributed. For permission for commercial use of this work, please see paragraphs 4.2 and 5 of our Terms.
© 2018 The Author(s). This work is published and licensed by Dove Medical Press Limited. The
full terms of this license are available at https://www.dovepress.com/terms
and incorporate the Creative Commons Attribution
- Non Commercial (unported, 3.0) License.
By accessing the work you hereby accept the Terms. Non-commercial uses of the work are permitted
without any further permission from Dove Medical Press Limited, provided the work is properly
attributed. For permission for commercial use of this work, please see paragraphs 4.2 and 5 of our Terms.