Back to Journals » OncoTargets and Therapy » Volume 9
Up-regulated expression of phospholipase C, β1 is associated with tumor cell proliferation and poor prognosis in hepatocellular carcinoma
Authors Li J, Zhao X, Wang D, He W, Zhang S, Cao W, Huang Y, Wang L, Zhou S, Luo K
Received 26 September 2015
Accepted for publication 7 November 2015
Published 21 March 2016 Volume 2016:9 Pages 1697—1706
DOI https://doi.org/10.2147/OTT.S97189
Checked for plagiarism Yes
Review by Single anonymous peer review
Peer reviewer comments 4
Editor who approved publication: Dr William C. Cho
Junxiang Li,1 Xuya Zhao,1 Dazhi Wang,1 Wei He,1 Shuai Zhang,1 Wei Cao,1 Yu Huang,1 Ling Wang,1 Shi Zhou,1 Kaijian Luo2
1Department of Interventional Radiology, 2Department of Oncology, GuiZhou Cancer Hospital, Cancer Hospital of Guizhou Medical University, Guiyang, People’s Republic of China
Background: Phospholipase C, β1 (PLCB1) plays critical roles in intracellular transduction and regulating signal activation which are important to tumorigenesis. However, the mechanism of PLCB1 in hepatocellular carcinoma (HCC) is still unknown. This study aims to investigate whether its expression is associated with the clinicopathological parameters and prognosis of the patients with HCC.
Methods: Immunohistochemistry on two tissue microarrays containing 141 cases of HCC tissues and adjacent non-tumorous tissues were performed to analyze the correlation between PLCB1 expression and clinicopathological features. Kaplan–Meier analysis and Cox multivariate analysis were performed to determine the PLCB1 expression in HCC prognosis. Furthermore, effects of PLCB1 on proliferation of HCC cells were explored using a colony formation assay and apoptosis assay.
Results: We identified that PLCB1 expression was significantly higher in tumor tissues than that in adjacent non-tumorous tissues and associated with advanced tumor stage. Kaplan–Meier survival analysis showed that patients with PLCB1-positive tumors had poorer survival than the patients with PLCB1-negative tumors. In multivariate analyses, PLCB1 expression was an independent prognostic factor. Moreover, overexpression of PLCB1 in HCC cells promoted cell proliferation and inhibited apoptosis, while knocking down PLCB1 reduced cell viability in vitro. Further investigation found that activation of ERK signaling might involve in PLCB1-mediated cell growth.
Conclusion: Our study suggests that PLCB1 promotes the progression of HCC and can be served as an independent prognostic factor and a promising therapeutic target in HCC.
Keywords: PLCB1, HCC, prognosis, cell proliferation, ERK
Introduction
Hepatocellular carcinoma (HCC) is one of the leading cause of cancer-related death and the fifth most common malignancy worldwide. Despite the facts that current clinical treatments such as hepatectomy and liver transplantation have made significant achievements for combating this disease, the long-term prognosis of HCC remains unfavorable, and the 5-year survival rate was approximately 12% due to the tumor aggressive metastasis and recurrence.1,2 Studies on revealing the mechanisms underlying HCC progression have found important oncogenes and pathways which promoted tumor development.3 However, HCC is a systemic disease, which involves alternations of genes, cells, and tissues which are all deregulated. Thus, aiming to improve the outcome of the patients with HCC, it is necessary to identify novel molecular targets, which play key regulatory roles in tumor cell proliferation and metastasis.
Phospholipase C, β1 (PLCB1) is encoded by the PLCB1 gene which is located at chromosome 20p12. It is originally identified as a member of GPCR (G-protein-coupled receptor)-associated PLC-β isoforms that catalyze the formation of inositol 1,4,5-trisphosphate (IP3) and diacylglycerol (DAG) from phosphatidylinositol 4,5-bisphosphate (PIP2).4 This reaction plays an important role in the intracellular transduction.5 Deregulation of signal transduction pathways frequently elicits survival advantages to tumors. The PLCB1 is activated by Gα and triggers a series of events, which lead to an increase in intracellular calcium.6 One consequence involved of this activation would be aberrant proliferative changes in the cell.
The PLCB1 has reported to be involved in several kinds of disease. Abnormal expression pattern of PLCB1 was observed in the brains of the patients with schizophrenia.7 The PLCB1 knockout mice displayed behaviors relevant to the cognitive symptoms of schizophrenia.8 The PLCB1 also acts as a key regulator in myoblast differentiation, functioning as a positive regulator in the correction of delayed differentiation of skeletal muscle in myotonic dystrophy myoblasts.9 In addition, PLCB1 could reduce cell damage under oxidative stress and prevent α-synuclein aggregation.10 It has demonstrated that amplification of PLCB1 conferred a real advantage to K562 cell viability and protected cells from apoptosis.11,12 In addition, PLCB1 positively targets cyclin D3 and regulates cell cycle and cell proliferation through PKCα-mediated pathways.13 Overexpression of PLCB1 is found to be sufficient to drive Swiss 3T3 cell in S phase of the cell cycle.14 More importantly, elevated level of PLCB1 in carcinogenesis has also been recently reported.15 Molinari et al16 demonstrated that PLCB1 gene copy number altered in breast cancer and the overexpression of PLCB1 was associated with histological grade and proliferative index.
In this study, we showed that the expression of PLCB1 was elevated in HCC samples. Then, we analyzed the correlation between PLCB1 expression and clinicopathological parameters, aiming to investigate the role of PLCB1 in carcinogenesis and prognosis. Exogenous expression of PLCB1 in HCC cells promoted cell growth and migration, while knocking down PLCB1 retarded the cell proliferation. Furthermore, ERK signal was involved in PLCB1-mediated cell growth. Taken together, we found that PLCB1 could act as a prognostic factor in HCC.
Patients and methods
Cell culture
HEK293T cells, human immortalized hepatic cell line LO2 and HCC cell lines HepG2, Hep3B, LM3, Huh7, and H7402 were purchased from Cell Bank at the Chinese Academy of Sciences and American Type Culture Collection (ATCC). Cells were cultured in Dulbecco’s Modified Eagle’s Medium (Thermo Fisher Scientific, Waltham, MA, USA) supplemented with 10% fetal bovine serum (FBS, Thermo Fisher Scientific), 10 U/mL penicillin, and 10 mg/mL streptomycin. All cells were incubated at 37°C in a humidified incubator containing 5% CO2.
Immunohistochemical staining
Two tissue microarrays (TMAs) were used to analyze the expression of PLCB1. The study was approved by the Ethical Review Committee of the GuiZhou Cancer Hospital. The informed consent was provided and all the patients agreed with this study. The TMA1 and TMA2, which contained 51 cases and 90 cases of paired tumors and non-tumorous tissues, respectively were purchased from Shanghai Outdo Biotech Inc (Shanghai, People’s Republic of China). The microarrays were deparaffinized in xylene and rehydrated through graded alcohol. After antigen recovery in citrate buffer and neutralization of endogenous peroxidase, slides were blocked with 10% goat serum to decrease nonspecific staining. Then tissues sections were incubated with anti-PLCB1 antibody (1:200, sc-205, Santa Cruz Biotechnology Inc., Dallas, TX, USA) at 4°C overnight. After washing in phosphate buffered saline (PBS), the slides were performed by horseradish peroxidase-labeled second antibody for 30 minutes and again washed in PBS. The sections were then visualized using diaminobenzidine solution and counterstained with hematoxylin.
Each slide was evaluated using a semi-quantitative score system for both the intensity and the percentage of positive staining. Briefly, the intensity of staining was scored as: 0, 1, 2, 3 and the percentage was scored as: 0, 1, 2, 3. Then, the final score was calculated by multiplying the two scores and classified them into two groups which were low expression and high expression as described earlier.
Quantitative real-time PCR
Total RNA was isolated from cells using TRIzol reagent (Thermo Fisher Scientific, Waltham, MA, USA) as the manufacture’s recommendation. First-strand cDNA was synthesized using PrimeScript RT-PCR kit (Takara). The mRNA level of PLCB1 was detected using ABI 7500 Sequence Detection system with SYBR Green methods. β-Actin was used as the internal control. The primer pair used for amplification of the human PLCB1 gene was as follows: forward primer, 5′-GATGAGCCCAGATGGCCG-3′, and reverse primer, 5′-AGTTGAGTCATCATCCCACTTGA-3′. The primers for β-actin were as followed: forward primer, 5′-CATGTACGTTGCTATCCAGGC-3′, and reverse primer, 5′-CTCCTTAATGTCACGCACGAT-3′.
Western blot
Cells were lysed in radioimmunoprecipitation assay (RIPA) buffer (Sigma, Sigma-Aldrich, St Louis, MO, USA) containing a cocktail of proteinase inhibitors and phosphatase inhibitors according to the manufacture’s recommendation. The total protein concentration was determined by bicinchoninic acid method. A total of 60 μg of total protein was separated in 10% sodium dodecyl sulfate-polyacrylamide gel electropheresis. Then proteins were transferred to polyvinylidene fluoride membranes (Millipore). The membranes were blocked with fat-free milk and incubated with primary antibodies overnight. After washing with tris buffer saline Tween 20, the membranes were incubated with horseradish peroxidase-labeled secondary antibody and visualized by enhanced chemiluminescence. Anti-phospho-ERK1/2 (#4376), anti-ERK1/2 (#9102) were from Cell Signaling Technology Co (CST). Anti-PLCB1, anti-dual specificity phosphatase 1(DUSP1) (sc-370), and anti-β-actin (sc-47778) were from Santa Cruz Co (Santa Cruz Biotechnology).
Overexpression and RNAi-mediated knockdown of PLCB1
The PLCB1 cDNA was cloned into lentiviral vector pLKO.1 TRC. psPAX2 and pMD2G were used to construct recombinant lentivirus to establish the cell lines with stable overexpression of PLCB1. The short hairpin RNAs (shRNAs) targeting PLCB1 were obtained from Santa Cruz Co (Santa Cruz Biotechnology). A scrambled sequence was used as a control. Cell transfection was performed using the lipofectamine 2000 reagent (Thermo Fisher Scientific) as protocol described.
Cell viability and caspase-3/7 activity assay
For analyzing the viability of these kinds of cells, 2×10³ cells/ well were seeded in 96-well plates. Cell Counting Kit-8 (CCK-8, Dojindo, Shanghai, People’s Republic of China) was used to evaluate the cell viability following the manufacturer’s protocols at 24, 48, 72, and 96 hours. The absorbance was measured at 450 nm. The caspase-3/7 activity assay was performed at 72 hours under serum deprivation according to the protocol. All the experiments were repeated at least three times.
Colony formation assay
Cells were seeded into 6-well plates (2×10⁴ cells/well) and incubated for 10 days to form colonies. At the indicated time point, cells were washed twice with PBS, treated with crystal violet for 10 minutes, washed, then counted, and measured. All the experiments were performed at least three times.
Statistical analysis
Data were presented as the mean ± standard error of the mean (SEM) of three independent in vitro experiments. Statistical analysis and graphical representations were performed with SPSS 21.0 (IBM Corporation, Armonk, NY, USA) and GraphPad Prism 5 software (GraphPad Software, Inc., La Jolla, CA, USA). The relations between clinical features and the PLCB1 expression were analyzed using chi-squared test and in vitro studies were evaluated with the Student’s t-test. The Kaplan–Meier method was used to estimate overall survival (OS) and Cox regression model was applied to calculate univariate and multivariate hazard ratios for the study variables. A P-value less than 0.05 was considered statistically significant.
Results
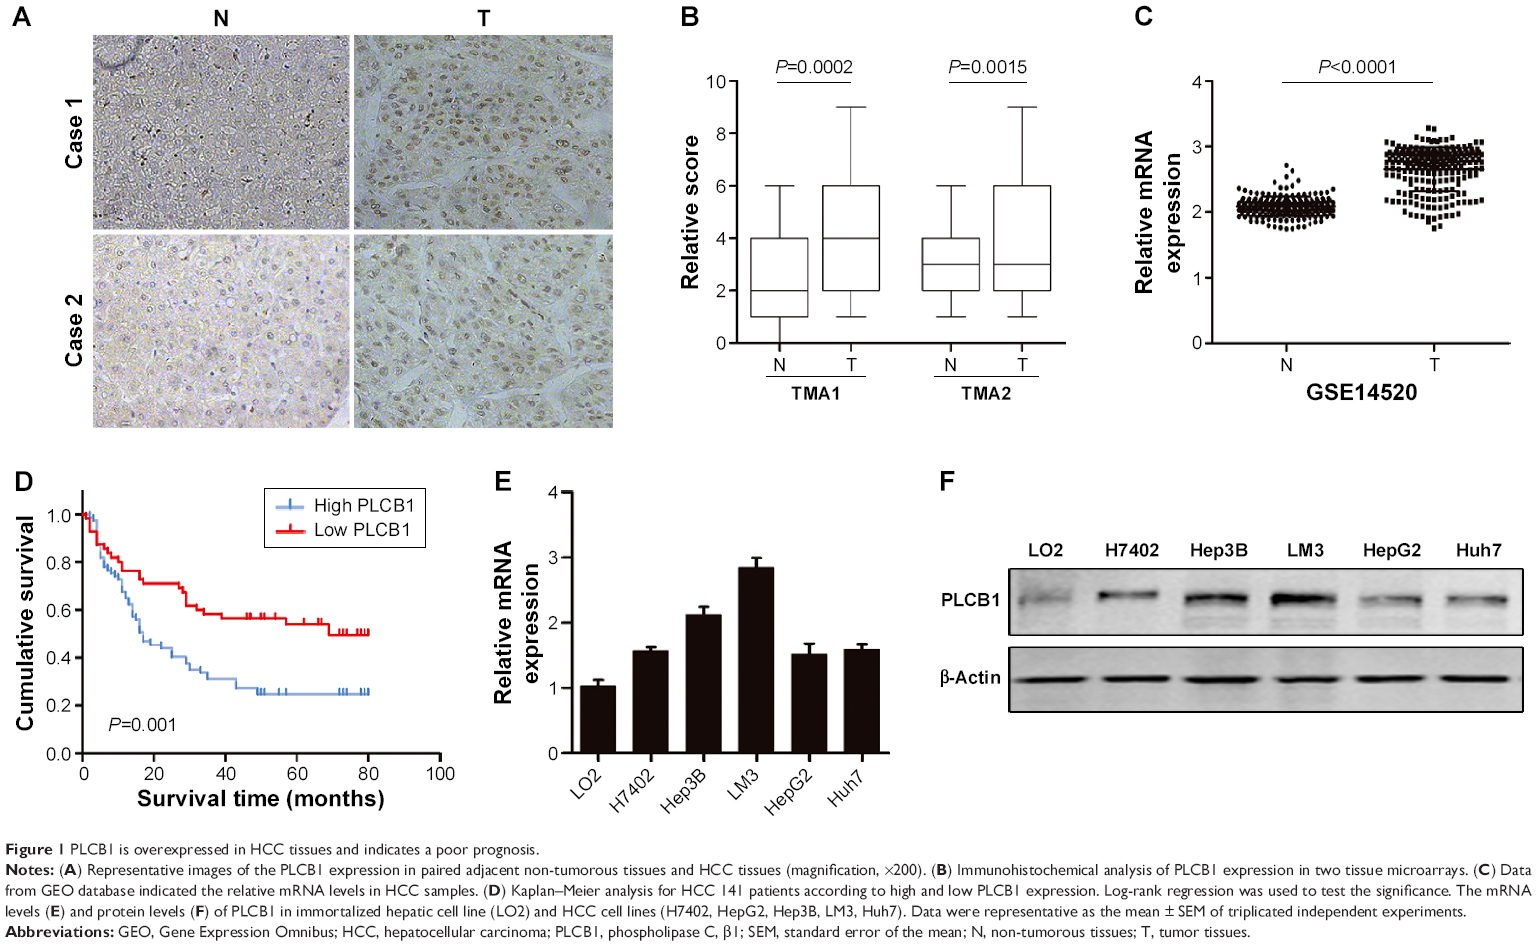
Up-regulated expression of PLCB1 indicates a poor prognosis in HCC
To explore the expression pattern of PLCB1 in HCC, two different TMAs were analyzed using immunohistochemical staining. The PLCB1 protein was detected both in the cytoplasm and nuclear of the HCC specimens. Indeed, PLCB1 was significantly overexpressed in HCC tissues than that in the adjacent non-tumorous tissues (Figure 1A and B). Moreover, the mRNA level of PLCB1 was notably elevated in liver cancer tissues of GSE14520 containing 221-patient cohort according from the Gene Expression Omnibus (GEO) (http://www.ncbi.nlm.nih.gov/geo) (Figure 1C).
 | Figure 1 PLCB1 is overexpressed in HCC tissues and indicates a poor prognosis. |
Among the 141 HCC specimens, a high expression of PLCB1 was detected in 80 samples (56.73%). The relationship between PLCB1 protein expression and clinicopathological features of HCC was analyzed (Table 1). The expression of PLCB1 correlated with T stage (P=0.0145), while no significant relationship with other features was found.
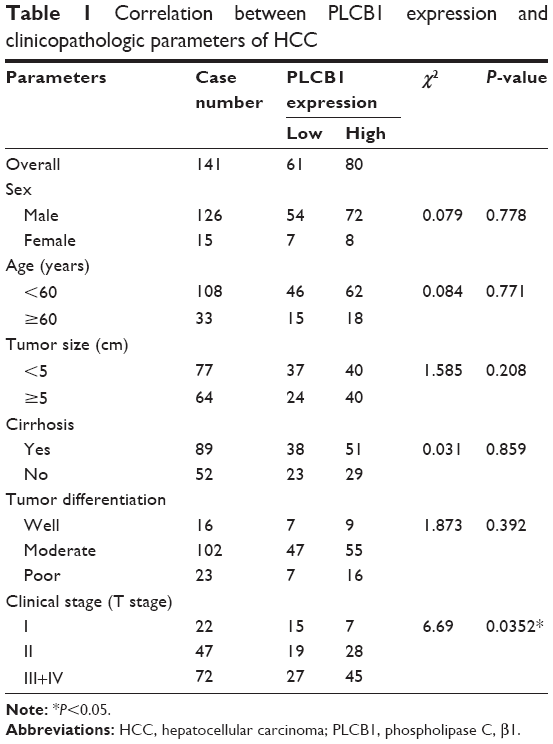 | Table 1 Correlation between PLCB1 expression and clinicopathologic parameters of HCC |
To further assess the possible association between HCC PLCB1 expression and patient survival, Kaplan–Meier curves with a log-rank test for OS were performed in 141 cases. As shown in Figure 1D, the patients with positive tumor PLCB1 expression had a lower OS rate than the patients with negative PLCB1 expression. The estimated mean OS time was significantly different between the patients with PLCB1-positive and PLCB1-negative tumors (P=0.001). These results indicated that PLCB1 expression is significantly related to the OS.
Cox regression analysis was undertaken to analyze the prognostic factors for the 141 patients with HCC. Using a univariate analysis, OS was significantly associated with tumor differentiation, tumor size, T stage, and PLCB1 expression. Multivariate analysis demonstrated that positive PLCB1 expression remained a significant independent prognostic factor for HCC survival (Table 2).
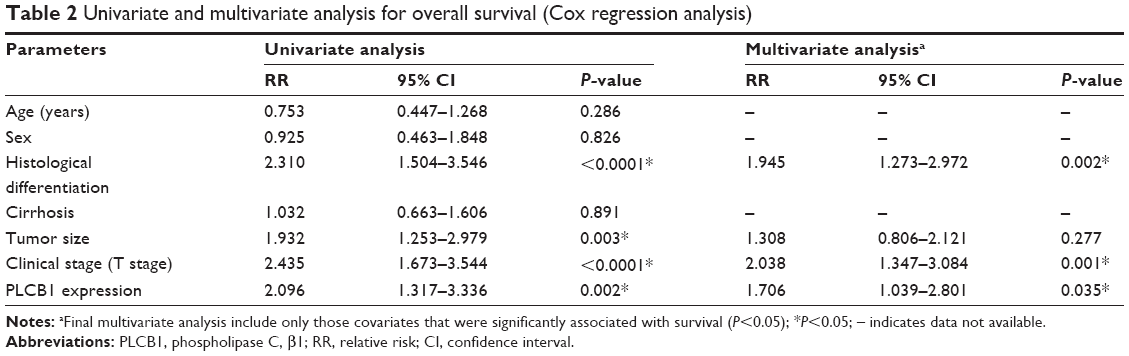 | Table 2 Univariate and multivariate analysis for overall survival (Cox regression analysis) |
PLCB1 promotes cell proliferation and inhibits cell apoptosis
To further investigate the function of PLCB1 in HCC cells, PLCB1 expression in HCC cell lines was examined by qRT-PCR and Western blot, and the results showed that mRNA (Figure 1E) and protein (Figure 1F) expression levels of PLCB1 were higher in the HCC cell lines than the immortalized liver cell LO2. Then we constructed PLCB1 stably overexpressed HepG2 and Huh7 cells using lentivirus infection. The exogenous of PLCB1 was confirmed using Western blot (Figure 2A). For CCK-8 assay, the results indicated that overexpression of PLCB1 exhibited markedly increased cell viability in relation to the control cells (Figure 2B). Consistent with the CCK-8 assay, we performed the colony formation assay, and the crystal violet staining showed that upregulation of PLCB1 in HepG2 and Huh7 cells significantly increased their growth compared with control cells (Figure 2C). Moreover, the apoptosis assay was undertaken when cells were starved for 72 hours. The data showed that caspase-3/7 activity, which was an index of apoptosis, was notably reduced after PLCB1 overexpressed (Figure 2D). Collectively, these results suggested that PLCB1 overexpression could promote cell growth and inhibit apoptosis.
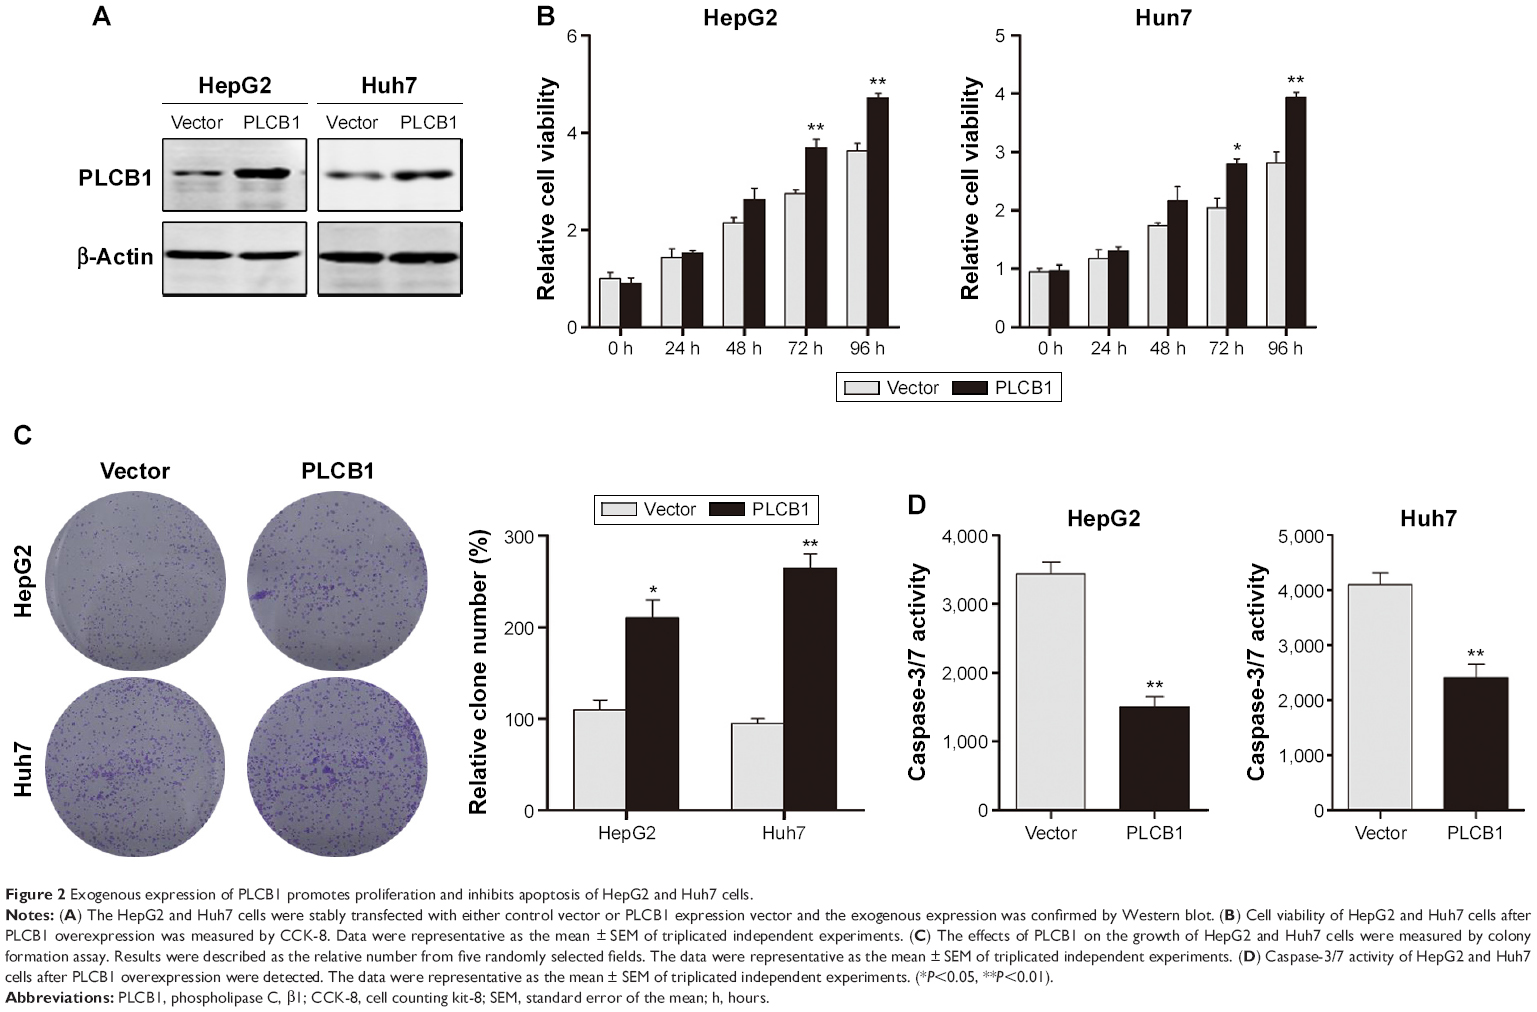 | Figure 2 Exogenous expression of PLCB1 promotes proliferation and inhibits apoptosis of HepG2 and Huh7 cells. |
To further confirm the biofunction of PLCB1, we knocked down the endogenously expressed PLCB1 via lentivirus-delivered shRNA (sh-1 and sh-2). As shown in Figure 3A, both of the PLCB1-targeting shRNAs decreased the expression of PLCB1 in Hep3B and LM3 effectively compared to control shRNA (shcon). In the in vitro cell viability and colony formation assays, it was observed that downregulation of PLCB1 significantly abrogated cell proliferation (Figure 3B and C). In addition, caspase-3/7 activities of knocked down cells were also higher than control cells (Figure 3D). Taken together, downregulation of PLCB1 inhibited the malignant phenotypes of HCC cells.
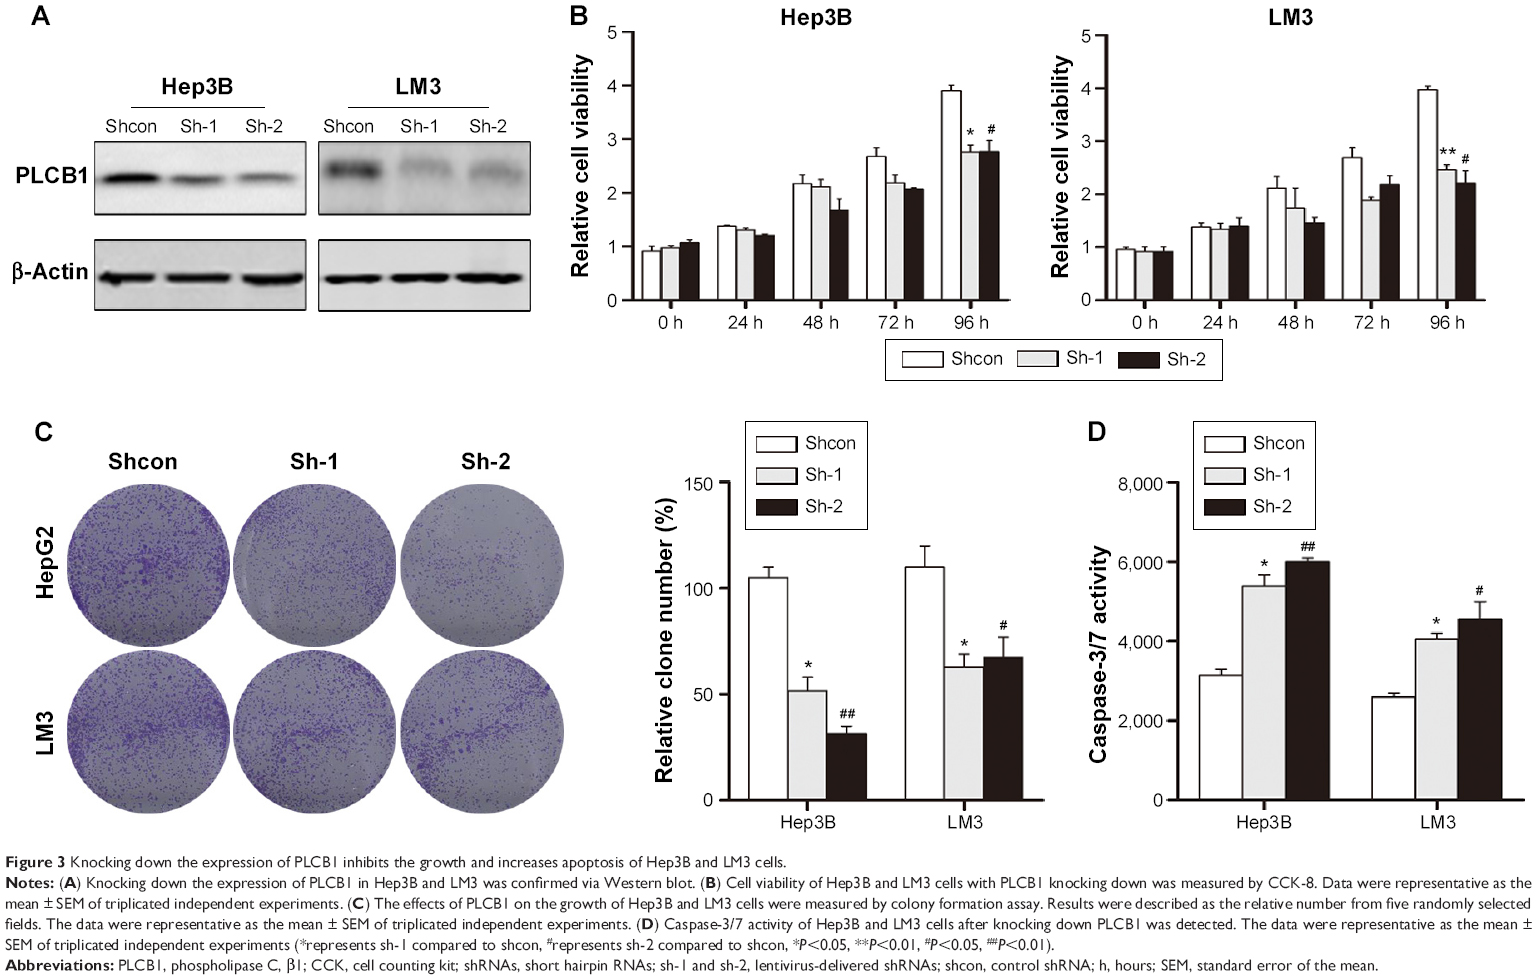 | Figure 3 Knocking down the expression of PLCB1 inhibits the growth and increases apoptosis of Hep3B and LM3 cells. |
ERK signaling activation involves in the oncogenic properties of PLCB1
In HCC, the mechanism of PLCB1 function remains unknown. The ERK signaling is a critical survival signal and controls cell proliferation and death. To investigate possible mechanisms related to PLCB1-induced proliferation and apoptosis, ERK activation status was examined via Western blot. The results indicated that exogenous expression of PLCB1 in HepG2 and Huh7 cells significantly stimulated the phosphorylation of ERK 1/2, while knocking down of PLCB1 in Hep3B cells effectively downregulated the phosphorylation level (Figure 4A and B). We also examined the expression of DUSP1, however, there were no changes. These results suggested the PLCB1 could modulate the activation of ERK signaling in HCC cells. Functionally, using ERK signaling inhibitor U0126 abolished the promoting effects of PLCB1 on the growth of HCC cells (Figure 4C), indicating that ERK activation involved in the oncogenic properties of PLCB1.
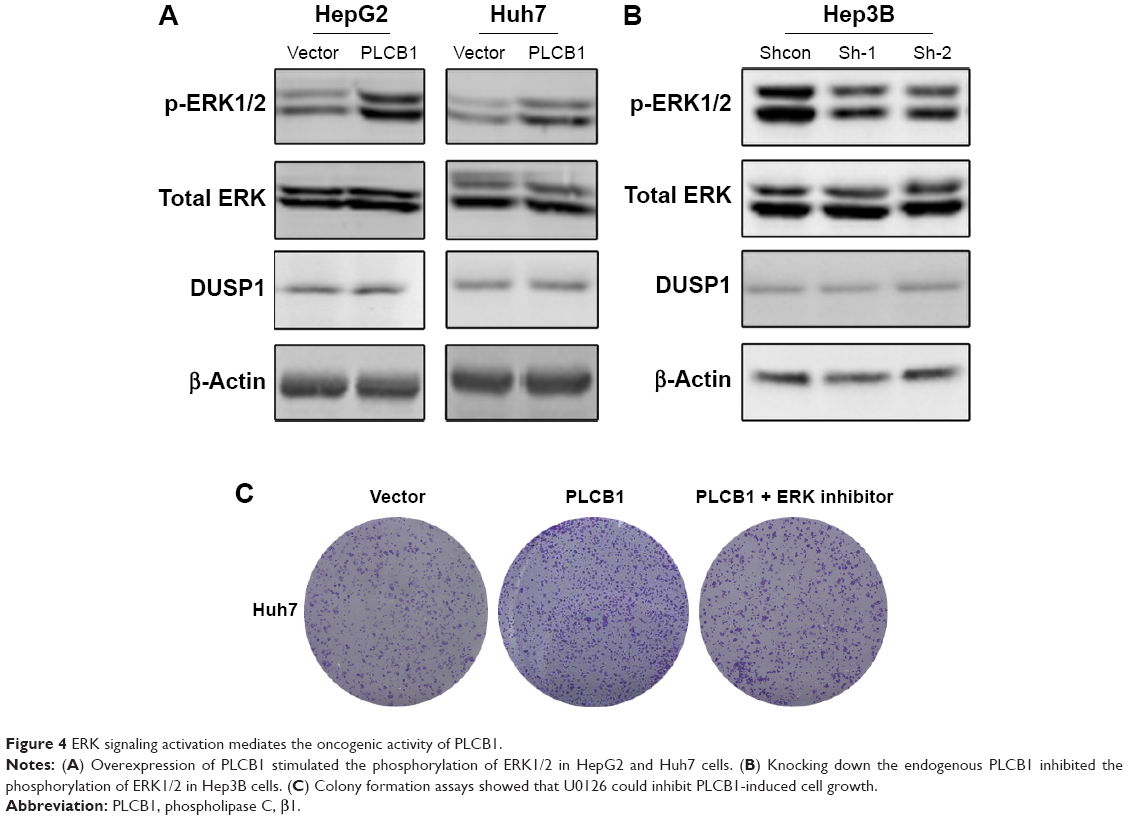 | Figure 4 ERK signaling activation mediates the oncogenic activity of PLCB1. |
Discussion
Oncogenes deregulation and abnormal activation of key pathways are always required to maintain the proliferation advantage of malignant diseases and might be essential for non-tumorous cells to acquire tumor-initiating capacity.17,18 Dysregulation of PLCB1 has been observed in several diseases, including hematopoietic system and breast cancer. However, the expression profile and the function of PLCB1 in HCC remain largely unclear. Here, we identified PLCB1 as a novel oncogene and independent prognostic marker of HCC. The in vitro experiments revealed that overexpression of PLCB1 promoted cell growth, while knocking down inhibited the growth. Besides, we found that ERK signaling aberrant activation might be involved in PLCB1-mediated cell growth. More importantly, in clinical specimens, positive correlations between PLCB1 expression and advanced tumor stage suggested that the elevated expression of PLCB1 might contribute to the progression of HCC.
Signal transduction networks could transmit information about the external environment of the cell and integrate these stimulations to trigger the activation of cellular internal pathways. The PLCB1 encodes the phosphoinositide-specific enzyme, PLCB1, which could be activated by G-proteins and catalyzes the formation of second messengers, initiating the signal cascade.19 Several studies have demonstrated that PLCB1 played important roles in modulating various functional aspects of diseases.10,20 In the murine model, PLCB1 knock out results in an epileptic phenotype.6 In addition, PLCB1 was involved in the generation of IP3 production evoked by histamine stimulation in HeLa cells.21 In breast cancer, gain of PLCB1 closely related to histological grade and proliferative index, and low expression of PLCB1 in luminal-like A type tumors which had a relatively good prognosis.16 An earlier study found that a role for gains on chromosomes 8q and 20 as predictors of poor outcome in hepatoblastomas.22 The PLCB1 gene is located at chromosome 20p12, which makes us concern its up-regulated status.
Up to now, no reports on the possible association between PLCB1 expression and the clinicopathological features of HCC were published. Our results revealed significant correlations between the overexpression of PLCB1 and tumor T stage. While there were no significant correlations between PLCB1 and tumor differentiation, tumor size, and cirrhosis, it implicated that PLCB1 was involved in the complicated mechanisms on tumor initiation. Furthermore, it could be possibly used as a biomarker to identify subsets of HCC with the aggressive phenotype. In addition, the patients with positive PLCB1 exhibited a lower 5-year OS. Multivariate analyses indicated that PLCB1 expression in HCC was an independent prognostic factor for survival as well as histological differentiation and T stage.
The mechanism by which PLCB1 contributes to HCC progression is not well elucidated. We performed in vitro experiments to demonstrate that overexpression of PLCB1 could promote cell proliferation and inhibit apoptosis. Moreover, in our study, PLCB1 was observed to activate ERK signaling, which has been proved to affect cell growth and apoptosis. Also, it has been reported that ERK activation could be regulated by dual-specificity phosphatase DUSP1 which dephosphorylated ERK.23 However, there were slightly changes on DUSP1 expression when we affected PLCB1 expression, suggesting alternative mechanisms underlying regulation of ERK activation. Moreover, it has been reported that insulin-like growth factor I (IGF-I) could cause rapid nuclear translocation of activated ERK and concurrently induce phosphorylation of nuclear PLCB1, initiating the phosphoinositide cycle.24 These might be a positive regulatory loop between PLCB1 and ERK signaling. In recent years, compounds inhibiting the kinase activity of ERK have yielded preclinical results and made some progress in cancer treatment.25 As shown in Figure 4C, the proliferation acceleration effect mediated by overexpression of PLCB1 was partially abolished by ERK inhibitor. It has been demonstrated that the antiproliferative efficacy of inhibitors aimed at ERK signals depends on the driver oncogenic lesion. At the next stage of the cascade, expression levels of effectors such as Fra-1 and c-Myc were controlled by ERK activation through an integrative process.25 In further studies, more experimentation will be required to explore the molecular mechanisms of PLCB1 in HCC pathogenesis and metastasis. In addition, we would also study the role of PLCB1 in a variety of cancers such as colorectal cancer and prostate cancer.
Conclusion
A specific upregulation of PLCB1 in the patients with HCC has been identified in this work. This overexpression might possess a crucial role in promoting tumorigenesis, and moreover, it is closely correlated with aggressive malignant behavior and could predict poor prognosis. All these results from both clinical specimens and in vitro experiments supported a role of PLCB1 in HCC development and provided a potential molecular target for detection and treatment of HCC. We proposed that inhibition of PLCB1-mediated pathway might give insight to the novel therapeutic strategy for controlling tumor progression in HCC.
Disclosure
The authors report no conflicts of interest in this work.
References
Forner A, Gilabert M, Bruix J, Raoul J-L. Reply: heterogeneity of intermediate-stage HCC necessitates personalized management including surgery. Nat Rev Clin Oncol. 2015;12(1):10. | ||
Kanwal F, El-Serag HB, Ross D. Surveillance for hepatocellular carcinoma: can we focus on the mission? Clin Gastroenterol Hepatol. 2015;13(4):805–807. | ||
Zucman-Rossi J, Villanueva A, Nault J-C, Llovet JM. Genetic landscape and biomarkers of hepatocellular carcinoma. Gastroenterology. 2015. | ||
Martelli AM, Fiume R, Faenza I, et al. Nuclear phosphoinositide specific phospholipase C (PI-PLC)-beta 1: a central intermediary in nuclear lipid-dependent signal transduction. Histol Histopathol. 2005;20(4):1251–1260. | ||
Spyridakis S, Leondaritis G, Nakos G, Lekka ME, Galanopoulou D. A specific phospholipase C activity regulates phosphatidylinositol levels in lung surfactant of patients with acute respiratory distress syndrome. Am J R Cell Mol Biol. 2010;42(3):357–362. | ||
Ngoh A, McTague A, Wentzensen IM, et al. Severe infantile epileptic encephalopathy due to mutations in PLCB1: expansion of the genotypic and phenotypic disease spectrum. Dev Med Child Neurol. 2014;56(11):1124–1128. | ||
Vasco VRL, Cardinale G, Polonia P. Deletion of PLCB1 gene in schizophrenia–affected patients. J Cell Mol Med. 2012;16(4):844–851. | ||
Poduri A, Chopra SS, Neilan EG, et al. Homozygous PLCB1 deletion associated with malignant migrating partial seizures in infancy. Epilepsia. 2012;53(8):e146–e150. | ||
Cocco L, Finelli C, Mongiorgi S, et al. An increased expression of PI-PLCβ1 is associated with myeloid differentiation and a longer response to azacitidine in myelodysplastic syndromes. J Leuk Biol. 2015;98(5):769–780. | ||
Guo Y, Scarlata S. A loss in cellular protein partners promotes α-synuclein aggregation in cells resulting from oxidative stress. Biochemistry. 2013;52(22):3913–3920. | ||
Poli A, Faenza I, Chiarini F, Matteucci A, McCubrey JA, Cocco L. K562 cell proliferation is modulated by PLCβ1 through a PKCα-mediated pathway. Cell Cycle. 2013;12(11):1713–1721. | ||
Bavelloni A, Poli A, Fiume R, et al. PLC-beta 1 regulates the expression of miR-210 during mithramycin-mediated erythroid differentiation in K562 cells. Oncotarget. 2014;5(12):4222–4231. | ||
Bavelloni A, Dmitrienko GI, Goodfellow VJ, et al. PLCβ1a and PLCβ1b selective regulation and cyclin D3 modulation reduced by kinamycin F during k562 cell differentiation. J Cell Physiol. 2015;230(3):587–594. | ||
Ho KK, Mann DJ. Nuclear signalling through phospholipase C and phosphatidyl 4, 5–bisphosphate. Signal Transduct. 2006;6(2):92–100. | ||
Fiume R, Huang X, Ramazzotti G, et al. Phospholipase c beta 1 (PLCb1) in acute myeloid leukemia (AML): a novel potential therapeutic target. Ital J Anat Embryol. 2014;119(1):88. | ||
Molinari C, Medri L, Follo MY, et al. PI-PLCβ1 gene copy number alterations in breast cancer. Oncol Rep. 2012;27(2):403–408. | ||
Drabsch Y, Ten Dijke P. TGF-β signalling and its role in cancer progression and metastasis. Cancer Metastasis Rev. 2012;31(3–4):553–568. | ||
Yin X-X, Ye H-L, Zhang G, et al. Targeting IP3-dependent calcium signaling enhances sorafenib lethality for hepatoma via ER stress related apoptosis. FASEB J. 2015;29(1 Supplement):945–947. | ||
Philip F, Sahu S, Caso G, Scarlata S. Role of phospholipase C-β in RNA interference. Adv Biol Regul. 2013;53(3):319–330. | ||
Follo MY, Faenza I, Piazzi M, et al. Nuclear PI-PLCβ1: an appraisal on targets and pathology. Adv Biol Regul. 2014;54:2–11. | ||
Ishida S, Matsu-Ura T, Fukami K, Michikawa T, Mikoshiba K. Phospholipase C-β1 and β4 contribute to non-genetic cell-to-cell variability in histamine-induced calcium signals in HeLa cells. PLoS One. 2014;9(1):e86410. | ||
Weber RG, Pietsch T, von Schweinitz D, Lichter P. Characterization of genomic alterations in hepatoblastomas. A role for gains on chromosomes 8q and 20 as predictors of poor outcome. Am J Pathol. 2000;157(2):571–578. | ||
Albeck JG, Mills GB, Brugge JS. Frequency-modulated pulses of ERK activity transmit quantitative proliferation signals. Mol Cell. 2013;49(2):249–261. | ||
Xu A, Suh PG, Marmy-Conus N, et al. Phosphorylation of nuclear phospholipase C beta1 by extracellular signal-regulated kinase mediates the mitogenic action of insulin-like growth factor I. Mol Cell Biol. 2001;21(9):2981–2990. | ||
Herrero A, Pinto A, Colón-Bolea P, et al. Small molecule inhibition of ERK dimerization prevents tumorigenesis byRAS-ERK pathway oncogenes. Cancer Cell. 2015;28(2):170–182. |
 © 2016 The Author(s). This work is published and licensed by Dove Medical Press Limited. The
full terms of this license are available at https://www.dovepress.com/terms
and incorporate the Creative Commons Attribution
- Non Commercial (unported, 3.0) License.
By accessing the work you hereby accept the Terms. Non-commercial uses of the work are permitted
without any further permission from Dove Medical Press Limited, provided the work is properly
attributed. For permission for commercial use of this work, please see paragraphs 4.2 and 5 of our Terms.
© 2016 The Author(s). This work is published and licensed by Dove Medical Press Limited. The
full terms of this license are available at https://www.dovepress.com/terms
and incorporate the Creative Commons Attribution
- Non Commercial (unported, 3.0) License.
By accessing the work you hereby accept the Terms. Non-commercial uses of the work are permitted
without any further permission from Dove Medical Press Limited, provided the work is properly
attributed. For permission for commercial use of this work, please see paragraphs 4.2 and 5 of our Terms.