
Back to Journals » Clinical Interventions in Aging » Volume 20
Unsupervised Clustering of Vertebral Hounsfield Units in Opportunistic Chest CT for Stratifying Bone Mass Subtypes in a 2 Years’ Period
Authors Yang H, Li J, Zheng X, Su D, Jia C, Qin J, Zhang Q
Received 2 May 2025
Accepted for publication 4 September 2025
Published 13 September 2025 Volume 2025:20 Pages 1561—1569
DOI https://doi.org/10.2147/CIA.S538123
Checked for plagiarism Yes
Review by Single anonymous peer review
Peer reviewer comments 5
Editor who approved publication: Dr Zhi-Ying Wu
Hui Yang,1,2,* Jiang Li,2,* Xiuzhu Zheng,2 Datian Su,2 Cheng Jia,2 Jian Qin,2 Quan Zhang1
1Department of Medical Imaging, Tianjin Key Laboratory of Functional Imaging & Tianjin Institute of Radiology, Tianjin Medical University General Hospital, Tianjin, People’s Republic of China; 2Department of Medical Imaging, The Second Affiliated Hospital of Shandong First Medical University, Taian, People’s Republic of China
*These authors contributed equally to this work
Correspondence: Quan Zhang, Department of Medical Imaging, Tianjin Medical University General Hospital, No. 154, Anshan Road, Heping District, Tianjin City, People’s Republic of China, Email [email protected]
Background: There is an urgent need for a convenient and incidental method to assess the bone health status of the population, especially in primary-level hospitals lacking specialized bone density testing equipment. This study aims to investigate the association between multiple vertebral Hounsfield Unit (HU) value clusters and bone mass subtypes using an unsupervised learning approach, providing a practical tool for incidental osteoporosis screening in clinical settings.
Materials and Methods: This retrospective study included subjects who underwent chest CT and quantitative CT (QCT) from January 2023 to December 2024. Vertebral HU values (T7–T12) were measured on chest CT images. Intergroup comparisons (normal, osteopenia, and osteoporosis) in clinical findings and CT values were performed using Pearson χ2 test and one-way analysis of variance. An unsupervised k-means clustering was applied to vertebral CT values across the cohort.
Results: The study comprised 455 participants (260 males, 195 females) with a median age of 60 years (interquartile range, 51– 67 years), who were classified into three groups: normal bone mass, 253 cases; osteopenia, 152 cases; osteoporosis, 50 cases. Among 455 participants, age inversely correlated with bone mass. Vertebrae HU values (T7–T12) exhibited significant stepwise declines from normal to osteopenia to osteoporosis (OP) groups. The clustering analysis revealed five distinct subtypes: cluster 1 strongly correlated with OP (45 of 72 cases), cluster 4 with osteopenia (107 of 146 cases), and clusters 2, 3, and 5 with normal bone mass (31 of 31 cases; 90 of 107 cases; 97 of 99 cases).
Conclusion: Unsupervised clustering of T7–T12 vertebral HU values effectively stratifies bone mass subtypes, offering an efficient, CT-based screening method for skeletal health assessment, especially valuable in resource-limited primary-level hospitals lacking dedicated bone densitometry.
Keywords: osteoporosis, machine learning, computed tomography, cluster analysis
Introduction
Osteoporosis (OP) is a major global health concern among the elderly, with a high and increasing prevalence.1,2 Its most severe consequence—fragility fractures—leads to significant morbidity, with projections estimating 4.83 million major fragility fractures (vertebrae, hip, and wrist) in China by 2035.3,4 However, a considerable proportion of individuals with fragility fractures risk are not identified in a timely manner, resulting in delayed treatment initiation. Furthermore, once fractures occur, they entail prolonged hospitalization and rehabilitation for patients, thereby imposing a substantial burden on healthcare systems.5 Among them, vertebral fractures are the most common, frequently resulting chronic pain, spinal deformities, and height loss, further deteriorating the physical and mental health of patients.6 Evidently, improving OP awareness and early diagnosis is critical for fracture prevention and prognosis enhancement.
The current gold standard for OP diagnosis, dual-energy X- ray absorptiometry (DXA), is extensively adopted due to its low cost, minimal radiation, and ability to measure the bone mineral density (BMD) of the lumbar spine and hip simultaneously.7 However, DXA provides only a 2D projection of bone density and can be influenced by factors such as soft-tissue attenuation, vertebral fractures, or spinal degenerative changes, potentially leading to misclassification of bone mass status.8 In contrast, quantitative computed tomography (QCT) offers a 3D BMD assessment, enabling separate measurement of trabecular and cortical bone without interference from surrounding structures.9 Despite its advantages, QCT requires specialized equipment and software, limiting its widespread use.
Clustering analysis, a data-driven statistical method, has demonstrated significant potential in disease diagnosis by identifying distinct imaging or clinical subtypes with differing prognoses.10–13 By exploiting radiomic features or clinical data, it can uncover latent patterns that traditional methods may overlook. Applying this technique to OP could enhance diagnostic precision and reveal novel subgroups with varying fracture risks.
Despite advances in OP diagnosis, there remains a need for more convenient, incidental methods to assess bone mass, particularly in resource-limited primary care settings where DXA/QCT availability is restricted. Notably, chest computed tomography (CT), routinely performed for various diagnostic and follow-up purposes, presents an ideal opportunity for OP screening.14–16 However, to our knowledge, no prior study has explored the relationship between multi-vertebral HU values clustering and bone mass subtypes using an unsupervised learning approach. In this study, we hypothesized that unsupervised clustering of vertebral HU values could effectively stratify bone mass status. Our primary aim was to investigate the association between these data-driven clusters and clinical defined bone mass subtypes, offering a novel, supplementary screening tool for spinal OP detection.
Materials and Methods
Study Sample
This retrospective study analyzed consecutive cases who underwent both chest CT and QCT examinations at our hospital from January 2023 to December 2024. The research protocol received ethical approval from the Institutional Review Boards of the Second Affiliated Hospital of Shandong First Medical University. Based on a retrospective design of the study, the Ethics Committee waived informed consent and de-identified patient information. The inclusion criteria comprised: ① age ≥ 30 years; ② diagnostic-quality chest CT images allowing clear visualization of thoracic vertebrae; ③ availability of complete BMD test results of QCT. The exclusion criteria included: ① presence of vertebral fractures, tumors, infections, or other structural abnormalities; ② recent history (< 6 months) of bone-modifying therapies; ③ significant image artifacts compromising vertebral segmentation. After applying these criteria, 455 subjects (260 males, 195 females; mean age 59.15±11.69 years) were included in the final analysis (Figure 1).
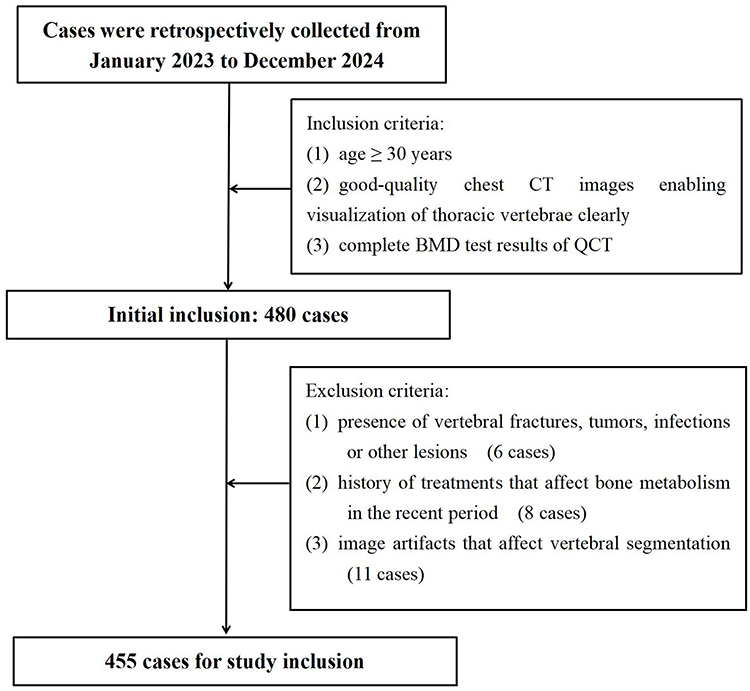 |
Figure 1 The workflow of the study. |
CT Images and QCT Acquisition
All chest CT scans were performed using a 256-slice CT scanner (Philips Healthcare, Brilliance ICT, Cleveland, USA) with parameters: tube voltage of 120 kV, tube current of 400 mAs, slice thickness of 1.25 mm, and a matrix size of 512×512. The DICOM images were archived in the PACS database. A radiologist with five years of musculoskeletal imaging experience independently measured the CT values from T7 to T12 vertebrae using a standardized bone window setting. The region of interest (ROI) was placed in the mid-vertebral body on axial images with cortical bone and basivertebral veins was carefully avoided. Each vertebra was measured twice, with the average value recorded. All measurement underwent quality control by a senior radiologist (ten years experience). In cases where there were discrepancies in the delineation of ROI boundaries, both radiologists conducted a joint re-examination of the images, recalibrated the ROI placement, and repeated the measurements until a consensus was reached.
All QCT were analyzed based on the chest CT data. The reconstructed CT images were transferred to the QCT workstation (Mindways Software). BMD was measured at T12 and L1 vertebrae, respectively, and taken as the average. The ROI was positioned in the center of vertebra at axial images manually. According to the diagnostic criteria of QCT,17,18 the cases were divided into three groups based on BMD measurement: normal group (BMD>120 mg/cm3), osteopenia group (80 mg/cm3 ≤ BMD ≤ 120 mg/cm3), and OP group (BMD <80 mg/cm3).
Unsupervised Machine Learning
Cluster analysis based on unsupervised machine learning was carried out using R software (https://www.r-project.org/, version 4.3.1). In this analysis, the CT values corresponding to features of T7 to T12 were selected as the key variables to drive the clustering process. A crucial step in this workflow was determining the optimal number of clusters. To achieve this, the within-cluster sum of squares (WSS) was employed as the evaluation criterion. The WSS, which measures the sum of squared distances from each data point to its respective cluster centroid, provided valuable insights into cluster compactness. Through careful analysis of the WSS trend, it was observed that the decreasing rate of WSS slowed down significantly when the number of clusters (k) reached 5, indicating that 5 was the optimal cluster number (Figure 2). Following the determination of the optimal k value, the k-means clustering algorithm was applied to perform the actual subtype classification. This algorithm works by iteratively assigning data points to clusters based on their proximity to cluster centroids, aiming to minimize the within-cluster variation. By using this approach with the identified optimal parameters, distinct subtypes within the dataset were successfully identified and classification. This process laid a solid foundation for further exploration and interpretation of the underlying patterns in the data.
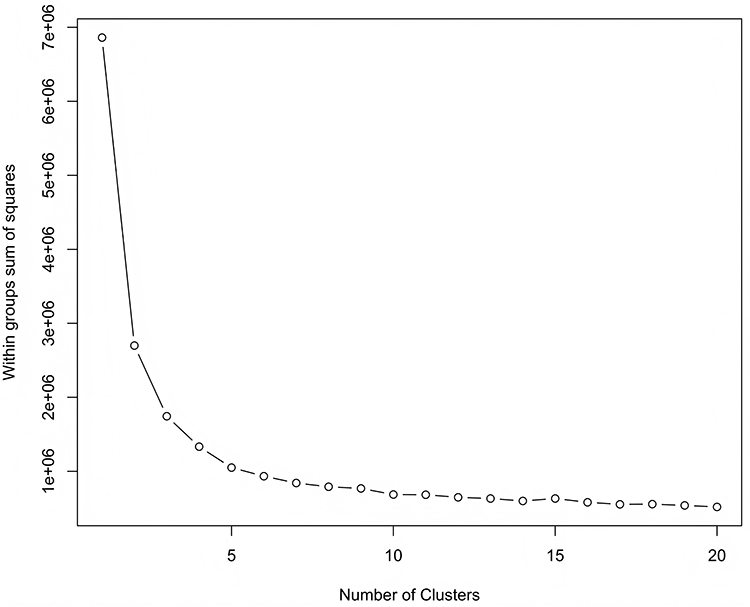 |
Figure 2 The optimal cluster number is determined by the elbow method. By analyzing the trend of within-cluster sum of squares (WSS), it is observed that 5 clusters (k=5) is the optimal choice. |
Statistical Analysis
All statistical analyses were conducted using R (version 4.3.1), which is developed and maintained by the R Foundation for Statistical Computing. The Shapiro–Wilk test was used to assess the normality of continuous variables. Following the normality check and assessment of variance homogeneity, continuous variables were expressed as mean±standard deviation (normal distribution) or median [IQR] (non-normal distribution), with comparisons using one-way analysis of variance or Kruskal–Wallis test as appropriate among multiple groups. Categorical data were presented as counts (percentages) and analyzed using Pearson’s χ2 or Fisher’s exact tests. All tests were two-tailed, with P < 0.05 considered statistically significant.
Results
Patient Characteristics
The study cohort comprised 455 participants (260 males [57%], 195 females [43%]) with a median age of 60 years (IQR, 51–67 years). Based on QCT diagnostic criteria, 455 participants were classified into three groups: normal bone mass, 253 cases (56%); osteopenia, 152 cases (33%); OP, 50 cases (11%). The CT values from T7 to T12 vertebral bodies are listed in Table 1. Starting with T7, the CT values remained relatively stable through T8, with a slight elevation at T9 and T10. However, a gradual decline appeared through T11 to T12.
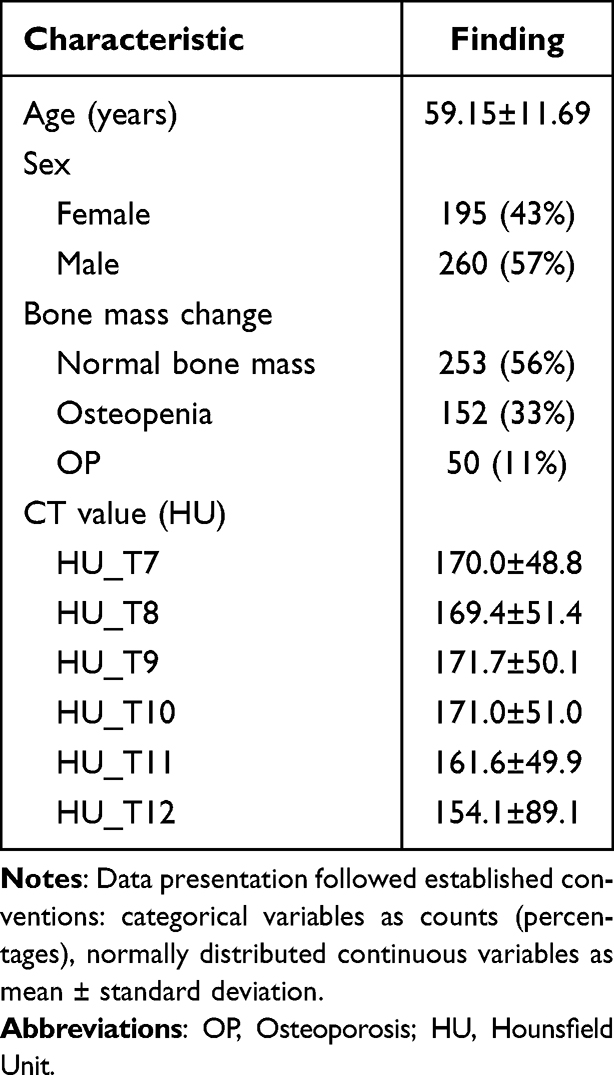 |
Table 1 Subjects and CT Characteristics |
Intergroup Comparisons of Clinical Findings and CT Values
Significant intergroup differences were observed for age and sex (Table 2). The mean age of the normal, osteopenia, and OP groups was 54.4±11.1, 63.2±9.3, and 70.8±7.4 years, respectively (P < 0.001), with an increasing trend of age with decreasing bone mass. OP group showed female predominance (64% vs 36%) and normal group had male predominance (61% vs 39%).
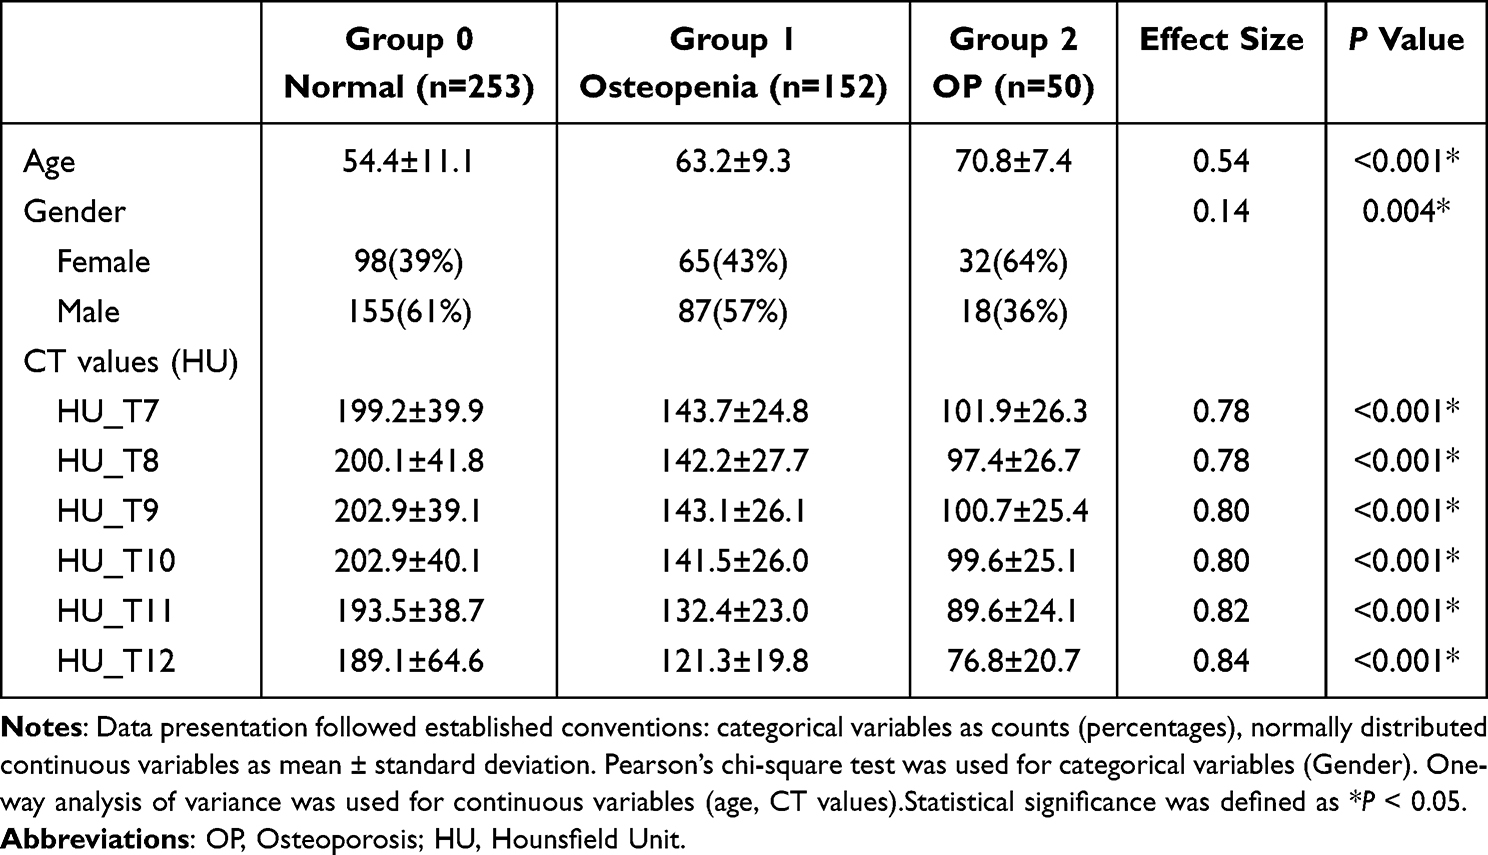 |
Table 2 Comparison of Clinical Findings and CT Values in Different Bone Mass Group |
Significant differences in CT values of different vertebrae (T7 to T12) were found among the three groups (Table 2). All vertebral levels (T7 to T12) exhibited significant CT value reductions with worsening bone mass status. The CT values of the T12 vertebra were the lowest in all the three groups.
Relationships Between Clusters and Bone Mass Status
The clustering analysis identified five clusters with characteristic CT value profiles (Table 3 and Figure 3). First, cluster 1 (n=72) was characterized by low average CT values of T7–T12 vertebrae (97.9±18.0 HU). OP and osteopenia were the most prevalent bone mass condition in cluster 1, affecting 99% (71 of 72 cases) of the cases. Second, consisting of 146 individuals in cluster 4, 73% (107 of 146 cases) had osteopenia and 3% (5 of 146 cases) had OP. In contrast, the cluster 2 stood out as having 100% of its cases with normal bone mass. Meanwhile, out of 99 patients in cluster 5, 98% (97 of 99 cases) had normal bone mass; and 84% (90 of 107 cases) had normal bone mass in cluster 3. Notably, clusters 2, 3, and 5 were essentially OP-free (0% prevalence).
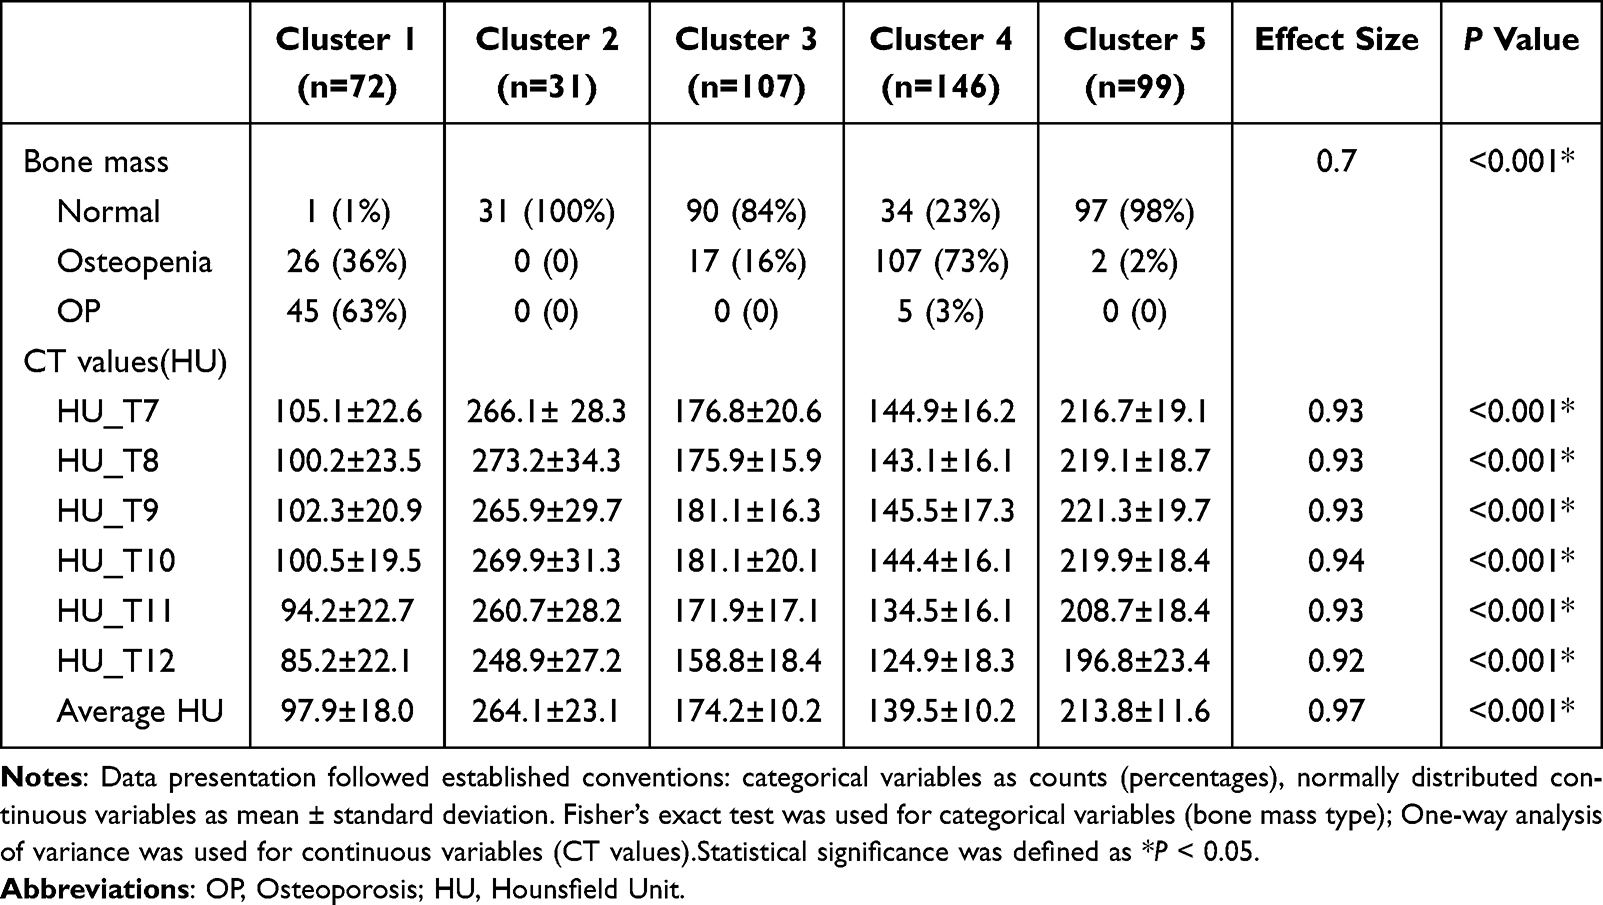 |
Table 3 Clustering Results of Different Subtypes |
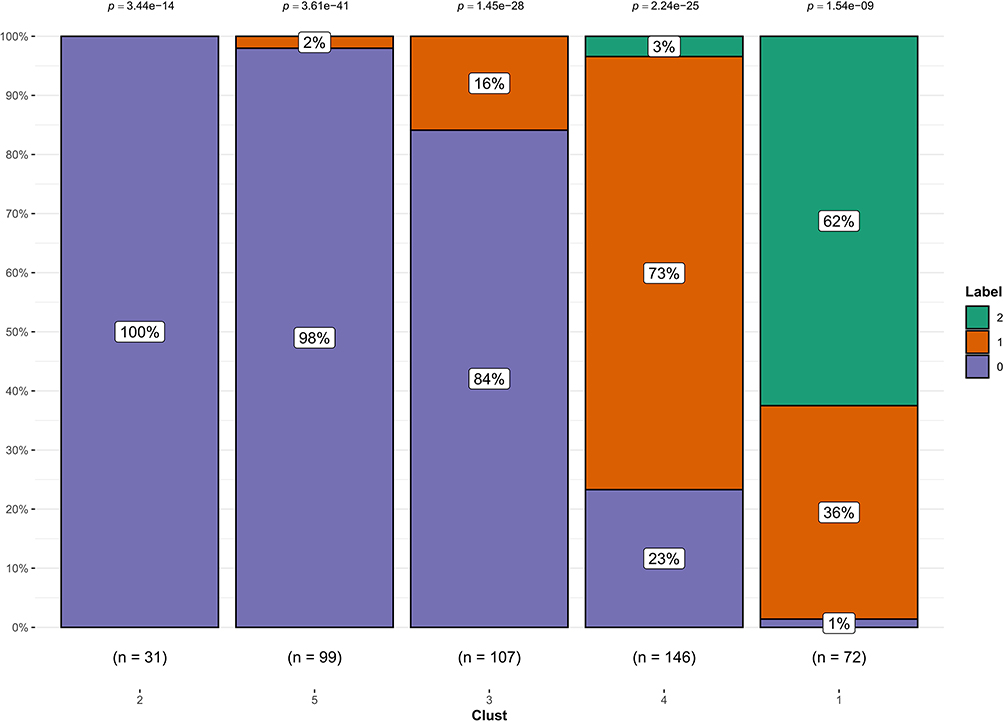 |
Figure 3 Box plots of the cluster analysis of CT values for each subtype. Label 0 represents the normal bone mass group, Label 1 represents the osteopenia group, and Label 2 represents the osteoporosis group. |
Discussion
This study demonstrated that unsupervised machine learning of T7–T12 vertebrae HU values can effectively stratify patients into distinct bone mass subtypes with clinical relevance. Our clustering analysis revealed five subgroups with progressive CT value patterns that strongly correlated with bone health status. Cluster 1 characterized by markedly reduced HU values, this group comprised 63% of all OP cases in the cohort, indicating substantial trabecular thinning and cortical porosity that warrant immediate clinical attention. Cluster 4 dominated by osteopenia, this intermediate group may benefit from confirmatory QCT or DXA evaluation and early preventive interventions. Clusters 2, 3, and 5, exhibited significantly higher CT values, corresponding to preserved BMD and intact trabecular architecture characteristic of normal bone mass.
Vertebral CT values quantitatively represent bone tissue attenuation properties, with lower values indicating reduced mineral density and compromised microarchitecture. Our multi-vertebral clustering approach (T7–T12) provides a comprehensive evaluation of spinal bone health by: (1) integrating vertebral density data across multiple segments, (2) minimizing measurement variability inherent in single-level assessments, and (3) capturing regional patterns of bone loss that may predict fracture risk more accurately than isolated measurements.
In the present study, the analysis of CT values from T7 to T12 revealed a general decreasing trend across all cases in generally, with a slight peak at T9 or T10. The most pronounced reduction occurred at the T12 vertebra, likely reflecting the anatomical and biomechanical disparities in load distribution along the thoracic spine.19,20 Recent studies support the utility of CT values in OP screening. For patients with degenerative lumbar disease, the average CT value of L1–L2 proved effective for OP screening, with the QCT-based cutoff value being 110 HU for OP and 160 HU for osteopenia.21 Similarly, the T4 HU value on chest CT served as an opportunistic tool to distinguish low BMD from OP patients.22 Yang et al reported age-related declines in CT values of all thoracic vertebrae and L1, noting that artificial intelligence (AI), which enabled automatic measurement of vertebral CT values on non-contrast chest CT scans, exhibited excellent performance in identifying osteopenia or OP.23 Hu et al demonstrated that CT values from T10 to T12 not only decreased but also correlated linearly with lumbar vertebral values.24 Another study noted that a gradual attenuation decline from T10 to L3,25 further underscoring the importance of HU evaluation in bone mass assessment. Given the observed trend, the lower thoracic spine appeared to be more vulnerable to bone density loss, emphasizing the need for comprehensive evaluation in clinical and research settings.
Our clustering analysis identified five subgroups with gradient differences in CT value distributions. Cluster 2 consistently exhibited the highest CT values across all vertebrae, while cluster 1 had the lowest. This pattern persisted in the average vertebral CT values, with cluster 2 showing the highest mean and cluster 1 the lowest. Cluster 1 was predominantly composed of OP cases (63%) with only 1% having normal bone mass. In contrast, cluster 2 consisted entirely of individuals with normal bone mass. Cluster 3 primarily included normal bone mass cases, with a minority of osteopenia. Cluster 4 had the highest proportion of osteopenia, alongside some normal bone mass and few OP cases. Cluster 5 was dominated by normal bone mass, with minimal osteopenia. These findings indicated that the clustering analysis-based vertebral HU values had effectively stratified patients into subgroups reflecting varying bone health statuses, enabling tailored management, saving resources for low-risk clusters and guiding patient education for better disease awareness and prevention. For instance, patients in clusters 1 and 4 require early intervention for OP and closer monitoring for osteopenia through further DXA or QCT. In contrast, patients with HU values falling into clusters 2, 3, and 5 can be reassured and managed through routine clinical monitoring, thereby avoiding unnecessary referrals for DXA or QCT examinations. These findings highlight the utility of vertebral HU value clustering in optimizing the allocation of medical resources and preventive care. By leveraging chest CT equipment, which is already prevalent in primary-level hospitals, we enable an initial bone health assessment for populations that otherwise lack access to specialized testing tools. Future study should validate these results and explore associations between CT values and other prognostic parameters. Overall, consensus clustering of multi-vertebral HU values offers valuable insights into bone health heterogeneity, with potential applications in clinical practice.
Previous studies have utilized cluster analysis to examine relationships between fracture sites and comorbidities in large patient cohort. For instance, one investigation analyzed 11,003 patients with ≥1 fragility fracture, enabling more precise risk stratification and targeted preventative measures.26 Similarly, another study applied cluster analysis to characterized wrist fracture cases, identifying two distinct subgroups with differing clinical profiles.27 This classification facilitates tailored screening protocol and secondary prevention strategies, enhancing intervention efficacy. These findings underscore the utility of clustering analysis method in clinical practice, as they effectively stratify heterogeneous patient populations into subgroups with shared disease characteristics. Such an approach provides a robust framework for risk assessment and personalized management, ultimately optimizing fracture prevention and patients outcomes.
Compared to traditional BMD detection methods, unsupervised clustering analysis using vertebral HU values offers several advantages. First, CT examinations were widely adopted in clinical practice and maintains high patient acceptance. Second, as a data-driven method, unsupervised clustering analysis enables unbiased patient grouping, thereby supporting more individualized clinical decision-making. However, this study had certain limitations. First, the findings may be influenced by selection bias inherent to the retrospective study design. Second, factors such as lifestyle habits, comorbidities, and BMI, which significantly impact bone mass, were not fully analyzed, potentially affecting the generalizability of cluster results. Third, the clustering method lacked external validation on independent datasets, limiting the assessment of its reproducibility and robustness across different populations or imaging modalities. Additionally, the quality control for HU measurements, while rigorous, did not formally evaluate inter-observer variability, which could introduce unquantified measurement error. Therefore, subsequent studies should expand sample sizes and conduct multi-center research, adopt prospective designs, incorporate comprehensive clinical variables, validate the clustering model in external cohorts, and quantify inter-rater reliability to enhance the reliability and accuracy of clustering-based bone health assessment.
In conclusion, this study represents the first application of unsupervised machine learning to classify bone mass subtypes using T7–T12 vertebral HU values from routine CT scans. The proposed method offers an efficient incidental screening tool for population skeletal health assessment, which was especially valuable for primary care settings lacking specialized BMD equipment. It enables bone health evaluation without requiring additional dedicated procedures. Future studies should validate these results in multi-center prospective cohorts while incorporating additional clinical parameters to further refine the classification model.
Funding
The present study was supported by grants from the Natural Science Foundation of Shandong (ZR2024QH094), the Medical Health Science and Technology Development Plan Project of Shandong Province (202109010477), and Tianjin Key Medical Discipline (Specialty) Construction Project (TJYXZDXK-001A).
Disclosure
Hui Yang and Jiang Li are co-first authors for this study. The authors report no conflicts of interest in this work.
References
1. Peng T, Zeng X, Li Y. et al. A study on whether deep learning models based on CT images for bone density classification and prediction can be used for opportunistic osteoporosis screening. Osteoporos Int. 2023;35(1):117–128. doi:10.1007/s00198-023-06900-w
2. Wu J, Qu Y, Wang K, et al. Healthcare Resource Utilization and Direct Medical Costs for Patients With Osteoporotic Fractures in China. Value Health Reg Iss. 2019; 18 106–111.
3. Zheng M, Wan Y, Liu G, et al. Differences in the prevalence and risk factors of osteoporosis in Chinese urban and rural regions: a cross-sectional study. BMC Musculoskelet Disord. 2023;24(1):46. doi:10.1186/s12891-023-06147-w
4. Si L, Winzenberg TM, Jiang Q, Chen M, Palmer AJ. Projection of osteoporosis-related fractures and costs in China: 2010-2050. Osteoporos Int. 2015;26(7):1929–1937. doi:10.1007/s00198-015-3093-2
5. Moldovan F, Moldovan L. A Modeling Study for Hip Fracture Rates in Romania. J Clin Med. 2025;14(9):3162. doi:10.3390/jcm14093162
6. Zou D, Ye K, Tian Y, et al. Characteristics of vertebral CT Hounsfield units in elderly patients with acute vertebral fragility fractures. EUR SPINE J. 2020;29(5):1092–1097. doi:10.1007/s00586-020-06363-1
7. Adams JE. Advances in bone imaging for osteoporosis. NAT REV ENDOCRINOL. 2013;9(1):28–42. doi:10.1038/nrendo.2012.217
8. Löffler MT, Jacob A, Scharr A, et al. Automatic opportunistic osteoporosis screening in routine CT: improved prediction of patients with prevalent vertebral fractures compared to DXA. European Radiology. 2021;31(8):6069–6077. doi:10.1007/s00330-020-07655-2
9. Kulkarni AG, Thonangi Y, Pathan S, et al. Should Q-CT Be the Gold Standard for Detecting Spinal Osteoporosis? SPINE. 2022;47(6):E258–E264. doi:10.1097/BRS.0000000000004224
10. Lan K, Wang DT, Fong S, et al. A Survey of Data Mining and Deep Learning in Bioinformatics. Journal of Medical Systems. 2018;42(8):139. doi:10.1007/s10916-018-1003-9
11. Perez-Johnston R, Araujo-Filho JA, Connolly JG, et al. CT-based Radiogenomic Analysis of Clinical Stage I Lung Adenocarcinoma with Histopathologic Features and Oncologic Outcomes. Radiology. 2022;303(3):664–672. doi:10.1148/radiol.211582
12. Vanfleteren LEGW, Weidner J, Franssen FME, et al. Biomarker-based clustering of patients with chronic obstructive pulmonary disease. ERJ Open Res. 2023;9(1):00301–2022. doi:10.1183/23120541.00301-2022
13. Sgarro GA, Grilli L, Valenzano AA, et al. The Role of BIA Analysis in Osteoporosis Risk Development: hierarchical Clustering Approach. Diagnostics. 2023;13(13). doi:10.3390/diagnostics13132292.
14. Kim Y, Kim HY, Lee S, Hong S, Lee JW. Age-dependent changes in CT vertebral attenuation values in opportunistic screening for osteoporosis: a nationwide multi-center study. European Radiology. 2024;35(6):3519–3527. doi:10.1007/s00330-024-11263-9
15. Rühling S, Scharr A, Sollmann N, et al. Proposed diagnostic volumetric bone mineral density thresholds for osteoporosis and osteopenia at the cervicothoracic spine in correlation to the lumbar spine. European Radiology. 2022;32(9):6207–6214. doi:10.1007/s00330-022-08721-7
16. Li S, Yao Q, Li Y, et al. To Evaluate the Value of Vertebral Body Cortical Thickness in Predicting Osteoporosis by Opportunistic CT. Academic Radiology. 2023;31(4):1491–1500. doi:10.1016/j.acra.2023.08.041
17. Engelke K, Adams JE, Armbrecht G, et al. Clinical use of quantitative computed tomography and peripheral quantitative computed tomography in the management of osteoporosis in adults: the 2007 ISCD Official Positions. J Clin Densitom. 2008;11(1):123–162. doi:10.1016/j.jocd.2007.12.010
18. Expert Panel on Musculoskeletal Imaging, Yu JS, Krishna NG, Fox MG, et al. ACR appropriateness criteria® osteoporosis and bone mineral density: 2022 update. J Am Coll Radiol. 2022;19(11S):S417–S432. doi:10.1016/j.jacr.2022.09.007.
19. Jang S, Graffy PM, Ziemlewicz TJ, et al. Opportunistic Osteoporosis Screening at Routine Abdominal and Thoracic CT: normative L1 Trabecular Attenuation Values in More than 20 000 Adults. Radiology. 2019;291(2):360–367. doi:10.1148/radiol.2019181648
20. Hu N, Wang M, Yang M, et al. Bone mineral density in lower thoracic vertebra for osteoporosis diagnosis in older adults during CT lung cancer screening. BMC Geriatr. 2023;24(1):237. doi:10.1186/s12877-024-04737-4
21. Zou D, He X, Shang Z, et al. Osteoporosis screening using QCT-based cutoff value of Hounsfield units in patients with degenerative lumbar diseases. European Spine Journal. 2023;33(12):4499–4503. doi:10.1007/s00586-024-08491-4
22. Wang XY, Pan S, Liu WF, et al. Vertebral HU value and the pectoral muscle index based on chest CT can be used to opportunistically screen for osteoporosis. J Orthop Surg Res. 2023;19(1):335. doi:10.1186/s13018-024-04825-6
23. Yang J, Liao M, Wang Y, et al. Opportunistic osteoporosis screening using chest CT with artificial intelligence. Osteoporosis International. 2022;33(12):2547–2561. doi:10.1007/s00198-022-06491-y
24. Hu T, Dai S, Yang L, et al. Potential Predictive of Thoracic CT Value and Bone Mineral Density T-Value in COPD Complicated with Osteoporosis. Int J Gen Med. 2023;17:3027–3038. doi:10.2147/IJGM.S466292
25. Wang P, She W, Mao Z, et al. Use of routine computed tomography scans for detecting osteoporosis in thoracolumbar vertebral bodies. Skeletal Radiol. 2021;50(2):371–379. doi:10.1007/s00256-020-03573-y
26. Dey M, Bukhari M. Cluster analysis demonstrates co-existing sites of fragility fracture and associated comorbidities. Osteoporos Int. 2022;33(7):1613–1618. doi:10.1007/s00198-022-06377-z
27. Vincent JI, MacDermid JC, Bassim CW, et al. Cluster analysis to identify the profiles of individuals with compromised bone health versus unfortunate wrist fractures within the Canadian Longitudinal Study of Aging (CLSA) database. Arch Osteoporos. 2023;18(1):148. doi:10.1007/s11657-023-01350-7
 © 2025 The Author(s). This work is published and licensed by Dove Medical Press Limited. The
full terms of this license are available at https://www.dovepress.com/terms
and incorporate the Creative Commons Attribution
- Non Commercial (unported, 4.0) License.
By accessing the work you hereby accept the Terms. Non-commercial uses of the work are permitted
without any further permission from Dove Medical Press Limited, provided the work is properly
attributed. For permission for commercial use of this work, please see paragraphs 4.2 and 5 of our Terms.
© 2025 The Author(s). This work is published and licensed by Dove Medical Press Limited. The
full terms of this license are available at https://www.dovepress.com/terms
and incorporate the Creative Commons Attribution
- Non Commercial (unported, 4.0) License.
By accessing the work you hereby accept the Terms. Non-commercial uses of the work are permitted
without any further permission from Dove Medical Press Limited, provided the work is properly
attributed. For permission for commercial use of this work, please see paragraphs 4.2 and 5 of our Terms.
Recommended articles
Asymmetric Osteopenia in Adolescent Idiopathic Scoliosis Based on Hounsfield Unit of Computed Tomography
Zhao C, Zhu S, Liang Y, Xu S
International Journal of General Medicine 2024, 17:3945-3953
Published Date: 7 September 2024