Back to Journals » Drug Design, Development and Therapy » Volume 10
Understanding cytoskeleton regulators in glioblastoma multiforme for therapy design
Authors Masoumi S, Harishankar A, Gracias A, Bachinger F, Fufa T, Chandrasekar G, Gaunitz F, Walfridsson J, Kitambi S
Received 11 February 2016
Accepted for publication 14 March 2016
Published 12 September 2016 Volume 2016:10 Pages 2881—2897
DOI https://doi.org/10.2147/DDDT.S106196
Checked for plagiarism Yes
Review by Single anonymous peer review
Peer reviewer comments 3
Editor who approved publication: Prof. Dr. Wei Duan
Video abstract presented by Masoumi et al.
Views: 349
Samaneh Masoumi,1,*, Aditya Harisankar,2,* Aileen Gracias,3 Fabian Bachinger,1 Temesgen Fufa,1,4 Gayathri Chandrasekar,5 Frank Gaunitz,4 Julian Walfridsson,2 Satish S Kitambi1
1Department of Microbiology Tumor and Cell Biology, 2Center for Hematology and Regenerative Medicine, Department of Medicine, 3Department of Neuroscience, Karolinska Institutet, Solna, Sweden; 4Department of Neurosurgery, University Hospital, Leipzig, Germany; 5Department of Biosciences and Nutrition, Karolinska Institutet, Solna, Sweden
*These authors contributed equally to this work
Abstract: The cellular cytoskeleton forms the primary basis through which a cell governs the changes in size, shape, migration, proliferation, and forms the primary means through which the cells respond to their environment. Indeed, cell and tissue morphologies are used routinely not only to grade tumors but also in various high-content screening methods with an aim to identify new small molecules with therapeutic potential. This study examines the expression of various cytoskeleton regulators in glioblastoma multiforme (GBM). GBM is a very aggressive disease with a low life expectancy even after chemo- and radiotherapy. Cancer cells of GBM are notorious for their invasiveness, ability to develop resistance to chemo- and radiotherapy, and to form secondary site tumors. This study aims to gain insight into cytoskeleton regulators in GBM cells and to understand the effect of various oncology drugs, including temozolomide, on cytoskeleton regulators. We compare the expression of various cytoskeleton regulators in GBM-derived tumor and normal tissue, CD133-postive and -negative cells from GBM and neural cells, and GBM stem-like and differentiated cells. In addition, the correlation between the expression of cytoskeleton regulators with the clinical outcome was examined to identify genes associated with longer patient survival. This was followed by a small molecule screening with US Food and Drug Administration (FDA)-approved oncology drugs, and its effect on cellular cytoskeleton was compared to treatment with temozolomide. This study identifies various groups of cytoskeletal regulators that have an important effect on patient survival and tumor development. Importantly, this work highlights the advantage of using cytoskeleton regulators as biomarkers for assessing prognosis and treatment design for GBM.
Keywords: glioma, cytoskeleton, actomyosin, microtubules, tubulin, actin, GBM, Phenotypic Drug Discovery
Introduction
Glioblastoma multiforme (GBM), due to its heterogeneous nature and diverse genetics, is difficult to treat.1–3 An entirely new approach for targeting cancer cells would be to look for acquired vulnerabilities. GBM is one of the most aggressive brain tumors with reduced life expectancy,3,4 often attributed to its high recurrence rate, even after surgery and chemotherapy.4–6 The high recurrence rate of GBM is attributed to the high infiltrative and invasive nature of the residual tumor cells.4 Current therapies against GBM have not achieved a dramatic increase in prolonging lifespan due to the difficulties posed by the location of the tumor, difficulties associated with drug delivery, the blood–brain barrier, and tumor cells gaining resistance to chemo- or radiotherapy.6–8 Current therapy includes surgery, use of a broad-spectrum alkylating agent called temozolomide (TMZ) that is orally administered, and radiation therapy.6,7 The gene(s) or gene product(s) resulting in oncogenic transformation of cells are usually components of signal transduction pathways that are involved in many diverse cellular functions. Therefore, insights into mutations that lead to gain or loss of functions that are not necessarily associated with oncogenic transformation would facilitate a more comprehensive understanding necessary for combating this devastating disease. Acquired vulnerabilities can be exploited for the development of conceptually new strategies of therapy. GBM genetic investigations have identified many prooncogenic mutations that effectively empower the cancer cell to become more invasive, activate proliferation, and promote resistance to chemotherapeutic drugs and cell death mechanisms such as apoptosis.1,8,9 Recent work has identified oncogenic transformations leading to different cytoskeleton dynamics in GBM cells when compared to other cells, which makes them vulnerable to macropinocytosis.10 Macropinocytosis is a process similar to phagocytosis but characterized by nonspecific uptake of fluid or small particles. This phenomenon is usually transient and is a consequence of an increase in actin polymerization, leading to membrane ruffling. This poorly understood mechanism results in protrusions of ruffled membrane, resulting in uptake of fluid or small particles into cells as vacuoles. Using small molecules, GBM cells can be triggered to undergo macropinocytosis uncontrollably, leading to the accumulation of large quantity of vacuoles, thereby compromising their shape and their ability to maintain attachment. Heavy loss of ATP and the disruption of cellular cytoskeleton then finally lead to cell death.10
The cytoskeleton of the cell plays an important role not only in maintaining its size and shape but also in governing how the cells sense and respond to their environment. Various cellular processes such as cell division, migration, and regulation of gene expression have been linked to the cytoskeleton.11 Indeed, in cancer cells, various genes participating in the modulation of cellular cytoskeleton have been associated with enhanced infiltrative and proliferative capacity.12 In GBM, hypoxic environment is known to orchestrate changes in cytoskeleton dynamics, thereby promoting these cells to migrate.13–15 Overexpression of the CTTN gene is associated with an increase in the infiltrative nature of these cells and is often associated with bad prognosis of GBM patients.16,17 Cell migration is often associated with rapid polymerization of actin at the leading edge of the cells, especially in the cell protrusions. The CTTN gene product is a nucleating factor aiding in rapid polymerization of actin, and its overexpression in GBM cells makes them display more migratory behavior.16,17 Other cytoskeleton modulators such as small GTPases and βIII-tubulin have a critical role in the progression of GBM.18,19 Understanding the cellular and molecular features of cytoskeleton modulation in GBM is an important part of the discovery process of novel molecular targets that will fundamentally benefit GBM disease prognosis and patient survival. Indeed, various drug discovery programs have expanded toward this end with the exploration of the therapeutic potential of various small molecules targeting the cytoskeleton in GBM. Various small molecule inhibitors, collectively referred to as tubulin-binding agents, are currently being explored for use in GBM.20
In this study, we use comparative transcriptomics to analyze the expression of cytoskeleton regulators in GBM tumor and nontumor tissue. We also analyze CD133-positive and -negative cell populations from GBM tumors and compare them with neural stem cells (NSCs). Comparative transcriptomics identified various genes that are differentially modulated in GBM and are often associated with prolonged patient survival. We also use small molecule screening using a library of US Food and Drug Administration (FDA)-approved oncology drugs and compare the effect of the drugs on the cytoskeleton with the effects induced by TMZ.
Materials and methods
Cell culture
Tumor samples from patients were obtained after written informed consent according to the German law as confirmed by the local committee at the Department of Neurosurgery, University Hospital Leipzig, who approved this study. The samples were diagnosed histologically as GBM. Tumor samples were dissected, and blood/blood vessels were removed before taking them for dissociation and culturing. The identity of cell type in the culture (stem like or other types) and the mutations accumulated in these cells were not assessed. Tumor-derived glioma cells were cultured in DMEM (4.5 g/L glucose, without pyruvate; Thermo Fisher Scientific, Waltham, MA, USA) supplemented with 10% fetal calf serum (Life Technologies [Thermo Fisher Scientific]), 2 mM glutamax (Thermo Fisher Scientific), 50 μg/mL streptomycin and 30 μg/mL penicillin at 37°C, and 5% CO2 in humidified air in an incubator.
Small molecule screening
A primary screen was performed using 125 FDA-Approved Oncology Drug Set obtained from NCI (National Cancer Institute, USA) and by measuring cellular ATP. The proof of concept study was done using one patient-derived cell line. Cells were dissociated with TrypLE Express (Thermo Fisher Scientific) and distributed into 96-well plates with a cell density of 3,000 cell/well and incubated overnight with the above mentioned cell culture medium. Following incubation, the cell culture media was replaced with fresh media, but without fetal bovine serum. The compounds were added to wells to a final concentration of 10 μM in 50 μL medium and incubated for 4 days. Cellular ATP was measured following 4 days of compound incubation.
Viability assay
Total cellular ATP was measured using the CellTiter-Glo Luminescent Cell ViabilityAssay (Promega Corporation, Fitchburg, WI, USA) according to the manufacturer’s protocol. CellTiter-Glo reagent of 20 μL was added to 45 μL of medium containing cells at room temperature. Post addition, plates were incubated for 10 minutes in the dark at room temperature, and the luminescence was measured.
Comparative expression analyses
TCGA data sets
Gene expression data sets for tumor-matched normal and organ-specific controls for ten GBM cases were downloaded from The Cancer Genome Atlas (TCGA) data portal corresponding to the study published by Brennan et al.21 The samples indentification can be found in Table S1. The individual data files were merged, the log2 expression values were antilogged, and fold change between the patient and control groups was calculated (Table S1). Two-tailed t-test was performed to calculate the P-values (Table S1). Heat maps were generated based on fold change values (patient vs control) using R script.
GEO data sets
Gene expression data sets from three different studies were downloaded from the Gene Expression Omnibus (GEO) repository and RMA normalized on Qlucore software (Qlucore AB). Using the data set published by Zarkoob et al,22 which demonstrates that the mesenchymal subtype of GBM is strongly correlated with the EMT signature and CD133 expression compared to the other GBM subtypes, comparisons were made between the GBM and NSCs based on their expression of the cell surface marker CD133. The log2 expression values were antilogged, and fold change between the GBM and NSC groups was calculated (Table S1). In addition, fold change between GBM and NSC was calculated based on their CD133 expression (Table S1). Two-tailed t-test was performed to calculate the P-values, and heat maps were generated based on fold change values (GBM [133+/−] vs NSC [133+/−]) using R script (Table S1).
In the data set obtained from the study published by Nogueira et al,23 comparisons were made between stem-like and differentiated GBM cells obtained from patient samples. The log2 expression values were antilogged, and fold change between the GBM stem-like and GBM differentiated groups was calculated (Table S1). Two-tailed t-test was performed to calculate the P-values, and heat maps were generated based on fold change values (GBM-stem vs GBM-differentiated) using R script (Table S1).
Gene mutation analyses
Mutational statuses of the genes analyzed were obtained from cBioPortal24,25 by querying the TCGA GBM study21 consisting of 580 samples.
Patient survival plots
Survival curves were plotted for genes using patient survival data sets available at TCGA database (http://tcga-data.nci.nih.gov). The overall correlation of high or low expression of each gene on patient survival was analyzed, and survival curves were plotted from 291 GBM patient data sets.
Immunohistochemistry and imaging
Cells were distributed onto coverslips in a multiwell plate and incubated overnight before a final concentration of 10 μM of compound was added. The cells were then incubated for 2 days, fixed with 4% paraformaldehyde (Sigma-Aldrich Co., St Louis, MO, USA) for 20 minutes at room temperature, and washed twice with phosphate-buffered saline (PBS; Thermo Fisher Scientific) with 0.1% Tween 20. For blocking, cells were further washed twice (10 minutes each wash) with PBS and incubated with 10% normal donkey serum for 30 minutes at room temperature. After incubation, the blocking solution was replaced with primary antibody solution (antiacetylated tubulin; Sigma-Aldrich Co., 1:500 dilution in blocking solution) and incubated overnight at 4°C. Post incubation, the coverslips were washed three times (30 minutes each wash) with PBS and hybridized with secondary antibody linked with Alexa 488 fluoropore (1:500 dilution; Thermo Fisher Scientific), Alexa Fluor Phalloidin 546 (Thermo Fisher Scientific), and 4′,6-diamidino-2-phenylindole (DAPI) for 1 hour at room temperature. Following this incubation, coverslips were washed three times (30 minutes each wash) with PBS, mounted, and imaged. Images were processed and quantified using ImageJ software (Version 1.49).
Quantitative polymerase chain reaction analysis
Fresh human glioblastoma patient-derived cell lines were plated in a 12-well plate and treated with different compounds for 48 hours. Dimethyl sulfoxide (DMSO) was used as the negative control. Treated cells were washed twice in 1× PBS (Thermo Fisher Scientific) and harvested directly in 400 μL RLT buffer (Qiagen N.V, Venlo, the Netherlands). Total RNA was extracted using the Qiagen RNeasy Mini Kit (Qiagen NV, Venlo, the Netherlands) and measured using NanoDrop2000 (Thermo Fisher Scientific). Complementary DNA was prepared from 250 ng of total RNA using complementary DNA synthesis kit (Thermo Fisher Scientific). Quantitative real-time polymerase chain reaction (qRT-PCR) was performed using Platinum® SYBR® Green qPCR SuperMix-UDG reagents (Thermo Fisher Scientific) in a 384-well plate (Bio-Rad Laboratories Inc., Hercules, CA, USA) on the Bio-Rad CFX384 Touch Real-Time PCR Detection System. The relative gene expression was calculated using the ΔΔCt method using GAPDH gene expression as reference. The primer sequences used were as follows: CLIP1 forward (5′-CAGCAGCTCCTCAGGTAATACAGA-3′), CLIP1 reverse (5′-TGACTCTCCTGGGCTCTTTCA-3′), CLIP2 forward (5′-AGGCCACAAGCCACATCTG-3′), CLIP 2 reverse (5′-TTCTGCAACATACTGCTCATGCT-3′), ARAP1 forward (5′-CCCCGGAGATACCTCCAAAG-3′), ARAP1 reverse (5′-TCATCGTAGTCAGAGTCATCGAACT-3′), ARIFP2 forward (5′-ATCCCCACAGGGAAGTCAATT-3′), ARIFP2 reverse (5′-CTGTGGCCCCACCCATAC-3′), MSN forward (5′-GCCCCGGACTTCGTCTTC-3′), MSN reverse (5′-AGGCCAAGATCCGCTTGTTA-3′), MID1 forward (5′-CTCATTGAGATCATTCAGCAAAGAC-3′), MID1 reverse (5′-AAGCCTCATCACCTTCCCTTCT-3′), GAPDH forward (5′-AATCCCATCACCATCTTCCA-3′), and GAPDH reverse (5′-TGGACTCCACGACGTACTCA-3′).
Results and discussion
Expression and genetic alteration analyses of GBM tumor
To establish an overview of cytoskeleton regulators in GBM, a list of 85 genes from the literature known to be involved in cytoskeleton regulation were assembled and classified into ten groups (actin modulators, cortical cytoskeleton modulators, microtubule modulators, calmodulins and calcenurins, G-protein signaling members, cellular projections, cell shape/size modulators, cell motility, cell cycle and cytoskeleton adaptors, kinases, and phosphatases; (Figure 1A and B and Table S1). Genes in each group were further subgrouped into interacting proteins (IP), organizing and biogenesis (OR), polymerization or depolymerization (P-D), cortical cytoskeleton (CC), spindle organization and biogenesis (SP), axon and dendrites formation (AX), filopodia (FL), growth cones (G), lamellipodia (LAM), microvilli (MV), pseudopodia (P), ruffles (RF), cell shape–size–polarity (CS-S-P), cell motility or migration (CMM), mitosis (M), cytokinesis (CK), cytoskeleton adaptors (CA), calmodulins and calcinurins (Cal), G-protein signaling (G-Prot), kinases and phosphatases based on their established function (Kin&Pho). Refer to Table S1 for the list of gene names in each group and their values shown in all figures. Transcriptomics data obtained from patient-derived GBM complete tumor tissue were compared to that of nontumor tissue, and a heat map was generated indicating fold change of gene expression (Figure 1A). The number of genes that showed differential expression (either increase or decrease in expression in GBM) was counted to establish the percentage of differentially regulated genes in each group (Figure 1A and B and Table S1). In parallel, 291 GBM patient cases from TCGA were used to quantify what percentage of cases exhibit genetic alterations in these 85 genes (Figure 1B). Comparative transcriptomics analysis revealed that the majority of the groups displayed a difference in expression level (either increase or decrease) in tumor tissue when compared to that of normal tissue (actin modulators, cortical cytoskeleton modulators, cellular projections, cell shape/size modulators, cell motility, cell cycle, G-protein signaling members, kinases, and phosphatases displaying differential expression in 90%, 86%, 89.2%, 86%, 91%, 91%, 92%, and 96% of genes analyzed, respectively), with a 100% difference in expression in groups belonging to microtubule and calmodulin/calcenurins (Figure 1A). Analyzing these genes on mutation data sets from 291 patient samples identified that almost all of the genes had some reported genetic alterations (Figures 1B and S1). Looking at gene amplification, deep deletions and missense mutation or gene truncations identified that 41% of the patients showed gene amplification, 29% had either missense mutation or gene truncation, 15% had deep deletion, and the rest had alterations in mRNA expression of any one of the genes from the gene set analyzed here (Figure 1B). Out of 41% cases with gene amplification, 8% cases also had missense mutation or truncation and deep deletion, 31% had gene amplification and missense mutation or truncation, and 61% were only with gene amplification. Out of 29% missense mutation cases and 15% deep deletion cases, 32% and 40% had only those specific genetic alterations, respectively. Analyses of altered genes identified 14 genes with 5% or higher gene alteration, out of which four genes had 10% or higher gene alterations in patients (Figure 1B and C). Of all the 14 genes, CLIP2 exhibited the highest alteration reported (14%) with eight reported cases of gene amplification and two missense mutations. Other gene candidates, LIMK1, RAC1, and WASL, had alterations of 11%, 13%, and 10%, respectively, of reported cases from total cases (Figure 1B and C). These results indicate a severe modulation of cytoskeleton modulators in GBM cells when compared to noncancer cells, identifying a set of genes that show higher genetic alteration in GBM.
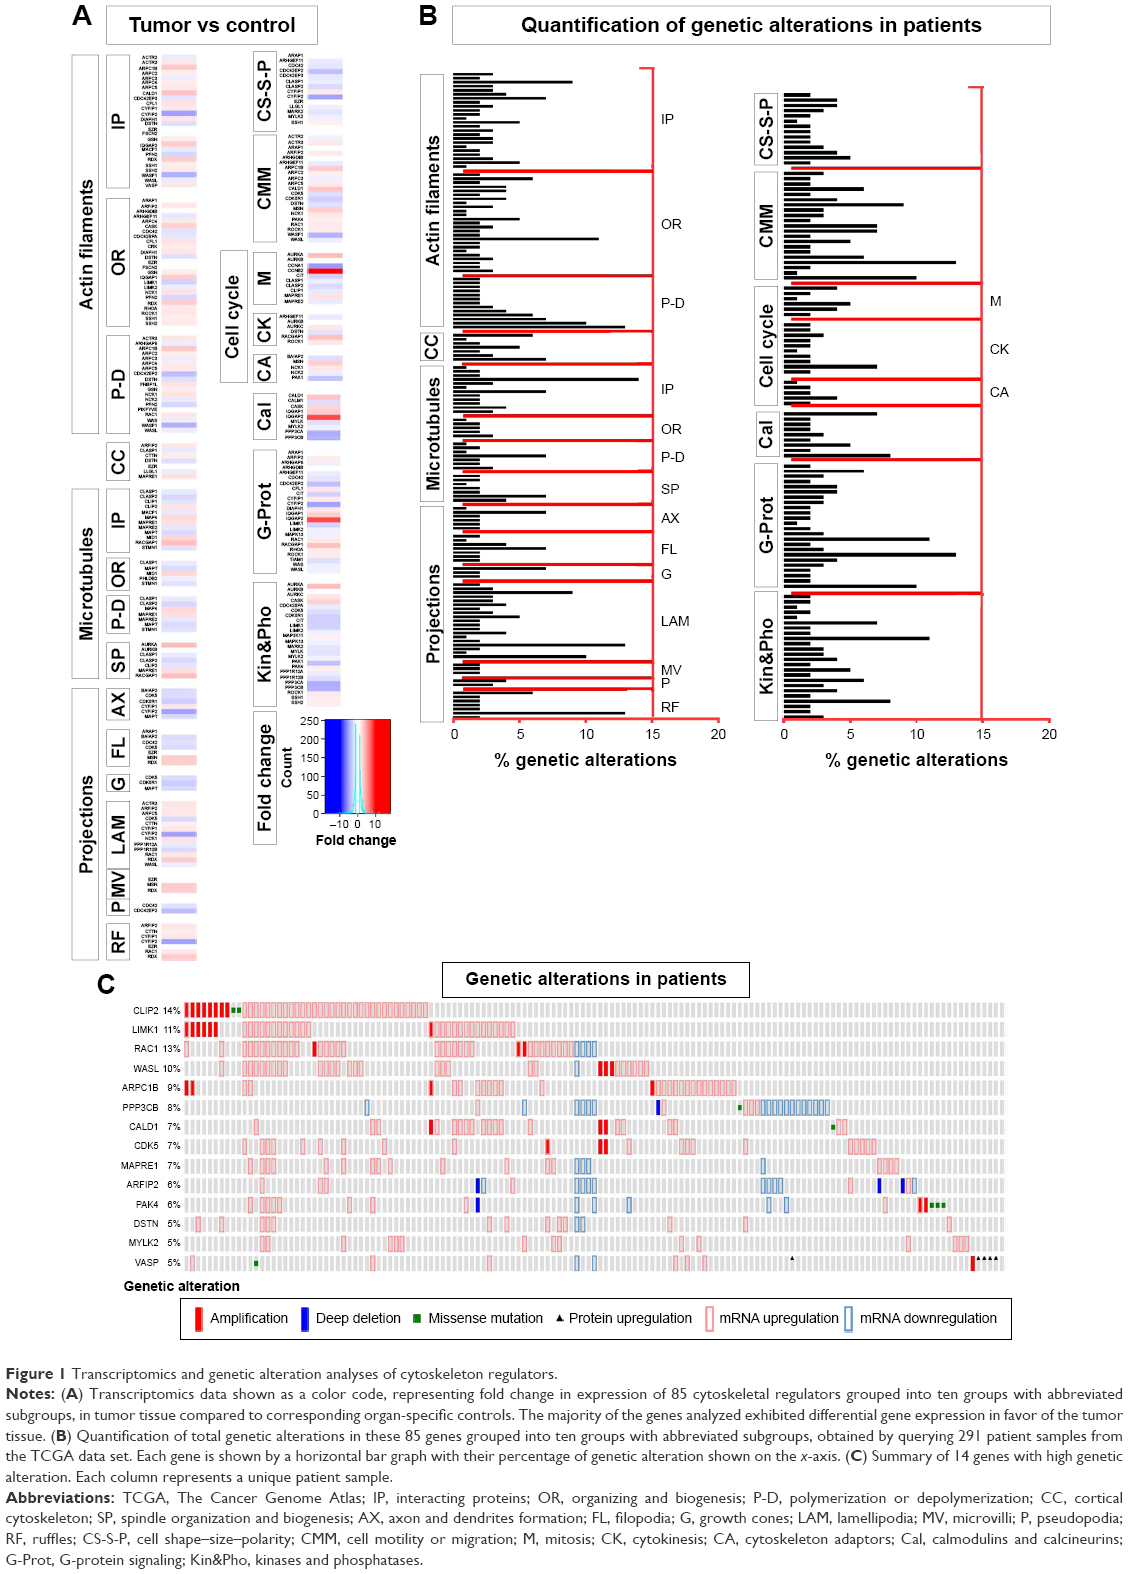 | Figure 1 Transcriptomics and genetic alteration analyses of cytoskeleton regulators. |
The difference in expression levels of all the cytoskeleton regulators assessed here reflects a tumor environment where cancer cells are actively dividing, requiring heavy modulation of genes involved in cellular cytoskeleton regulation. The expression data also point out that the increase in expression of regulators of microtubule also offers an attractive target for designing GBM therapy. Indeed, various tubulin-binding agents are being considered in glioma therapy.20 A clinical trial of the tubulin-binding small molecule patupilone shows promise in treating recurrent GBM cases.20 Genetic alterations in various factors, signaling pathways, and receptors often characterize GBM,9 indicating that therapies can be developed to target common underlying genetic abnormalities. Such targeted therapies are currently developed against several growth factor receptors such as epidermal growth factor receptor, vascular endothelial growth factor receptor, and platelet-derived growth factor, and their therapeutic potential is being evaluated.26 Our data analysis of genetic alterations in cytoskeletal modulators identifies various factors that are altered more frequently. Factors such as CLIP2, a CAP-GLY domain containing linker protein, LIMK1, an LIM domain containing protein, RAC1, a ras family small GTPase and WASL, a Wiskott-Aldrich syndrome-like protein have an established role in cancer cell proliferation and metastasis and have various small molecule inhibitors available that can be readily evaluated.27–30
Expression analyses of stem and differentiated cell markers and patient survival
To gain further insight into the expression levels of our list of cytoskeleton regulators, we analyzed data sets from CD133-positive and CD133-negative cells from GBM tumor and NSCs (Figure 2), and we compared GBM-derived stem-like cells before and after differentiation (Figure 3A). The analyses displayed very similar expression changes, with most of the genes grouped as microtubule modulators showing a consistent increase in expression followed by kinases and phosphatases groups (Figure 2). To examine whether there is a correlation between the level of expression of these genes and patient survival, survival graphs were plotted for each gene (Figures 3B and S2). The survival plots identified twelve genes that significantly correlated with patient survival. Reduced expression of eight genes (ARAP1, ARF1P2, ARPC2, GSN, LIMK1, MSN, WAS, CLIP1, CLIP2, and MID1) was correlated with increased patient survival, whereas a positive correlation of patient survival with increased expression was detected in two genes (CIT and PPP3CB; Figure 3B). Based on our in silico analyses of gene expression, gene alteration, and patient survival, six genes CLIP1, CLIP2, MID1, ARAP1, ARF1P2, and MSN were selected for further analysis. These six genes significantly correlated with longer patient survival and had an established role in cancer cell proliferation, chemosensitivity, and metastasis. Out of these six, three genes belonged to the microtubule category and three were from the projection category (Figure 1A). Transcriptomics, mutation analyses, and patient survival statistics reflected that cytoskeleton modulators are indeed very important for tumor development and crucial for disease prognosis. Hence, it was important to identify how these modulators are affected by different drugs approved for cancer therapy. In order to further evaluate the relationship between treatment by drugs and cytoskeleton modulators, we used a chemical biology approach and compared TMZ treatment to treatment with other FDA-approved oncology drugs that were alkylating and nonalkylating in nature.
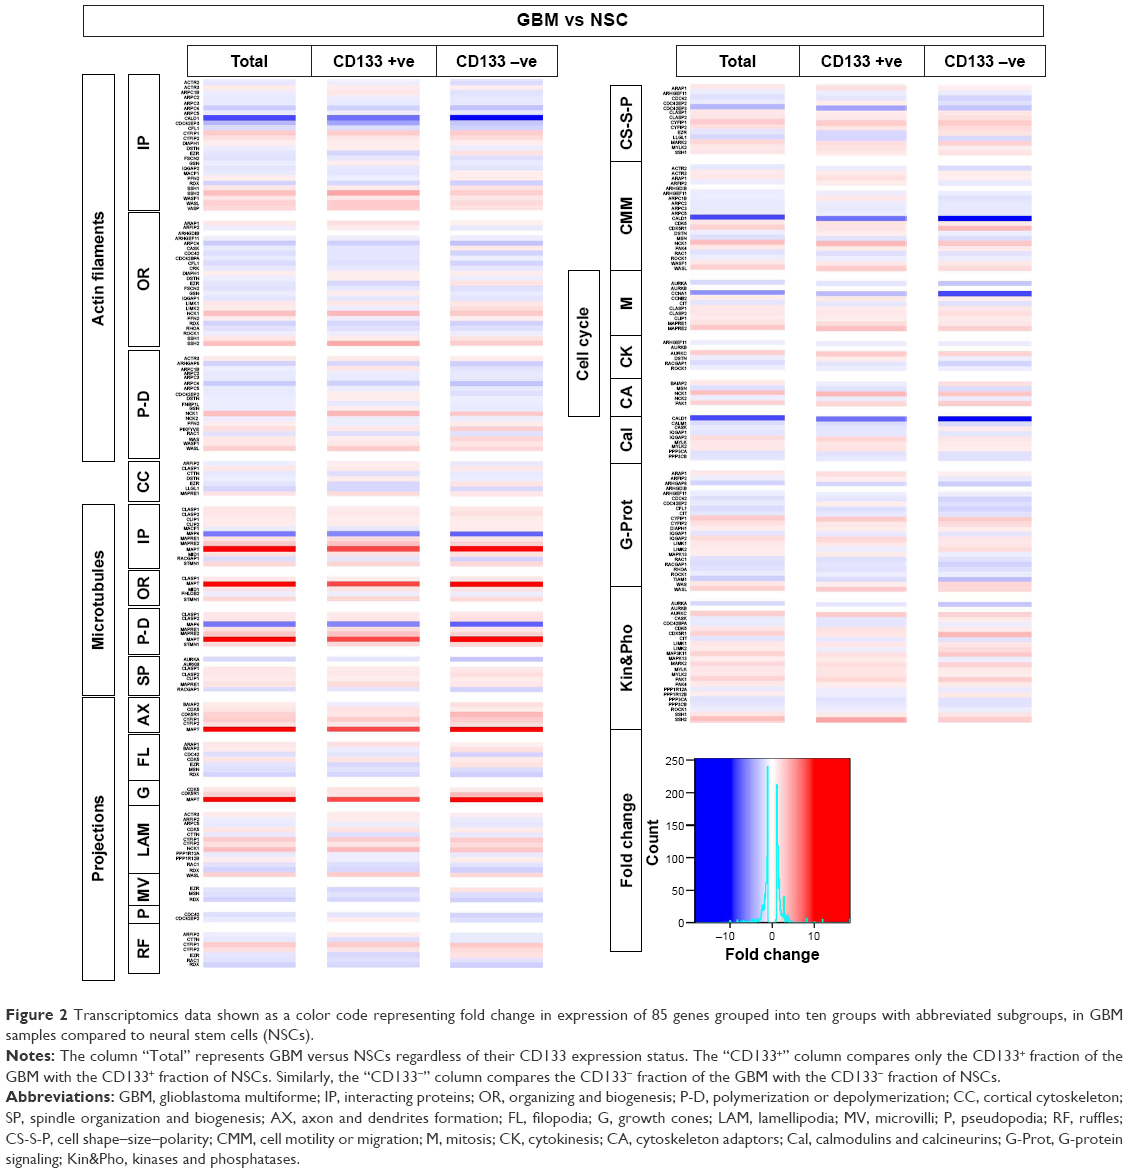 | Figure 2 Transcriptomics data shown as a color code representing fold change in expression of 85 genes grouped into ten groups with abbreviated subgroups, in GBM samples compared to neural stem cells (NSCs). |
 | Figure 3 Transcriptomics and patient survival plots of cytoskeletal regulators. |
Screening with FDA-approved oncology drugs
To begin with, a primary screening with FDA-approved oncology drugs was performed in order to select the most potent compounds before assessing their effect on GBM cell cytoskeleton. A collection of alkylating and nonalkylating oncology drugs were tested on GBM cells with one concentration and one end point using CellTiterGlo assay for determination of ATP production as a measure of viability. GBM cells were exposed to a collection of 125 FDA-approved oncology drugs at a final concentration of 10 μM for 4 days after which total ATP was determined. The cell viability screen identified many compounds that caused loss of ATP when compared to control, and there were compounds that caused an increase in ATP levels when compared to control after 4 days of exposure (Figure 4A). These compounds were then classified into seven groups based on their mechanism of action and color coded based on their effect on cell viability in that group (Figure 4B), few compounds such as mitomycin and pazopanib are represented in more than one group and color coded according to their effect in that group. A large set of the FDA-approved oncology drugs were antimetabolites interfering with DNA or RNA synthesis, followed by kinase inhibitors and alkylating agents. Various smaller groups consisting of topoisomerase inhibitors, mitotic inhibitors, antitumor antibiotics, and various other targets were classified into one group (Figure 4B). The primary screen identified that >50% of the kinase inhibitors used had an effect on decreasing the viability of GBM-derived cells (Figure 4C–J). More than 40% of the tested antimetabolite and alkylating agents decreased GBM cell viability followed by mitotic inhibitors, antitumor antibiotics, and topoisomerase inhibitors (Figure 4C–J). Compounds with various targets that were grouped as “other targets” also had significant effects on GBM cell viability (Figure 4C). We chose one hit from each group, cisplatin, enzalutamide, topotecan hydrochloride, ixabepilone, mitoxantrone, omacetaxine mepesuccinate, and mitomycin, producing the most severe loss of cellular ATP from each group and compared it to TMZ (Figure 4D–J). The primary screening identified that TMZ treatment was not only the least effective within the alkylating group but also produced the least effect on cell viability when compared to all FDA-approved oncology drugs used in the study. However, TMZ upon oral administration is completely absorbed across the blood–brain barrier and achieves a high concentration in the cerebrospinal fluid. The cytotoxic effect of TMZ correlates with the levels of O6-methylguanine-DNA-methyl transferase.31 A high level of O6-methylguanine-DNA-methyl transferase correlates with tumor resistance to TMZ in GBM patients.31 Our screening data identified many compounds that are more potent in reducing GBM cell viability when compared to TMZ, thereby indicating that a combinatorial chemotherapeutic approach of targeting GBM holds good promise.
 | Figure 4 Cell viability screen using FDA approved oncology drugs. |
TMZ treatment and cytoskeleton defects
In order to examine the effect of TMZ on cell viability, a log-dilution series with concentrations of TMZ ranging from 1 mM to 100 μM was performed, followed by measuring total cellular ATP at day 4 (Figure 5). TMZ treatment followed by ATP measurement on GBM cells indicated that cells could tolerate a high dose of TMZ, which was reflected by a half maximal inhibitory concentration (IC50) value of 269 μM at day 4 (Figure 5). To assess the effect of TMZ on the cytoskeleton, GBM cells were exposed to a sublethal concentration (50 μM) of TMZ and its effect on viability was assessed, by measuring total ATP followed by immunostaining with an antiacetylated tubulin antibody and phalloidin staining (Figure S3). Two- and 4-day exposure of TMZ did not produce any visible effect on total cellular ATP. Immunostaining for tubulin and actin indicated no visible dramatic difference between the control and TMZ treated cells (Figure S3). These results indicate that a high dose of TMZ is required to induce GBM cell lethality and a sublethal concentration of this alkylating agent did not produce an immediate visible effect on the cellular cytoskeleton.
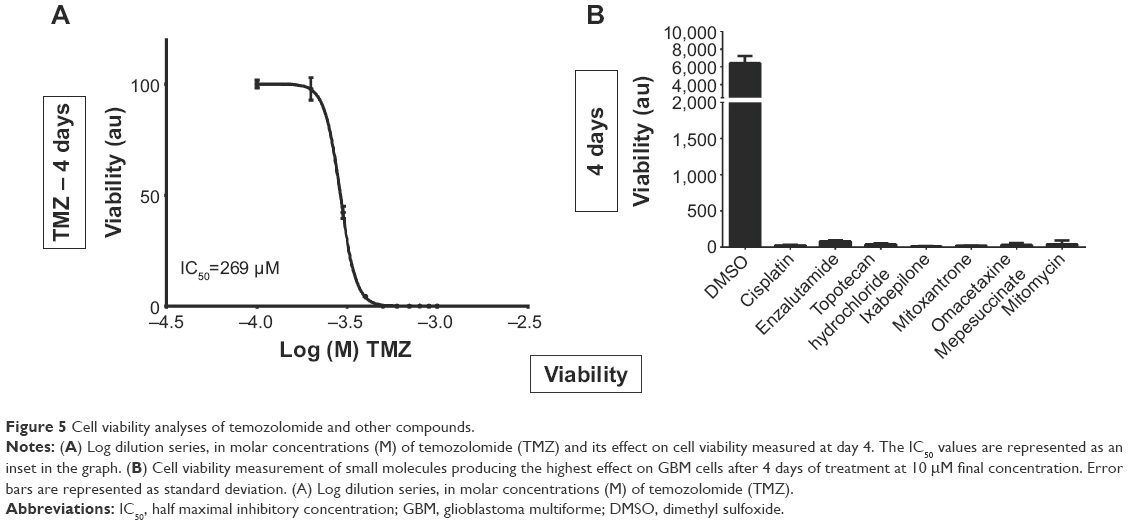 | Figure 5 Cell viability analyses of temozolomide and other compounds. |
Comparing FDA-approved oncology drug hits with TMZ treatment on GBM cells
To confirm the effect of the identified oncology drug screen hits, GBM cells were exposed to 10 μM of these compounds and their effect on cell viability was assayed by measuring cellular ATP at day 4. At day 4, all seven selected hits produced heavy loss of ATP (Figure 5). To understand the effect of these compounds on the cytoskeleton, cells were exposed to 10 μM of these compounds and 269 μM of TMZ (based on its IC50 value) and fixed after 2 days of exposure, followed by immunostaining against acetylated-tubulin and phalloidin and DAPI staining and imaging. Imaging with DAPI staining revealed pronounced nuclear fragmentation of cells treated with mitomycin, ixabepilone, enzalutamide, and cisplatin, while few cells treated with topotecan hydrochloride, TMZ, mitoxantrone, omacetaxine displayed nuclear fragmentation (Figure 6). Staining with antiacetylated tubulin antibody and phalloidin to visualize actin filaments and cell morphology identified clear actin cytoskeleton clumping in cells treated with mitomycin, ixabepilone, mitoxantrone, enzalutamide, and omacetaxine, while cells treated with topotecan hydrochloride, TMZ, and cisplatin did not display visible cytoskeleton clumping when compared to that of DMSO-treated cells (Figure 6). Cells treated with TMZ, cisplatin, mitoxantrone, enzalutamide, and omacetaxine displayed a similar morphology to that of cells treated with DMSO (Figure 6). Cells that were treated with mitomycin, topotecan hydrochloride, and ixabepilone showed a mixture of cells that were more roundup cells than normal spread-out morphology. Ixabepilone treatment displayed a more severe effect on cell morphology and actin cytoskeleton disruption than other compounds (Figure 6). All compounds, with the exception of TMZ and enzalutamide, exhibited a more pronounced effect on cell viability as reflected by total ATP measurement (Figure 6).
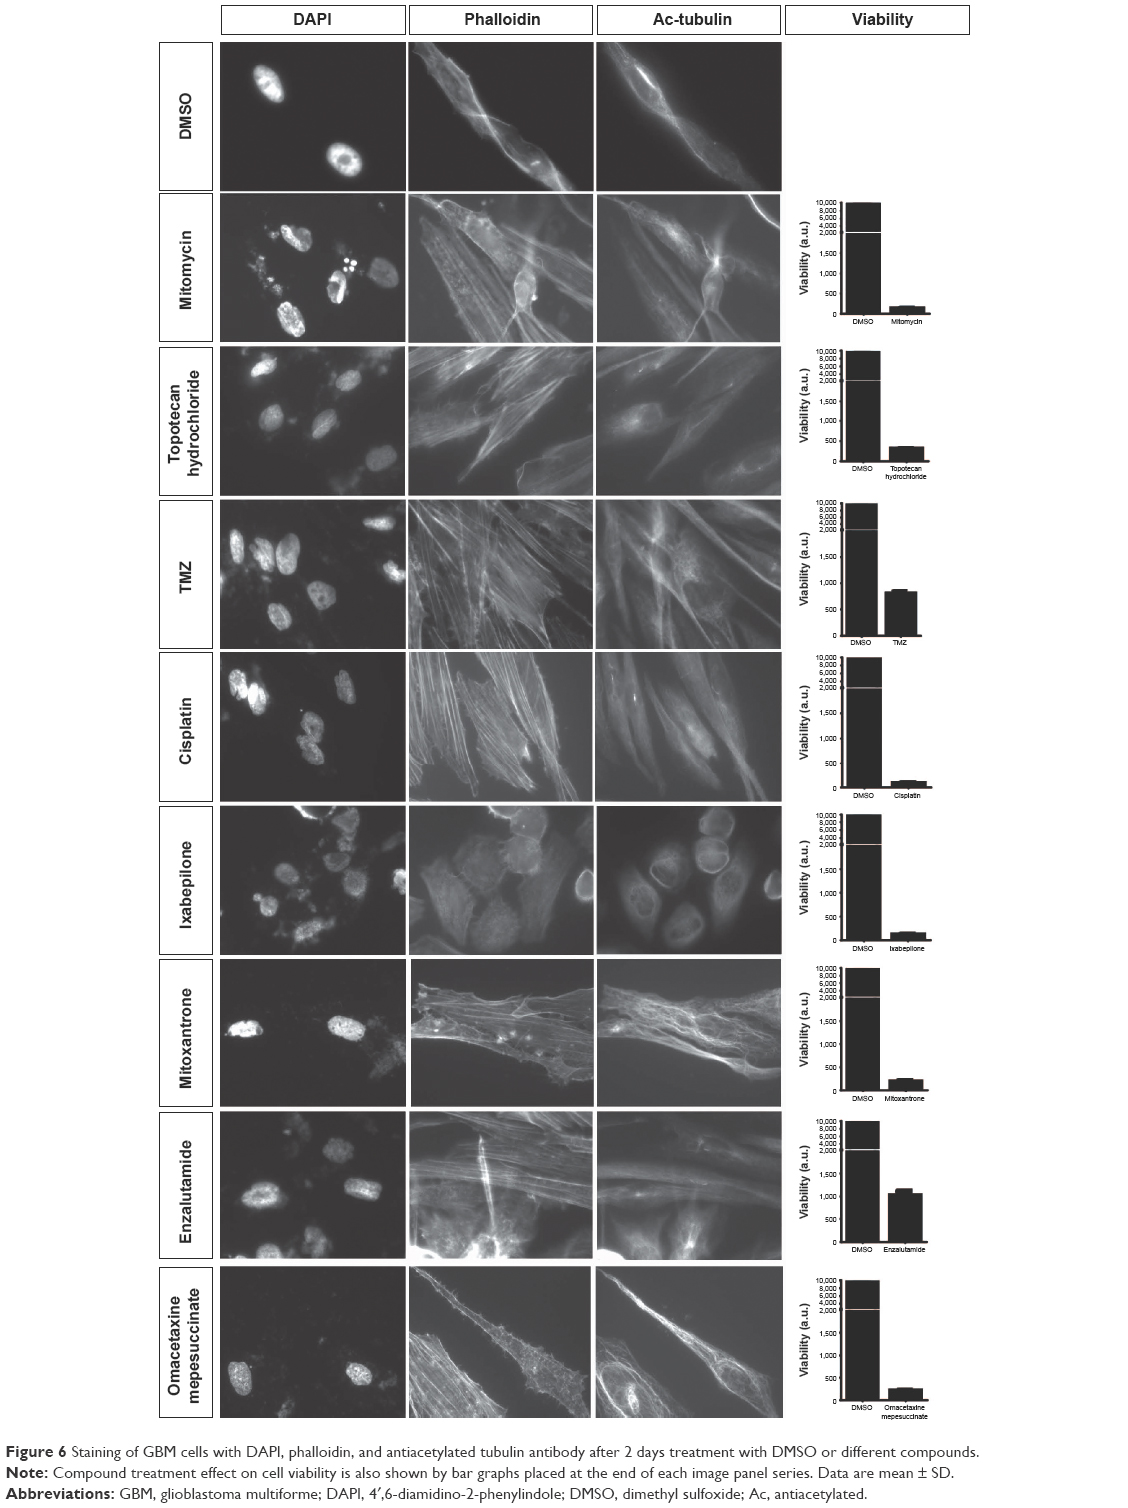 | Figure 6 Staining of GBM cells with DAPI, phalloidin, and antiacetylated tubulin antibody after 2 days treatment with DMSO or different compounds. |
TMZ is an alkylating agent that targets rapidly proliferating GBM cells. However, TMZ treatment did not show an immediate effect on GBM cells after 4 days of exposure, and displayed high IC50 value as seen in our cell viability assay. We sought to screen other FDA-approved oncology drugs to identify new compounds that could be potentially developed for GBM therapy. Using a cell viability assay followed by cell morphology imaging and cytoskeletal staining, we identified compounds that performed better on GBM cells than TMZ. Our screening showed that almost all tested FDA-approved oncology drugs performed better than TMZ at a concentration of 10 μM, with the kinase inhibitor group exhibiting the most prominent effect followed by alkylating and antimetabolites agents. Other alkylating agents performed better than TMZ, and compounds such as cisplatin and mitomycin produced a higher lethality on glioblastoma cells. Indeed, a Phase II clinical trial study indicated that cisplatin-plus and TMZ combinatorial treatment on chemotherapy-naïve patients with recurrent GBM produced better progression free survival rates with acceptable toxicity,32 indicating that such combinatorial therapies hold promise toward treatment of GBM. Given the fact that these compounds are designed to target different traits of the GBM cell, a combinatorial approach could possibly allow lowering the concentration of each compound, increasing the efficiency of killing the GBM cells and lowering side effects produced, as well as decreasing the possibility of chemo resistance. Other compounds, such as topotecan hydrochloride, ixabepilone and mitoxantrone, identified in this study are already tested in combinatorial treatments for GBM along with TMZ.33–35 A clinical study involving local administration of mitoxantrone, and with ixabepilone for treating recurrent GBM showed promise as a second line of chemotherapeutic agent.35 Cell morphology followed by cytoskeletal staining of GBM cells after treatment with these compounds indicated that treatment with ixabepilone produced a severe visible disruption of the cytoskeleton followed by mitoxantrone, omacetaxine, enzalutamide, and mitomycin. TMZ showed the least effect on cell morphology and cytoskeletal integrity, consistent with the primary screening data where TMZ produced the least effect on cell viability. These data allow further testing toward an optimization of doses and a better characterization of efficacy of identified compounds. Experiments on drug combination could also be further evaluated in various in vitro and in vivo models to understand the dynamic remodeling of cytoskeleton in GBM cells and their effect on proliferation, migration, and chemoresistance.
Our in silico studies identified six cytoskeleton regulator genes, CLIP1, CLIP2, MSN, ARIFP2, ARAP1, and MID1, whose lower expression levels correlated with longer patient survival. To assess the effect of TMZ and other hit compounds on their expression level, mRNA expression of these six genes in GBM cells was quantified using qRT-PCR after 2 days of exposure to compounds (Figure 7). This analysis revealed that different compounds had different effects on the relative expression of the genes when compared to DMSO. In cells treated with compounds, an overall decrease in expression of CLIP1 and ARAP1 was seen with mitoxantrone producing the most prominent effect on expression of both genes (Figure 7). Mitomycin, topotecan hydrochloride, omacetaxine mepesuccinate, and TMZ had a more pronounced effect on expression of ARAP1 than on CLIP1 with mitomycin and topotecan having the least effect on CLIP1. Gene expression analysis on CLIP2 showed a dramatic increase in expression post omacetaxine treatment (Figure 7). Mitomycin, topotecan, and ixabepilone also resulted in an increase in expression. TMZ and other compounds produced a relatively smaller increase in expression of CLIP2 (Figure 7). Expression analysis of MSN, ARIFP2, and MID1 identified that different compounds produced different effects on their expression. Mitoxantrone, cisplatin, enzalutamide, and TMZ decreased the expression of all three genes, with mitoxantrone having the most effect. Mitomycin had no effect on MSN but showed a small increase in expression of ARIFP2 and MID1. Both topotecan hydrochloride and ixabepilone treatment decreased MSN and MID1 expression but increased expression of ARFIP2. Omacetaxine treatment produced an increase in expression of MID1 but decreased expression of ARIFP2 and MSN (Figure 7).
 | Figure 7 qPCR analyses after compound treatment. |
CLIP1 and CLIP2 encode CAP-GLY domain containing linker proteins, proposed to function as mediators of interaction of membranous organelles with microtubules. Treatment with all the identified compounds in this study resulted in downregulation of CLIP1. CLIP1 has been identified as a mediator of chemosensitivity and high expression was shown to correlate with tumor cell sensitivity to paclitaxel, and in preventing lamellipodia formation and cancer cell invasion.36 Treatment with topotecan hydrochloride, mitomycin, omacetaxine, and TMZ did not result in extensive downregulation when compared to other compounds. Amplification of CLIP2 has been reported in GBM, colorectal carcinomas, and in radiation-associated overexpression in papillary thyroid carcinomas.27 TCGA-derived GBM patient survival curve data show that low expression of CLIP2 correlates with better overall survival. Although treatment with compounds did produce an increase in CLIP2 expression, this increase was less pronounced with TMZ, enzalutamide, mitoxantrone, and cisplatin treatment when compared to that of other compounds. These data indicate that TMZ was the only compound that did not produce a marked decrease of CLIP1 or a dramatic increase of CLIP2 expression, when compared to treatment with other compounds.
Moesin is a protein encoded by the MSN gene and functions as a cross linker between the plasma membrane and actin cytoskeleton. Meosin localizes in filopodia and is needed for cell–cell recognition and migration.37,38 The overall survival of GBM patients (TCGA data sets) decreased with high expression of MSN (P-value =0). Various studies have established a correlation between high MSN expression with poor clinical outcome of astrocytoma cases38 and in epithelial–mesenchymal transition of breast cancer cells.37 Treatment with TMZ significantly decreased the expression of MSN, preceded only by cisplatin and mitoxantrone. Analysis of GBM patient survival indicates a correlation between high expression levels of ARFIP2, an ADP-ribosylation factor interacting protein 2, with high patient mortality. ARFIP2 is associated with membrane ruffling, cargo transport, and regulation of small GTPase-mediated cytoskeletal rearrangement.39,40 Treatment with TMZ significantly decreases its expression preceded only by cisplatin when compared to other compounds. Similar to ARFIP2, ARAP1 and MID1 encode multidomain containing proteins involved in various cellular functions such as receptor trafficking, small GTPase signaling, and microtubule dynamics.41,42 Again, GBM patient survival curves indicate that their high expression correlated with patient mortality. TMZ treatment decreases the expression of ARAP1 significantly, preceded only by enzalutamide, cisplatin, and mitoxantrone. TMZ treatment also decreases the expression of MID1, preceded only by mitoxantrone. The data so far indicate that although TMZ does not significantly reduce the cell viability of GBM cells, it has a consistent effect on cytoskeletal regulatory genes important for chemosensitivity, migration, and cytoskeletal rearrangement when compared to other compounds. These data also highlight the importance of combinatorial therapy with TMZ as an important player to which other compound options can be added.
This study draws attention to the underlying importance of assessing the impact on cellular cytoskeleton of GBM cells after exposure to chemotherapy. Hence, analyzing cytoskeleton regulators and cell morphology may not only help us to evaluate the efficacy of treatment but will also help to identify compounds and the genes influenced by them with regard to their role in chemoresistance and metastasis, paving the way toward new treatment strategies.
Conclusion
Comparative transcriptomics, GBM patient survival plots, and genetic alteration analysis indicate that cytoskeleton regulators are an important part of cancer cell survival and their expression is heavily modulated in cancer. A degree of correlation between high expression of various cytoskeleton modulators with patient survival suggests that targeting cytoskeleton could offer a strategic advantage for improving the outcome of GBM therapy. Small molecule screening with FDA-approved drugs offers the possibility to develop new single drug or combinatorial drug therapies.
Acknowledgments
The authors would like to thank the National Cancer Institute, USA, for supplying the FDA-approved oncology drug library. SK would like to thank Lillian Sagens och Curt Ericssons Forskningsstiftelse and Vetenskaprådet and GC would like to thank Hjärnafonden postdoc scholarship for funding this study. The authors thank Ola Hermanson, Karolinska Institutet, for feedback and Vanessa Place for proofreading the manuscript.
Disclosure
The authors report no conflicts of interest in this work.
References
Network TC. Corrigendum: comprehensive genomic characterization defines human glioblastoma genes and core pathways. Nature. 2013;494(7438):506. | ||
Cancer Genome Atlas Research Network. Comprehensive genomic characterization defines human glioblastoma genes and core pathways. Nature. 2008;455(7216):1061–1068. | ||
Louis DN, Ohgaki H, Wiestler OD, et al. The 2007 WHO classification of tumours of the central nervous system. Acta Neuropathol. 2007;114(2):97–109. | ||
Dolecek TA, Propp JM, Stroup NE, Kruchko C. CBTRUS statistical report: primary brain and central nervous system tumors diagnosed in the United States in 2005–2009. Neuro Oncol. 2012;14(suppl 5):v1–v49. | ||
Oike T, Suzuki Y, Sugawara K, et al. Radiotherapy plus concomitant adjuvant temozolomide for glioblastoma: Japanese mono-institutional results. PLoS One. 2013;8(11):e78943. | ||
Stupp R, Mason WP, van den Bent MJ, et al. Radiotherapy plus concomitant and adjuvant temozolomide for glioblastoma. N Engl J Med. 2005;352(10):987–996. | ||
Stupp R, Hegi ME, Mason WP, et al; European Organisation for Research and Treatment of Cancer Brain Tumour and Radiation Oncology Groups; National Cancer Institute of Canada Clinical Trials Group. Effects of radiotherapy with concomitant and adjuvant temozolomide versus radiotherapy alone on survival in glioblastoma in a randomised phase III study: 5-year analysis of the EORTC-NCIC trial. Lancet Oncol. 2009;10(5):459–466. | ||
Peignan L, Garrido W, Segura R, et al. Combined use of anticancer drugs and an inhibitor of multiple drug resistance-associated protein-1 increases sensitivity and decreases survival of glioblastoma multiforme cells in vitro. Neurochem Res. 2011;36(8):1397–1406. | ||
Parsons DW, Jones S, Zhang X, et al. An integrated genomic analysis of human glioblastoma multiforme. Science. 2008;321(5897):1807–1812. | ||
Kitambi SS, Toledo EM, Usoskin D, et al. Vulnerability of glioblastoma cells to catastrophic vacuolization and death induced by a small molecule. Cell. 2014;157(2):313–328. | ||
Doherty GJ, McMahon HT. Mediation, modulation, and consequences of membrane-cytoskeleton interactions. Annu Rev Biophys. 2008;37:65–95. | ||
Yilmaz M, Christofori G. EMT, the cytoskeleton, and cancer cell invasion. Cancer Metastasis Rev. 2009;28(1–2):15–33. | ||
Evans SM, Judy KD, Dunphy I, et al. Hypoxia is important in the biology and aggression of human glial brain tumors. Clin Cancer Res. 2004;10(24):8177–8184. | ||
Jensen RL. Hypoxia in the tumorigenesis of gliomas and as a potential target for therapeutic measures. Neurosurg Focus. 2006;20(4):E24. | ||
Zhou J, Schmid T, Schnitzer S, Brune B. Tumor hypoxia and cancer progression. Cancer Lett. 2006;237(1):10–21. | ||
Wang L, Zhao K, Ren B, et al. Expression of cortactin in human gliomas and its effect on migration and invasion of glioma cells. Oncol Rep. 2015;34(4):1815–1824. | ||
Zhang S, Qi Q. MTSS1 suppresses cell migration and invasion by targeting CTTN in glioblastoma. J Neurooncol. 2015;121(3):425–431. | ||
Fortin Ensign SP, Mathews IT, Symons MH, Berens ME, Tran NL. Implications of Rho GTPase signaling in glioma cell invasion and tumor progression. Front Oncol. 2013;3:241. | ||
Katsetos CD, Draberova E, Smejkalova B, et al. Class III beta-tubulin and gamma-tubulin are co-expressed and form complexes in human glioblastoma cells. Neurochem Res. 2007;32(8):1387–1398. | ||
Oehler C, Frei K, Rushing EJ, et al. Patupilone (epothilone B) for recurrent glioblastoma: clinical outcome and translational analysis of a single-institution phase I/II trial. Oncology. 2012;83(1):1–9. | ||
Brennan CW, Verhaak RG, McKenna A, et al. The somatic genomic landscape of glioblastoma. Cell. 2013;155(2):462–477. | ||
Zarkoob H, Taube JH, Singh SK, Mani SA, Kohandel M. Investigating the link between molecular subtypes of glioblastoma, epithelial-mesenchymal transition, and CD133 cell surface protein. PLoS One. 2013;8(5):e64169. | ||
Nogueira L, Ruiz-Ontanon P, Vazquez-Barquero A, et al. Blockade of the NFkappaB pathway drives differentiating glioblastoma-initiating cells into senescence both in vitro and in vivo. Oncogene. 2011;30(32):3537–3548. | ||
Gao J, Aksoy BA, Dogrusoz U, et al. Integrative analysis of complex cancer genomics and clinical profiles using the cBioPortal. Sci Signal. 2013;6(269):pl1. | ||
Cerami E, Gao J, Dogrusoz U, et al. The cBio cancer genomics portal: an open platform for exploring multidimensional cancer genomics data. Cancer Discov. 2012;2(5):401–404. | ||
Xu YY, Gao P, Sun Y, Duan YR. Development of targeted therapies in treatment of glioblastoma. Cancer Biol Med. 2015;12(3):223–237. | ||
Selmansberger M, Kaiser JC, Hess J, et al. Dose-dependent expression of CLIP2 in post-Chernobyl papillary thyroid carcinomas. Carcinogenesis. 2015;36(7):748–756. | ||
Rak R, Haklai R, Elad-Tzfadia G, Wolfson HJ, Carmeli S, Kloog Y. Novel LIMK2 Inhibitor Blocks Panc-1 Tumor Growth in a mouse xenograft model. Oncoscience. 2014;1(1):39–48. | ||
Thiyagarajan V, Tsai MJ, Weng CF. Antroquinonol targets FAK-signaling pathway suppressed cell migration, invasion, and tumor growth of C6 glioma. PLoS One. 2015;10(10):e0141285. | ||
Escudero-Esparza A, Jiang WG, Martin TA. Claudin-5 is involved in breast cancer cell motility through the N-WASP and ROCK signalling pathways. J Exp Clin Cancer Res. 2012;31:43. | ||
Hegi ME, Diserens AC, Gorlia T, et al. MGMT gene silencing and benefit from temozolomide in glioblastoma. N Engl J Med. 2005;352(10):997–1003. | ||
Brandes AA, Basso U, Reni M, et al. First-line chemotherapy with cisplatin plus fractionated temozolomide in recurrent glioblastoma multiforme: a phase II study of the Gruppo Italiano Cooperativo di Neuro-Oncologia. J Clin Oncol. 2004;22(9):1598–1604. | ||
Bruce JN, Fine RL, Canoll P, et al. Regression of recurrent malignant gliomas with convection-enhanced delivery of topotecan. Neurosurgery. 2011;69(6):1272–1279; discussion 1279–1280. | ||
Kaiser S, Muller JJ, Froehlich PE, Baggio Gnoatto SC, Bergold AM. From bacteria to antineoplastic: epothilones a successful history. Anticancer Agents Med Chem. 2013;13(7):1057–1068. | ||
Boiardi A, Silvani A, Eoli M, et al. Treatment of recurrent glioblastoma: can local delivery of mitoxantrone improve survival? J Neurooncol. 2008;88(1):105–113. | ||
Sun X, Li D, Yang Y, et al. Microtubule-binding protein CLIP-170 is a mediator of paclitaxel sensitivity. J Pathol. 2012;226(4):666–673. | ||
Wang CC, Liau JY, Lu YS, Chen JW, Yao YT, Lien HC. Differential expression of moesin in breast cancers and its implication in epithelial-mesenchymal transition. Histopathology. 2012;61(1):78–87. | ||
Wu M, Liu DY, Yuan XR, et al. The expression of moesin in astrocytoma: correlation with pathologic grade and poor clinical outcome. Med Oncol. 2013;30(1):372. | ||
Van Aelst L, Joneson T, Bar-Sagi D. Identification of a novel Rac1-interacting protein involved in membrane ruffling. EMBO J. 1996;15(15):3778–3786. | ||
D’Souza-Schorey C, Boshans RL, McDonough M, Stahl PD, Van Aelst L. A role for POR1, a Rac1-interacting protein, in ARF6-mediated cytoskeletal rearrangements. EMBO J. 1997;16(17):5445–5454. | ||
Daniele T, Di Tullio G, Santoro M, Turacchio G, De Matteis MA. ARAP1 regulates EGF receptor trafficking and signalling. Traffic. 2008;9(12):2221–2235. | ||
Aranda-Orgilles B, Aigner J, Kunath M, Lurz R, Schneider R, Schweiger S. Active transport of the ubiquitin ligase MID1 along the microtubules is regulated by protein phosphatase 2A. PLoS One. 2008;3(10):e3507. |
 © 2016 The Author(s). This work is published and licensed by Dove Medical Press Limited. The
full terms of this license are available at https://www.dovepress.com/terms
and incorporate the Creative Commons Attribution
- Non Commercial (unported, 3.0) License.
By accessing the work you hereby accept the Terms. Non-commercial uses of the work are permitted
without any further permission from Dove Medical Press Limited, provided the work is properly
attributed. For permission for commercial use of this work, please see paragraphs 4.2 and 5 of our Terms.
© 2016 The Author(s). This work is published and licensed by Dove Medical Press Limited. The
full terms of this license are available at https://www.dovepress.com/terms
and incorporate the Creative Commons Attribution
- Non Commercial (unported, 3.0) License.
By accessing the work you hereby accept the Terms. Non-commercial uses of the work are permitted
without any further permission from Dove Medical Press Limited, provided the work is properly
attributed. For permission for commercial use of this work, please see paragraphs 4.2 and 5 of our Terms.