Back to Journals » Diabetes, Metabolic Syndrome and Obesity » Volume 14
Understanding Competitive Endogenous RNA Network Mechanism in Type 1 Diabetes Mellitus Using Computational and Bioinformatics Approaches
Received 21 May 2021
Accepted for publication 24 July 2021
Published 8 September 2021 Volume 2021:14 Pages 3865—3945
DOI https://doi.org/10.2147/DMSO.S315488
Checked for plagiarism Yes
Review by Single anonymous peer review
Peer reviewer comments 2
Editor who approved publication: Prof. Dr. Antonio Brunetti
Xuanzi Yi,1,* Xu Cheng2,3,*
1Department of Medicine II, Division of Endocrinology and Diabetology, Medical Center University of Freiburg, Faculty of Medicine, University of Freiburg, Freiburg, 79106, Germany; 2Department of Urology, Xiangya Hospital, Central South University, Changsha, Hunan, People’s Republic of China; 3Medical Center University of Freiburg, Faculty of Medicine, University of Freiburg, Freiburg, 79106, Germany
*These authors contributed equally to this work
Correspondence: Xuanzi Yi
Department of Medicine II, Division of Endocrinology and Diabetology, Medical Center University of Freiburg, Faculty of Medicine, University of Freiburg, Hugstetter Str. 55, Freiburg, 79106, Germany
Tel/Fax +49 761 270-73270
Email [email protected]
Background: Type 1 diabetes mellitus (T1DM), an autoimmune disease with a genetic tendency, has an increasing prevalence. Long non-coding RNA (lncRNA) and circular RNA (circRNA) are receiving increasing attention in disease pathogenesis. However, their roles in T1DM are poorly understood. The present study aimed at identifying signature lncRNAs and circRNAs and investigating their roles in T1DM using the competing endogenous RNA (ceRNA) network analysis.
Methods: The T1DM expression profile was downloaded from Gene Expression Omnibus (GEO) database to identify the differentially expressed circRNAs, lncRNAs, and mRNAs. The biological functions of these differentially expressed circRNAs, lncRNAs, and mRNAs were analyzed by the Gene Ontology (GO) and Kyoto Encyclopedia of Genes and Genomes (KEGG) enrichment analysis. Targeting relationships of circRNA-miRNA, lncRNA-miRNA, and miRNA-mRNA were predicted, and the circRNA-lncRNA-miRNA-mRNA ceRNA regulatory network was established. Finally, qRT-PCR was applied to identify the effect of hsa_circ_0002202 inhibition on the IFN-I induced macrophage inflammation.
Results: A total of 178 circRNAs, 404 lncRNAs, and 73 mRNAs were identified to be abnormally expressed in T1DM samples. Functional enrichment analysis results indicated that the differentially expressed genes were mainly enriched in extracellular matrix components and macrophage activation. CeRNA regulatory network showed that circRNAs and lncRNAs regulate mRNAs through integrate multiple miRNAs. In addition, in vitro experiments showed that hsa_circ_0002202 inhibition suppressed the type I interferon (IFN-I)-induced macrophage inflammation.
Conclusion: In the present study, the circRNA-lncRNA-miRNA-mRNA ceRNA regulatory network in T1DM was established for the first time. We also found that hsa_circ_0002202 inhibition suppressed the IFN-I-induced macrophage inflammation. Our study may lay a foundation for future studies on the ceRNA regulatory network in T1DM.
Keywords: type 1 diabetes mellitus, ceRNA network, peripheral blood mononuclear cell, macrophage
Introduction
Type 1 diabetes mellitus (T1DM), also known as insulin-dependent diabetes mellitus, is a chronic autoimmune disease characterized by impaired islet function and decreased insulin secretion.1,2 The cause of T1DM involves various factors, including epigenetic, individual genetics, and environmental triggers.3–6 T1DM is diagnosed at all ages.7,8 Among them, approximately 78,000 young people are diagnosed with T1DM annually worldwide.9 Moreover, recent studies revealed that the incidence of T1DM is on the rise at the age of 10–14, and the number of children and adolescents with T1DM worldwide is estimated to continue to increase.10,11
Patients with T1DM usually suffer from the disease for a longer time, which requires them to inject insulin daily and perform continuous blood glucose monitoring, resulting in huge lifetime costs and time requirements.12 At the same time, T1DM has serious complications such as ketoacidosis, heart disease, stroke, kidney failure, and blindness.13–17 These long-term effects are likely to spread to other areas of the patients’ lives, which will cause economic impact and social burdens.12,18 Thus, it is necessary to diagnose T1DM early. However, the traditional diagnostic methods of diabetes are no longer satisfactory.19 Therefore, it is urgent to understand the etiology and pathogenesis of T1DM for more effective diagnosis and treatment.
Through the recent researches on the post-transcriptional regulatory mechanism, non-coding RNA (ncRNA), which does not have traditional RNA functions in protein translation, was discovered.20 Among them, the long non-coding RNA (lncRNA) is a kind of linear non-coding RNA with a length of more than 200 nucleotides,21 and circular RNA (circRNA) is a kind of endogenous non-coding RNA with a closed-loop structure.22 Previous studies have shown the vital roles of various lncRNAs and circRNAs in T1DM. lncRNA Lnc13 is up-regulated in β-cells and contributes to the pathogenesis of T1DM by increasing pancreatic β-cell inflammation.23 Ding et al reported that lncRNA MALAT1 induces the dysfunction of β-cells in T1DM.24 Another study by Zhang et al found that circRNA circPPM1F modulates M1 macrophage activation and pancreatic islet inflammation in T1DM.25 Therefore, examining the expression of lncRNAs and circRNAs and exploring their underlying mechanism in T1DM opens avenues to a better understanding of the T1DM pathogenesis.
Both lncRNA and circRNA can act as microRNA (miRNA) sponges to compete with the same corresponding miRNA response element (MRE), thus controlling subsequent miRNA post-transcriptional regulation and forming competitive endogenous RNA (ceRNA) regulatory network.26–28 The ceRNA regulatory networks in diabetes have been widely reported.29–32 While in T1DM, few studies regarding the ceRNA regulatory network were reported. Li et al and Luo et al identified the circRNA-miRNA-mRNA network in T1DM via bioinformatic analysis.22,33 Shi et al reported the lncRNA-miRNA-mRNA regulatory networks in T1DM.34 Thus, further studies aimed at clarifying ceRNA-based molecular mechanisms in T1DM are needed to provide potential opportunities for better understanding the pathogenesis and treatment of T1DM.
With the popularization of high-throughput sequencing, bioinformatics analysis has been widely used in multiple disease research. Researchers can analyze data from various public databases and explore the regulatory mechanism underlying the disease. Here, we identified the differentially expressed circRNAs (DEcircRNAs), lncRNAs (DElncRNAs), mRNAs (DEmRNAs) in T1DM using expression profile GSE133225 and GSE133217 downloaded from the Gene Expression Omnibus (GEO) database.35 Subsequently, Gene Ontology (GO) and Kyoto Encyclopedia of Genes and Genomes (KEGG) enrichment analyses were performed to detect the function of these differentially expressed genes. Then, the circRNA-miRNA, lncRNA-miRNA, and miRNA-mRNA interaction were predicted, and the circRNA-lncRNA-miRNA-mRNA ceRNA regulatory network was constructed. This is the first time to construct the ceRNA regulatory network by comprehensive screening of circRNA, lncRNA, miRNA, and mRNA in T1DM.
Materials and Methods
Data Sources
Two individual cohorts from the GEO database (http://www.ncbi.nlm.nih.gov/geo/) were included in this study. One is the circRNA, lncRNA, and mRNA expression profile GSE133225, and the other one is the miRNA expression profile GSE133217. Both expression profiles were provided by Zhang Caiyan and Zhou Yufeng,25,36 and included 4 peripheral blood mononuclear cells (PBMCs) samples from T1DM patients and 4 PBMCs samples from healthy volunteers.
Summary of Statistical Analysis
In the current study, we first analyzed the circRNA, lncRNA, miRNA, and mRNA expression using the microarray GSE133225 and GSE133217. Next, according to the filtrate threshold (P value < 0.05 and log2 (fold change) > 1), the differentially expressed circRNA, lncRNA, and mRNA were screened out. GO and KEGG enrichment analyses were performed to better comprehend the mechanisms of T1DM. Then, the target prediction was performed with the online web tools Circinteractome, LncBase, and starBase, and the circRNA-lncRNA-miRNA-mRNA interaction network was established. Finally, circRNA hsa_circ_0002202 was selected for further verification. A brief workflow was shown in Figure 1.
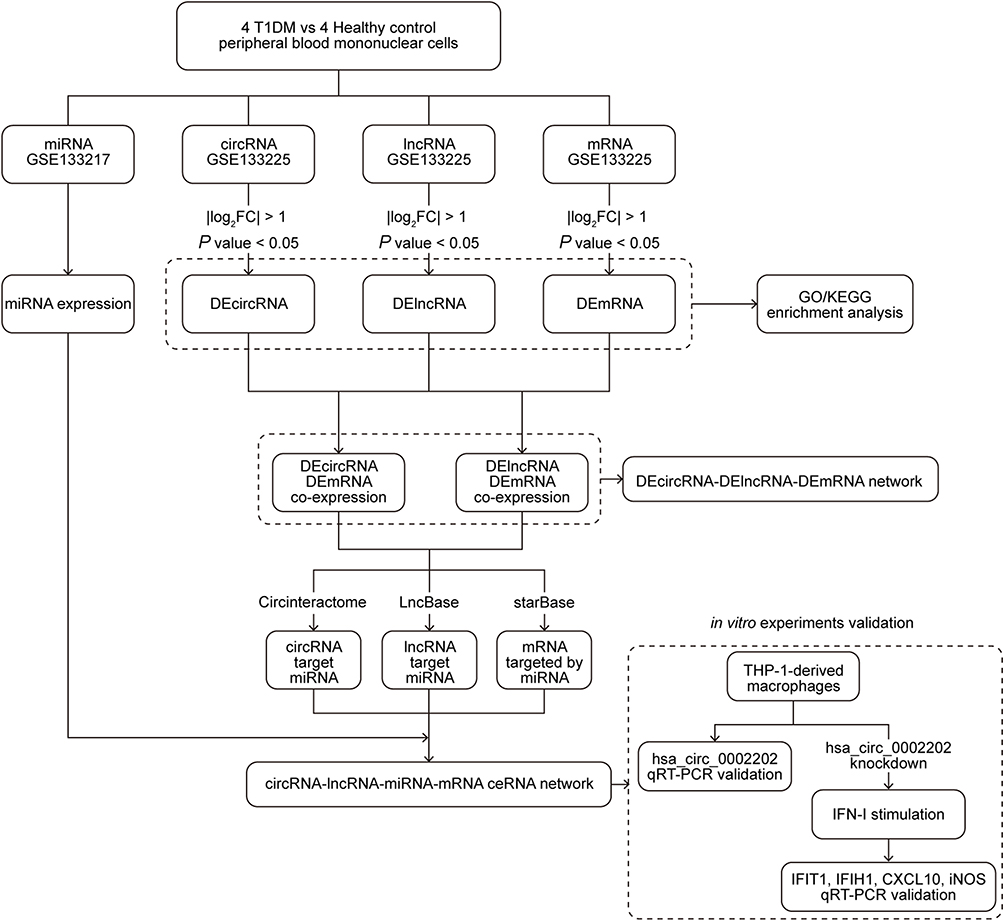 |
Figure 1 The analysis flow chart of this study. |
Differential Expression Analysis
R software (Ver. 3.5.0, https://www.r-project.org/) was employed for microarray analysis. The “affy” package was used for normalizing microarray expression profiles as described before.37 Then, empirical Bayes moderated t-test in the “limma” package38 was applied to screen the differentially expressed genes (DEGs) between T1DM samples and normal samples with P value < 0.05 and log2 (fold change) > 1 as the threshold. The code for the differential expression analysis was shown in Supplementary File 1.
Functional and Pathway Enrichment Analysis of Differentially Expressed circRNAs, lncRNAs, and mRNAs
To better comprehend the mechanisms of T1DM, GO (http://www.geneontology.org/) analysis and KEGG (http://www.kegg.jp/) pathway analysis of the differentially expressed circRNA, lncRNA, and mRNAs was conducted with the “clusterProfiler” package39 using P < 0.05 (adjusted using Benjamin and Hochberg method) as the threshold. Specifically, GO analysis is used to construct gene annotation base on biological processes (BP, a biological objective to which the gene or gene product contributes), cellular components (CC, the place in the cell where a gene product is active), and molecular functions (MF, the biochemical activity (including specific binding to ligands or structures) of a gene product),40 and KEGG analysis is used to interpret the potential functions and pathways.41 The code for the enrichment analysis was shown in Supplementary File 2. For the enrichment analysis for differentially expressed circRNAs, we used their parental genes. For the enrichment analysis for differentially expressed lncRNAs, we used their associated genes.
Construction of circRNA-lncRNA-miRNA-mRNA ceRNA Regulatory Network
The expression correlation of differentially expressed circRNAs, lncRNAs, and mRNAs was calculated using Pearson correlation coefficients with the “psych” package (https://cran.r-project.org/web/packages/psych/). The code for the correlation analysis was shown in Supplementary File 3. circRNA-mRNA and lncRNA-mRNA with r > 0.7 and P < 0.05 were selected for further study. Then, the Circinteractome web tool (https://circinteractome.nia.nih.gov/) was applied to predict the circRNA-miRNA interactions. LncBase web tool (http://carolina.imis.athena-innovation.gr/diana_tools/web/index.php?r=lncbasev2/index) was applied to predict the lncRNA-miRNA interactions. starBase web tool (http://starbase.sysu.edu.cn/) was applied to predict the miRNA-mRNA interactions. Finally, a circRNA-lncRNA-miRNA-mRNA interaction network visualized by Cytoscape software42 based on the ceRNA theory.
Cell Culture and Treatment
Human THP-1 cell line from Procell Life Science&Technology Co., Ltd. (Wuhan, China) was cultured in the RPMI-1640 medium supplied with 10% fetal bovine serum (FBS, Gibco, Gaithersburg, MD, USA) and 1% penicillin-streptomycin (Gibco) at 37°C with 5% CO2. Then, according to a previous study,36 THP-1-derived macrophages were induced by treating with 50 ng/mL phorbol 12-myristate 13-acetate (PMA) for 48 h. Cell transfection was performed using Lipofectamine 3000 reagent (Invitrogen, USA) with the chemically synthesized circRNA small interfering RNAs (si-circ, sequence: 5ʹ-AGTACAACAATTCAGGTGATT-3ʹ), and small interfering RNAs negative control (si-NC, sequence: 5ʹ-UUCUCCGAACGUGUCACGUTT-3ʹ). After 48 h of transfection, the macrophages were treated with type I interferon (IFN-I, 1000 units/mL, PBL Assay Science, USA) to induce the inflammation.
Quantitative Real-Time PCR (qRT-PCR)
Total RNA was extracted from cells with Trizol (Invitrogen, USA). Next, cDNA was reverse transcribed with PrimeScript First Strand cDNA Synthesis Kit (Takara, Japan). Then, the qRT-PCR reaction was performed with SYBR® Premix Ex Taq™ II (Takara, Japan) on the LightCycler 96 PCR system (Roche, Rotkreuz, Switzerland). β-actin was selected as the internal control according to the geNorm43 and normFinder44 algorithms. The level of RNA was quantified by the 2−ΔΔCT method. Primers were displayed in Table 1.
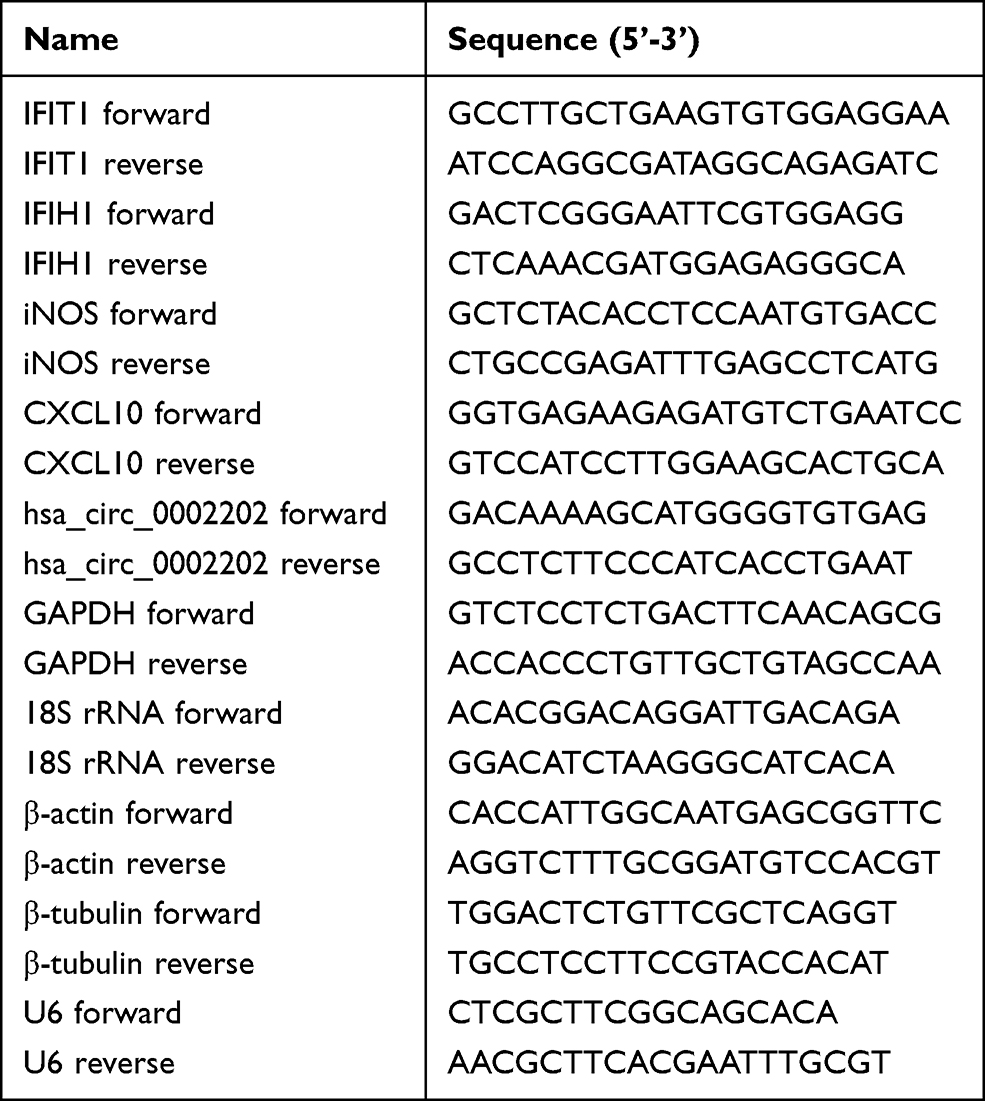 |
Table 1 Primers Used for qRT-PCR |
Nuclear and Cytoplasmic Separation
In brief, nuclear and cytoplasmic RNAs were extracted using the PARIS kit (Invitrogen, Carlsbad, CA, USA). Then, the RNA extractions were subjected to qRT-PCR. U6 was used as the internal control of the nucleus, and 18S rRNA was used as the internal control of the cytoplasm.
Statistical Analysis
The qRT-PCR experiments were performed in triplicate, and the results were shown as mean ± SD. Statistical difference was analyzed using one-way ANOVA with GraphPad Prism (Ver. 8.0, GraphPad Software, Inc). P < 0.05 was considered to be statistically significant.
Results
Identification of Differentially Expressed circRNA in T1DM and Healthy Patients
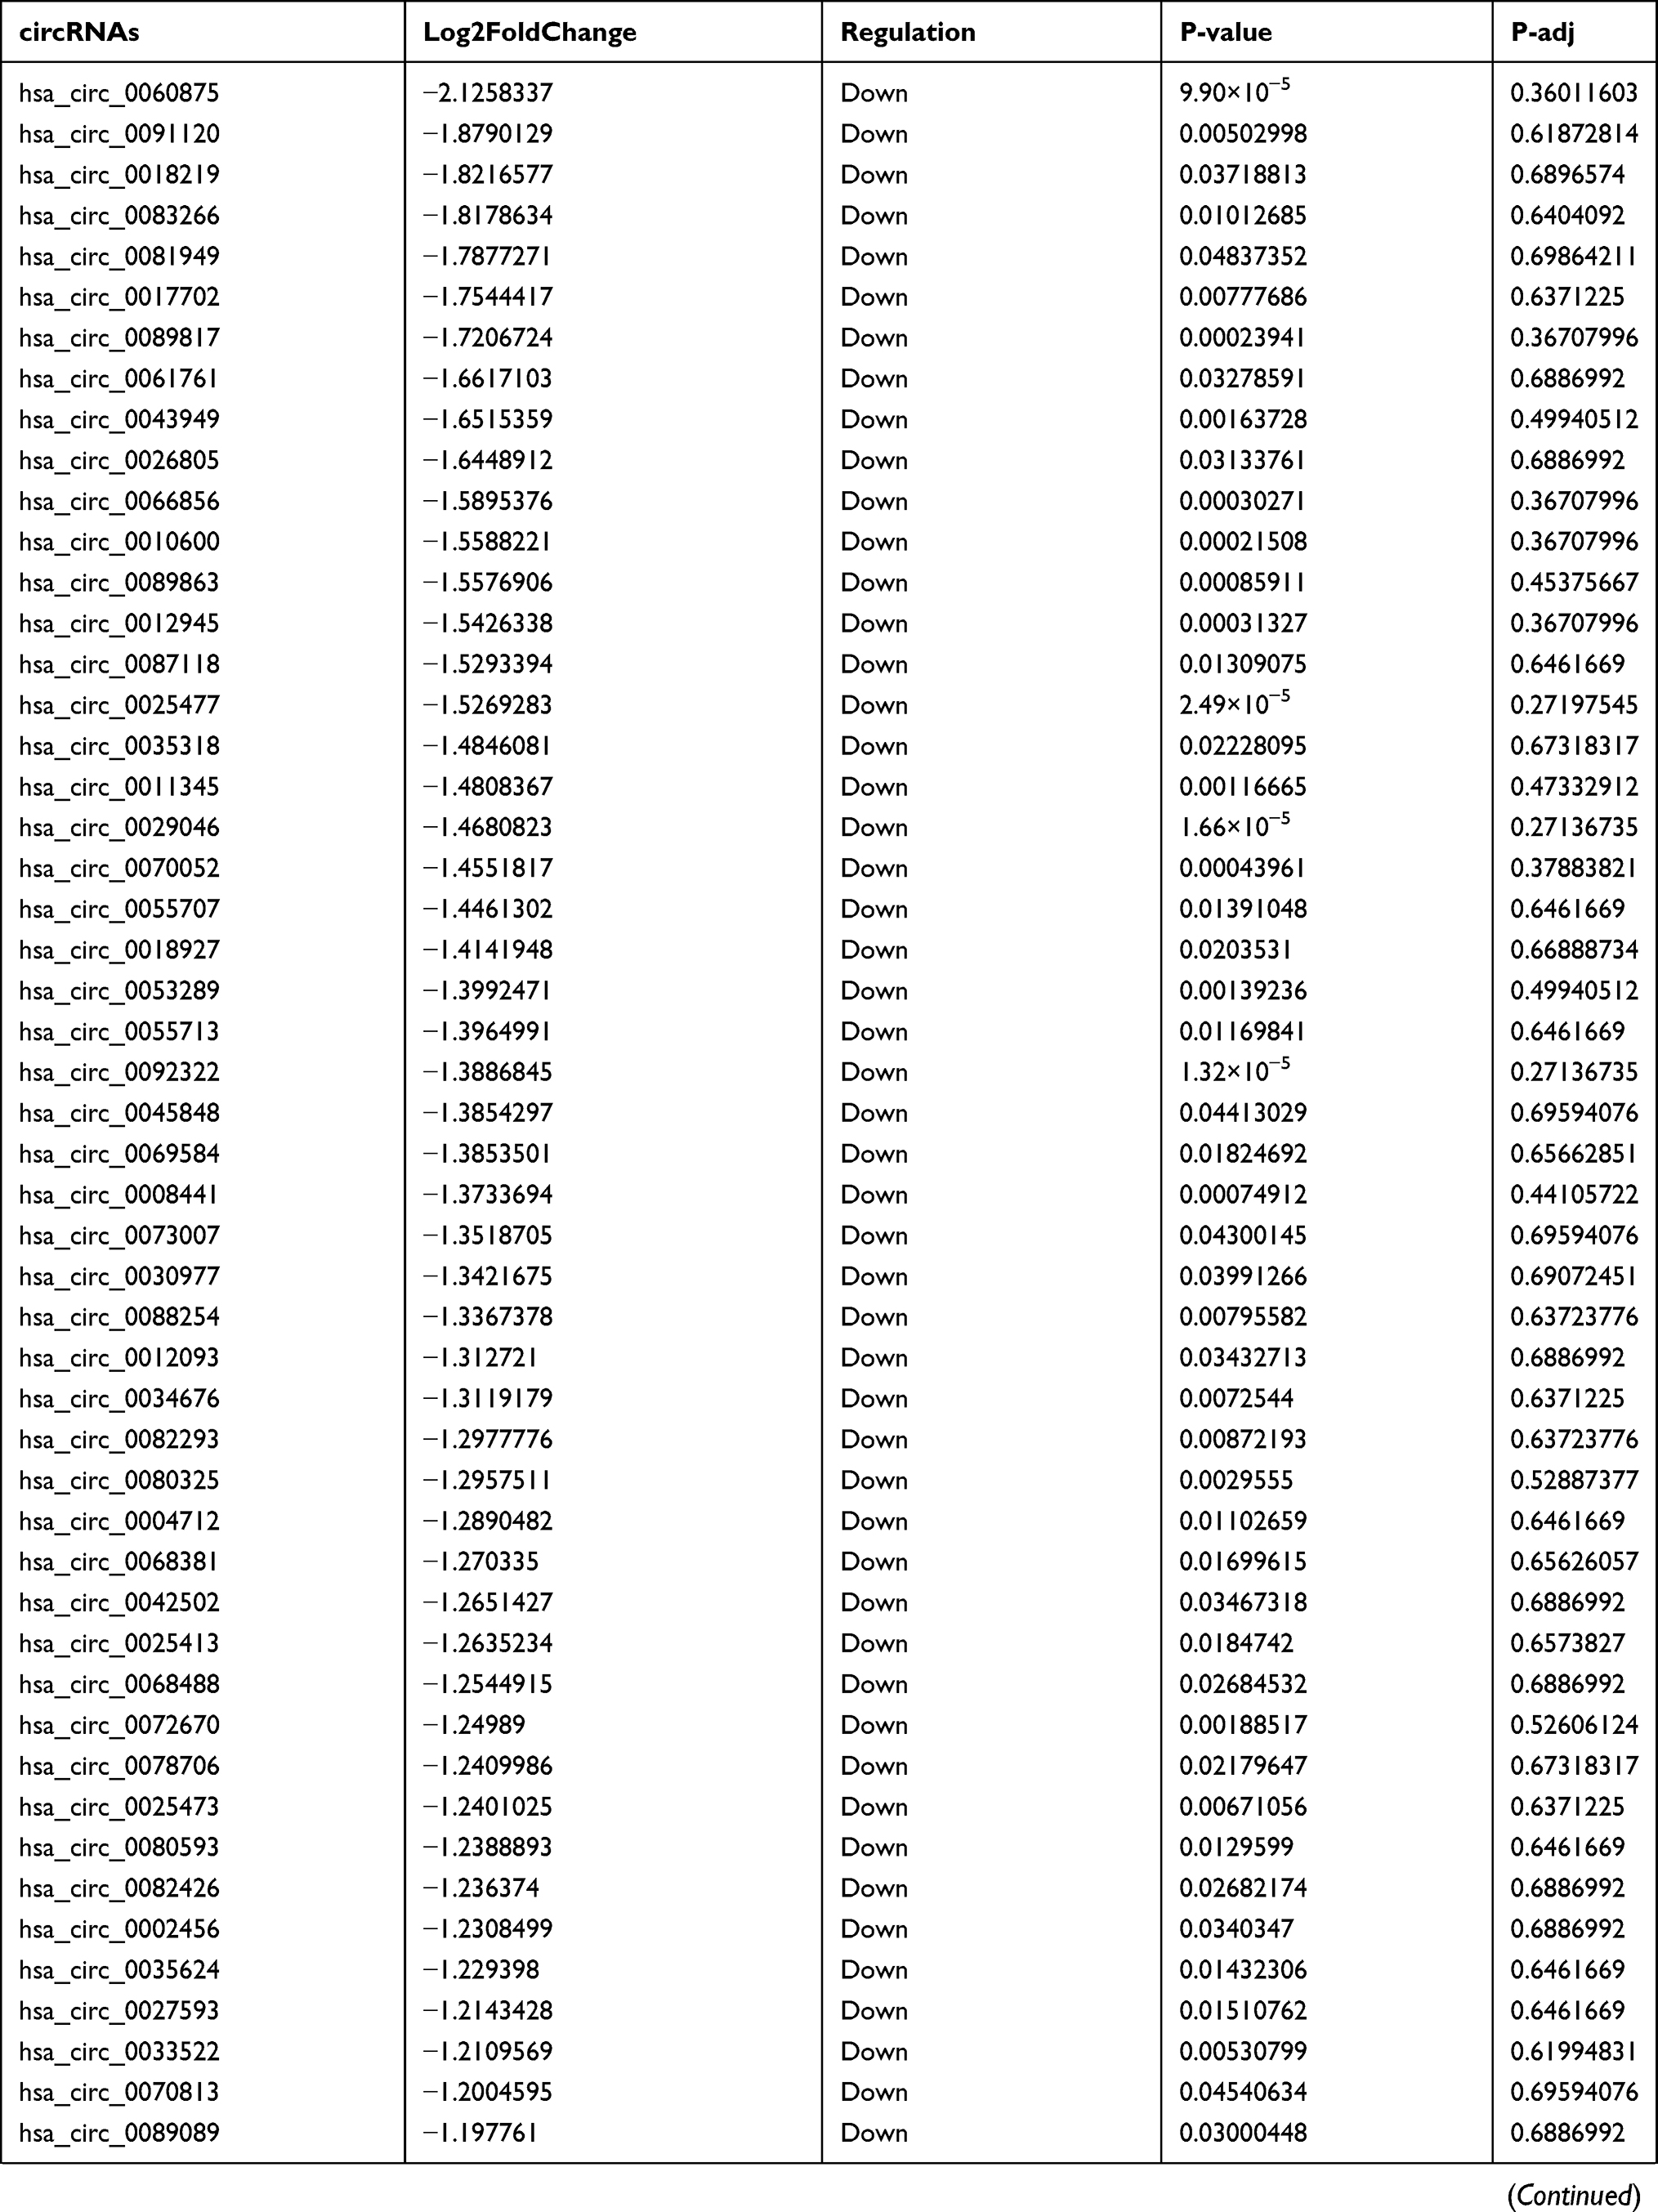
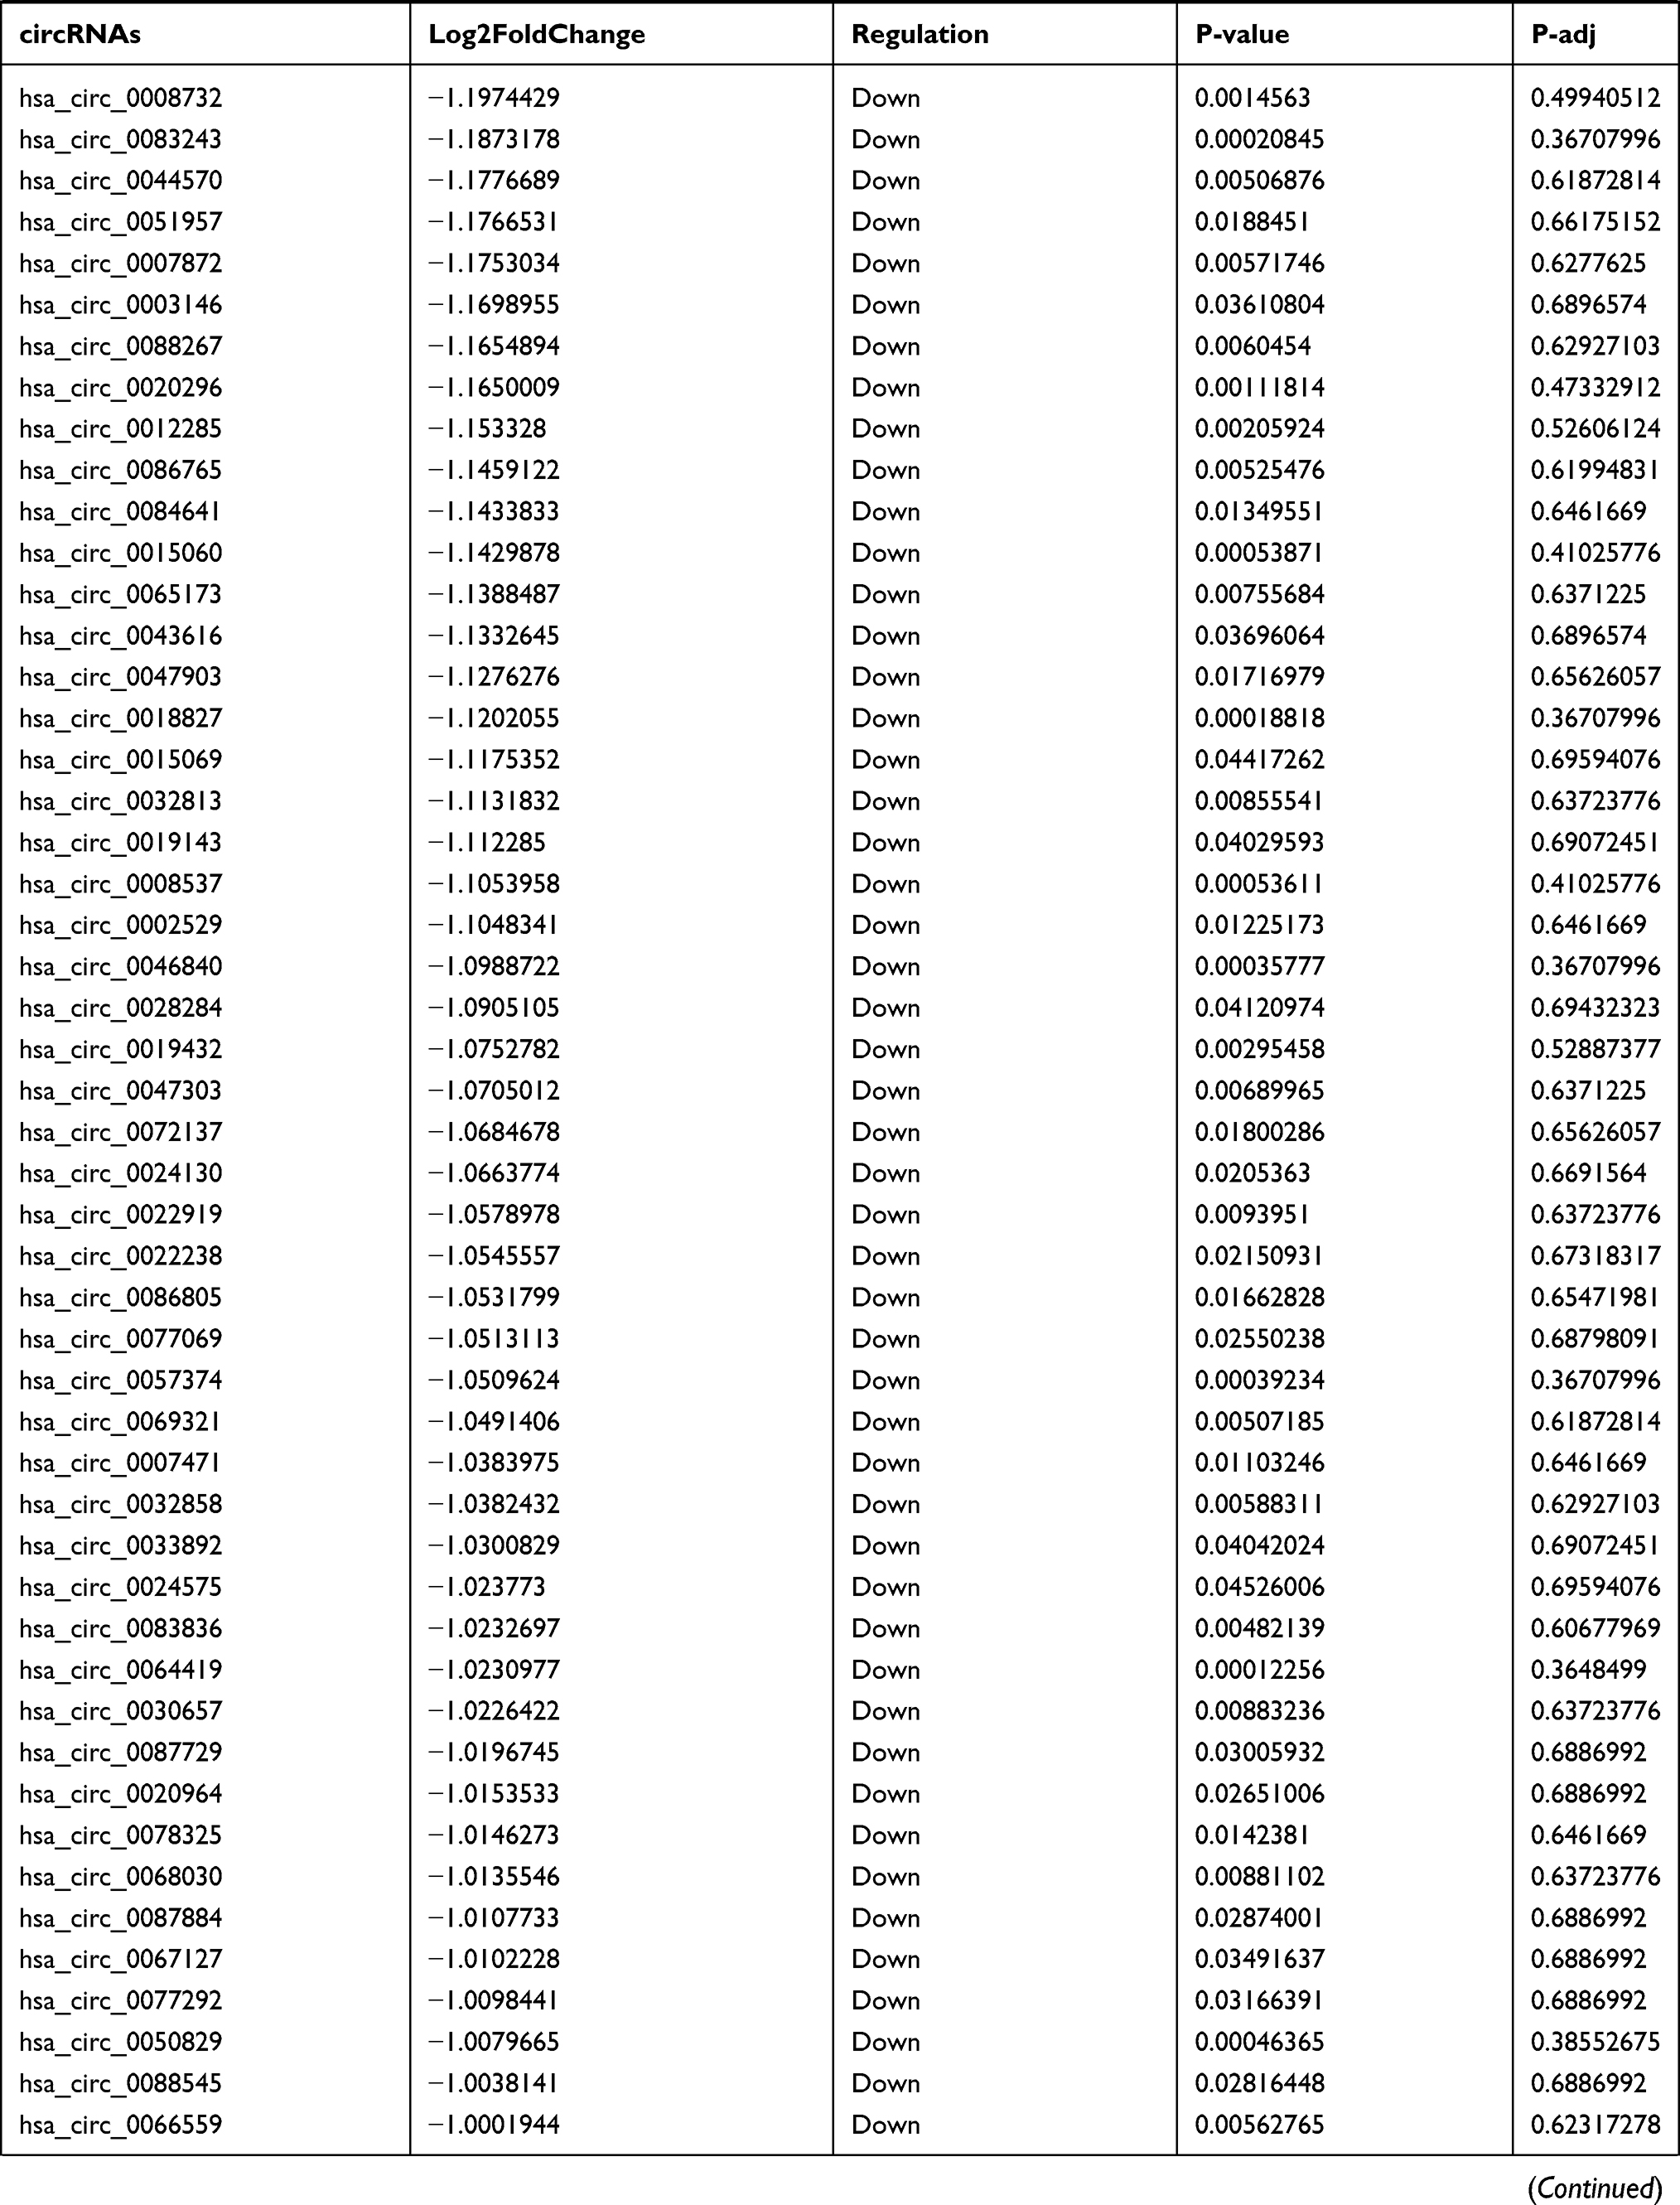
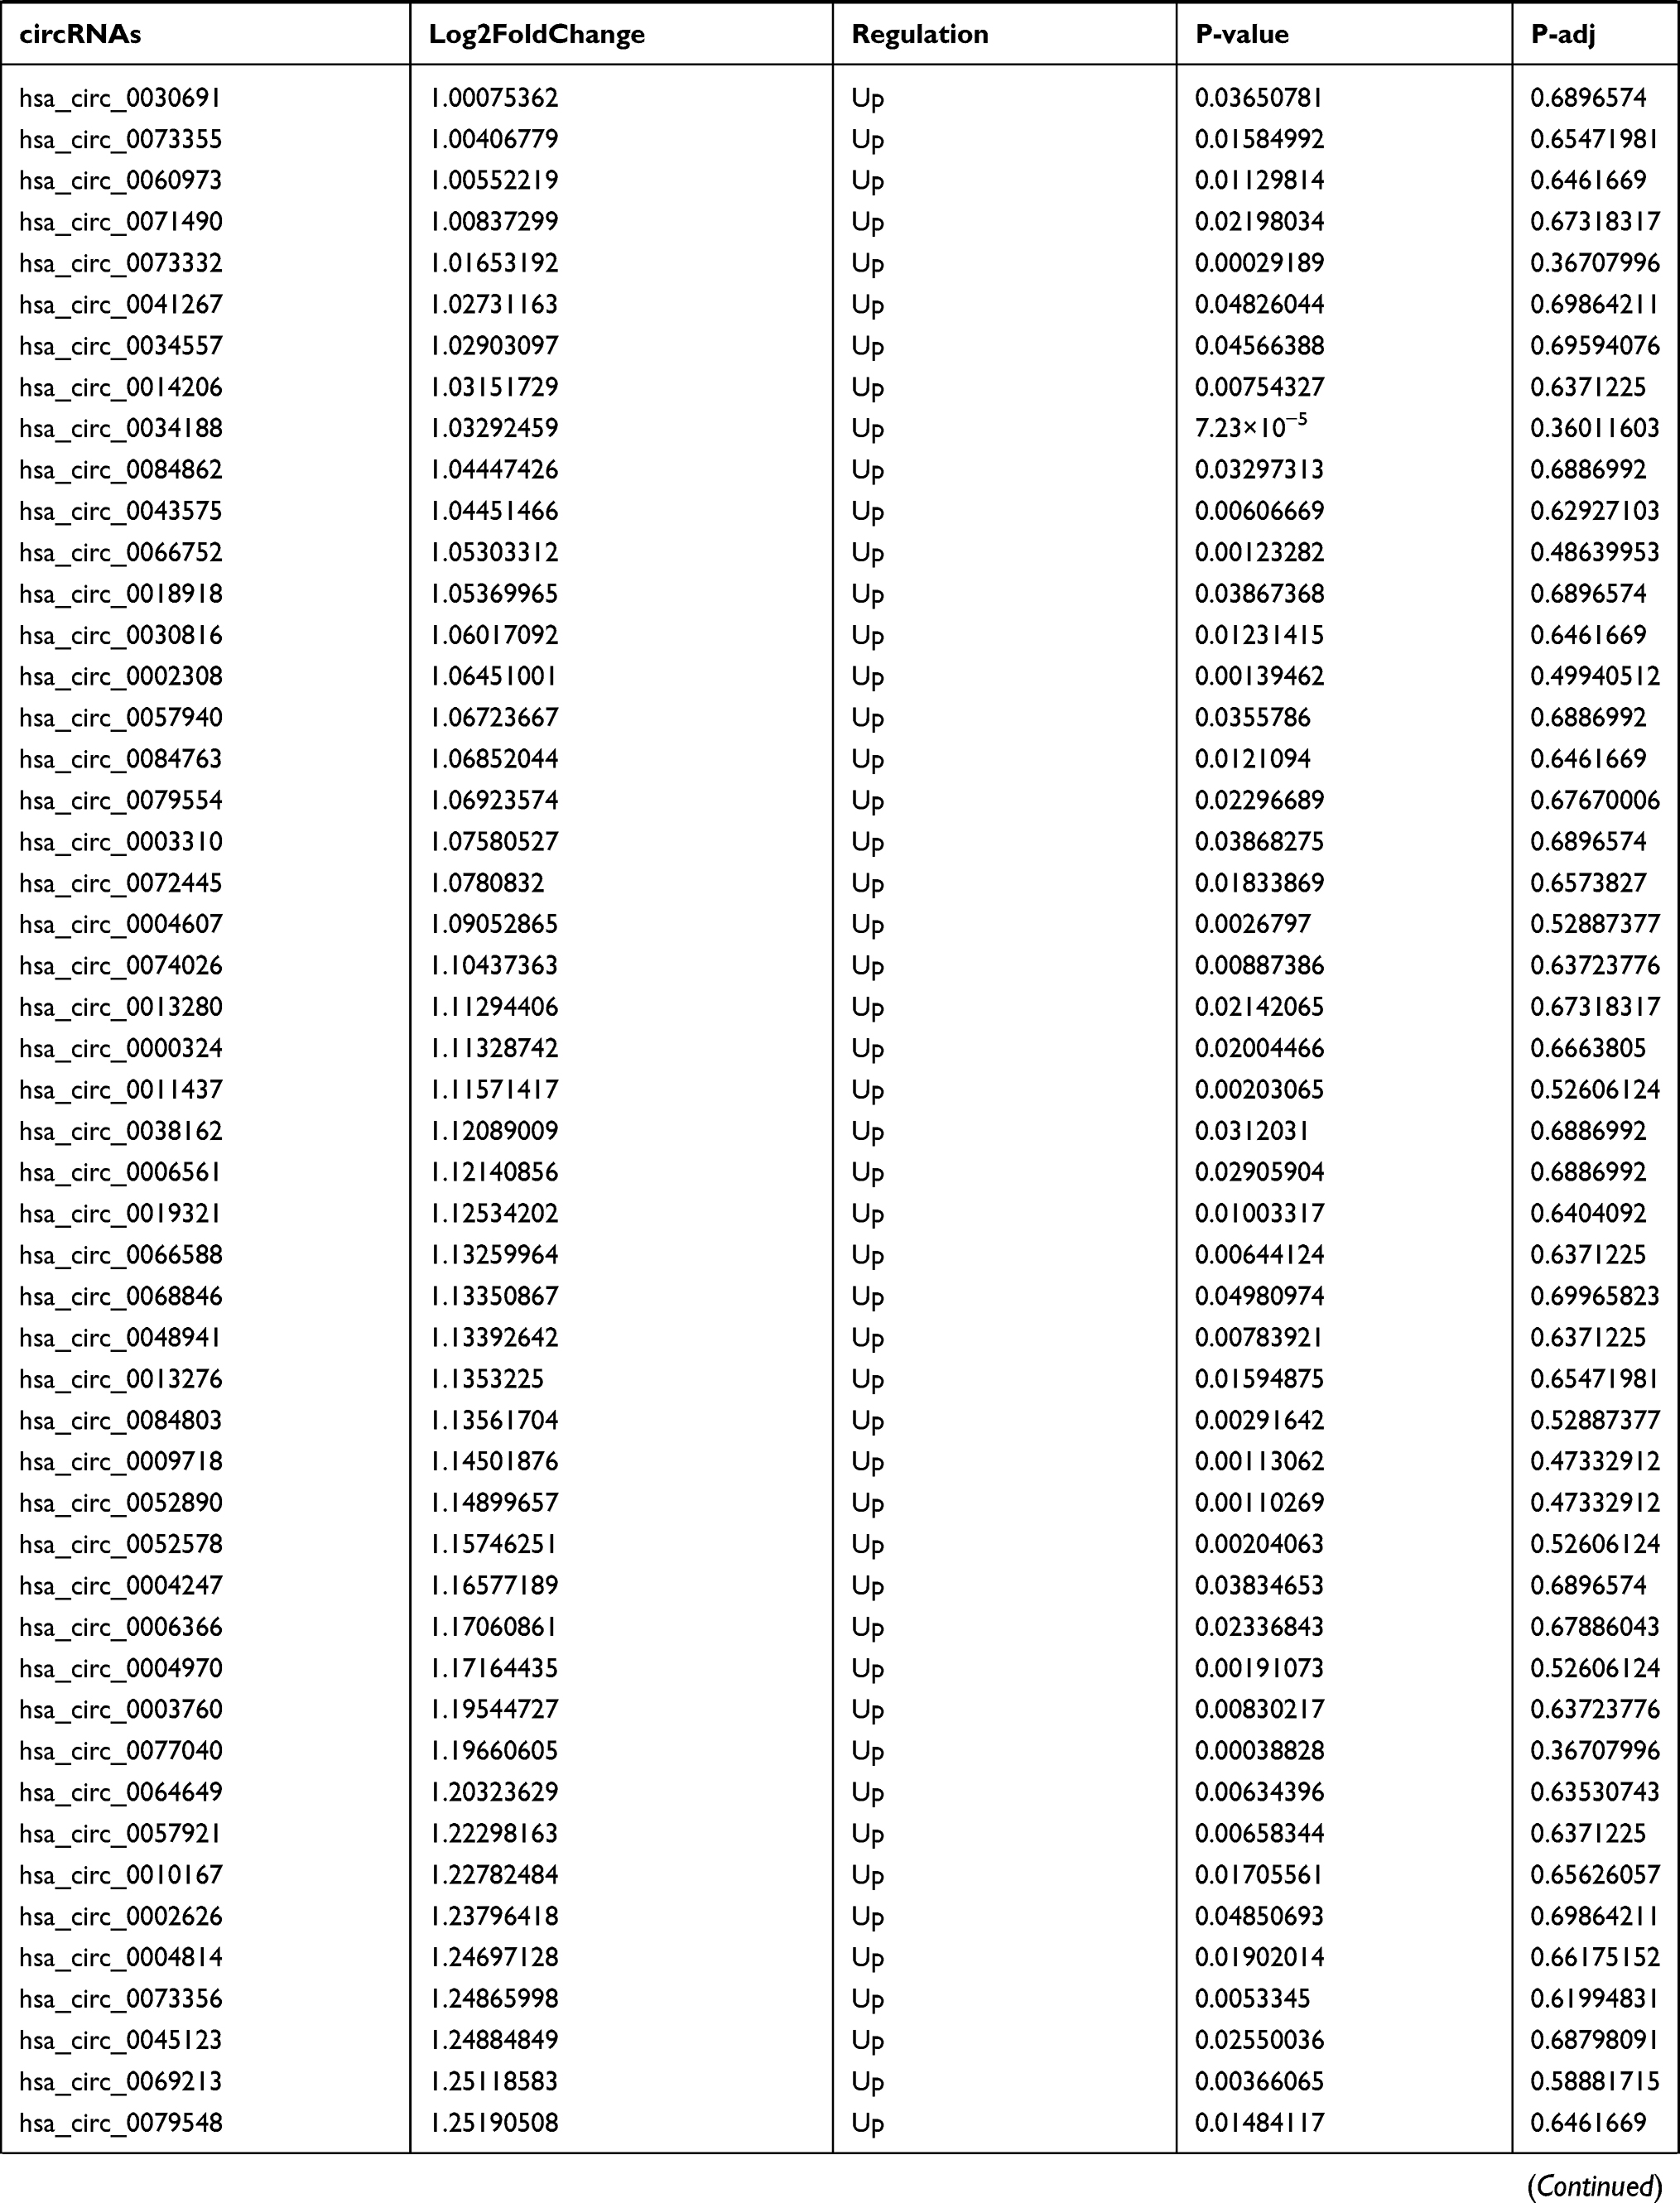
By analyzing the circRNA expression in microarray GSE133225 (Figure 2A and B), we identified 178 differentially expressed circRNAs (DEcircRNAs, 77 up-regulated and 101 down-regulated) (Table 2). We also analyzed the chromosomal positions of these DEcircRNAs, and the top 5 chromosomes are as follows: chr1 (18, 10.11%), chr2 (15, 8.43%), chr3 (12, 6.74%), chr7 (12, 6.74) %), chr10 (11, 6.18%). Functional enrichment analysis of DEcircRNAs was performed using the “clusterProfiler” tool. The results showed that the most significantly enriched GO terms were related to collagen fibril organization (GO: 0030199), membrane raft (GO: 0045121), and extracellular matrix structural constituent conferring tensile strength (GO: 0030020) (Figure 2C and Table 3). For the KEGG pathway analysis, the DEcircRNAs were enriched in protein digestion and absorption (hsa04974) (Table 4).
 | |
 | |
 | |
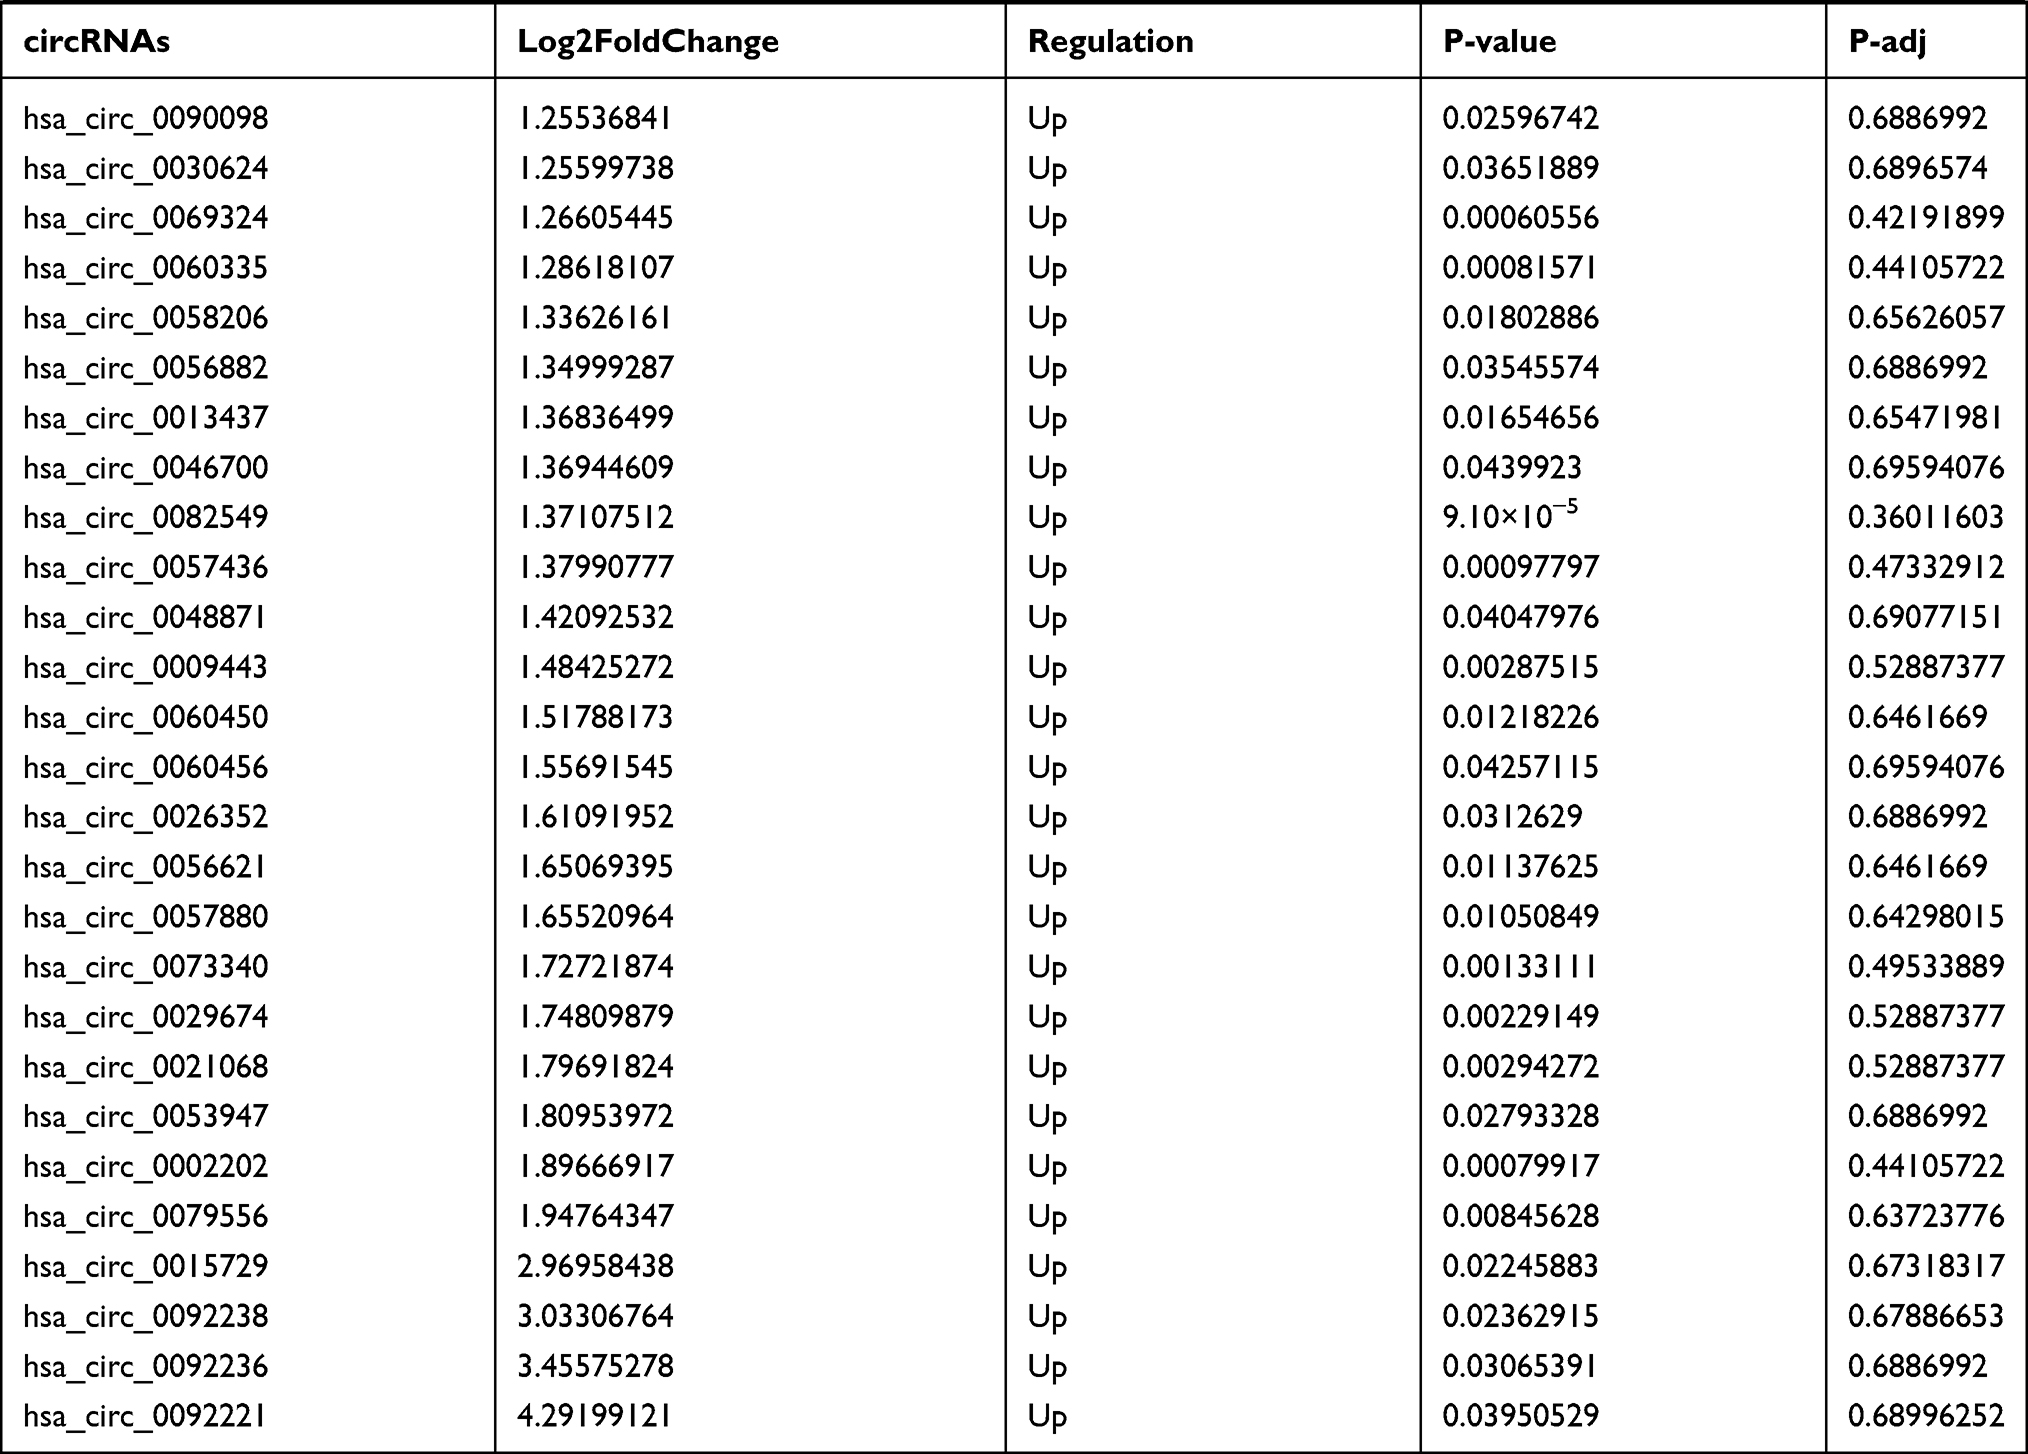 |
Table 2 Differentially Expressed circRNAs Between the Control Group and T1DM Group |
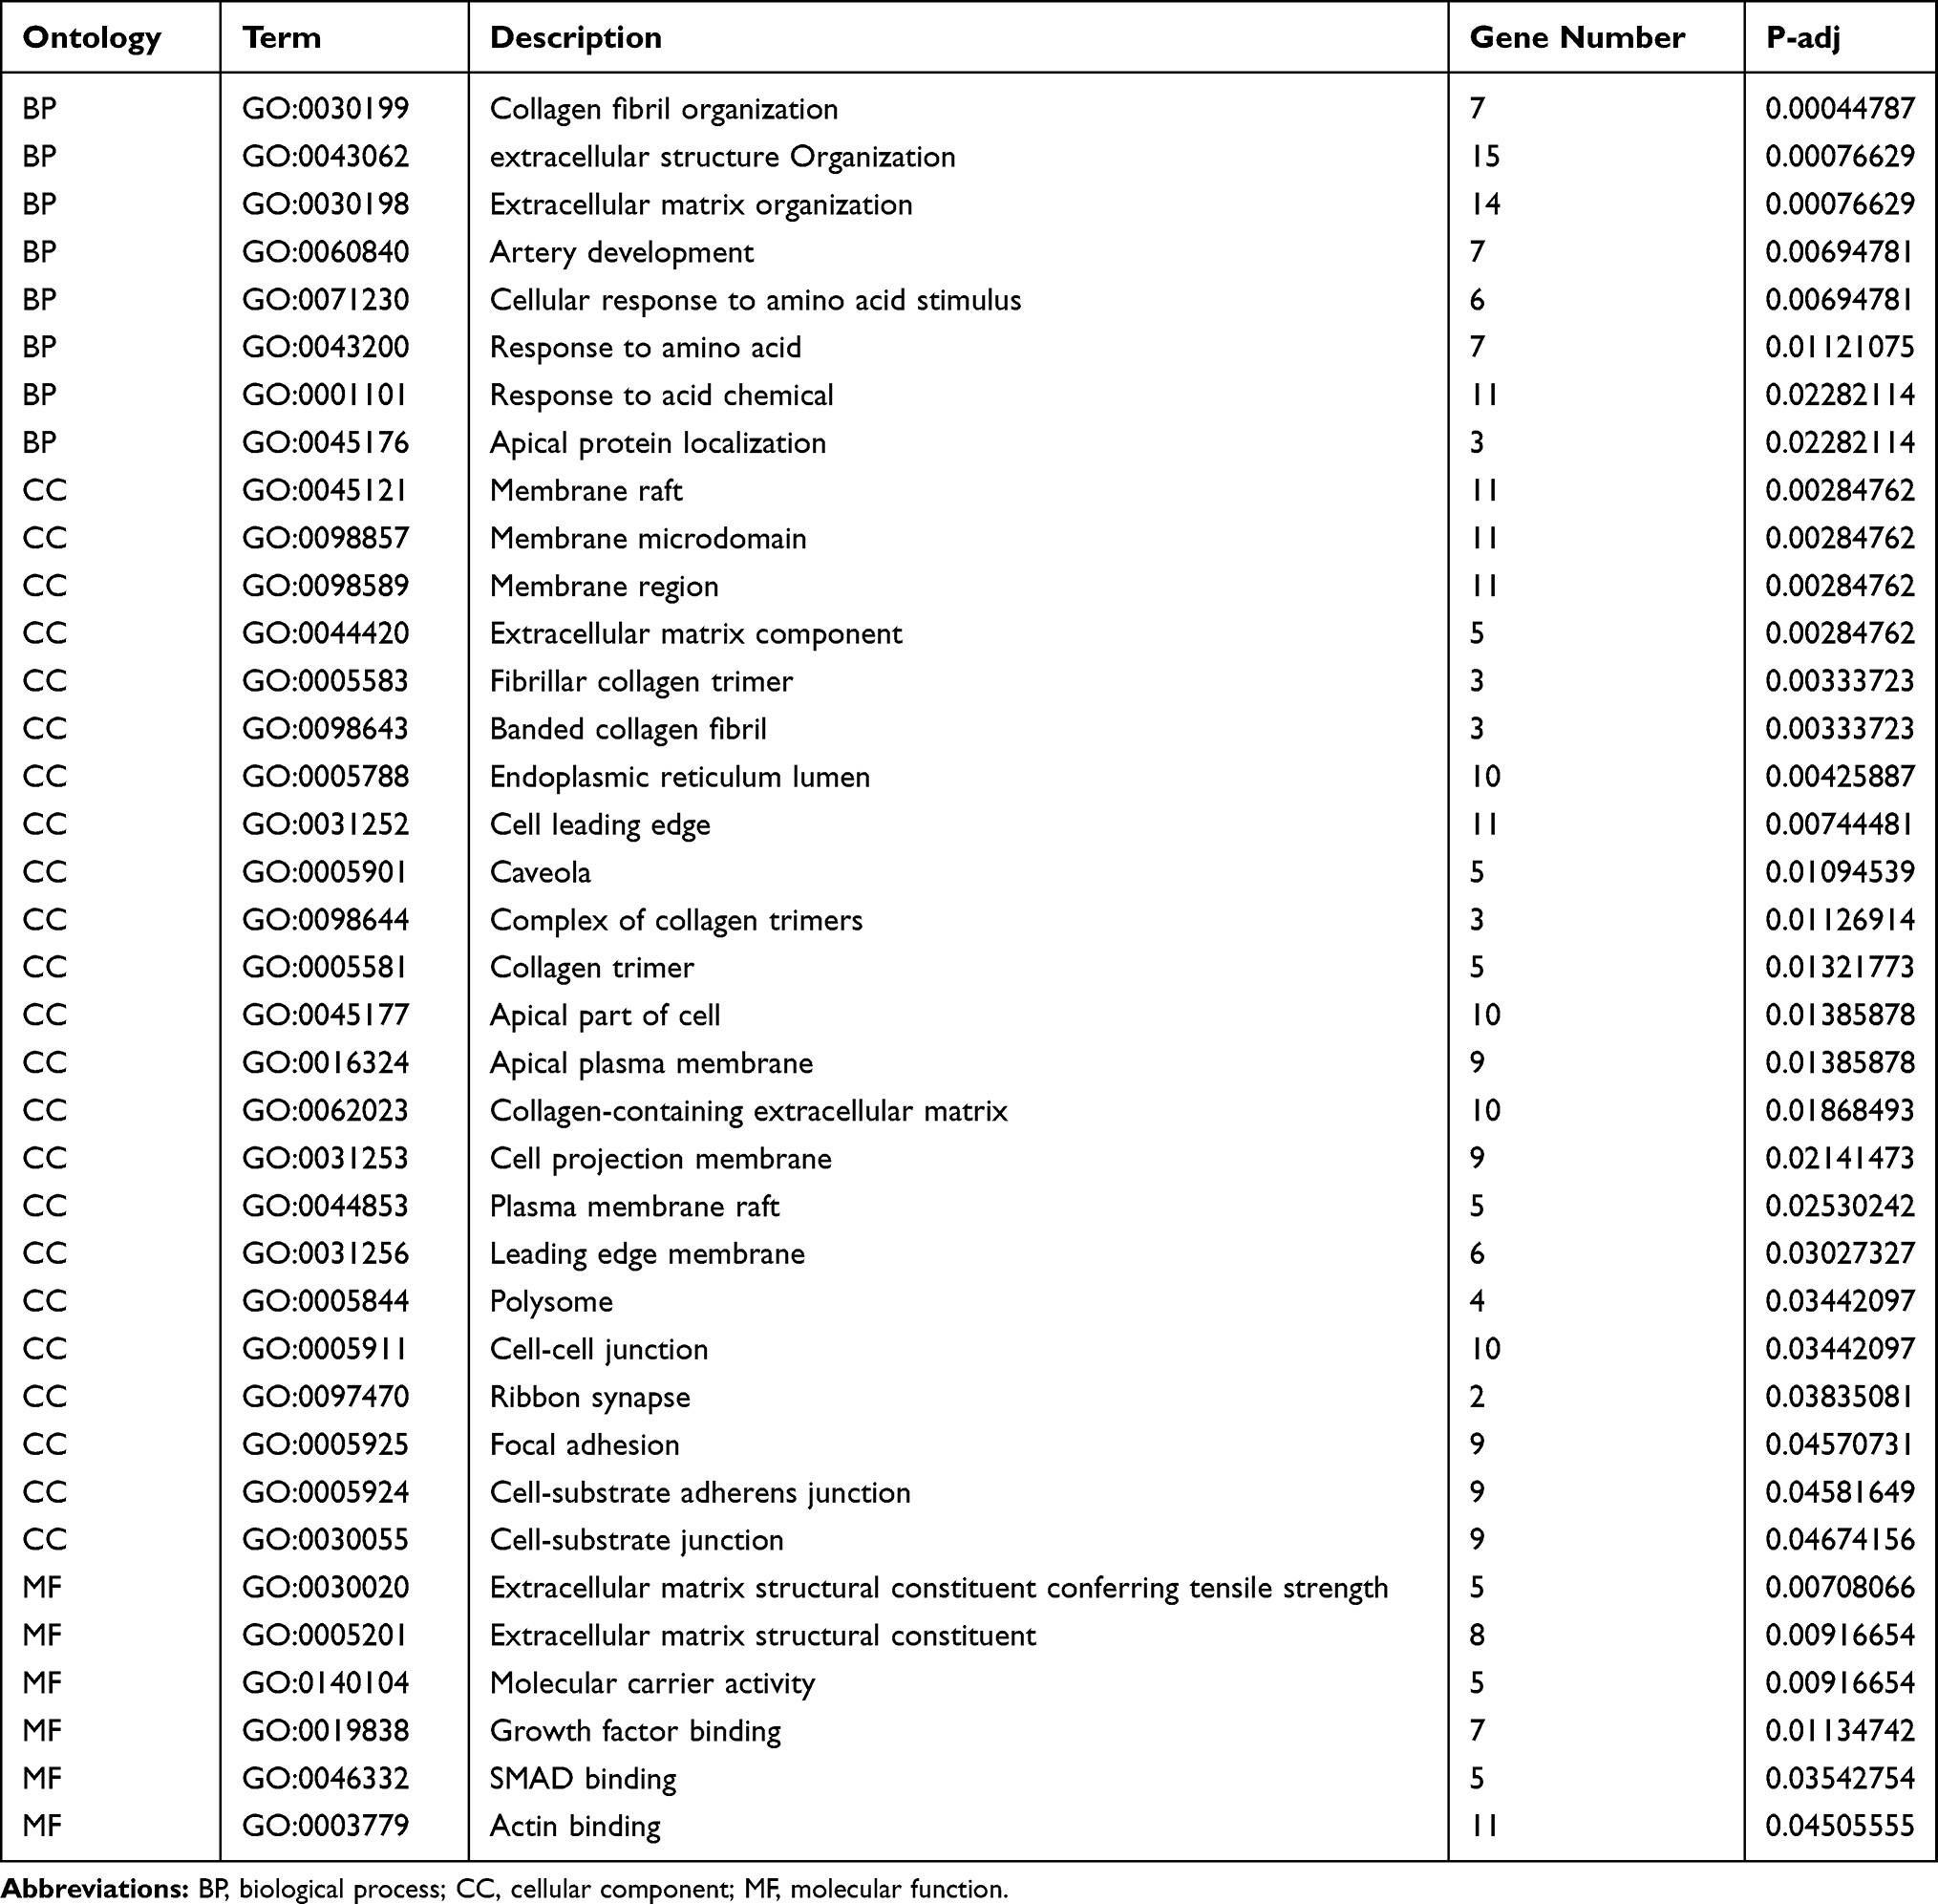 |
Table 3 Results of Gene Ontology (GO) Enrichment Analysis of Differentially Expressed circRNAs |
 |
Table 4 Results of KEGG Enrichment Analysis of Differentially Expressed circRNAs |
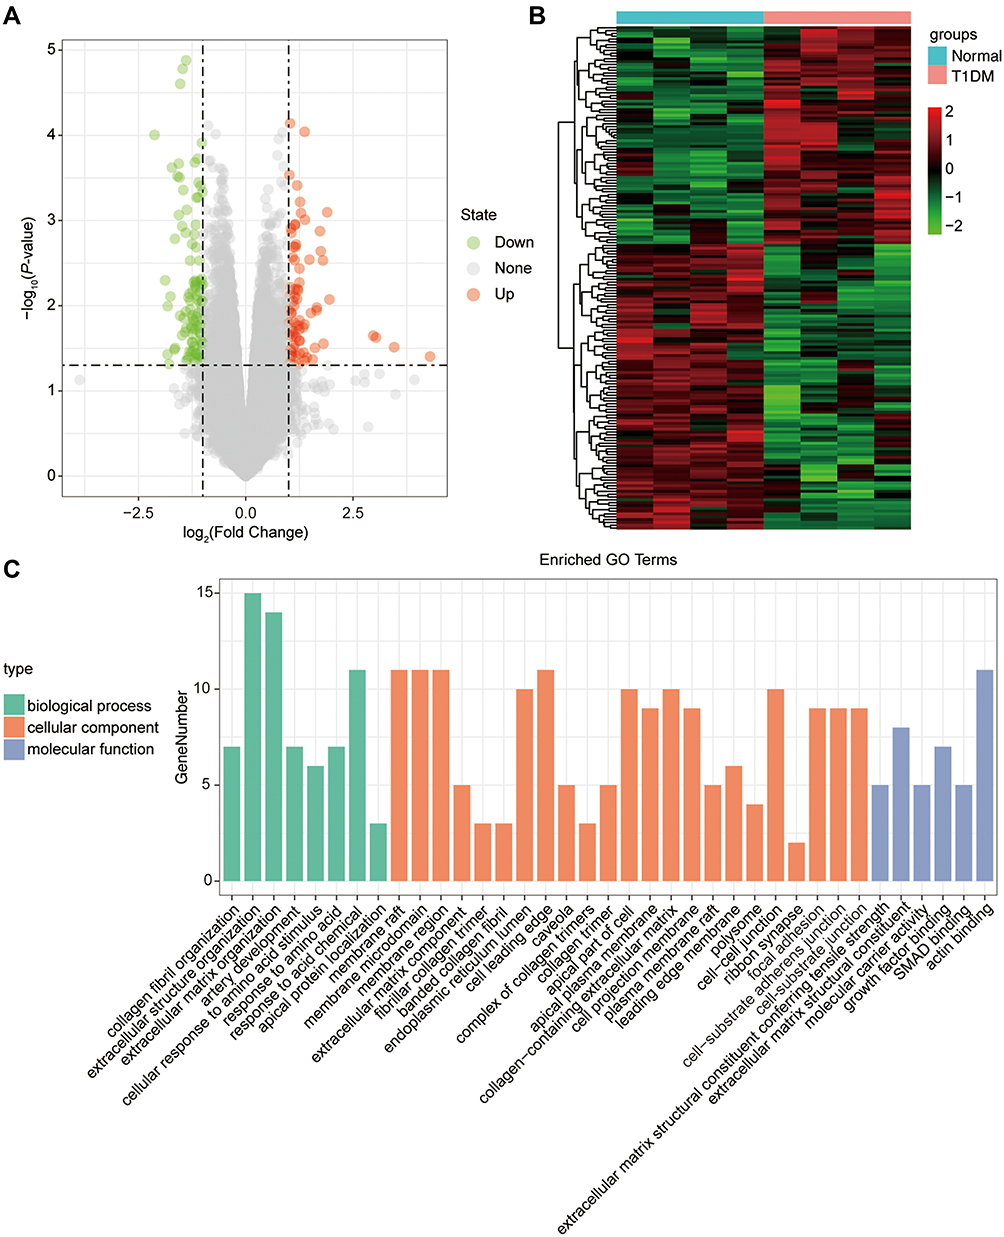 |
Figure 2 The differentially expressed circRNAs in T1DM and healthy patients. (A) Volcano plot of DEcircRNAs between normal and T1DM groups. Red and green indicate up- and downregulation, respectively. (B) Heatmap of DEcircRNAs between normal and T1DM groups. Red color represents increased expression, and green color represents decreased expression. The darker the color, the greater the difference of circRNA expression. (C) Enrichment analysis of the DEcircRNAs in the categories biological process, cellular component, and molecular function. |
Identification of Differentially Expressed lncRNA in T1DM and Healthy Patients
Similarly, we analyzed the lncRNA expression with the microarray GSE133225. As shown in the volcano plot (Figure 3A) and heatmap (Figure 3B), 404 differentially expressed lncRNAs were screened (DElncRNAs, 199 up-regulated and 205 down-regulated) (Table 5). Meanwhile, the top 5 chromosomal positions of these DElncRNAs are as follows: chr1 (34, 8.42%), chr2 (29, 7.18%), chr17 (25, 6.19%), chr3 (25, 6.19%), chr10 (24, 5.94%). The GO enrichment analysis results showed that the DElncRNAs were enriched in macrophage activation (GO:0042116) and microvillus (GO:0005902) (Figure 3C and Table 6).
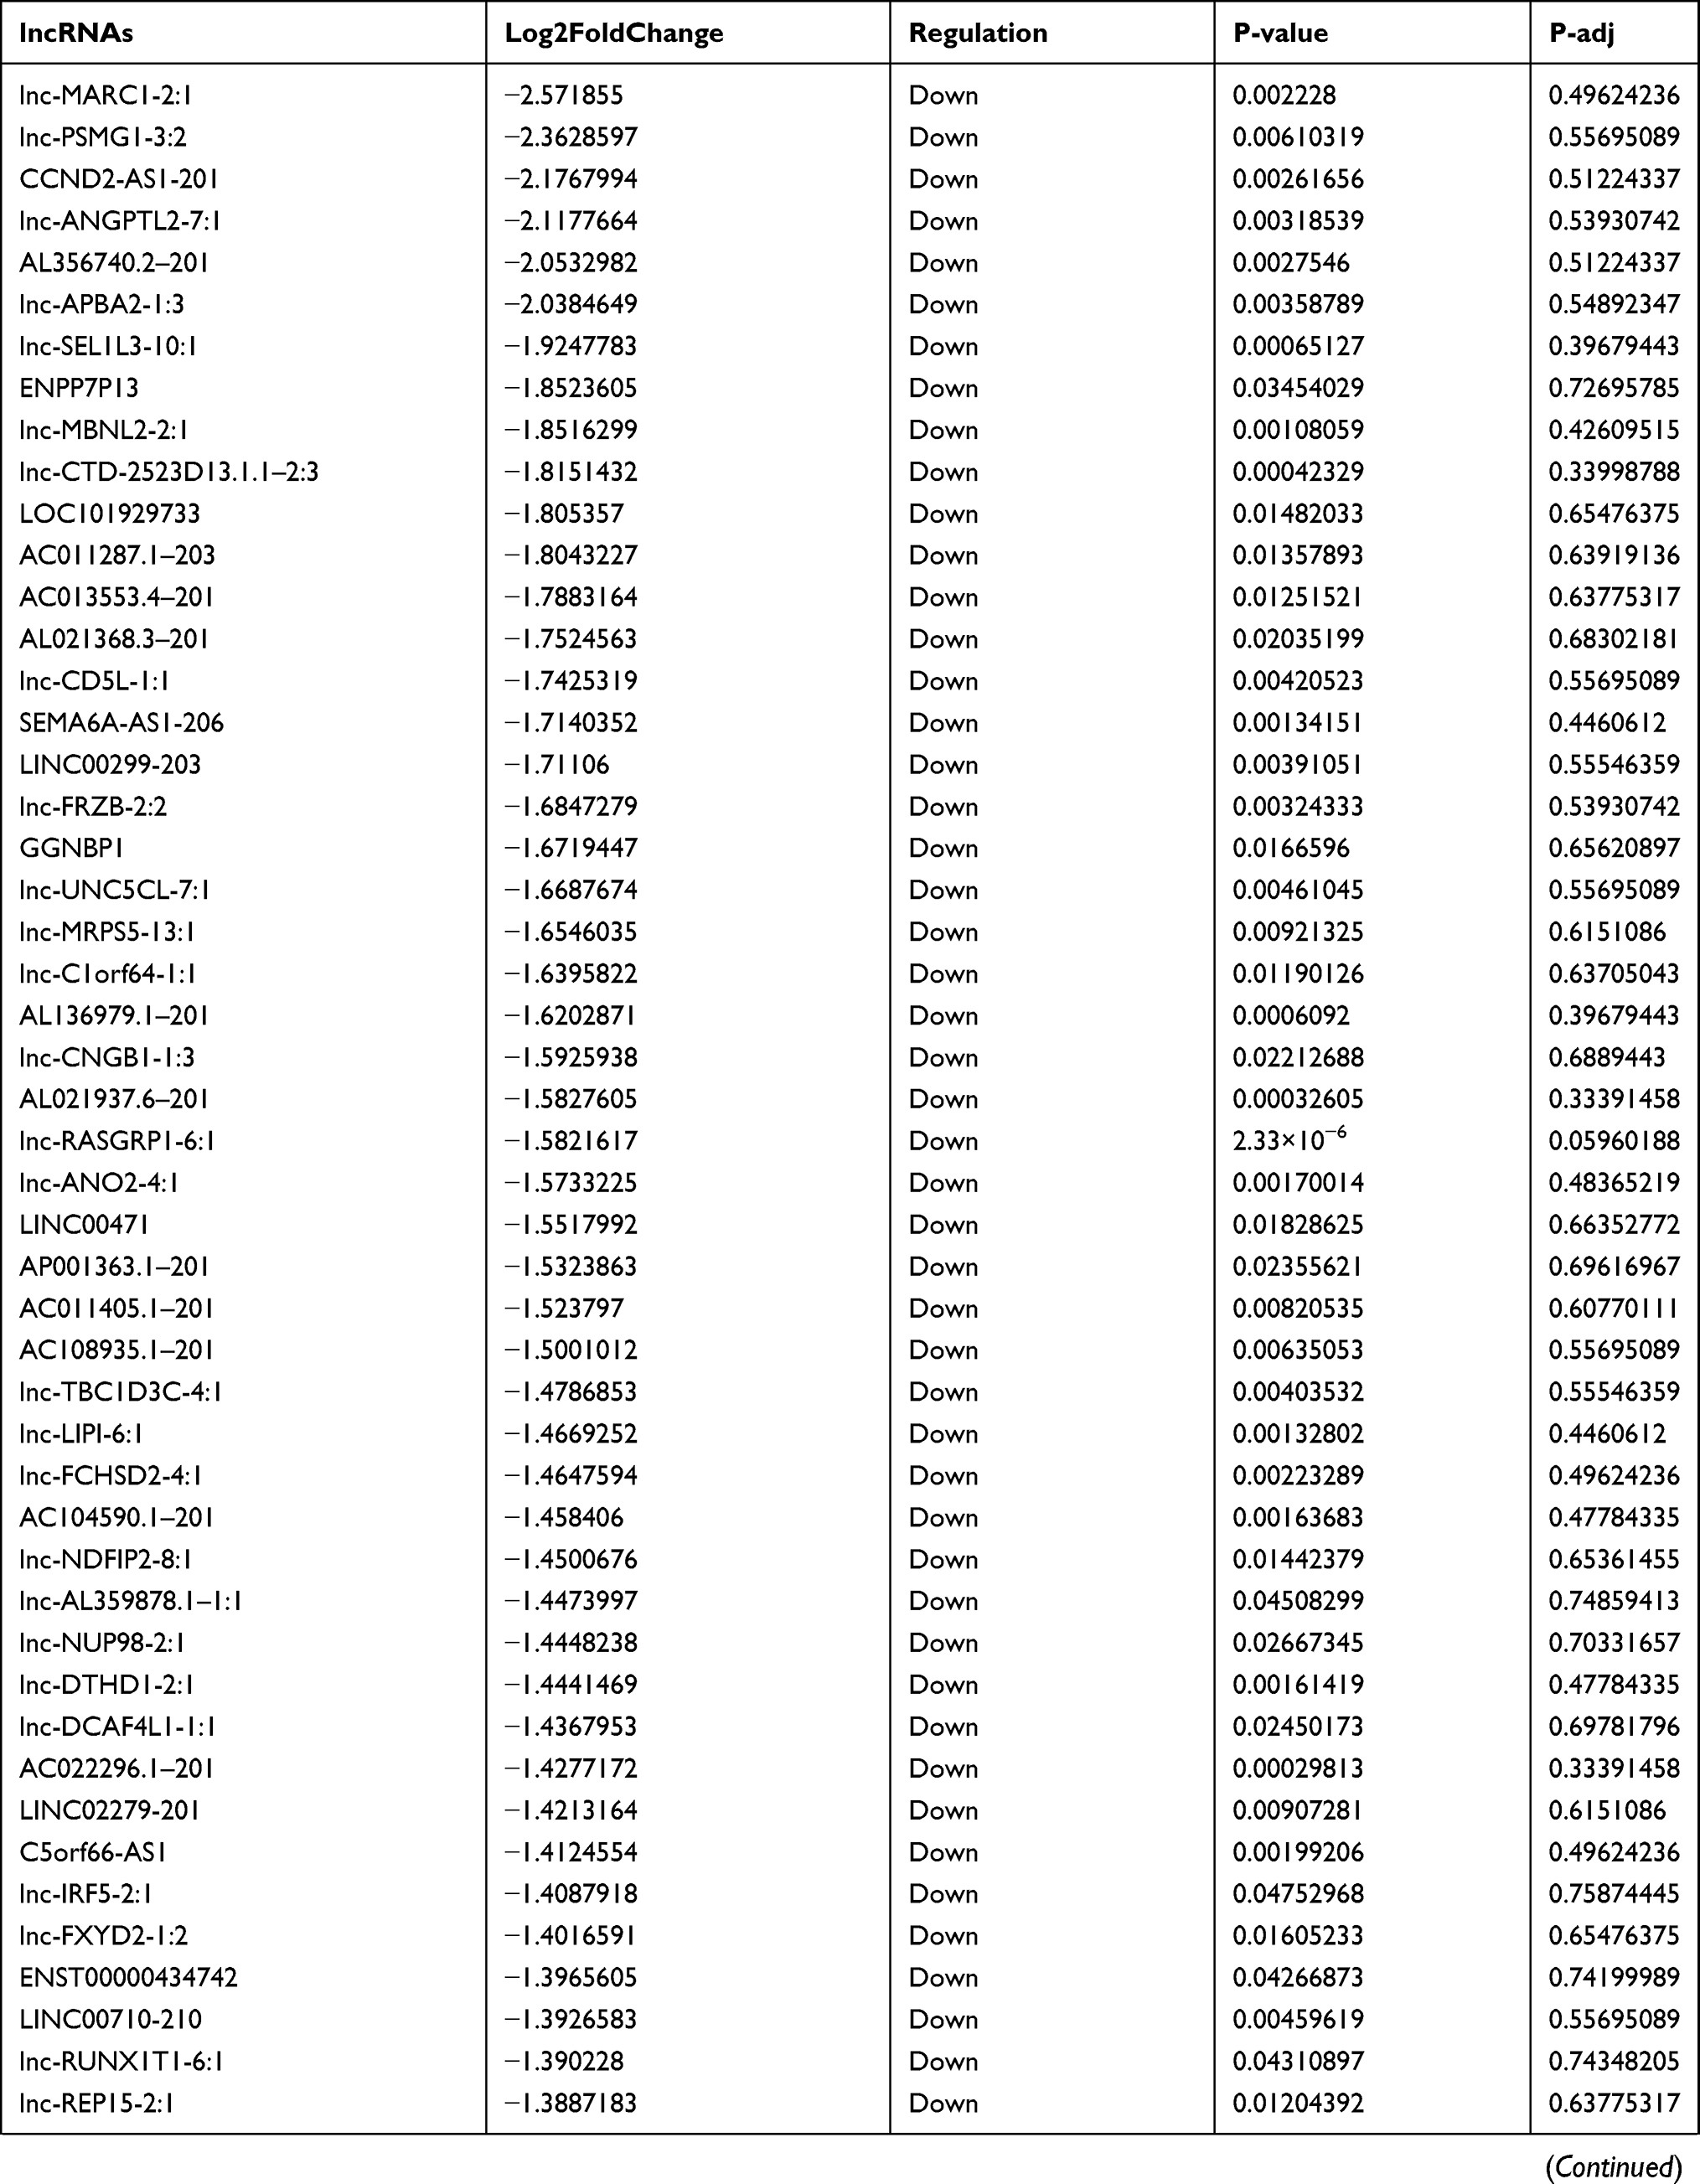 | 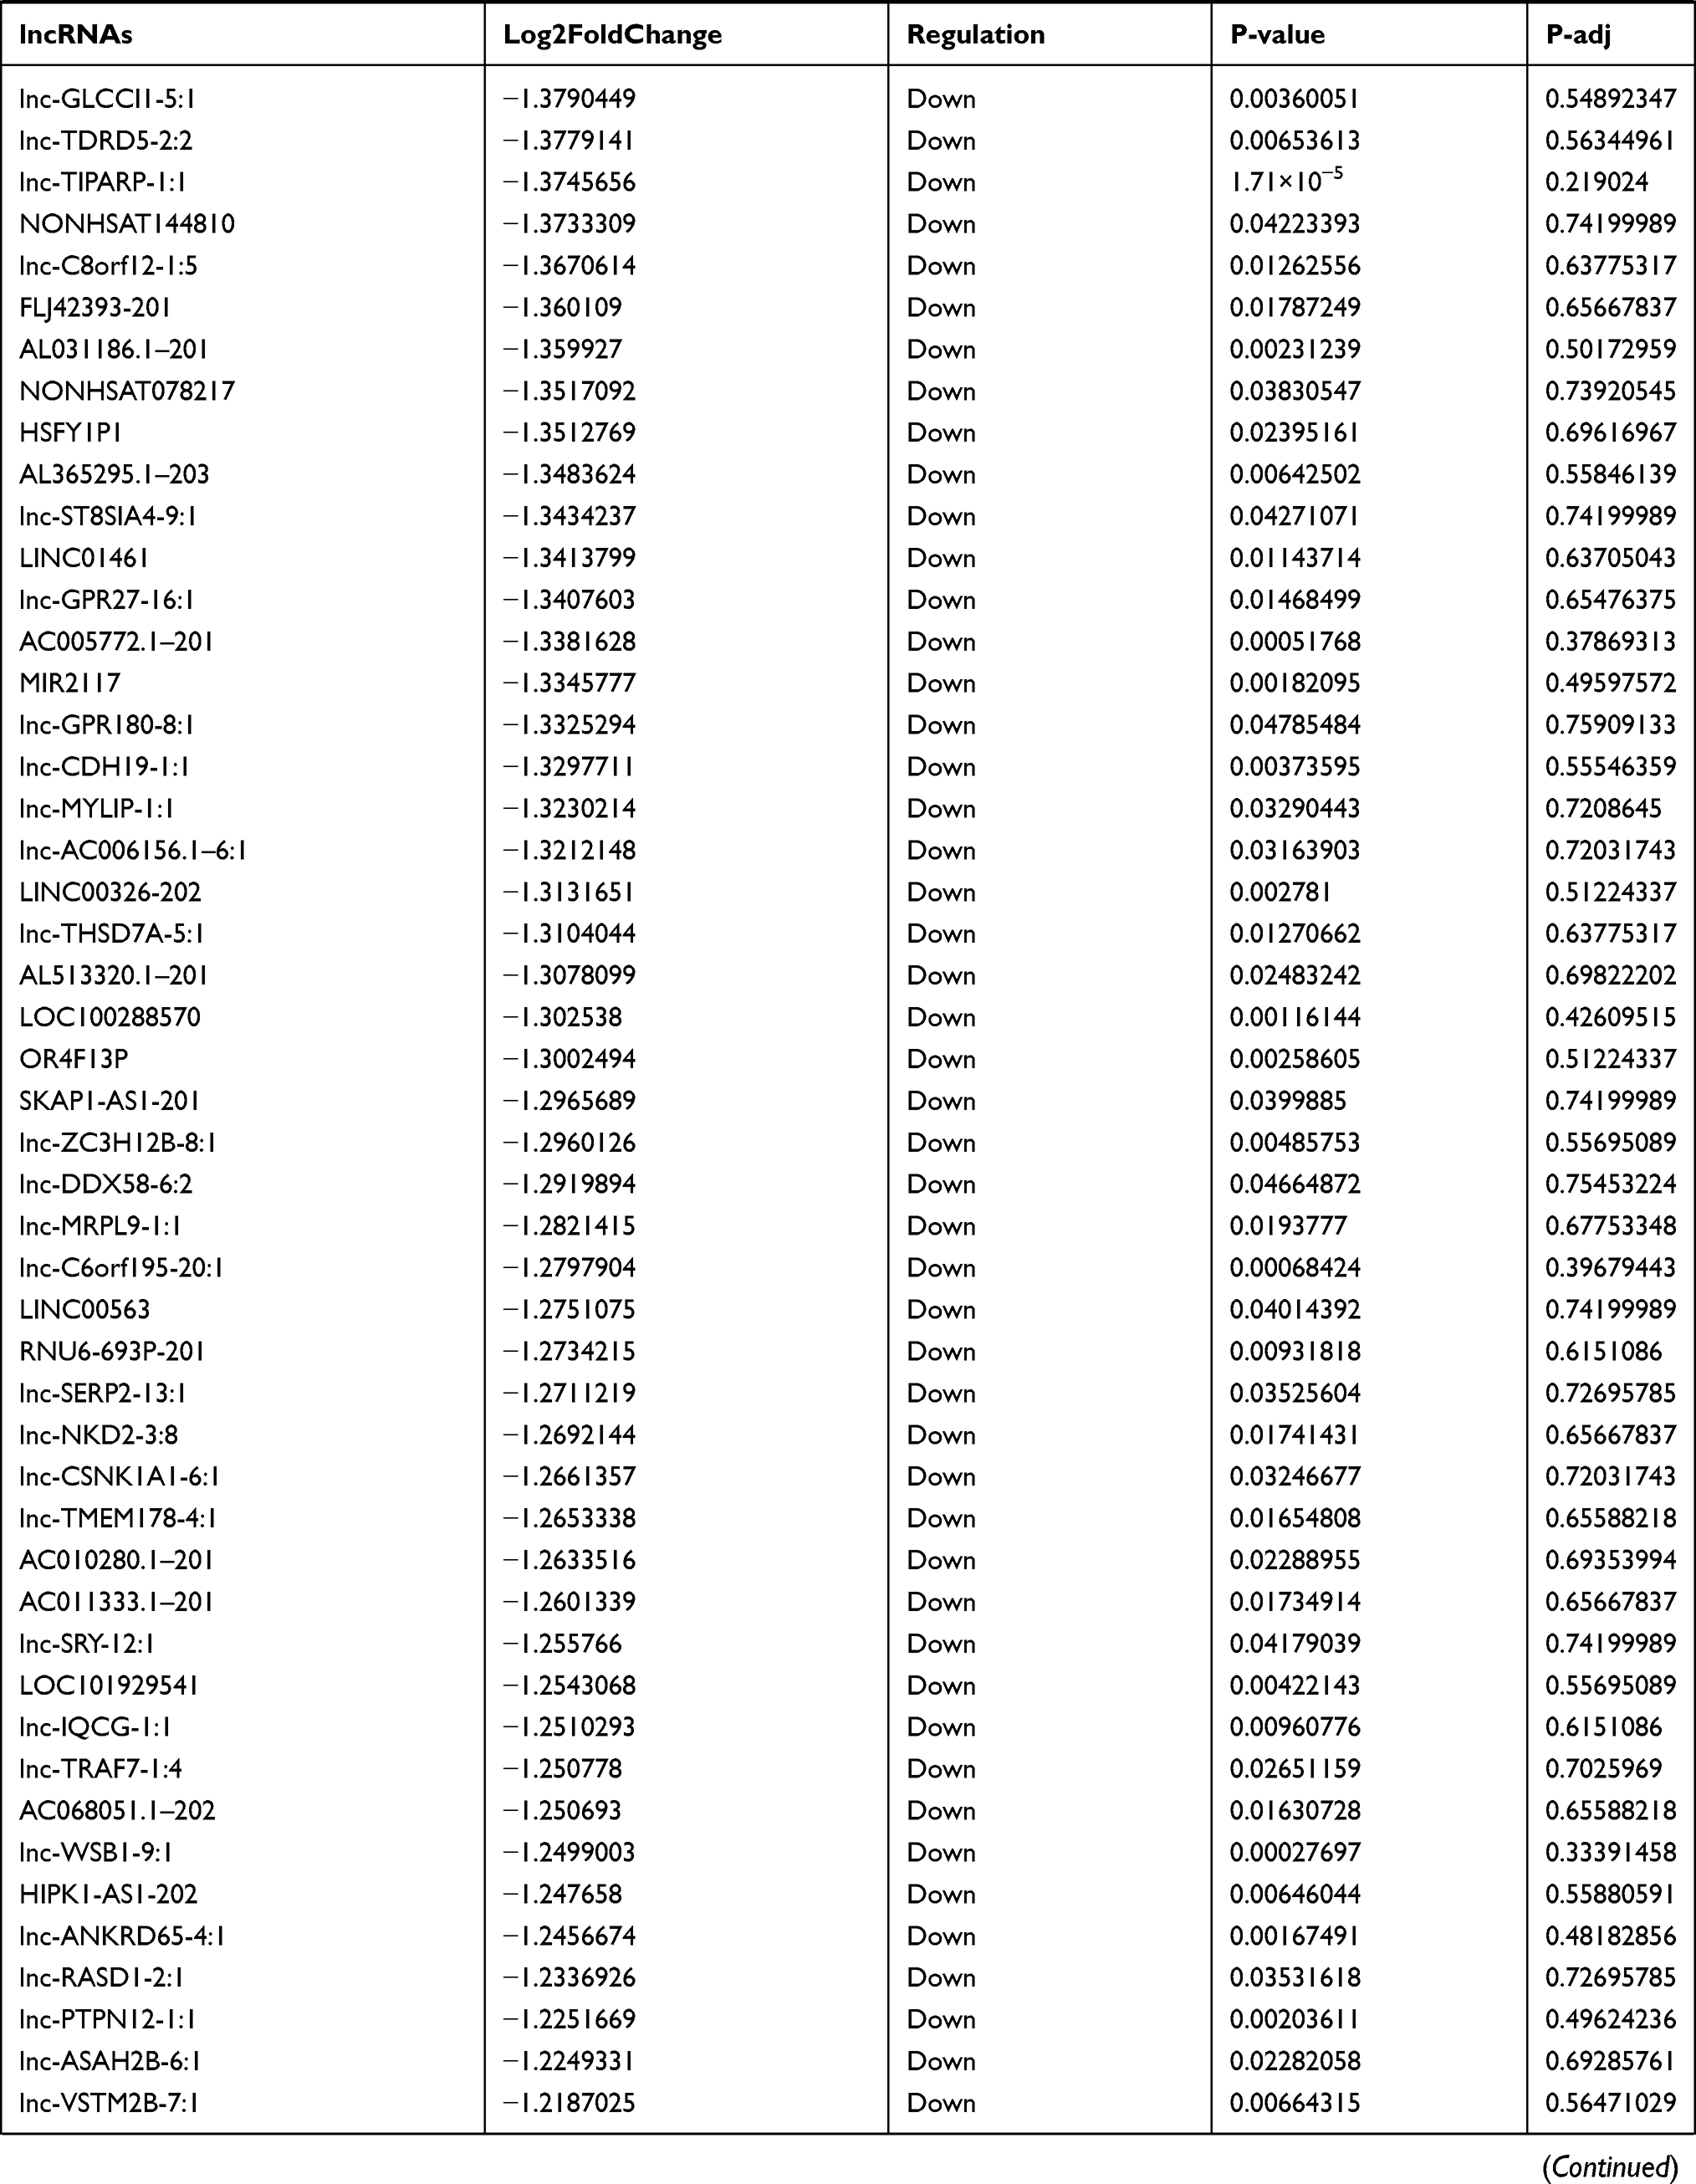 | 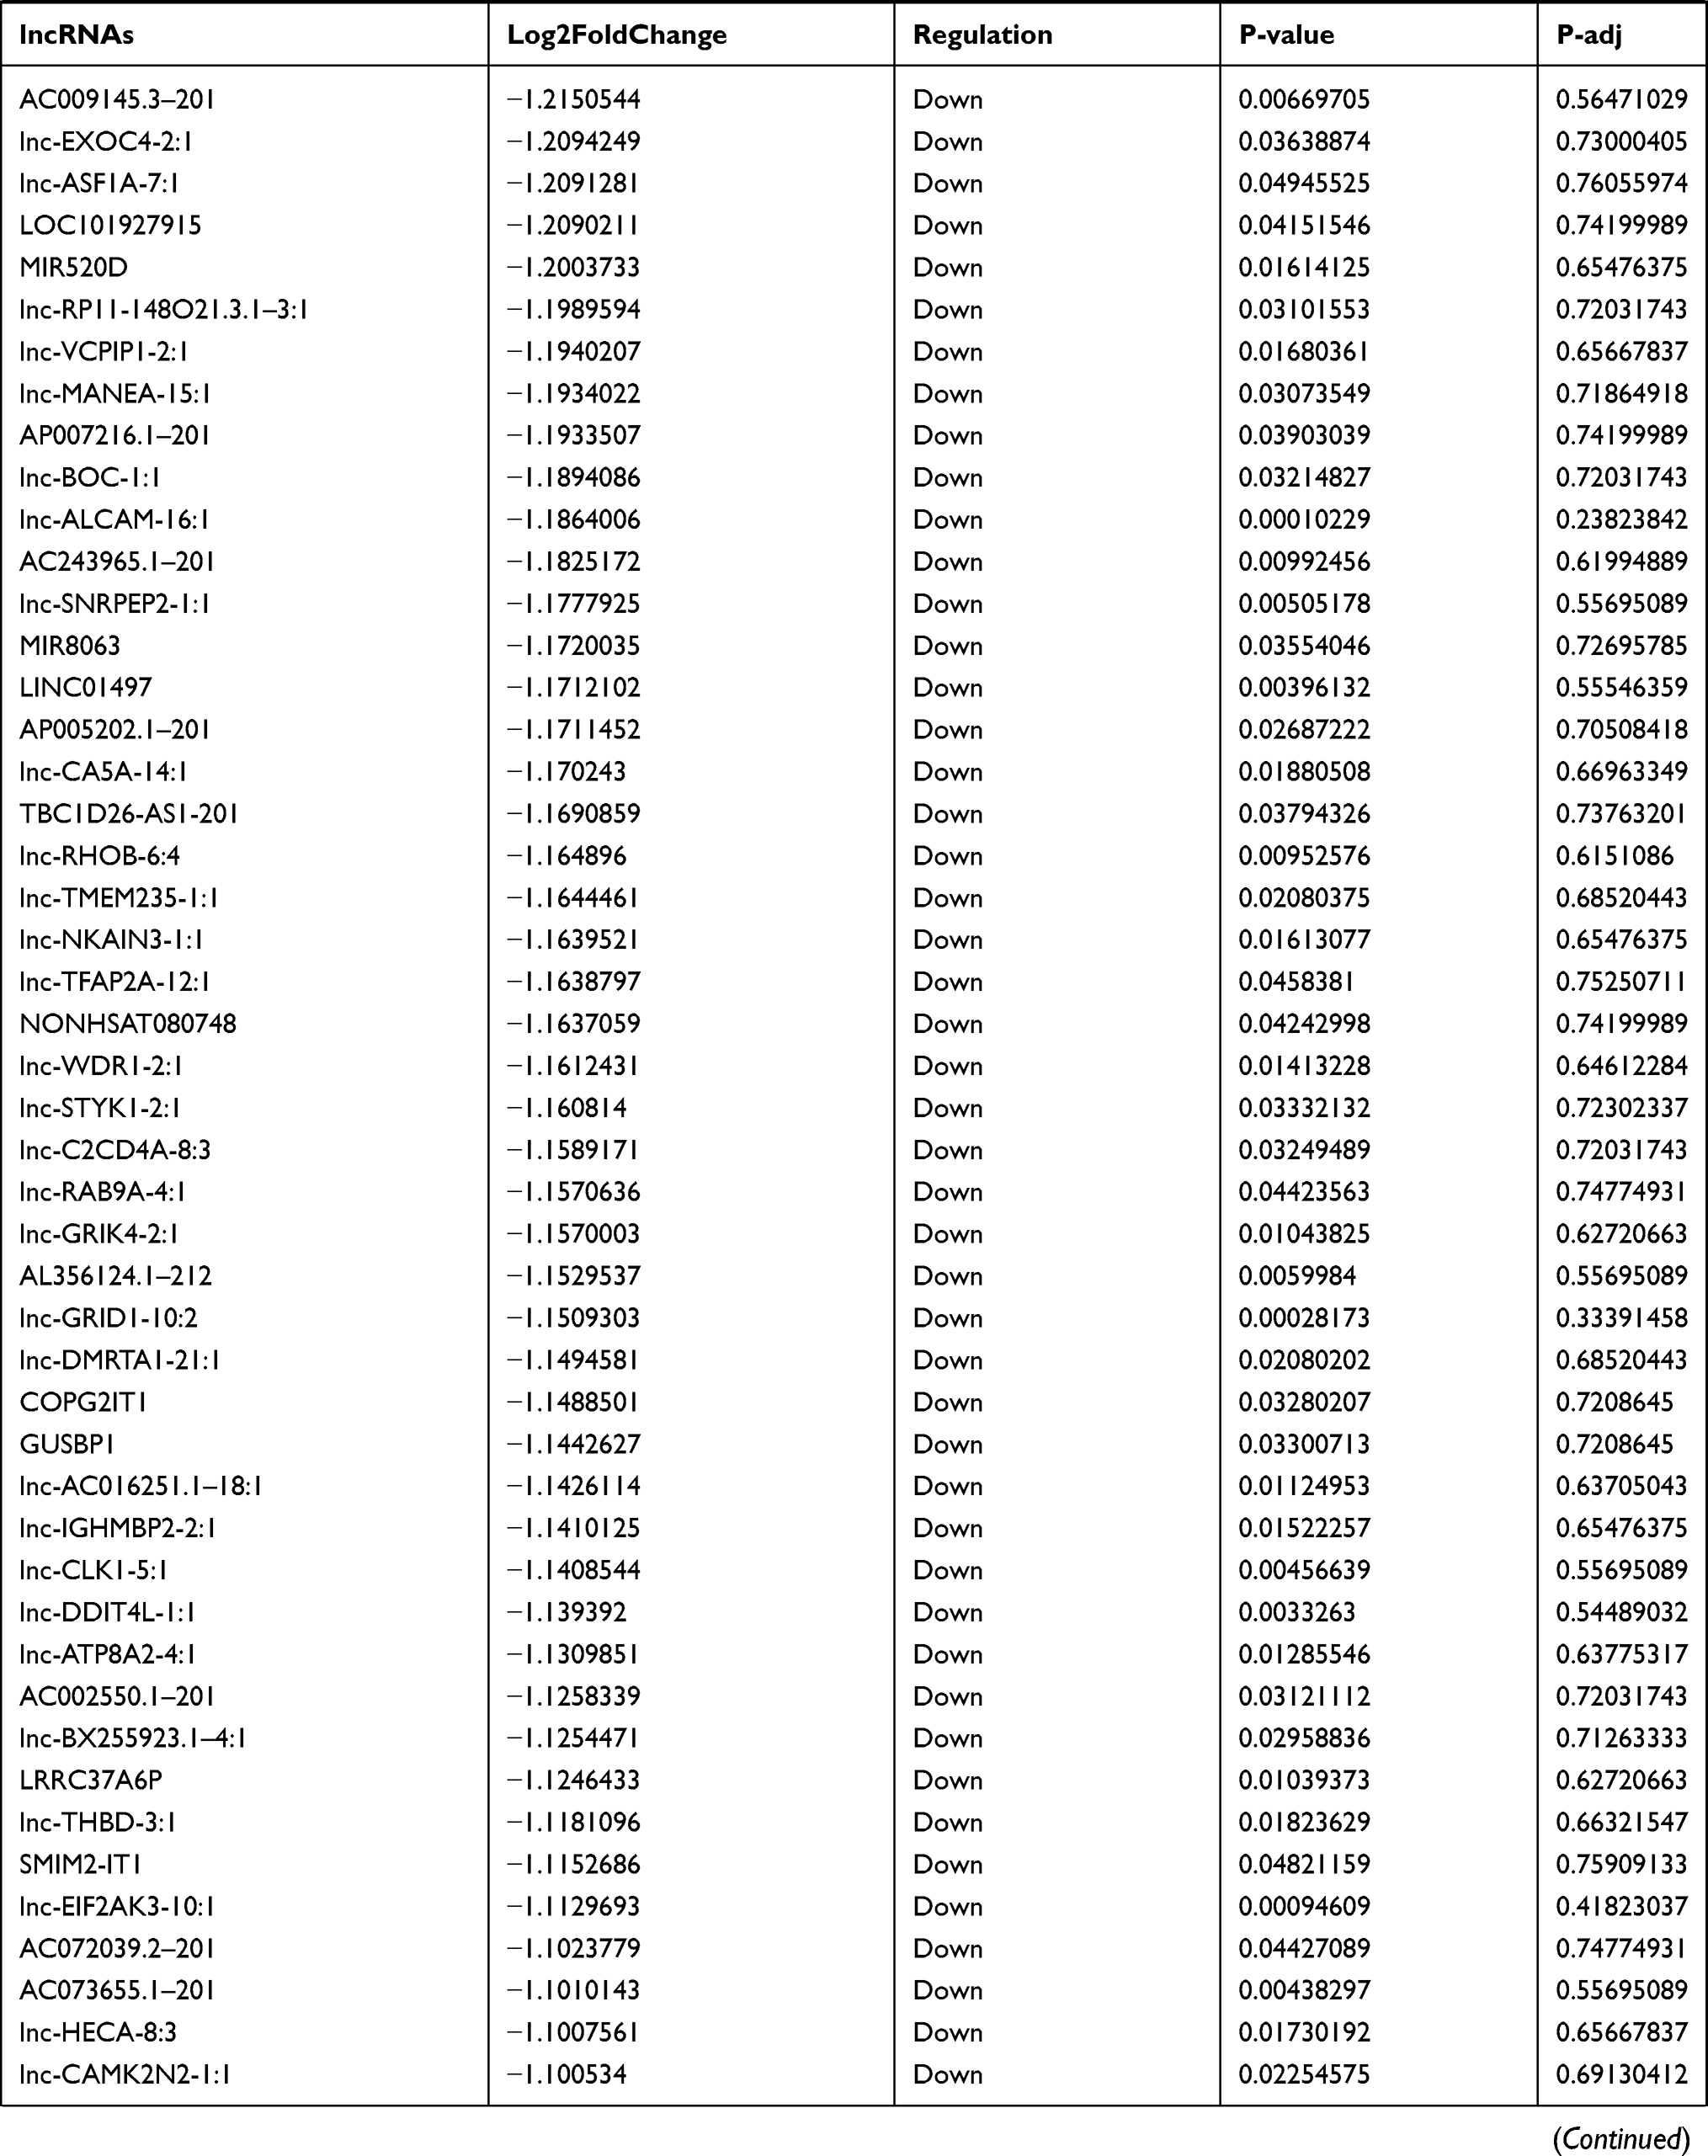 | 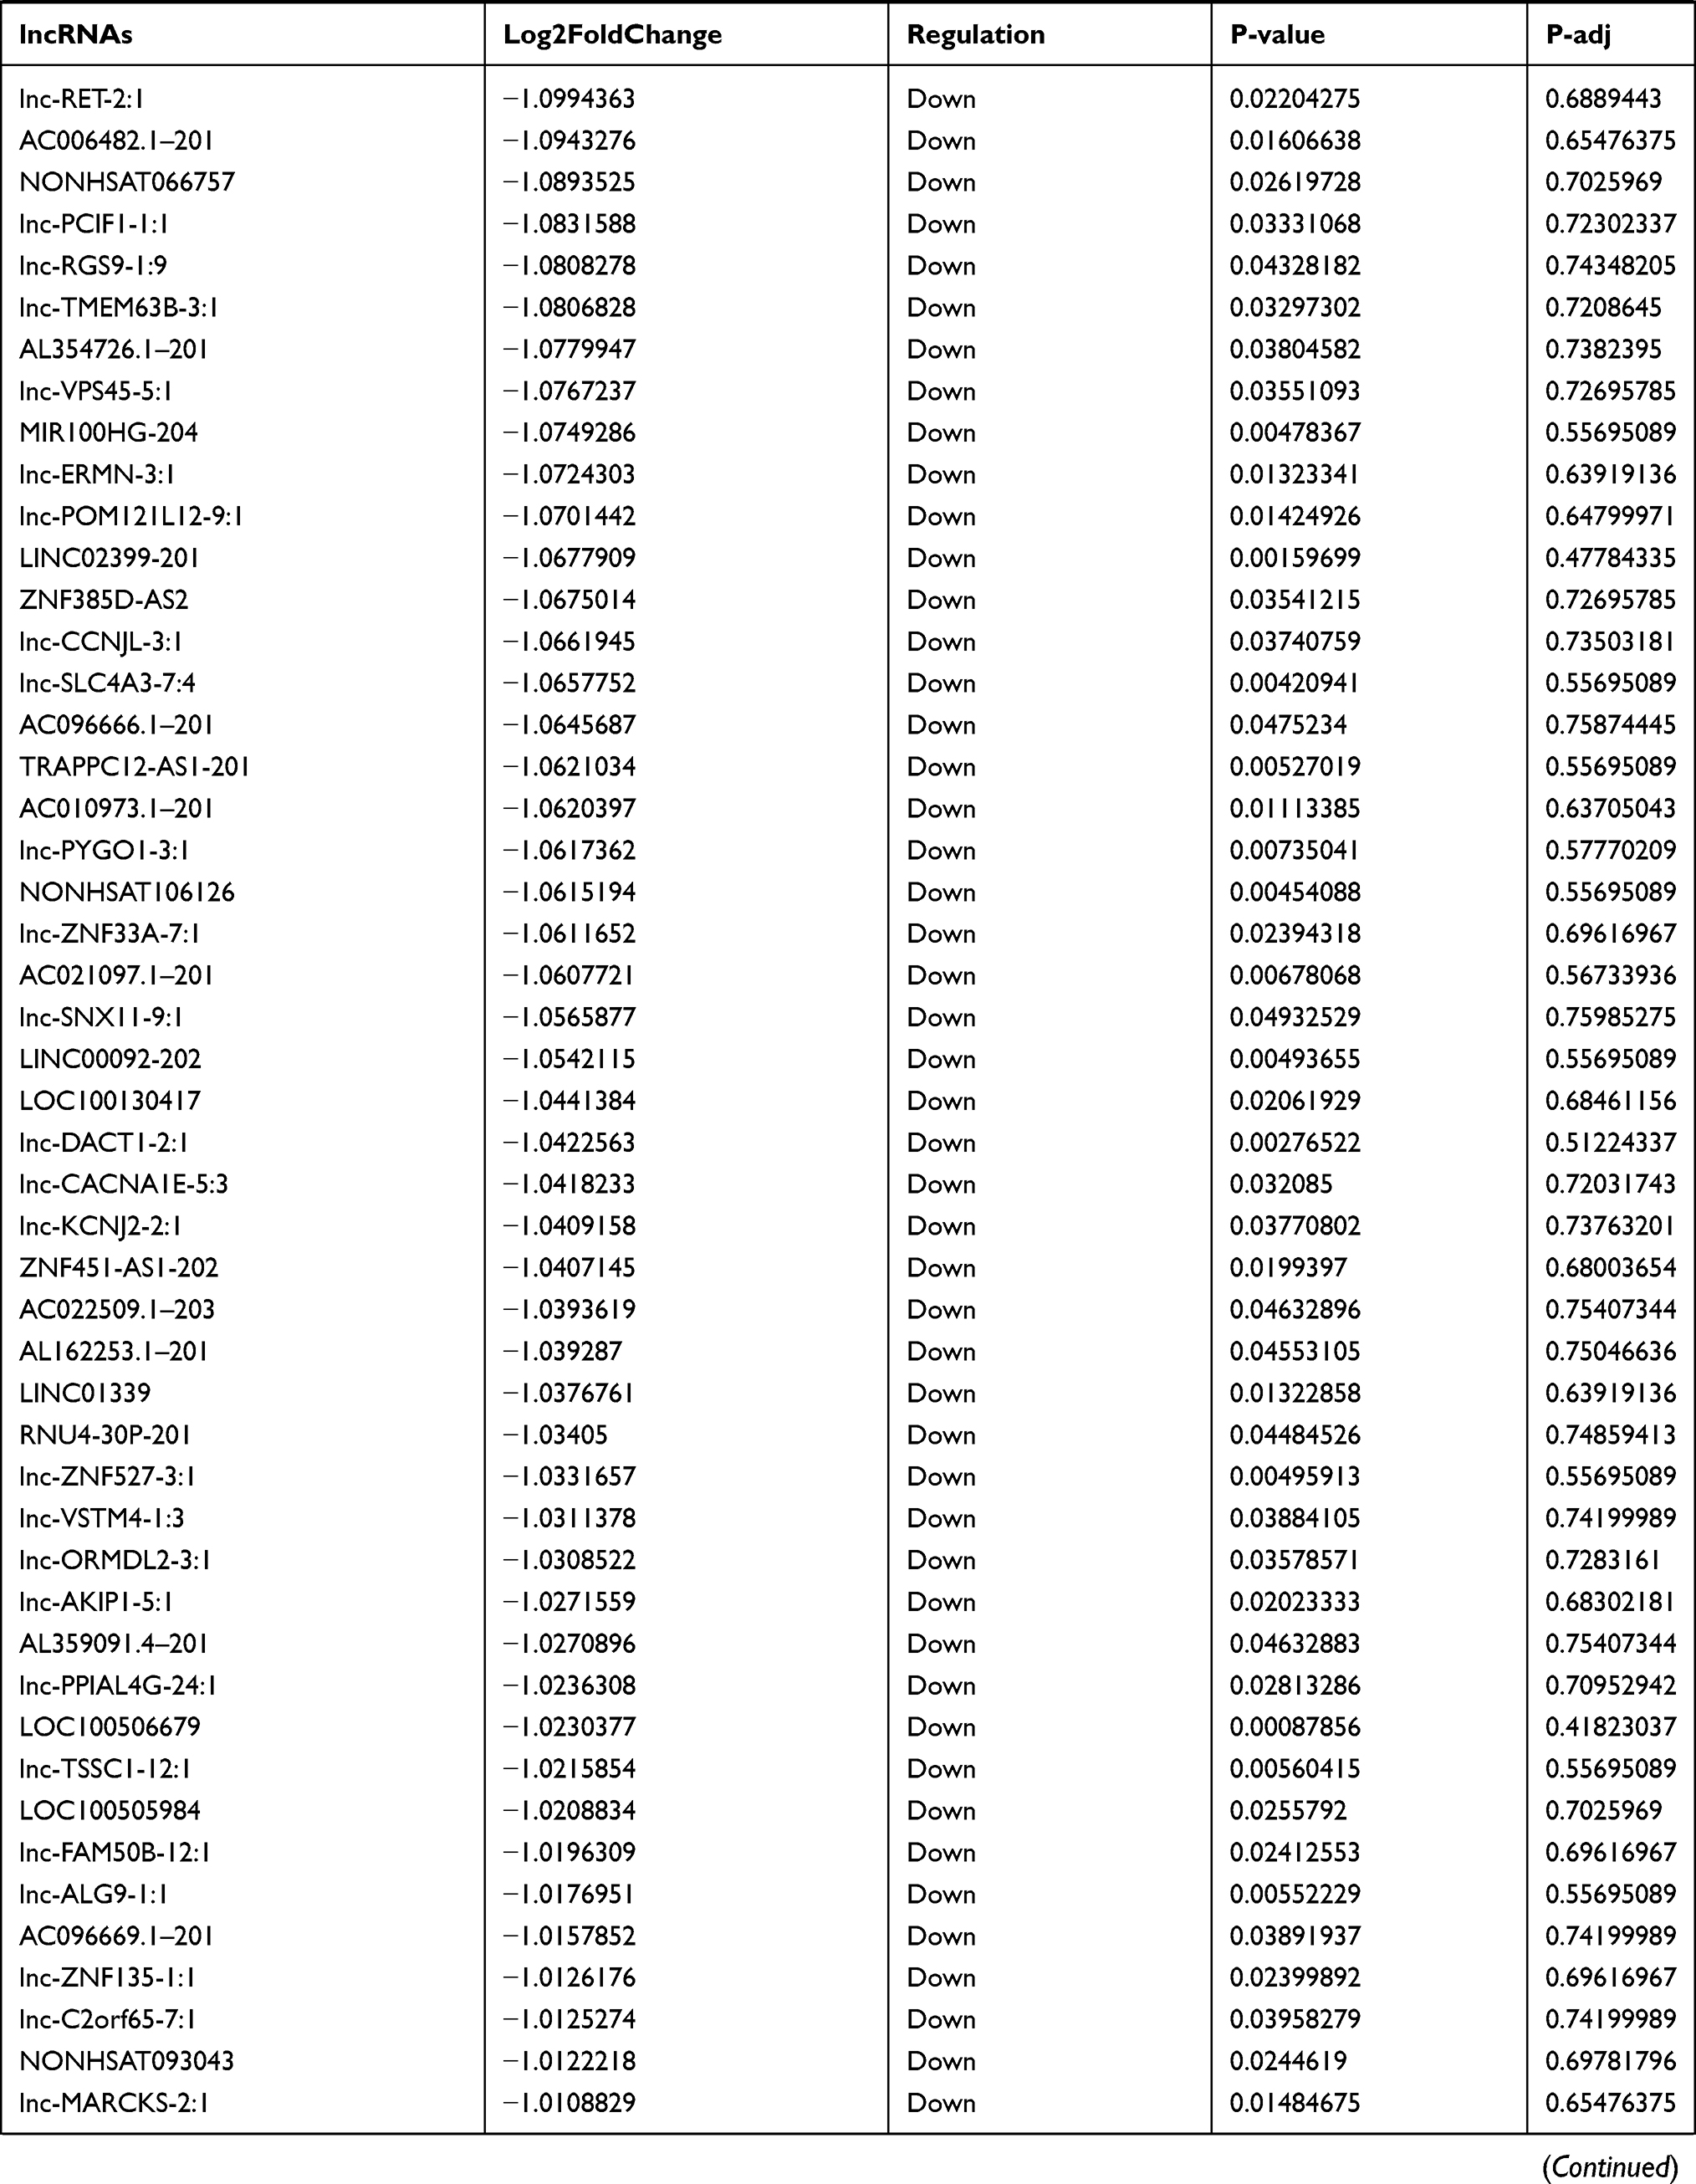 | 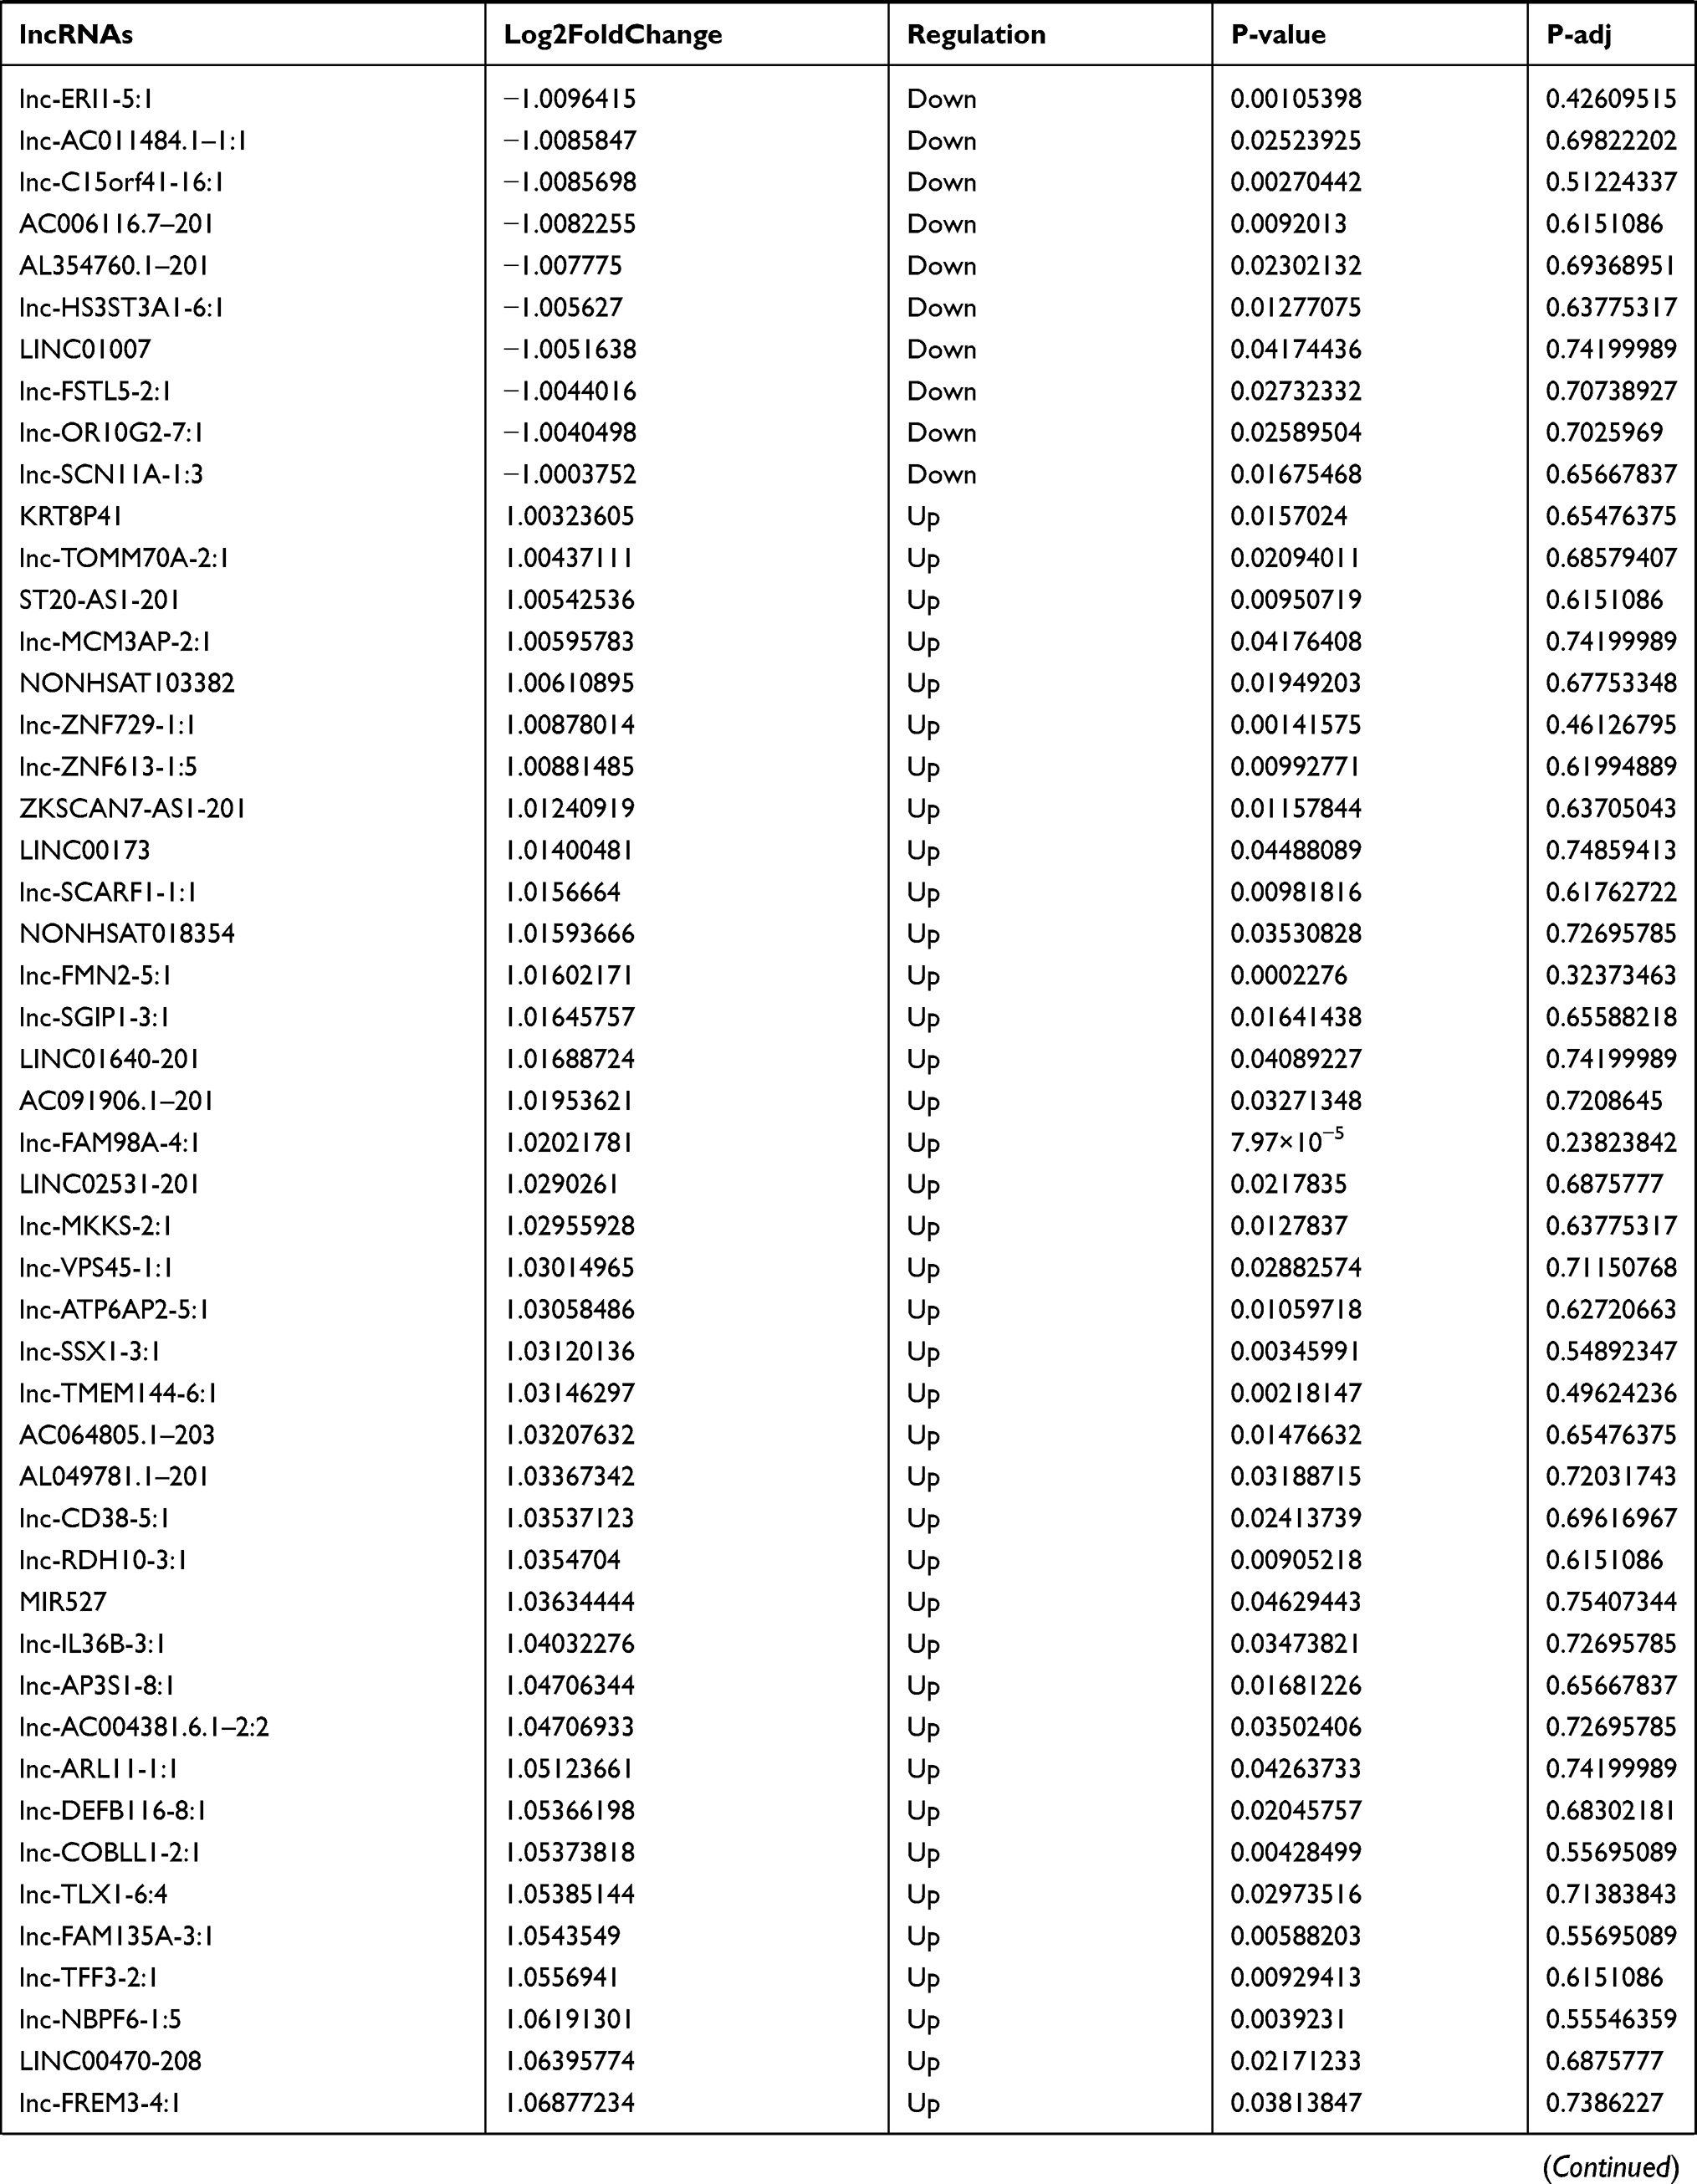 | 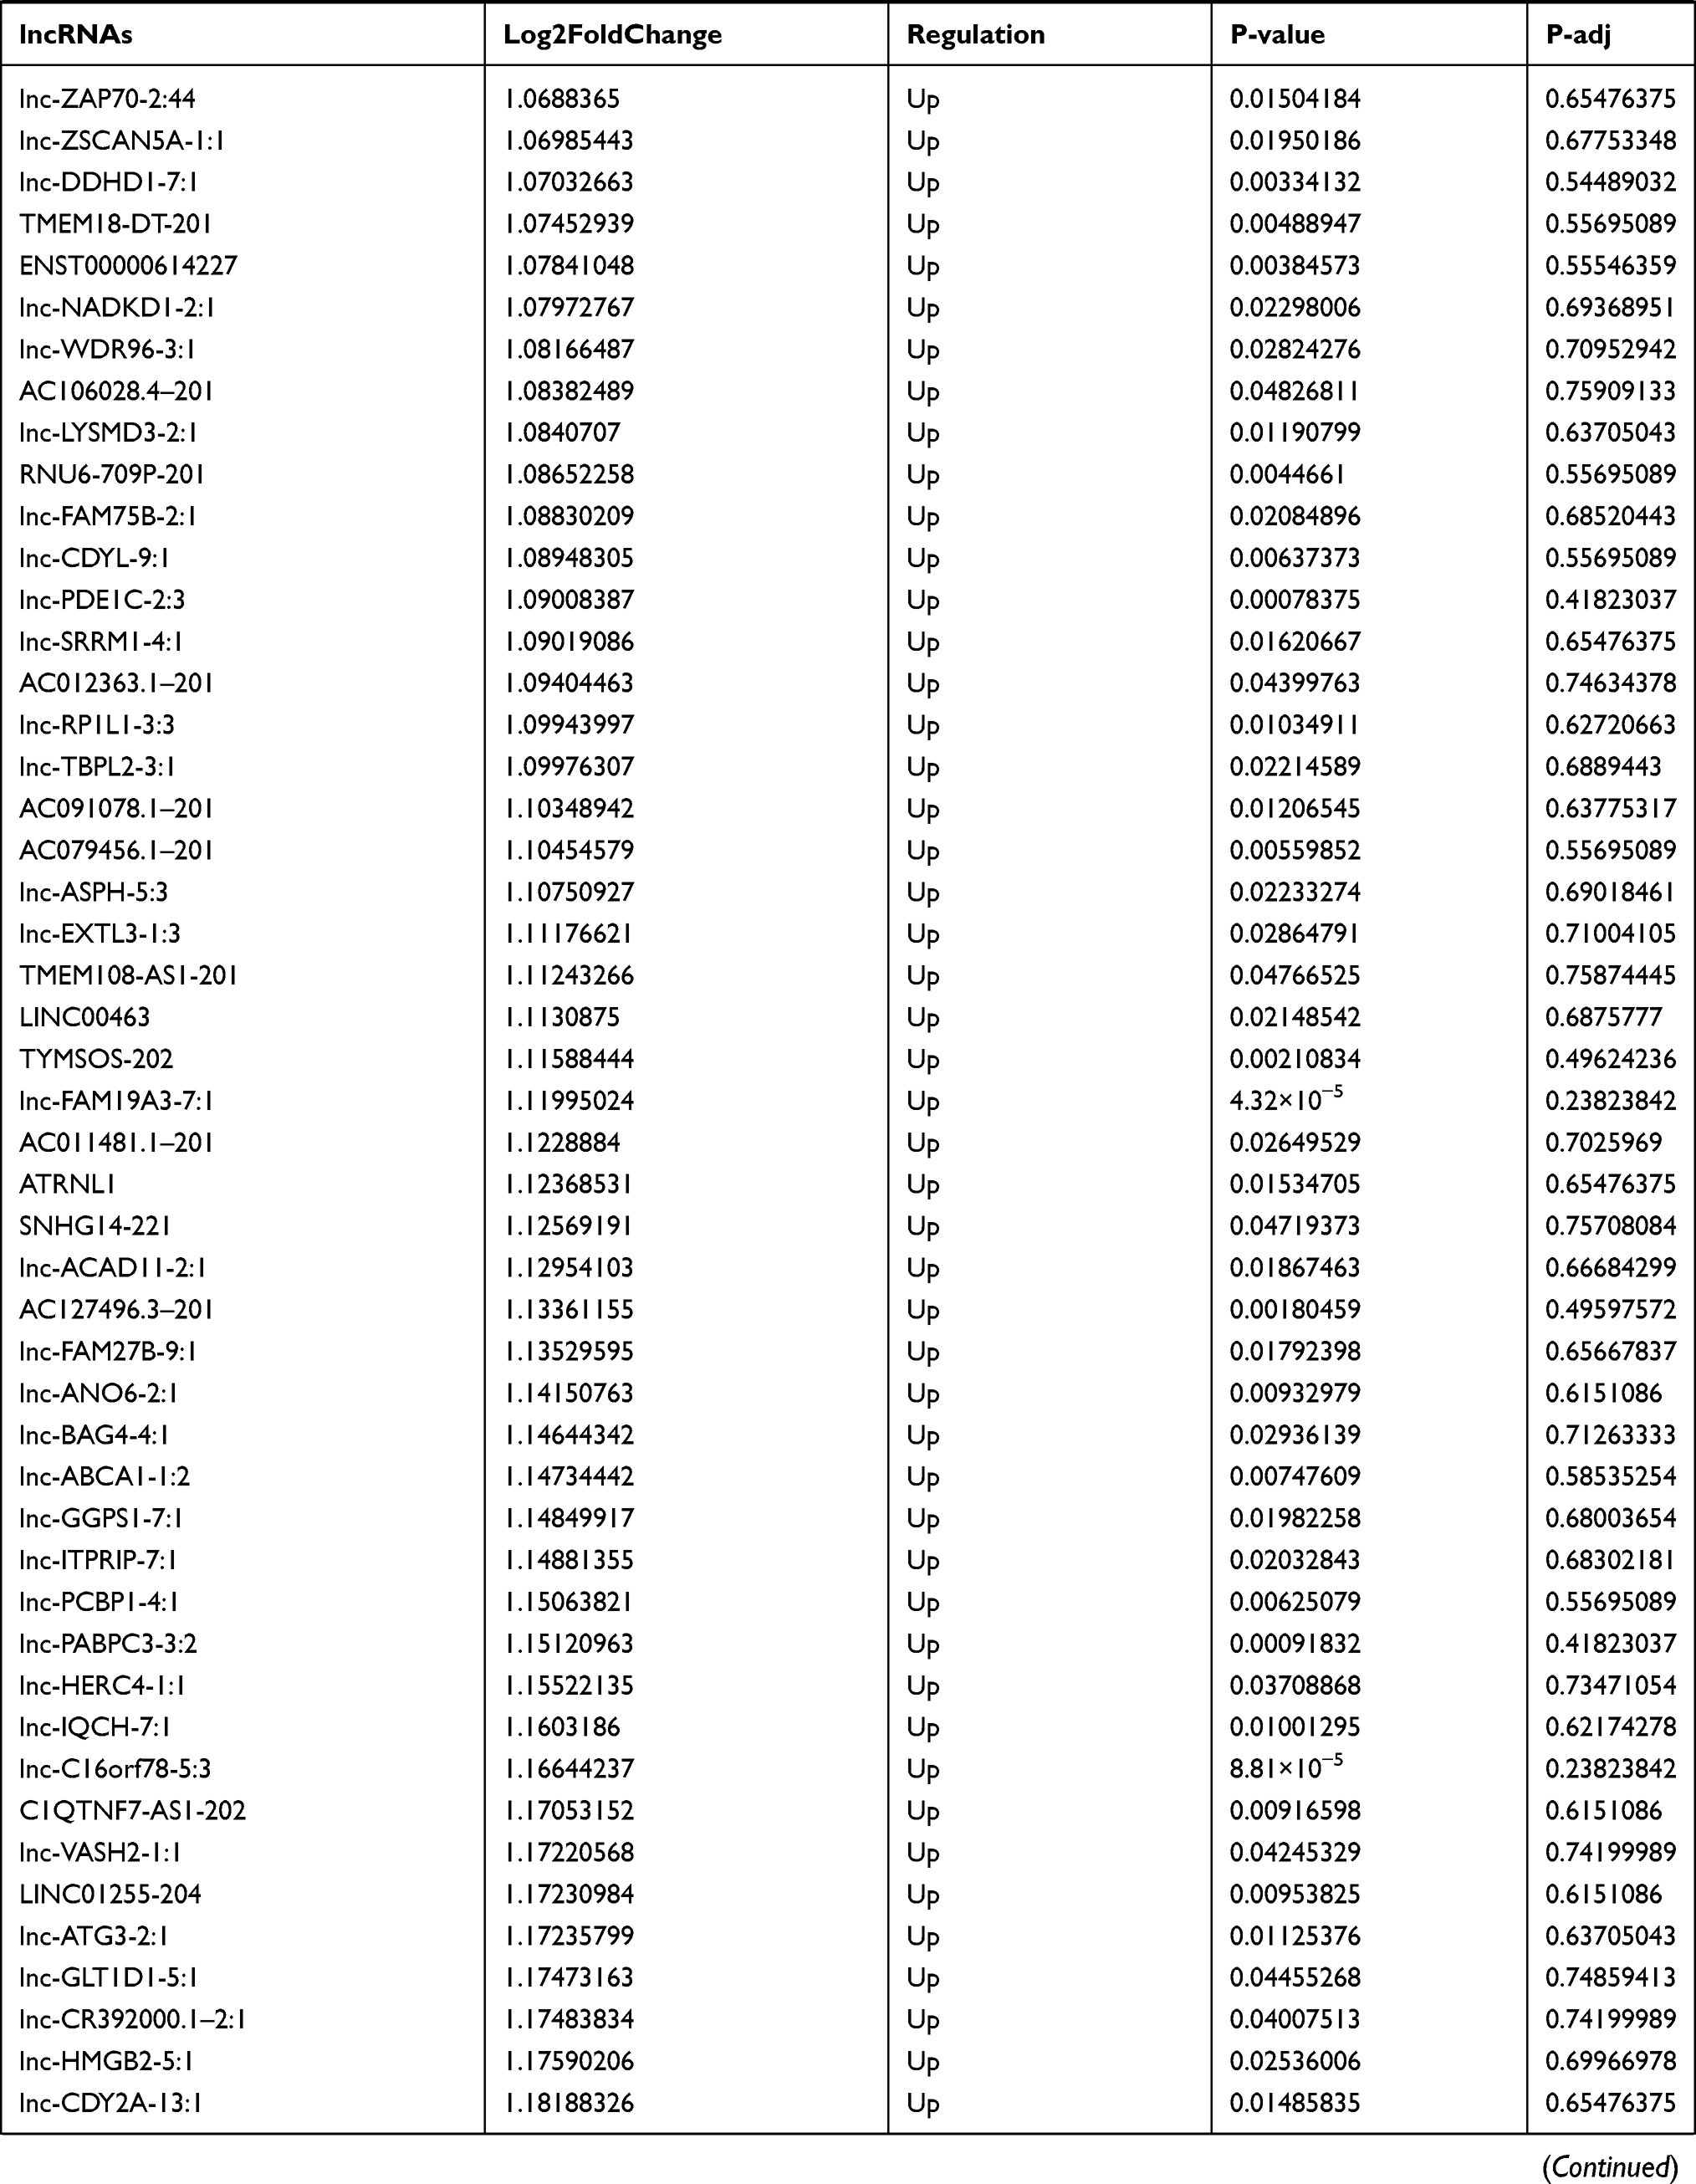 | 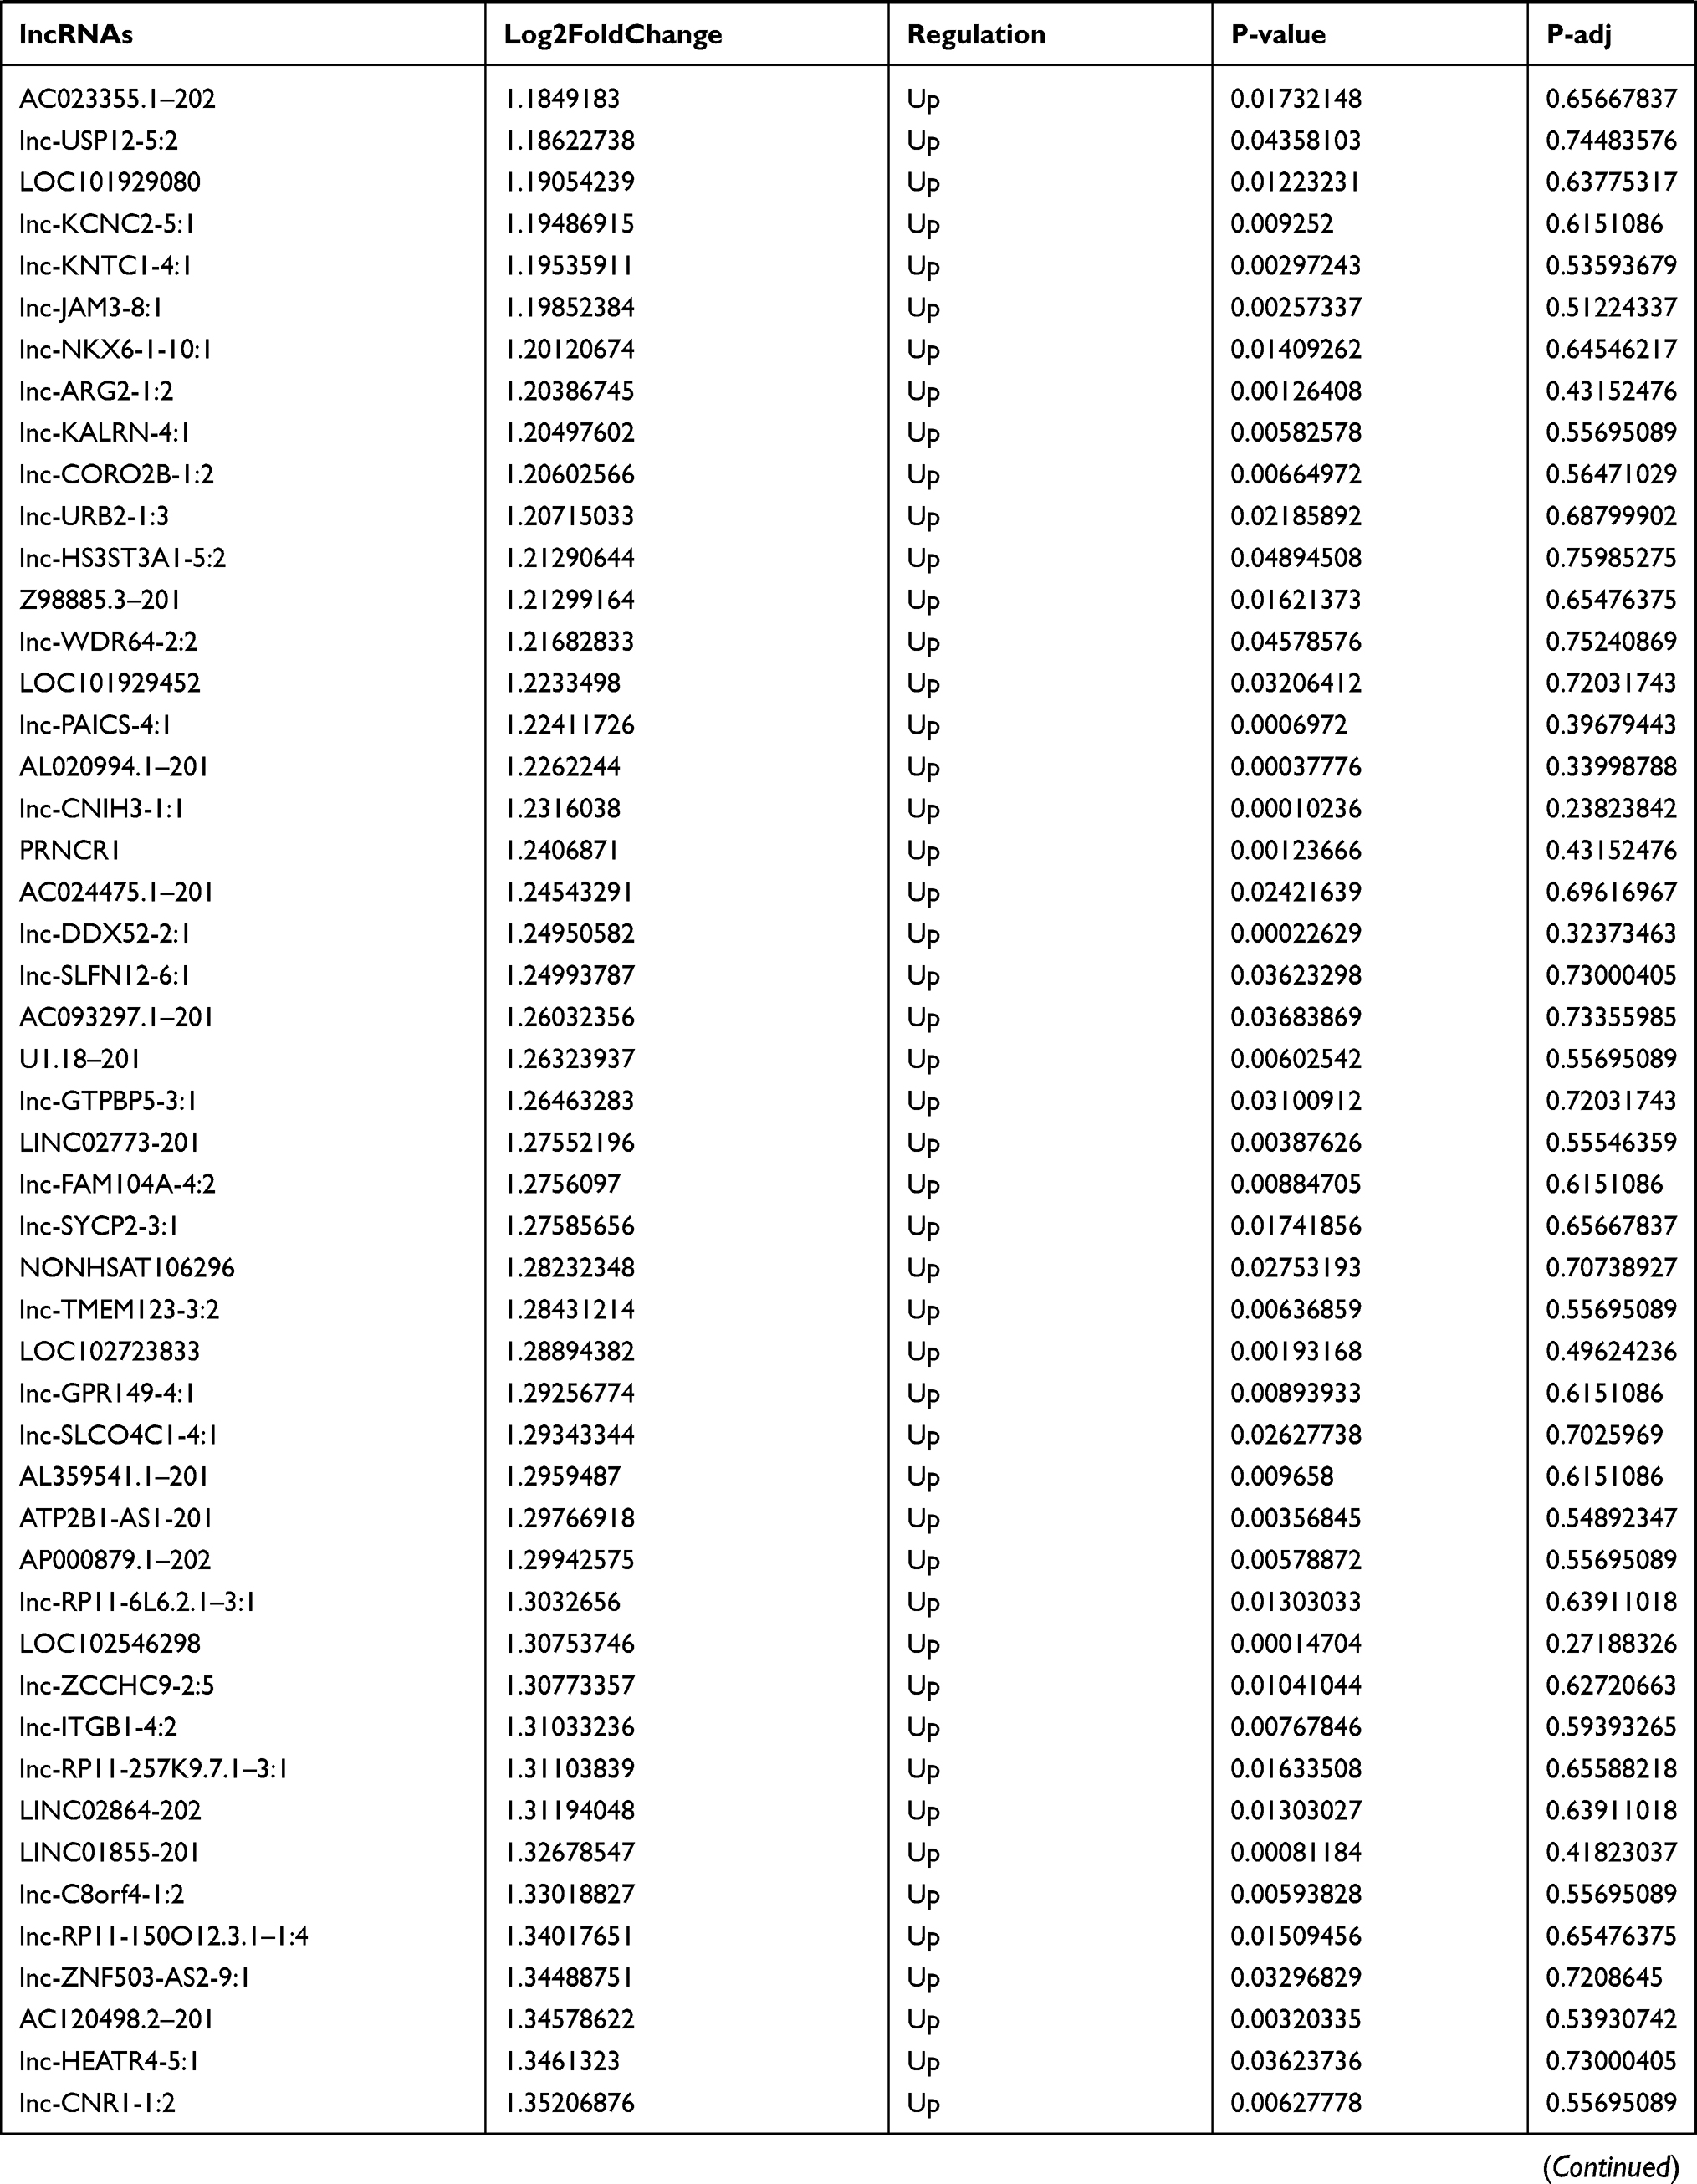 | 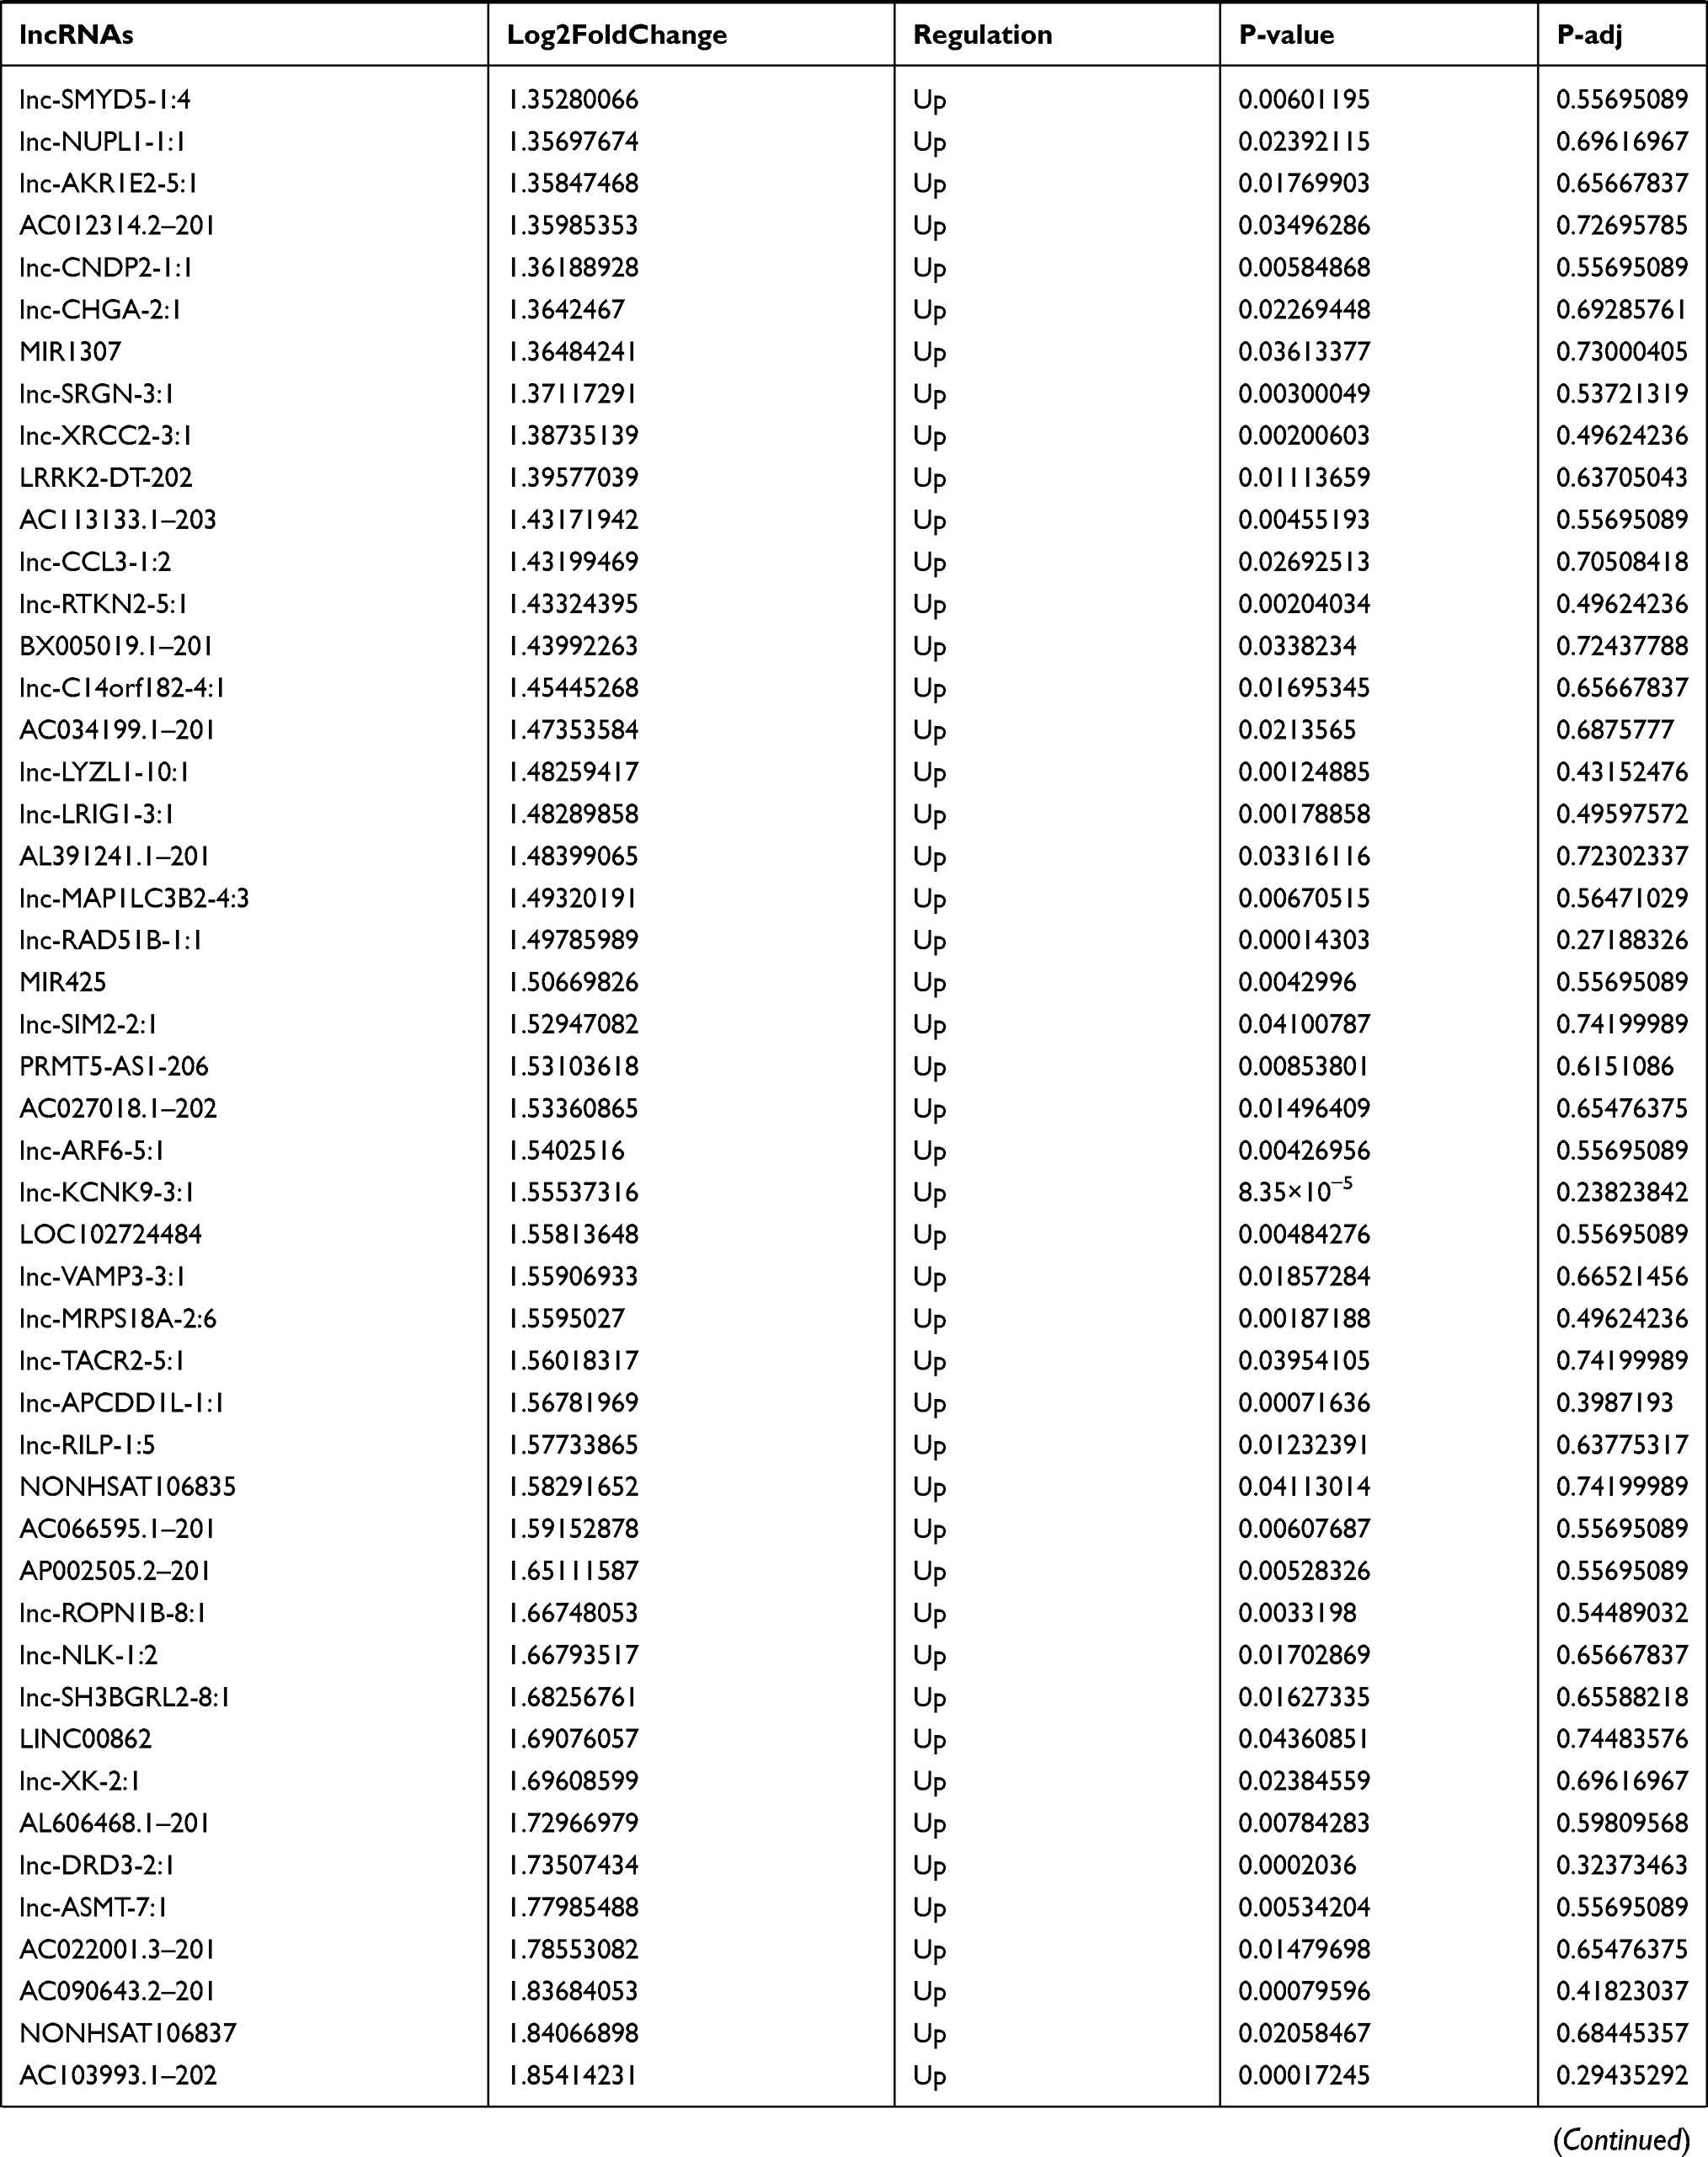 | 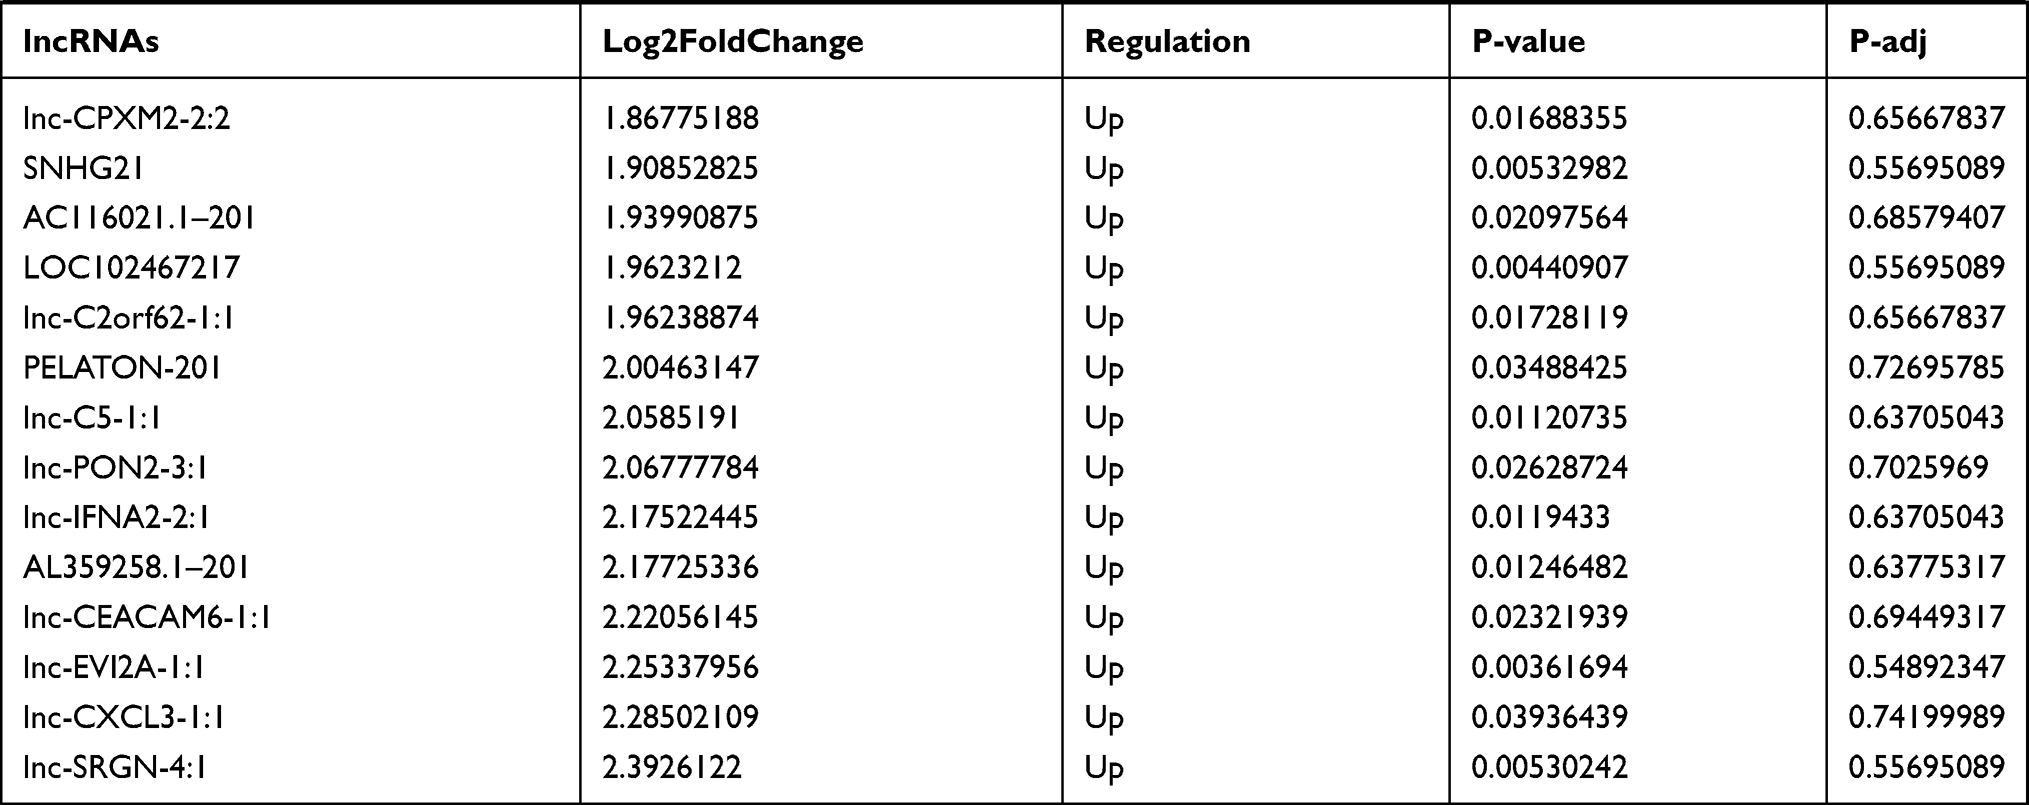 |
Table 5 Differentially Expressed lncRNAs Between the Control Group and T1DM Group |
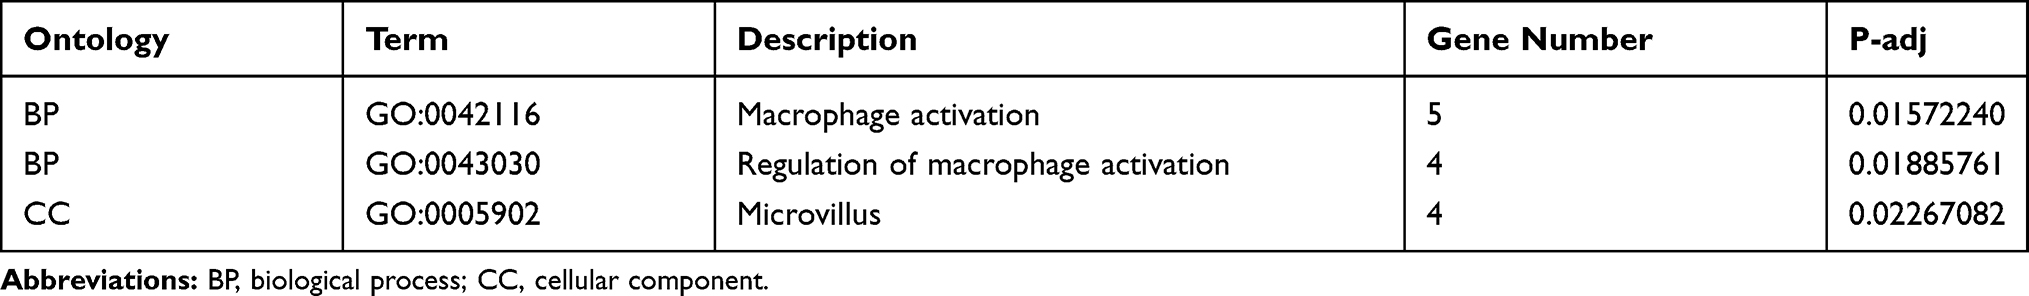 |
Table 6 Results of Gene Ontology (GO) Enrichment Analysis of Differentially Expressed lncRNAs |
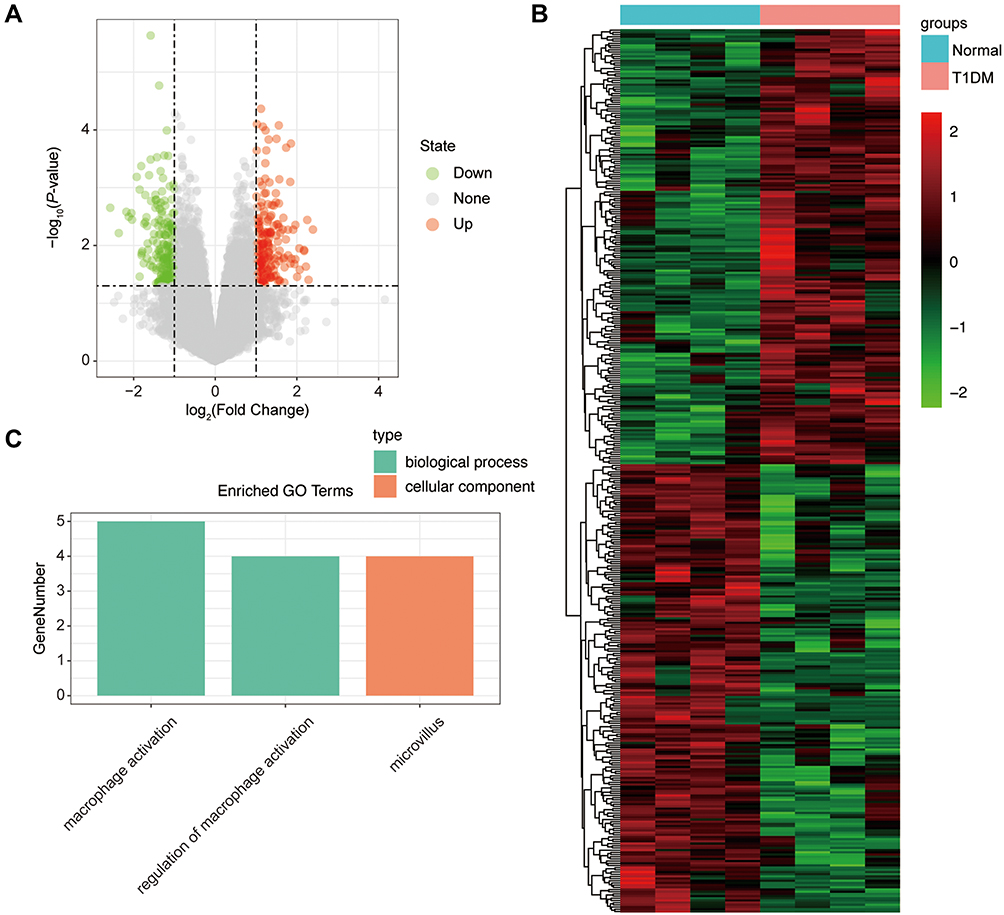 |
Figure 3 The differentially expressed lncRNAs in T1DM and healthy patients. (A) Volcano plot of DElncRNAs between normal and T1DM groups. Red and green indicate up- and downregulation, respectively. (B) Heatmap of DElncRNAs between normal and T1DM groups. Red color represents increased expression, and green color represents decreased expression. The darker the color, the greater the difference of lncRNA expression. (C) Enrichment analysis of the DElncRNAs in the categories biological process and cellular component. |
Identification of Differentially Expressed mRNA in T1DM and Healthy Patients
Subsequently, the differentially expressed mRNAs between the normal and T1DM groups were analyzed. As the volcano plot (Figure 4A) and heatmap (Figure 4B) indicated, there were 73 differentially expressed mRNAs (DEmRNAs, 31 up-regulated and 42 down-regulated) (Table 7). Most of them were located at chr2 (7, 9.59%), chr7 (6, 8.22%), chr17 (5, 6.85%), chr20 (5, 6.85%), chr12 (4, 5.48%). In addition, GO enrichment analysis showed that the DEmRNAs were enriched in prostaglandin receptor activity (GO:0004955), prostanoid receptor activity (GO:0004954), and BMP binding (GO:0036122) (Figure 4C and Table 8).
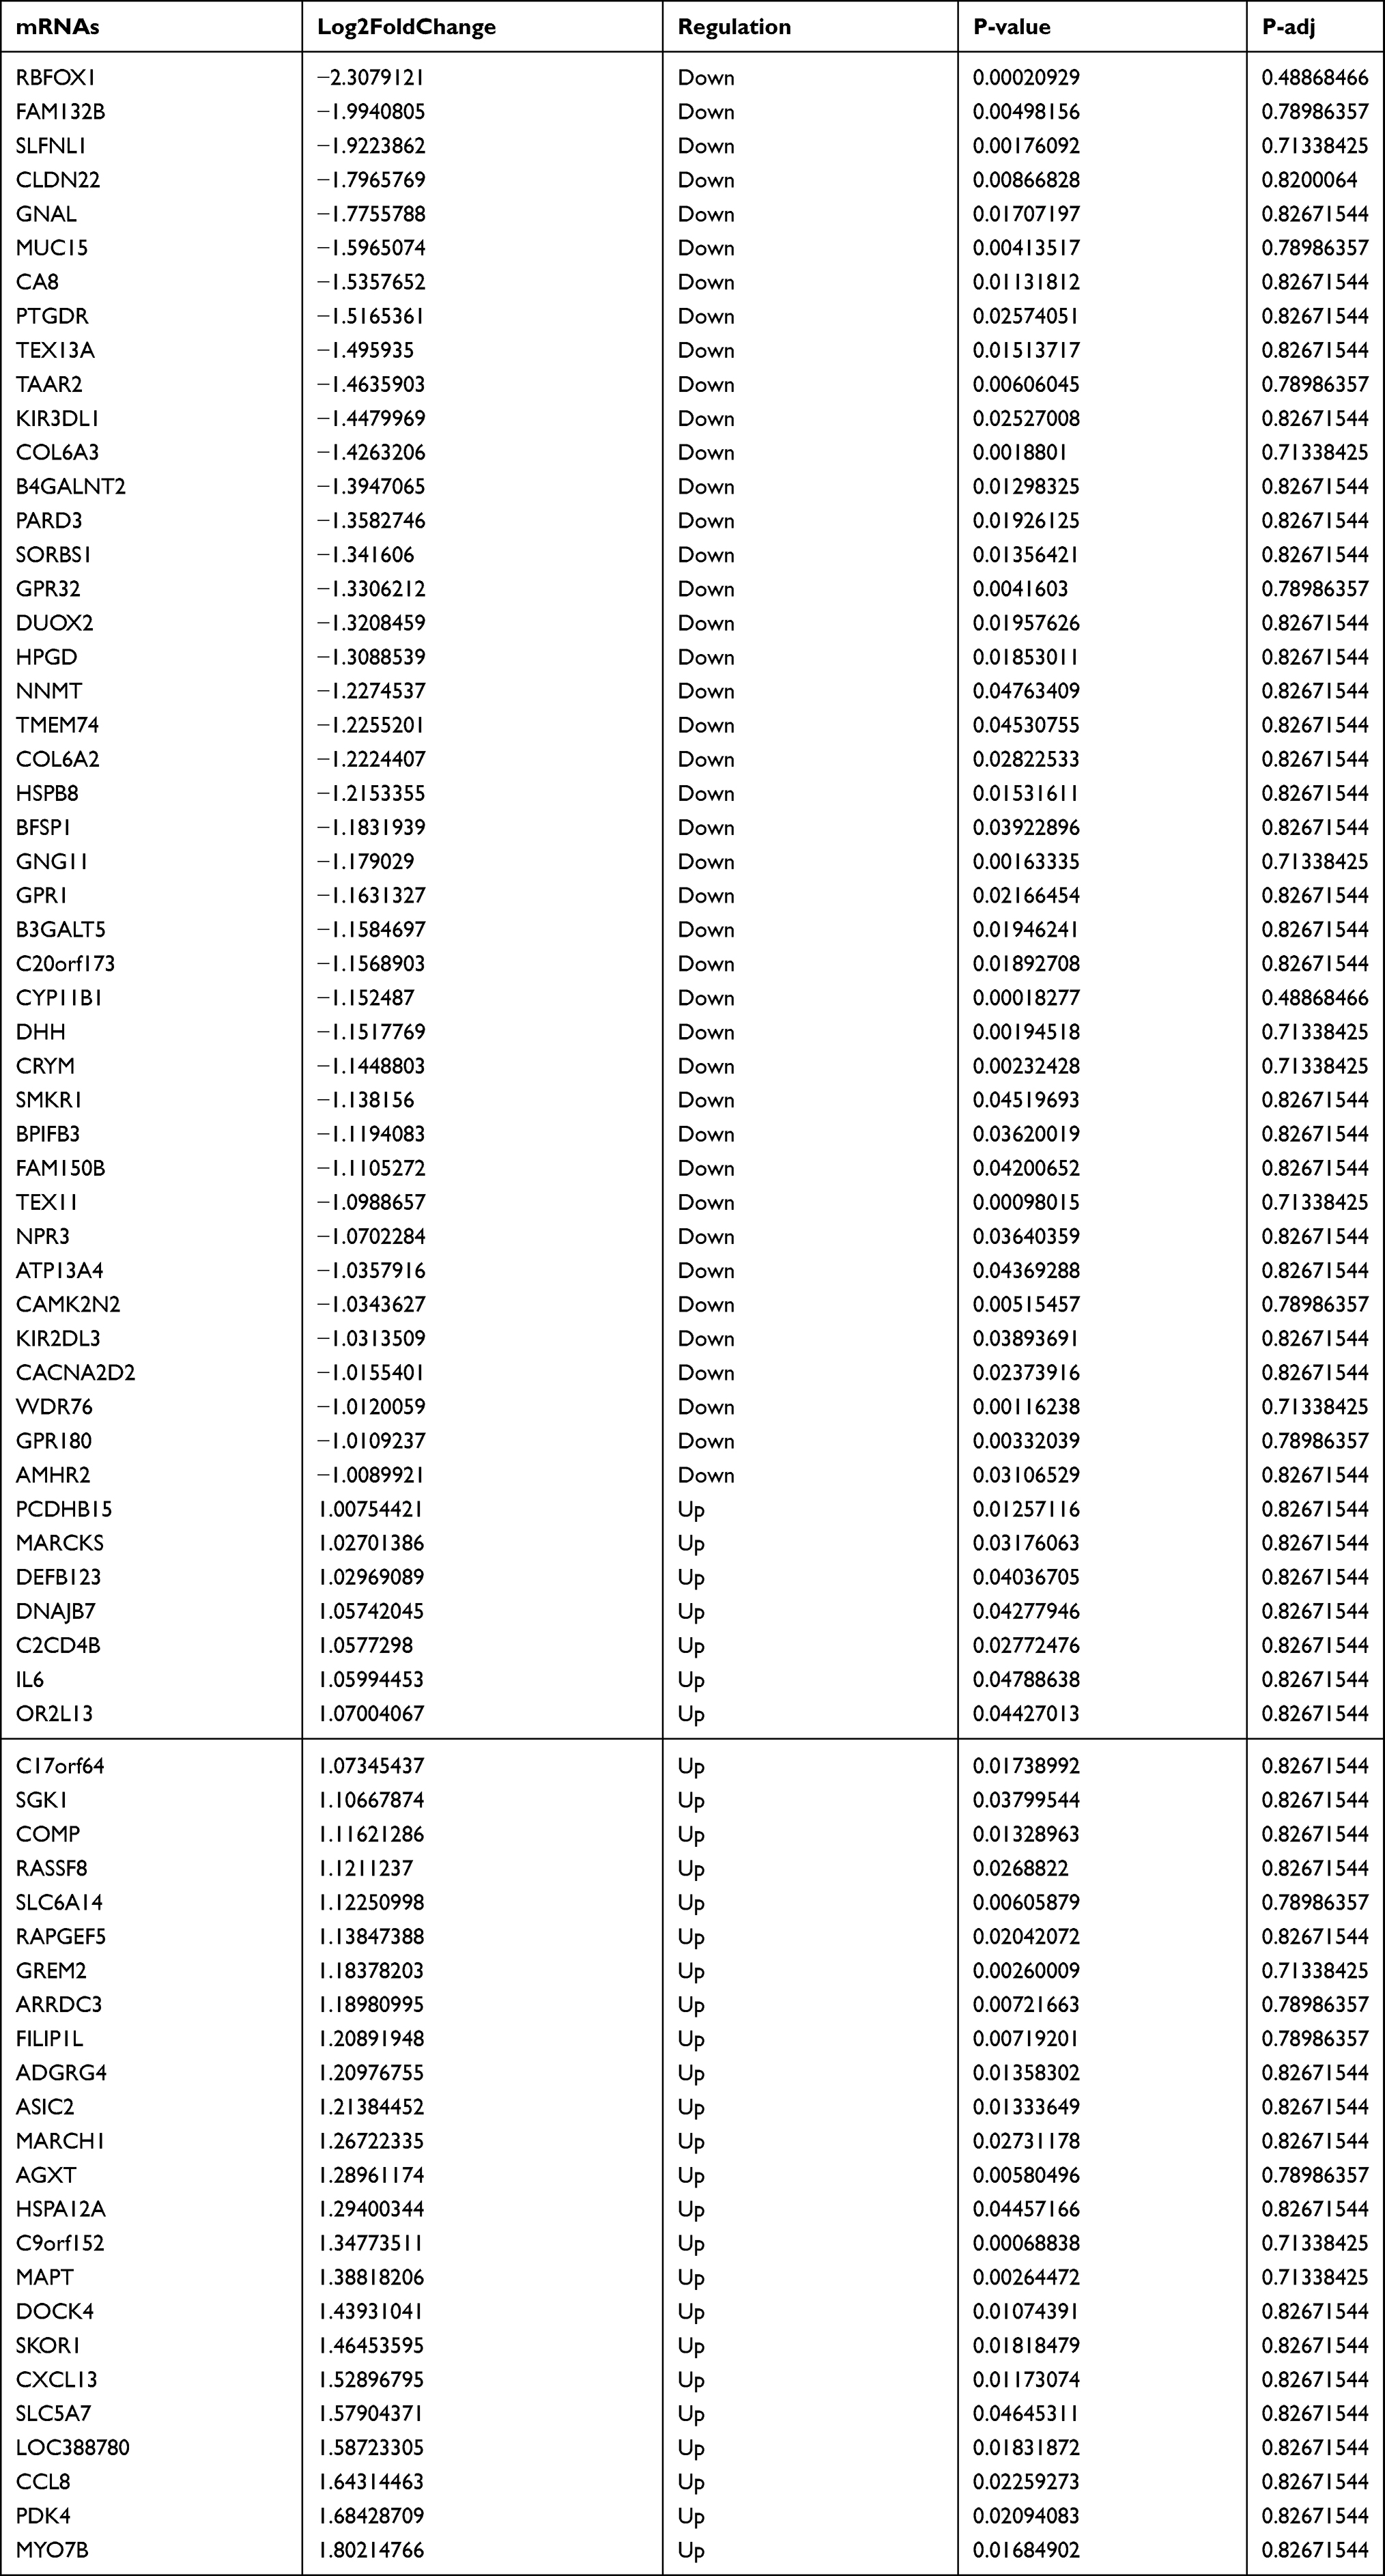 |
Table 7 Differentially Expressed mRNAs Between the Control Group and T1DM Group |
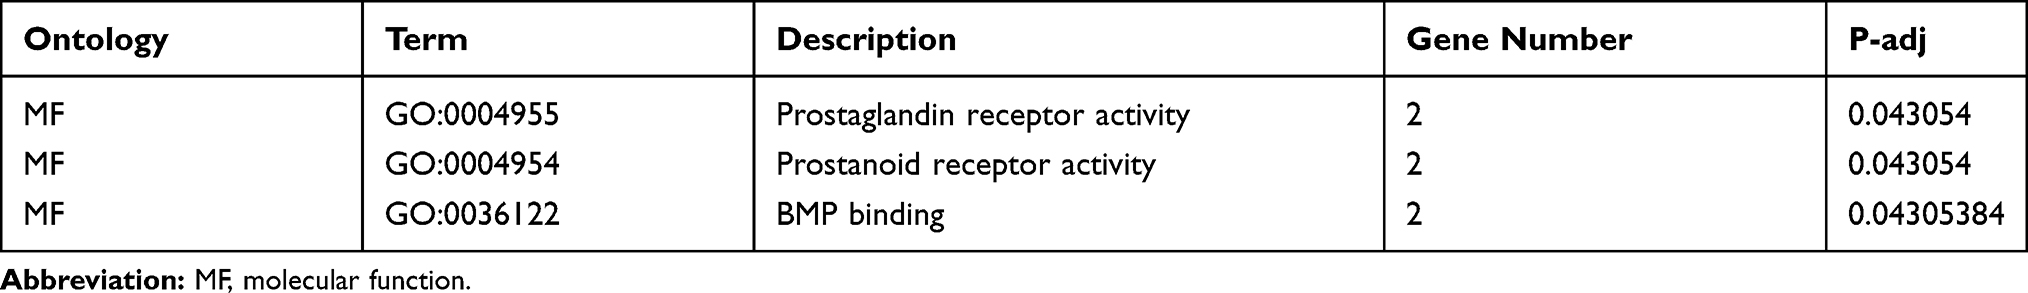 |
Table 8 Results of Gene Ontology (GO) Enrichment Analysis of Differentially Expressed mRNAs |
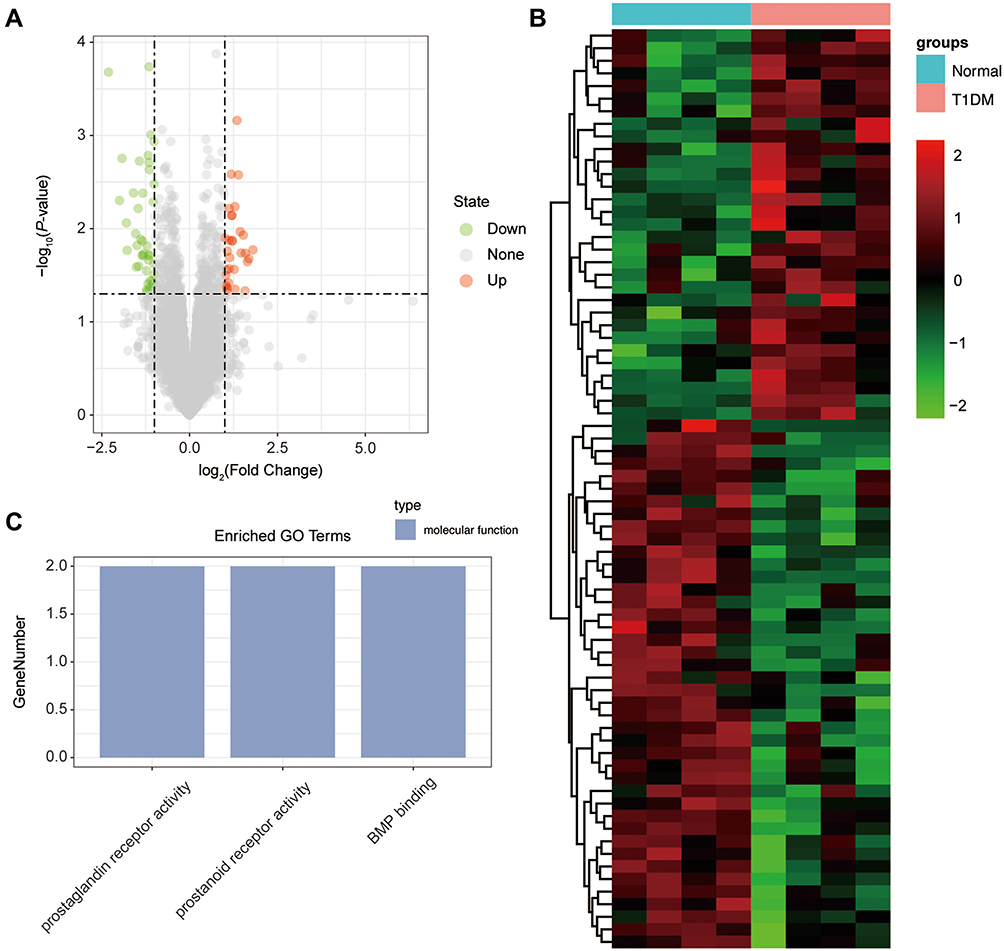 |
Figure 4 The differentially expressed mRNAs in T1DM and healthy patients. (A) Volcano plot of DEmRNAs between normal and T1DM groups. Red and green indicate up- and downregulation, respectively. (B) Heatmap of DEmRNAs between normal and T1DM groups. Red color represents increased expression, and green color represents decreased expression. The darker the color, the greater the difference in mRNA expression. (C) Enrichment analysis of the DEmRNAs in the category molecular function. |
The circRNA-lncRNA-miRNA-mRNA Network in T1DM
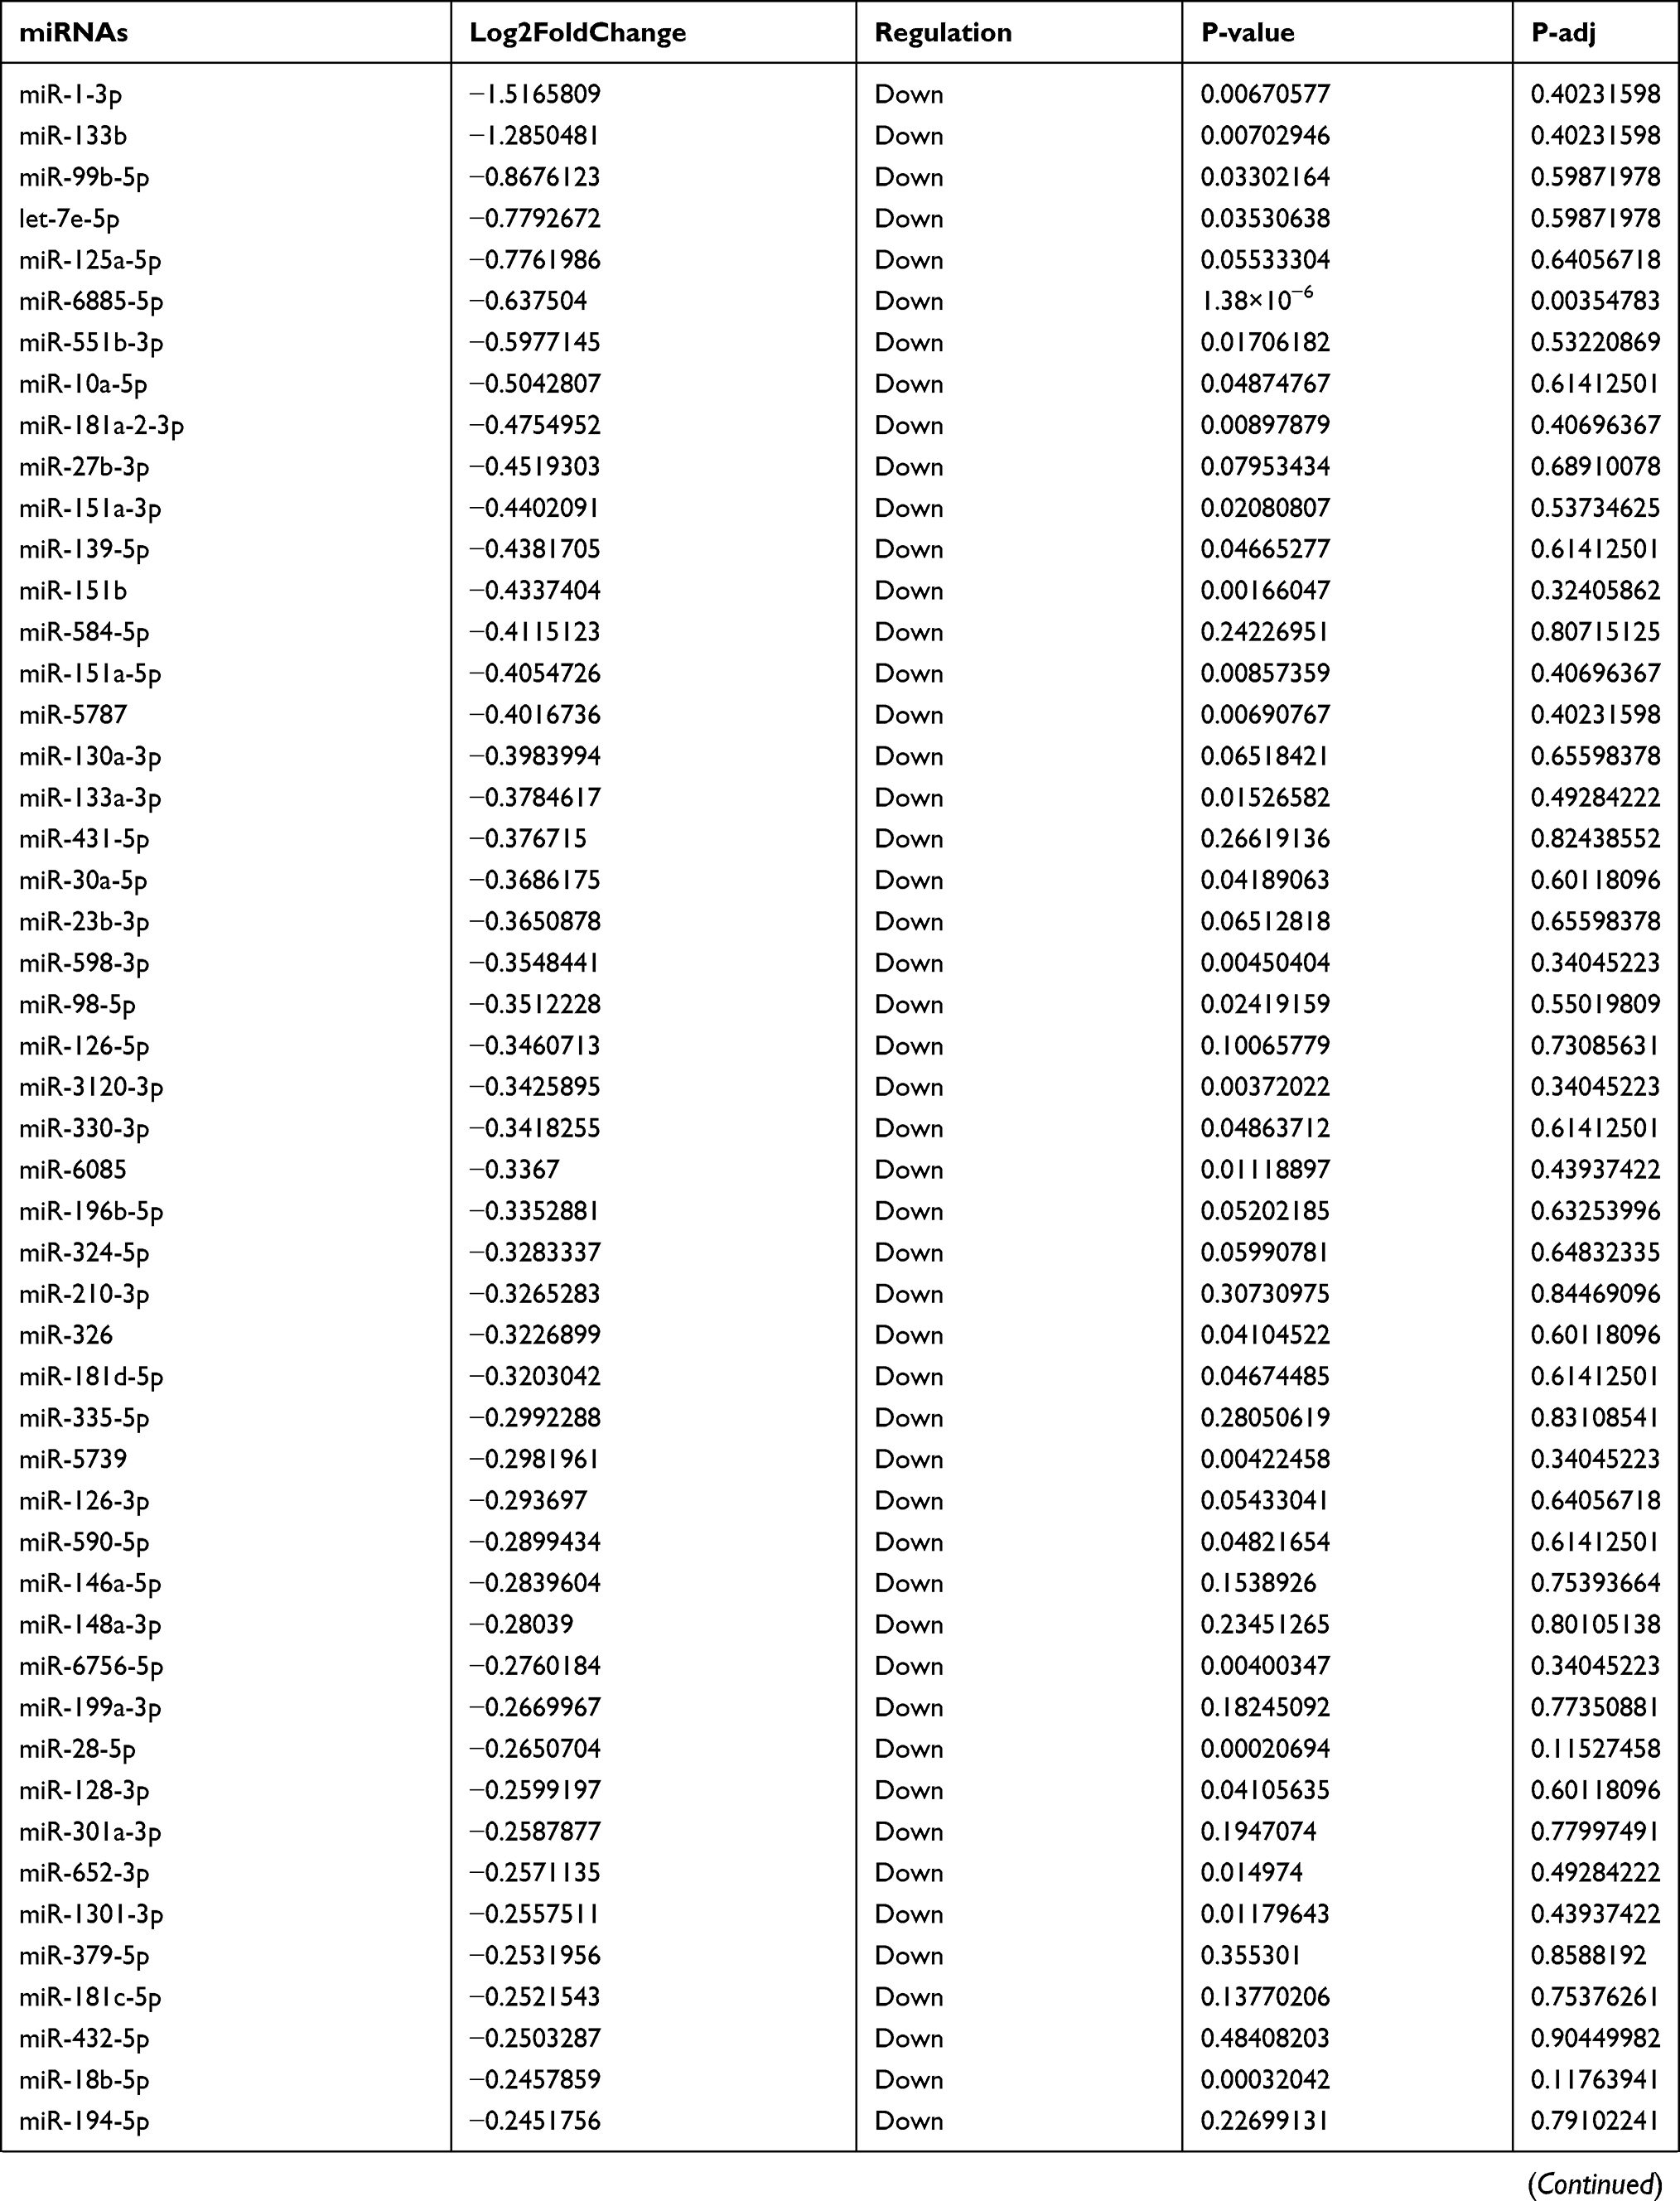
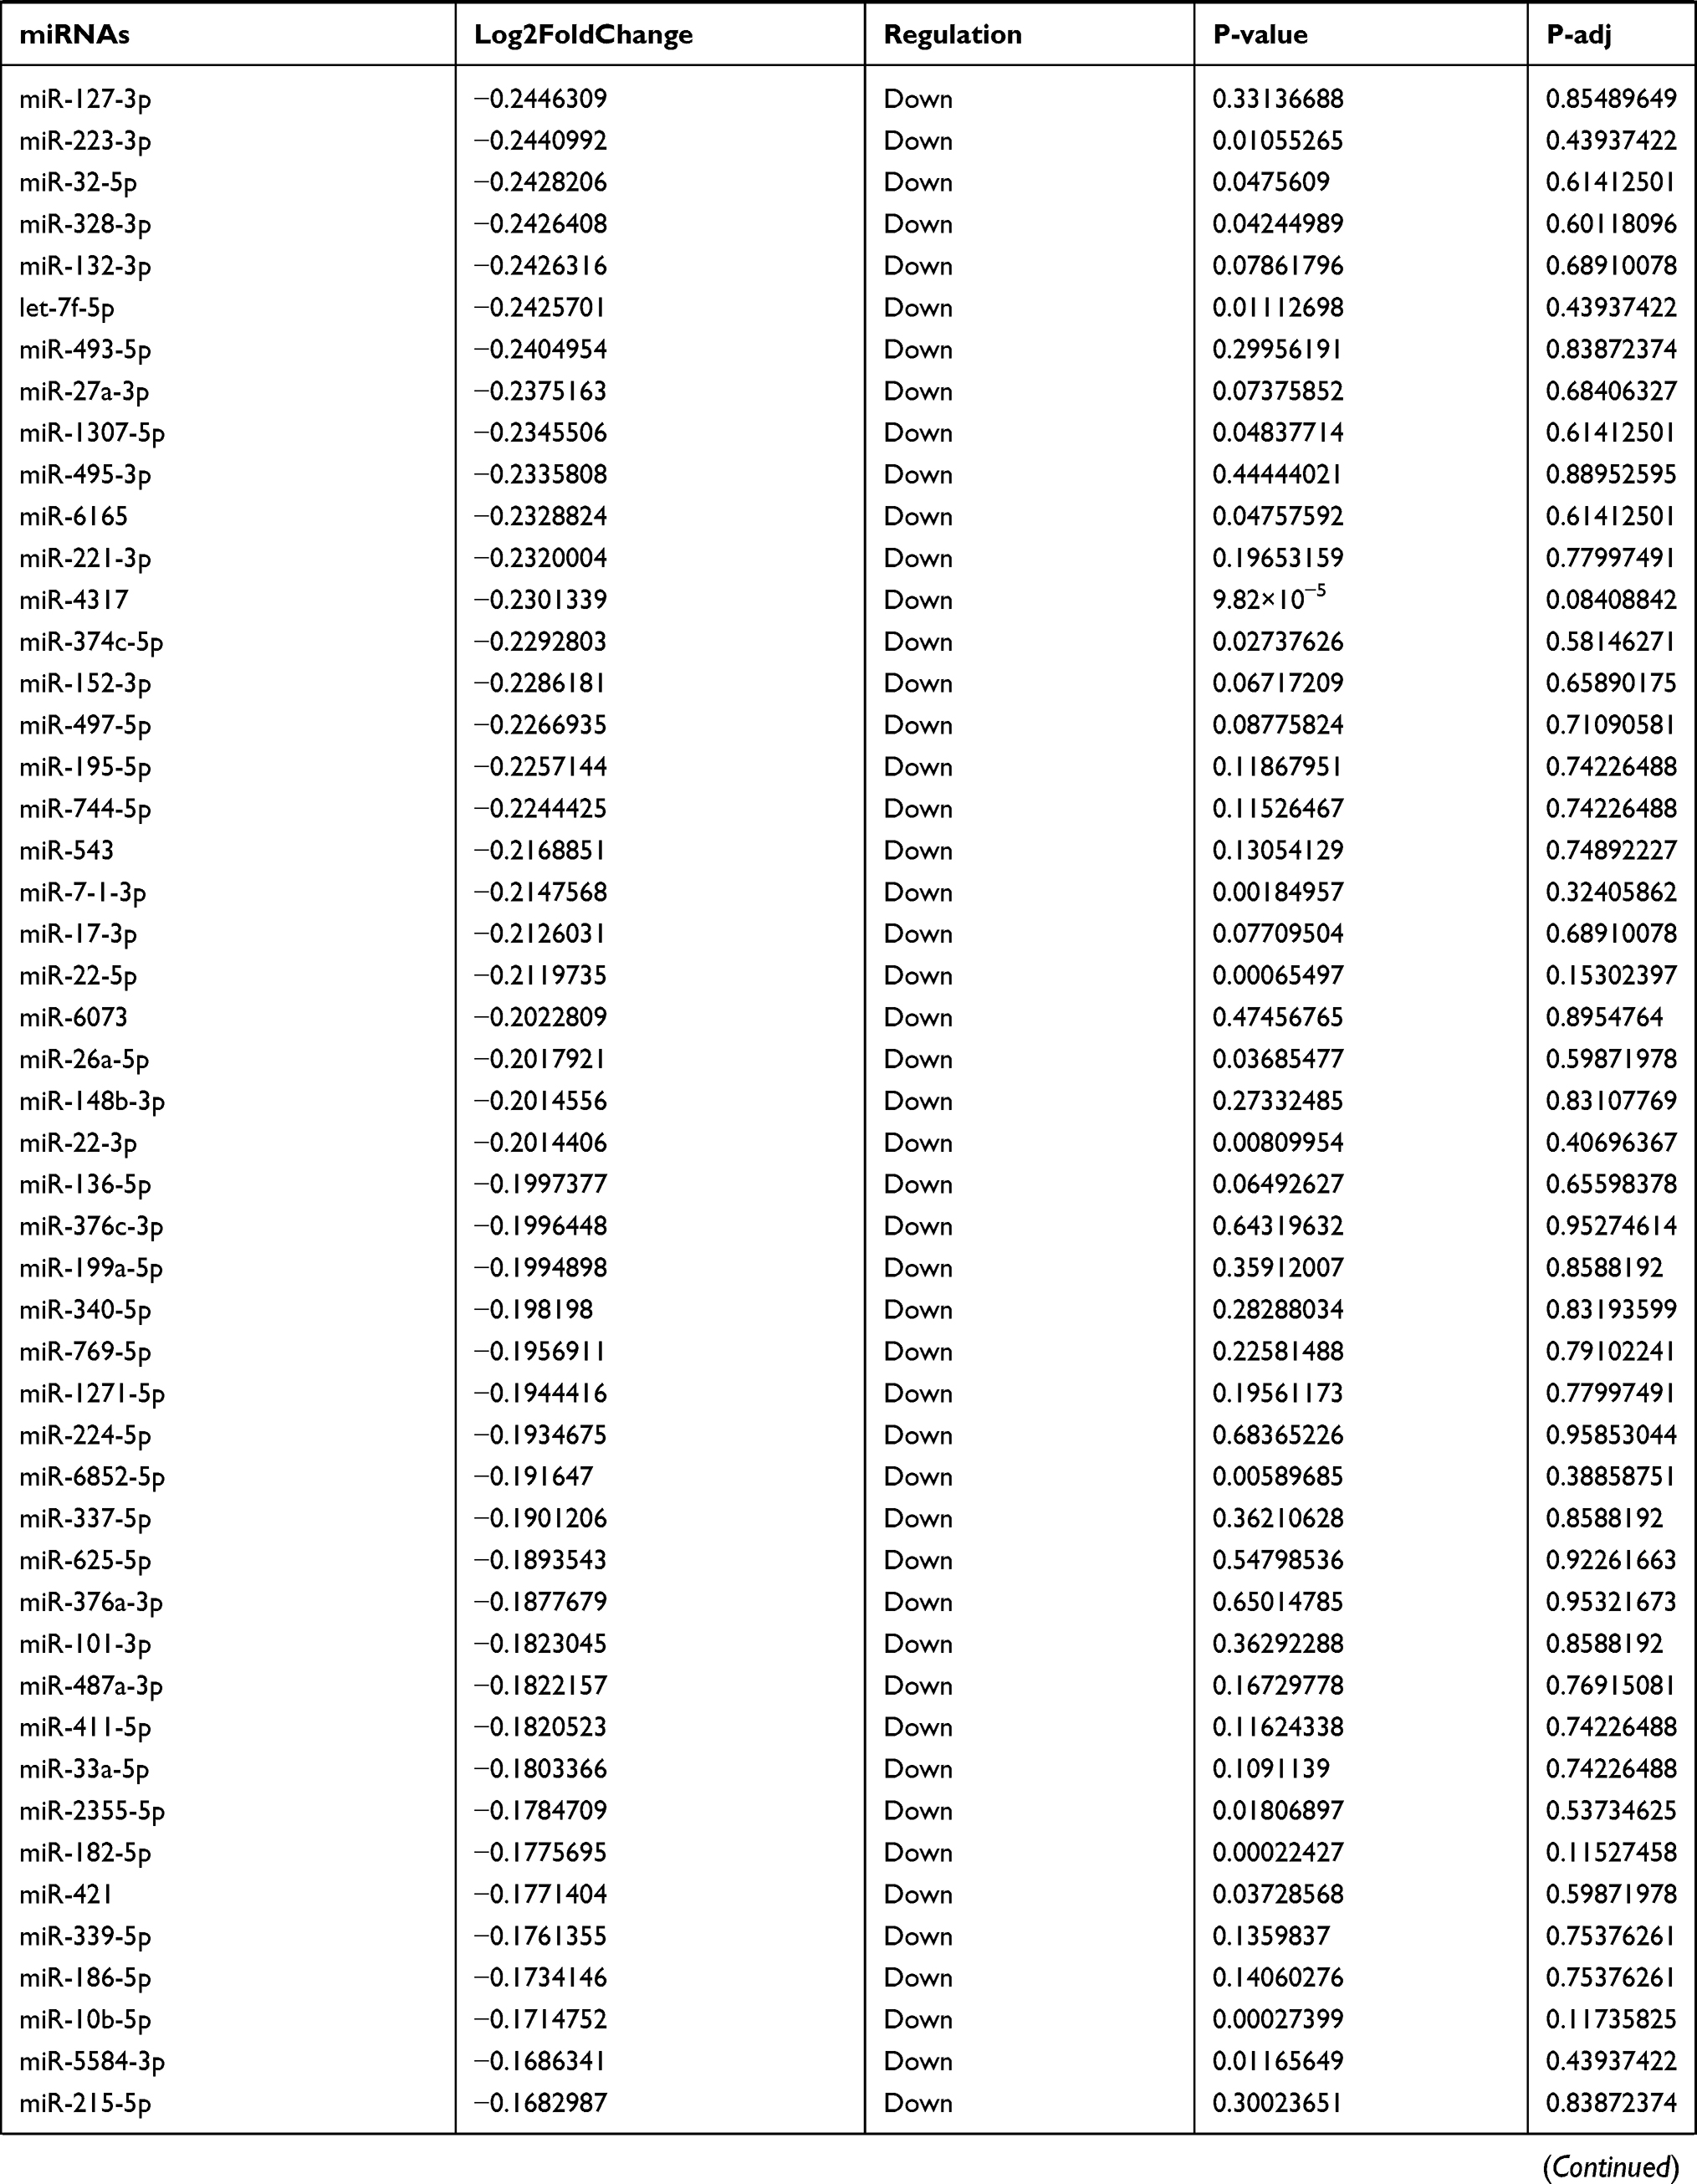
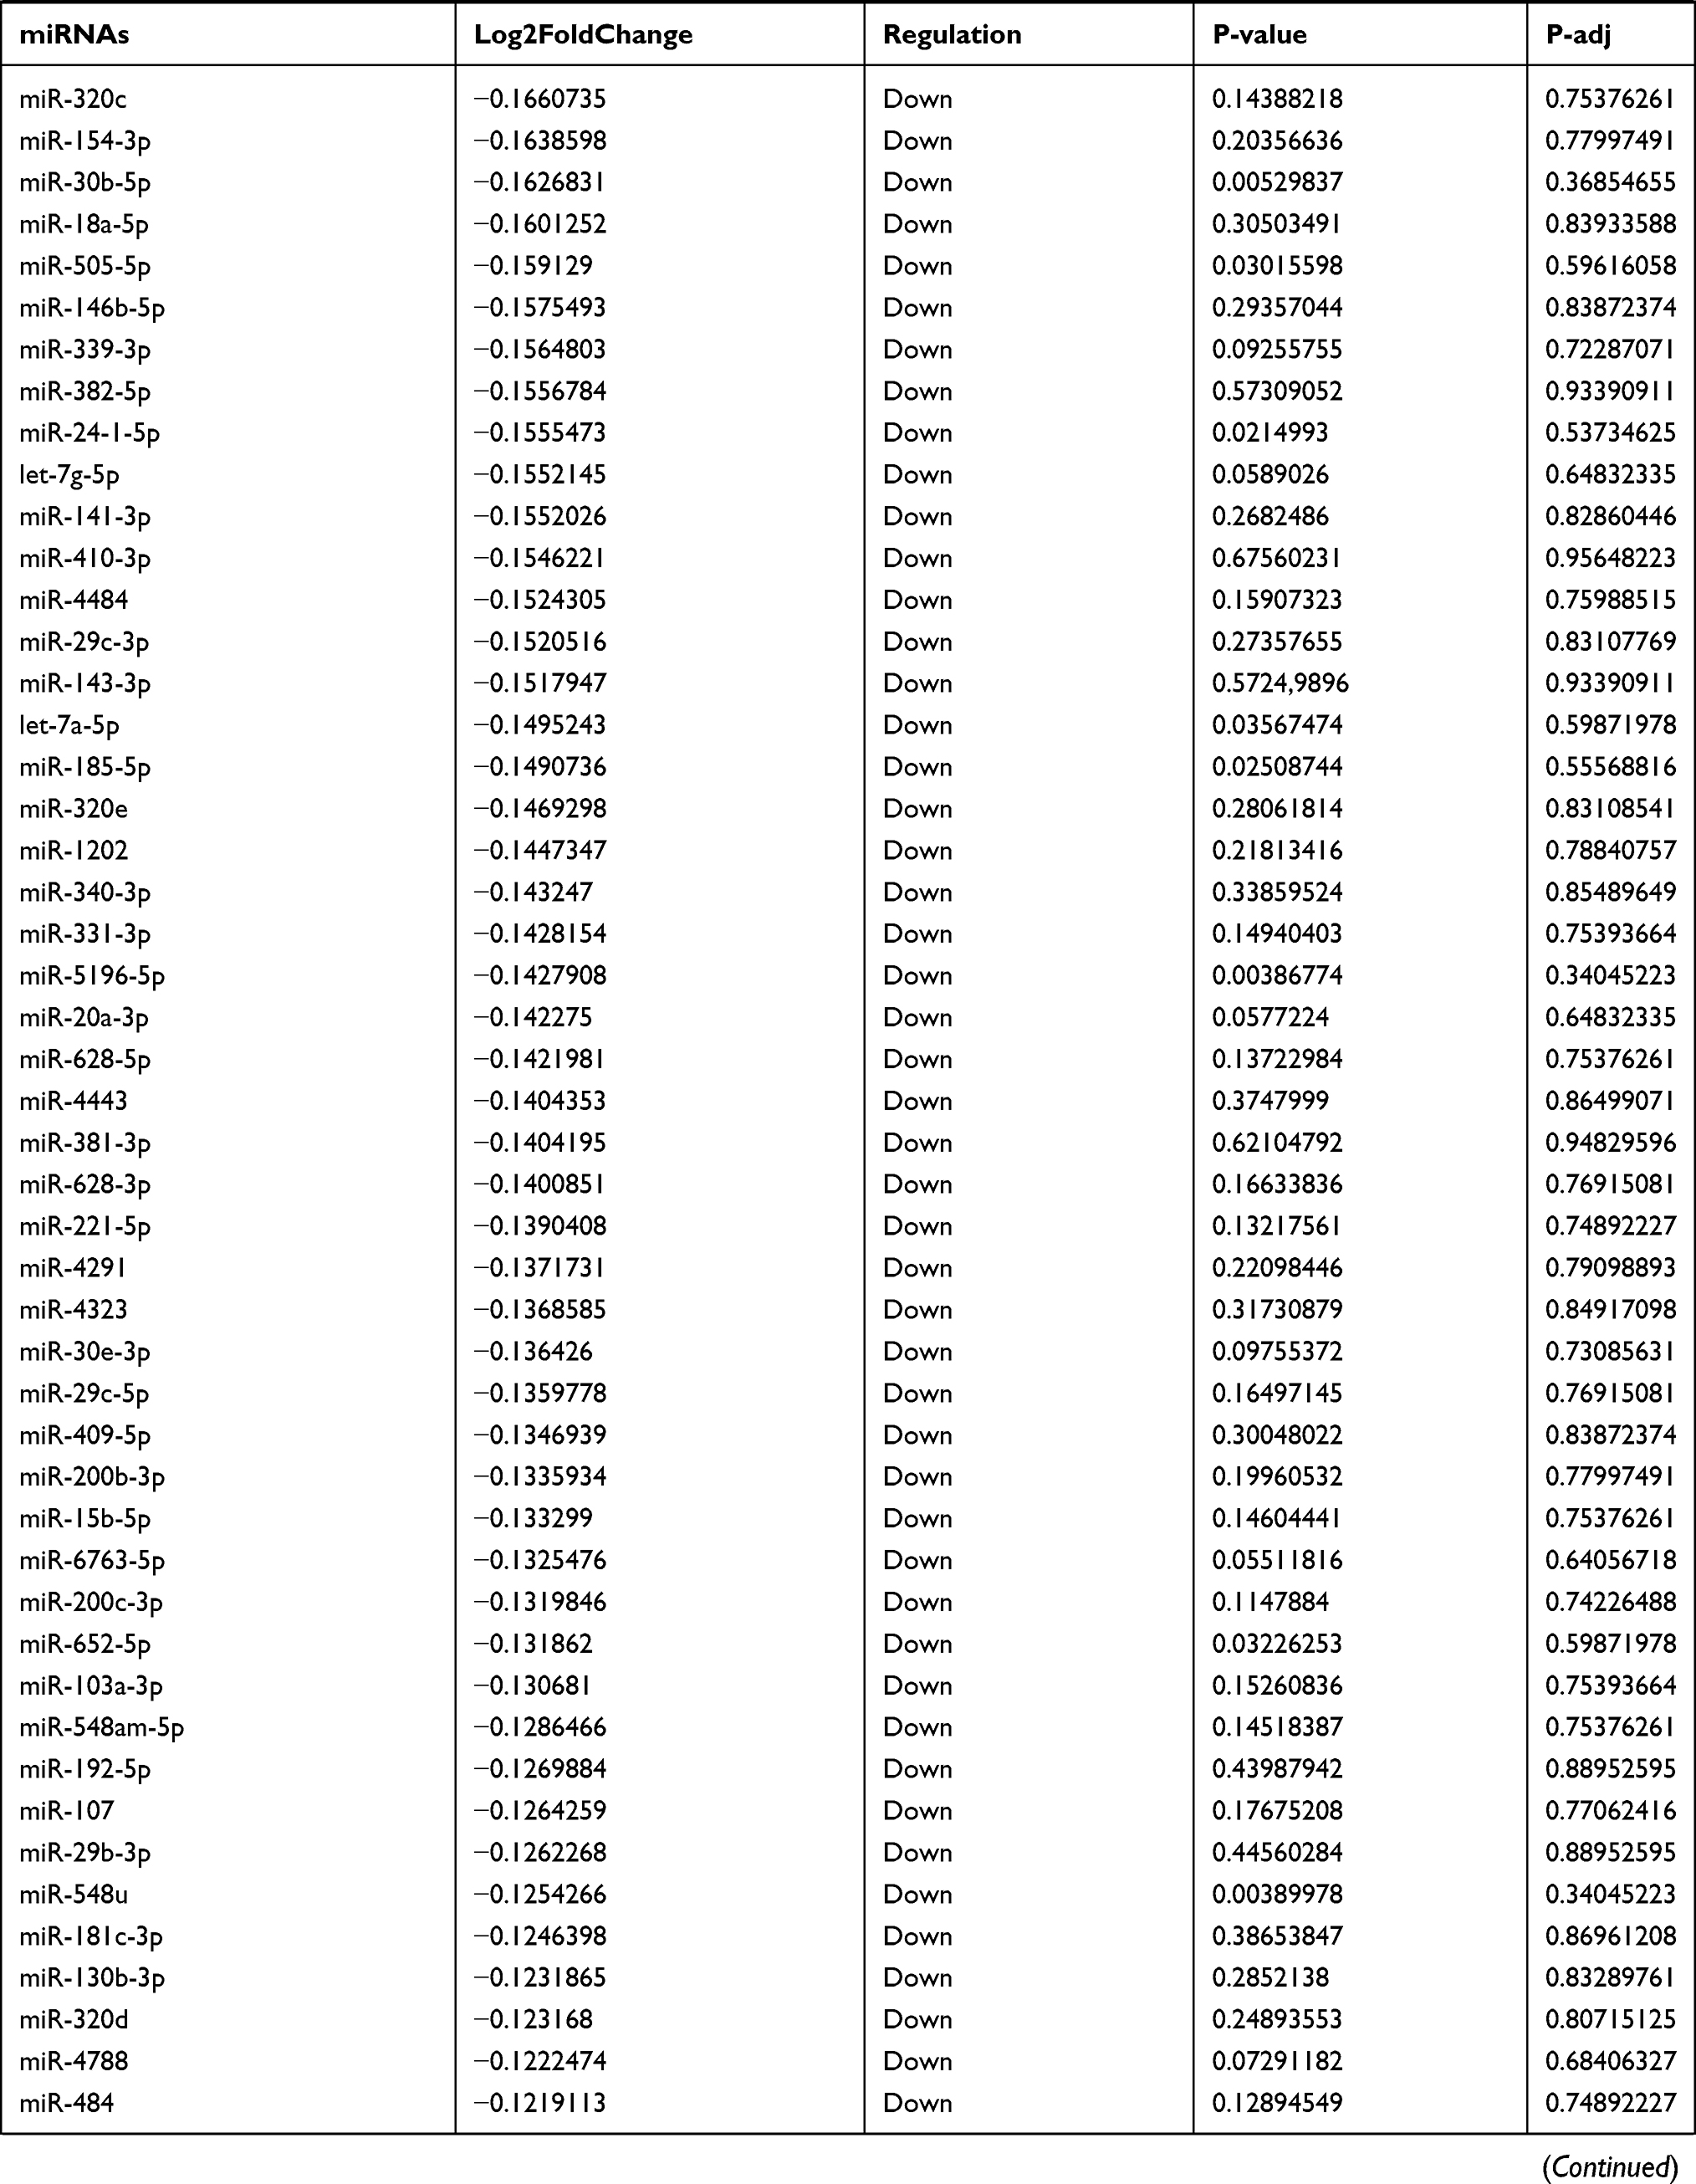
Due to the large number of differentially expressed circRNAs and lncRNAs, we further analyzed their correlation with the DEmRNAs expression and constructed the circRNA-lncRNA-mRNA network using r>0.7 as the screening criteria (Figure 5). Meanwhile, according to the ceRNA hypothesis, lncRNA and circRNA can function as miRNA sponges that bind to miRNA and inhibit the regulation of miRNAs on its target mRNAs, thereby indirectly regulating gene expression. Thus, we predicted the miRNAs targeting the DEcircRNAs and DElncRNAs and analyzed their expression using the dataset GSE133217 (Table 9). After screening, the circRNA-lncRNA-miRNA-mRNA network was visualized using Cytoscape software (Figure 6). For example, hsa_circ_0002202 was identified as ceRNA of miR-495-3p, miR-668-3p, miR-508-3p, miR-487a-3p, which targeted GREM2. lncRNA LINC01007 regulated HSPB8 by competing for miR-33b-5p, miR-1321, and miR-455-3p.
 |  |  |
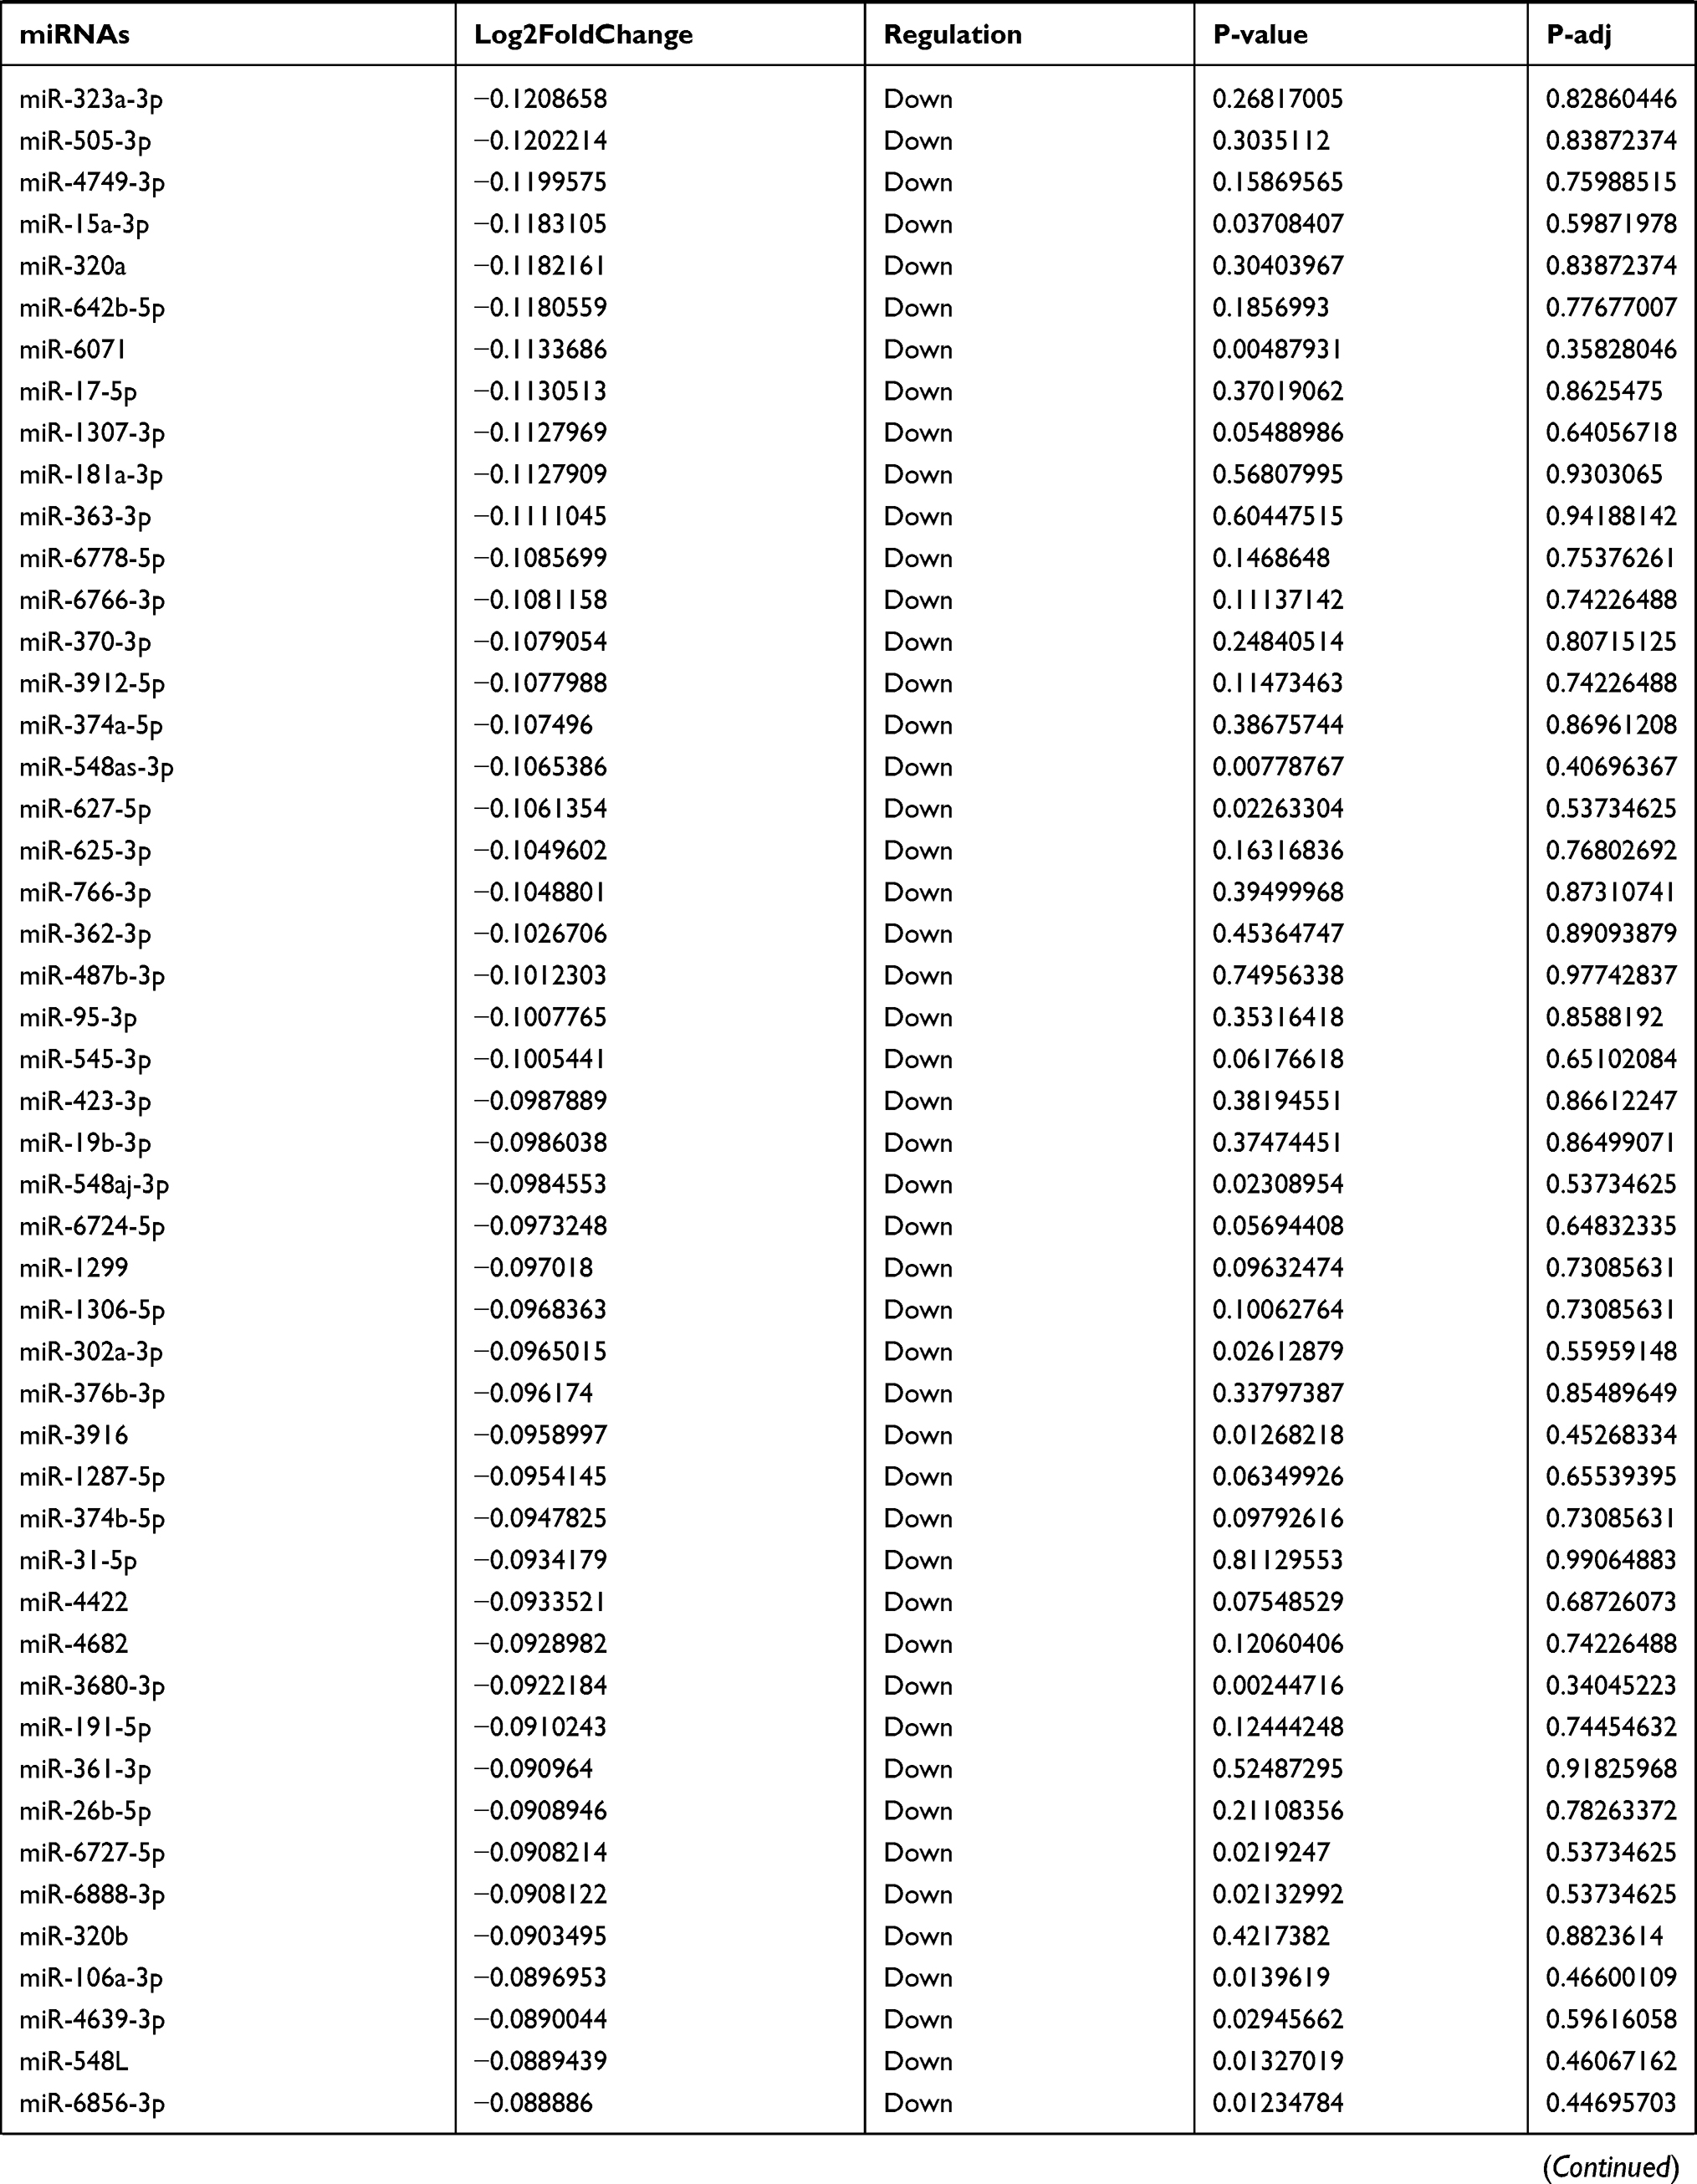 | 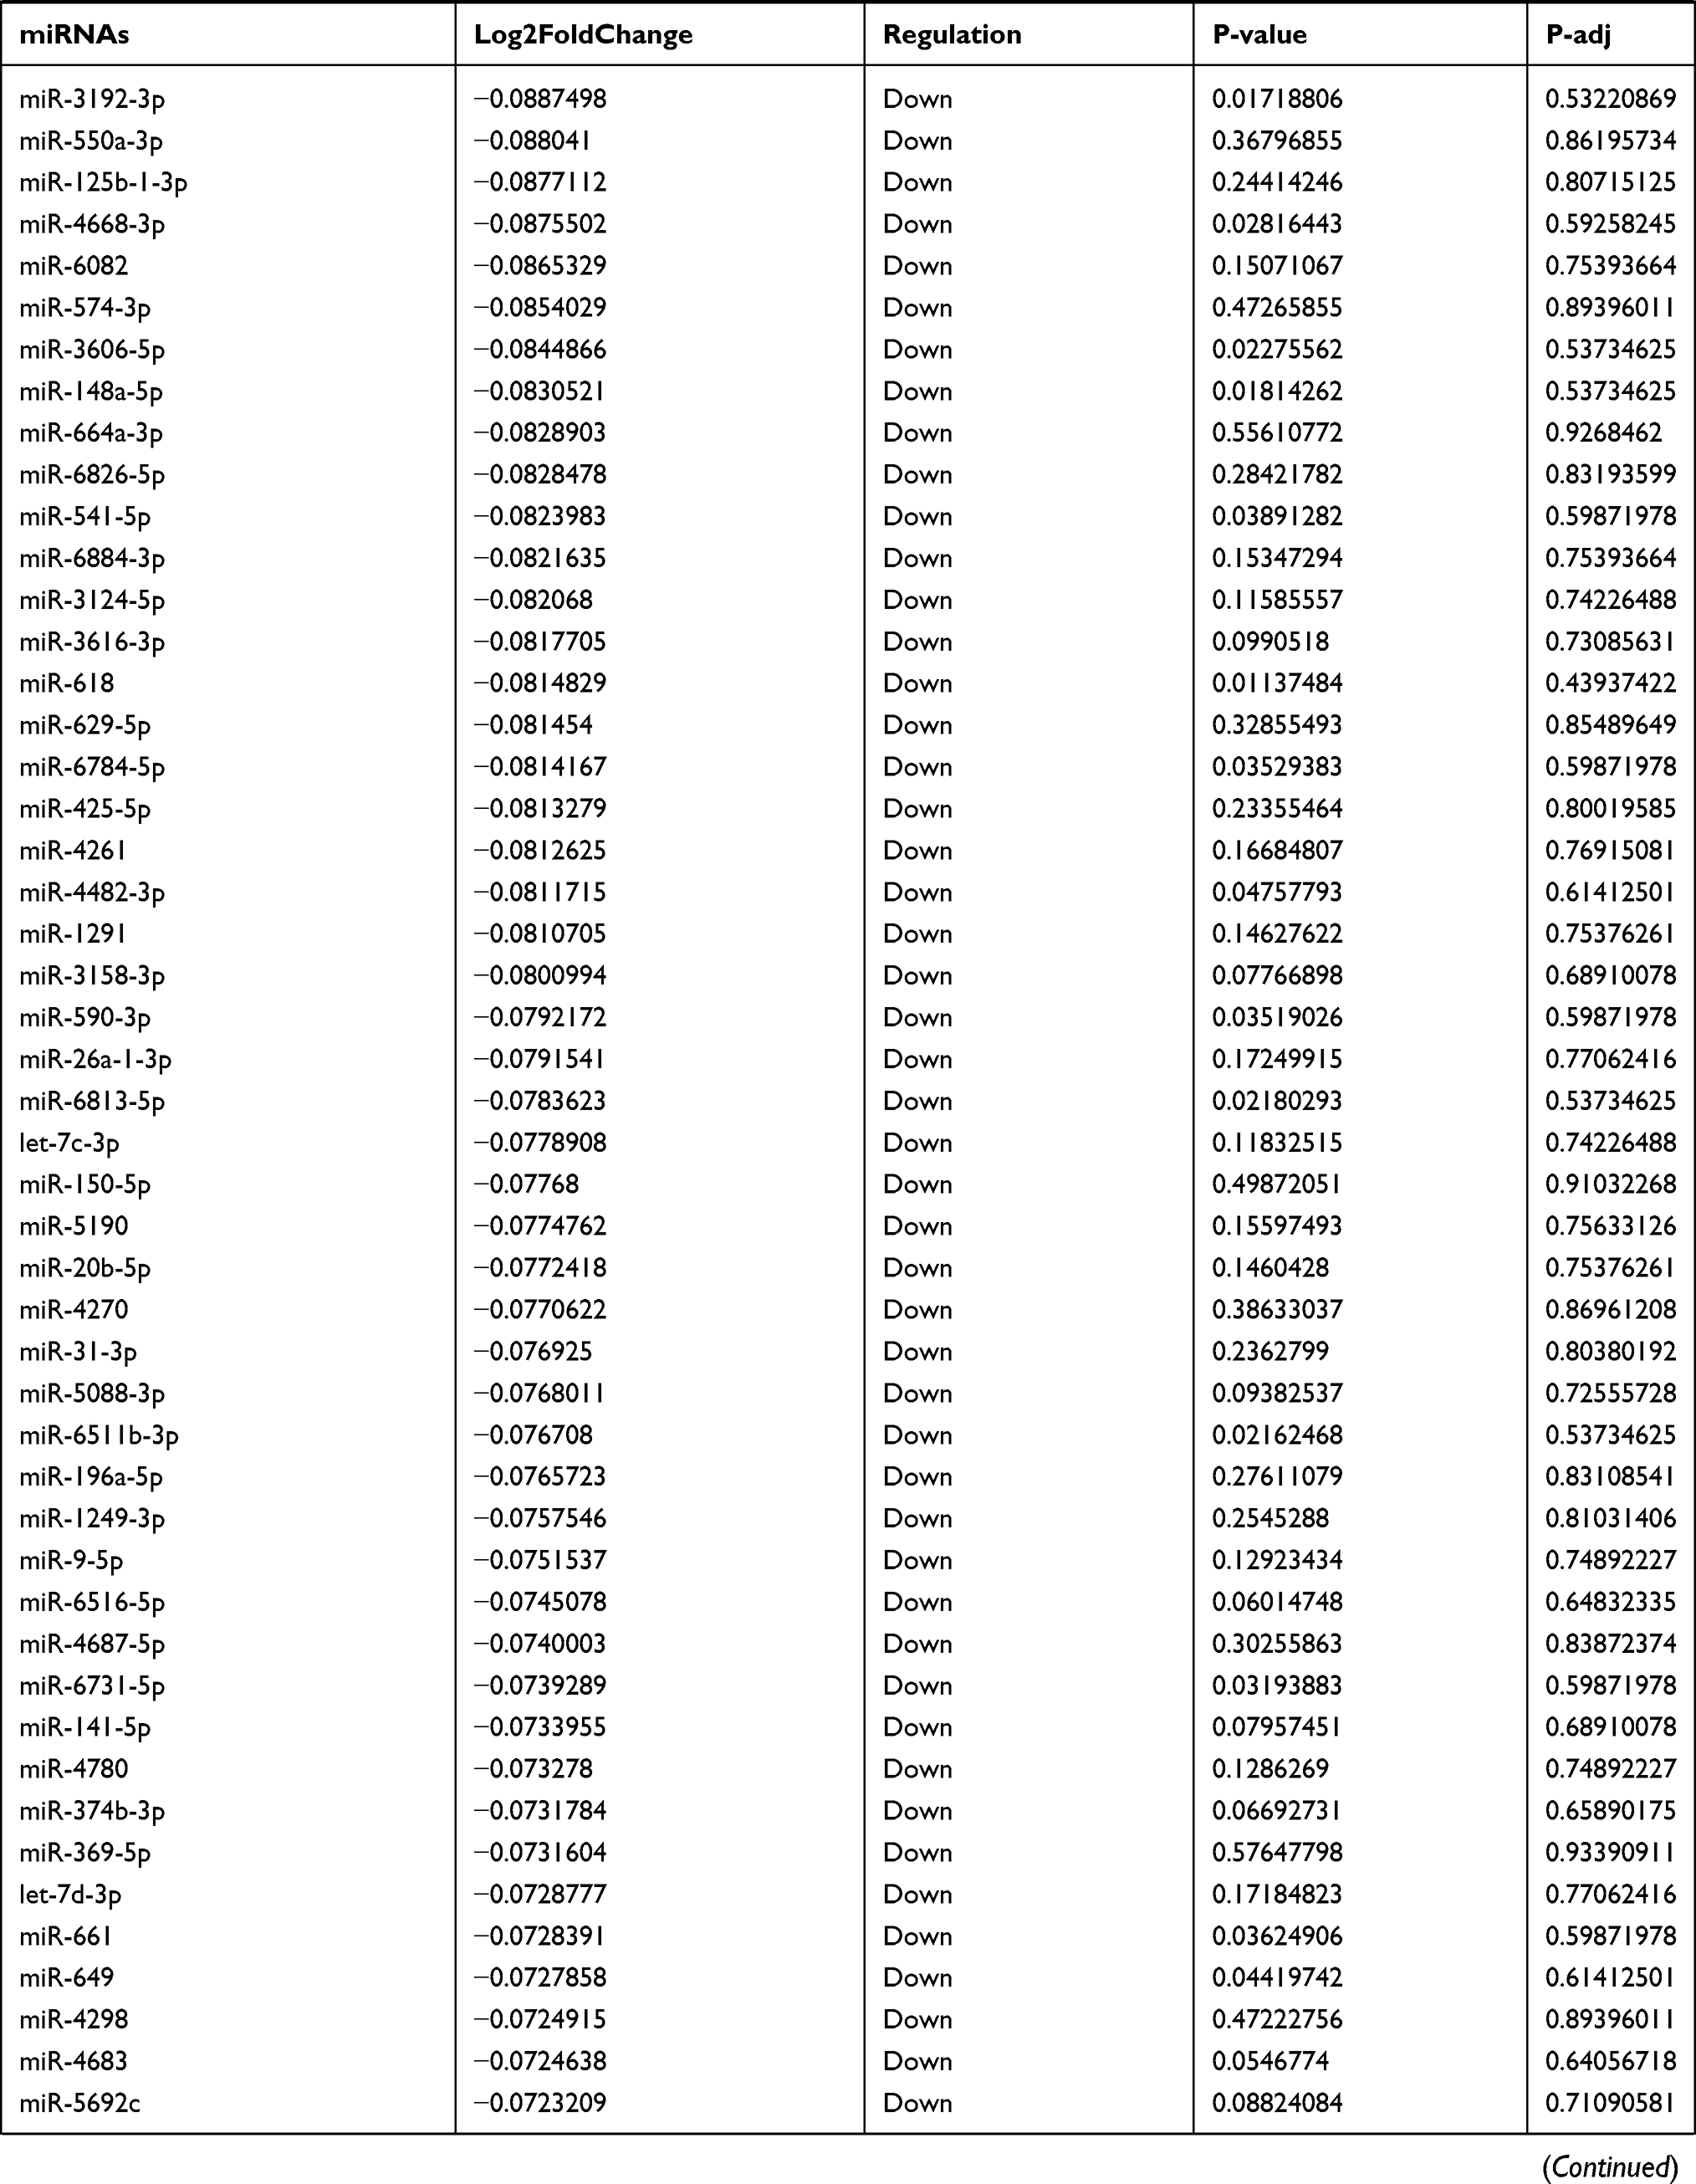 | 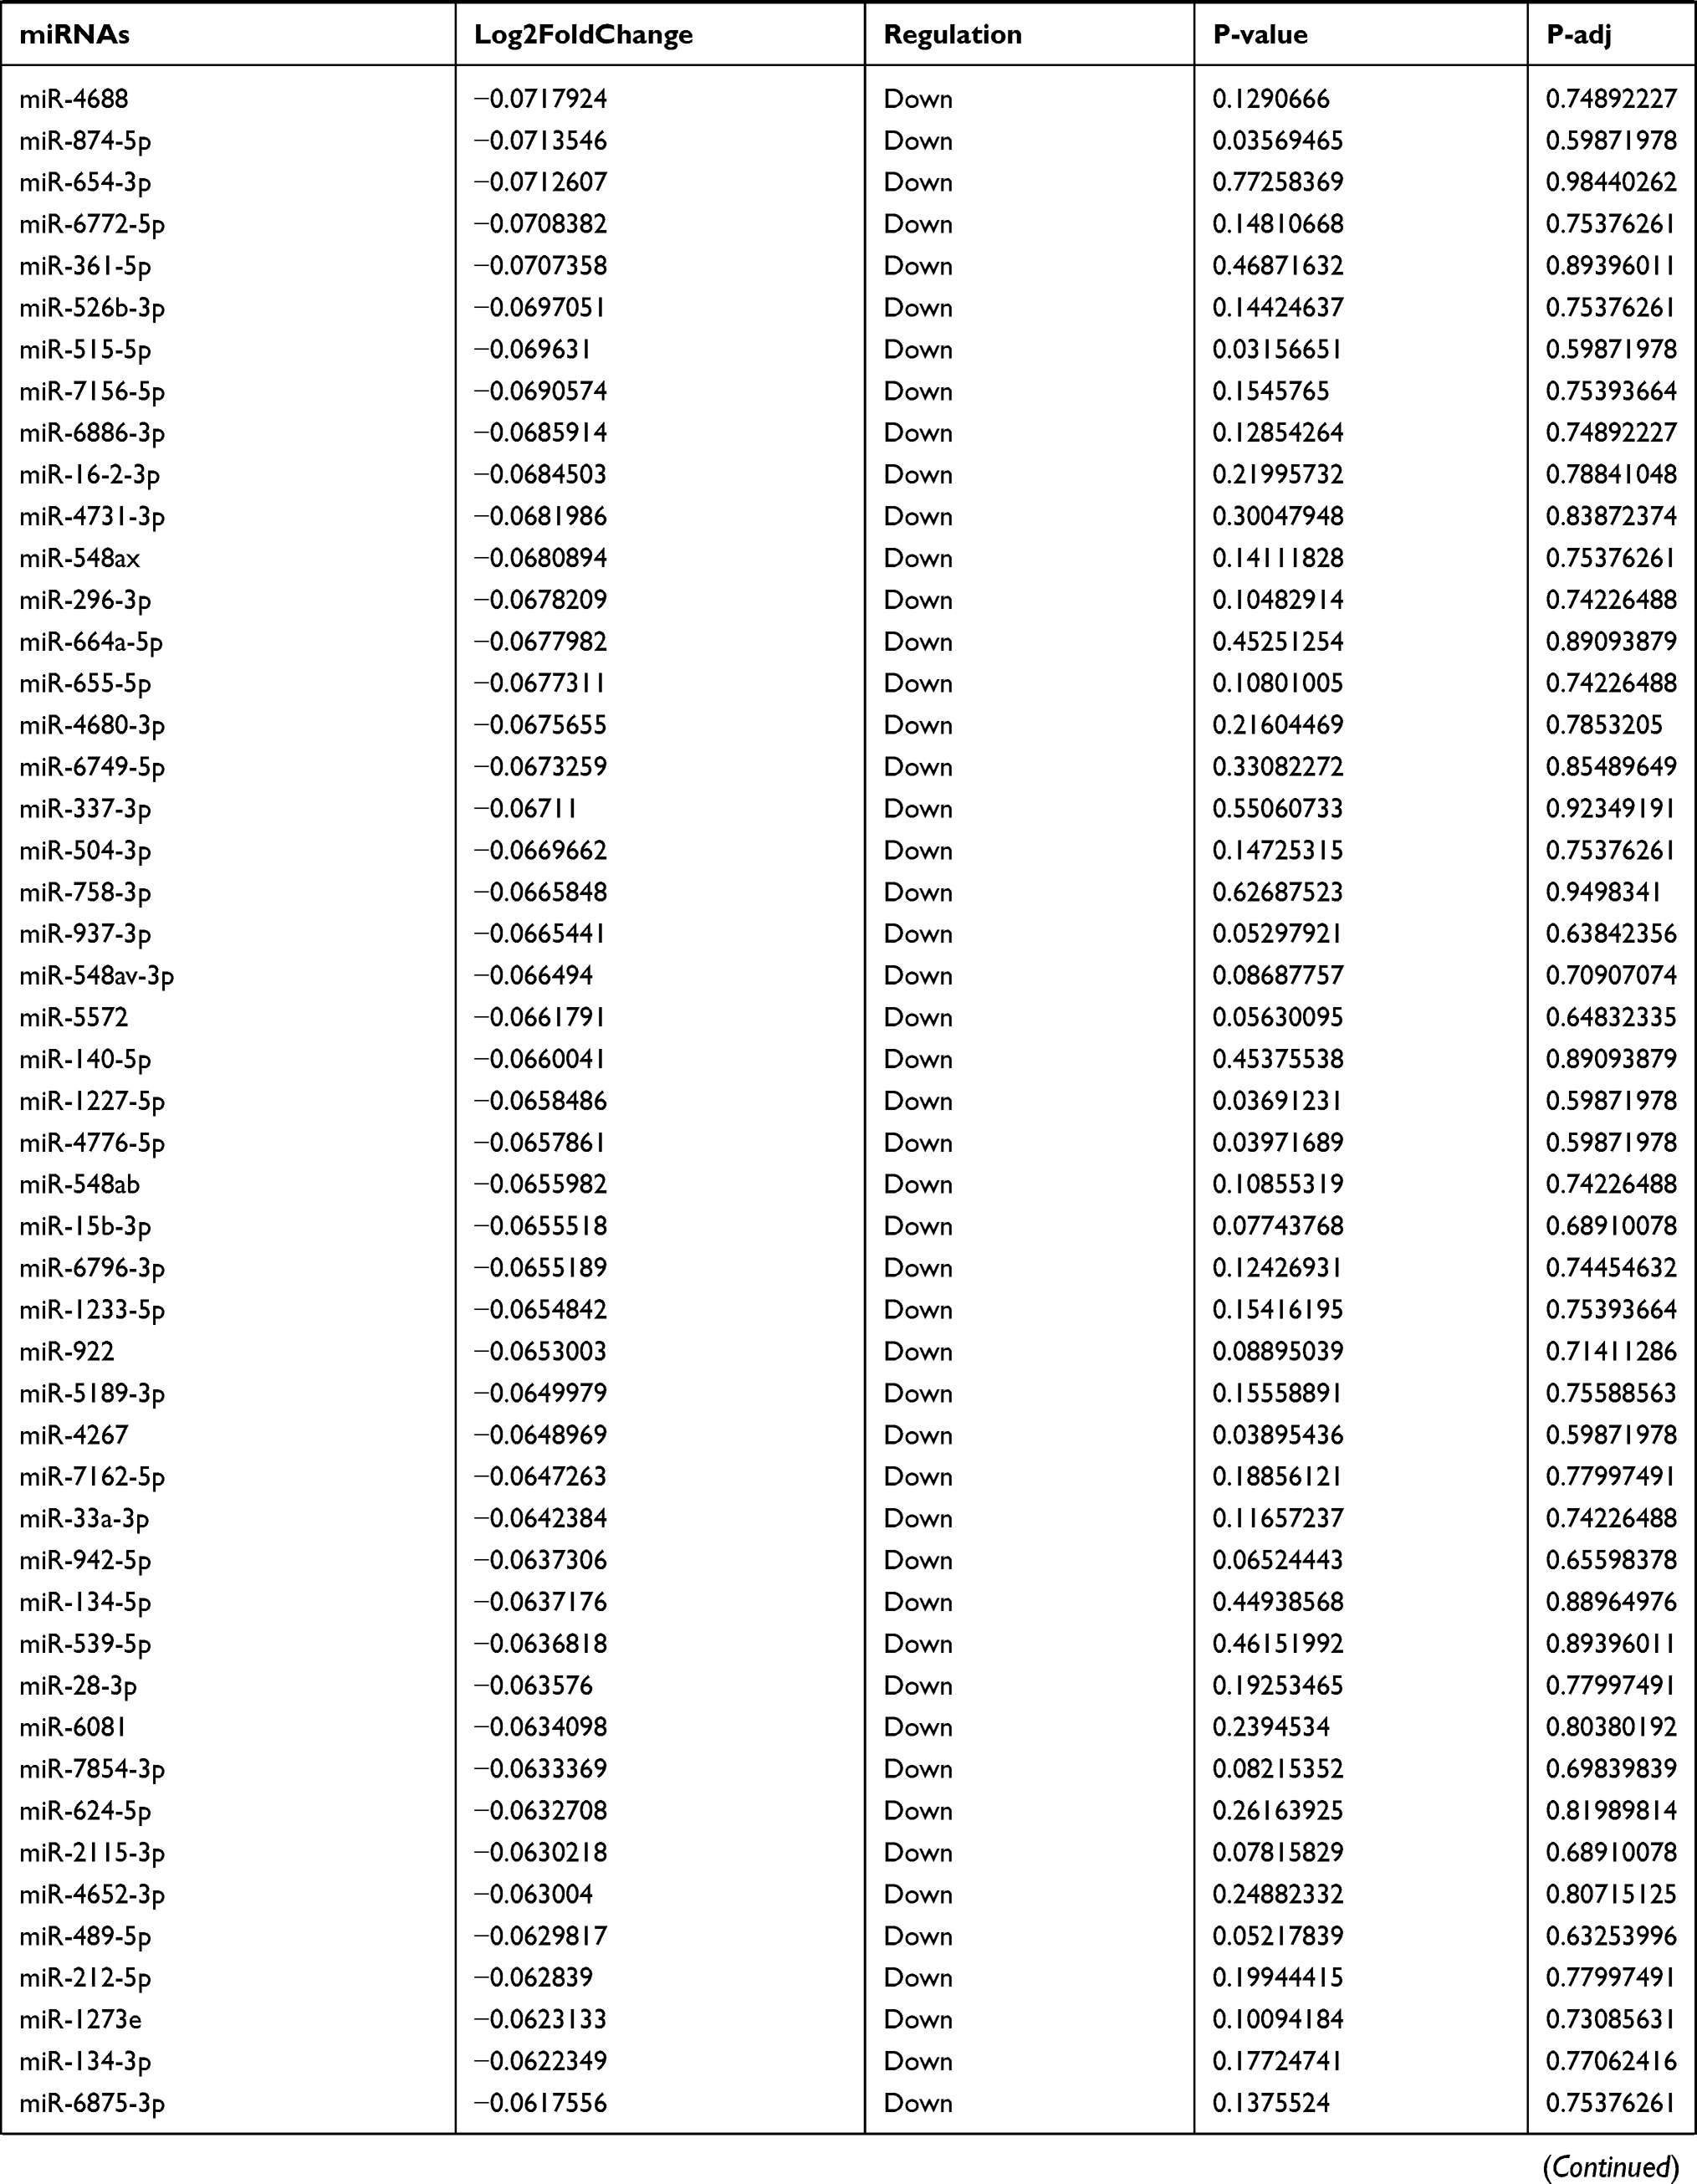 | 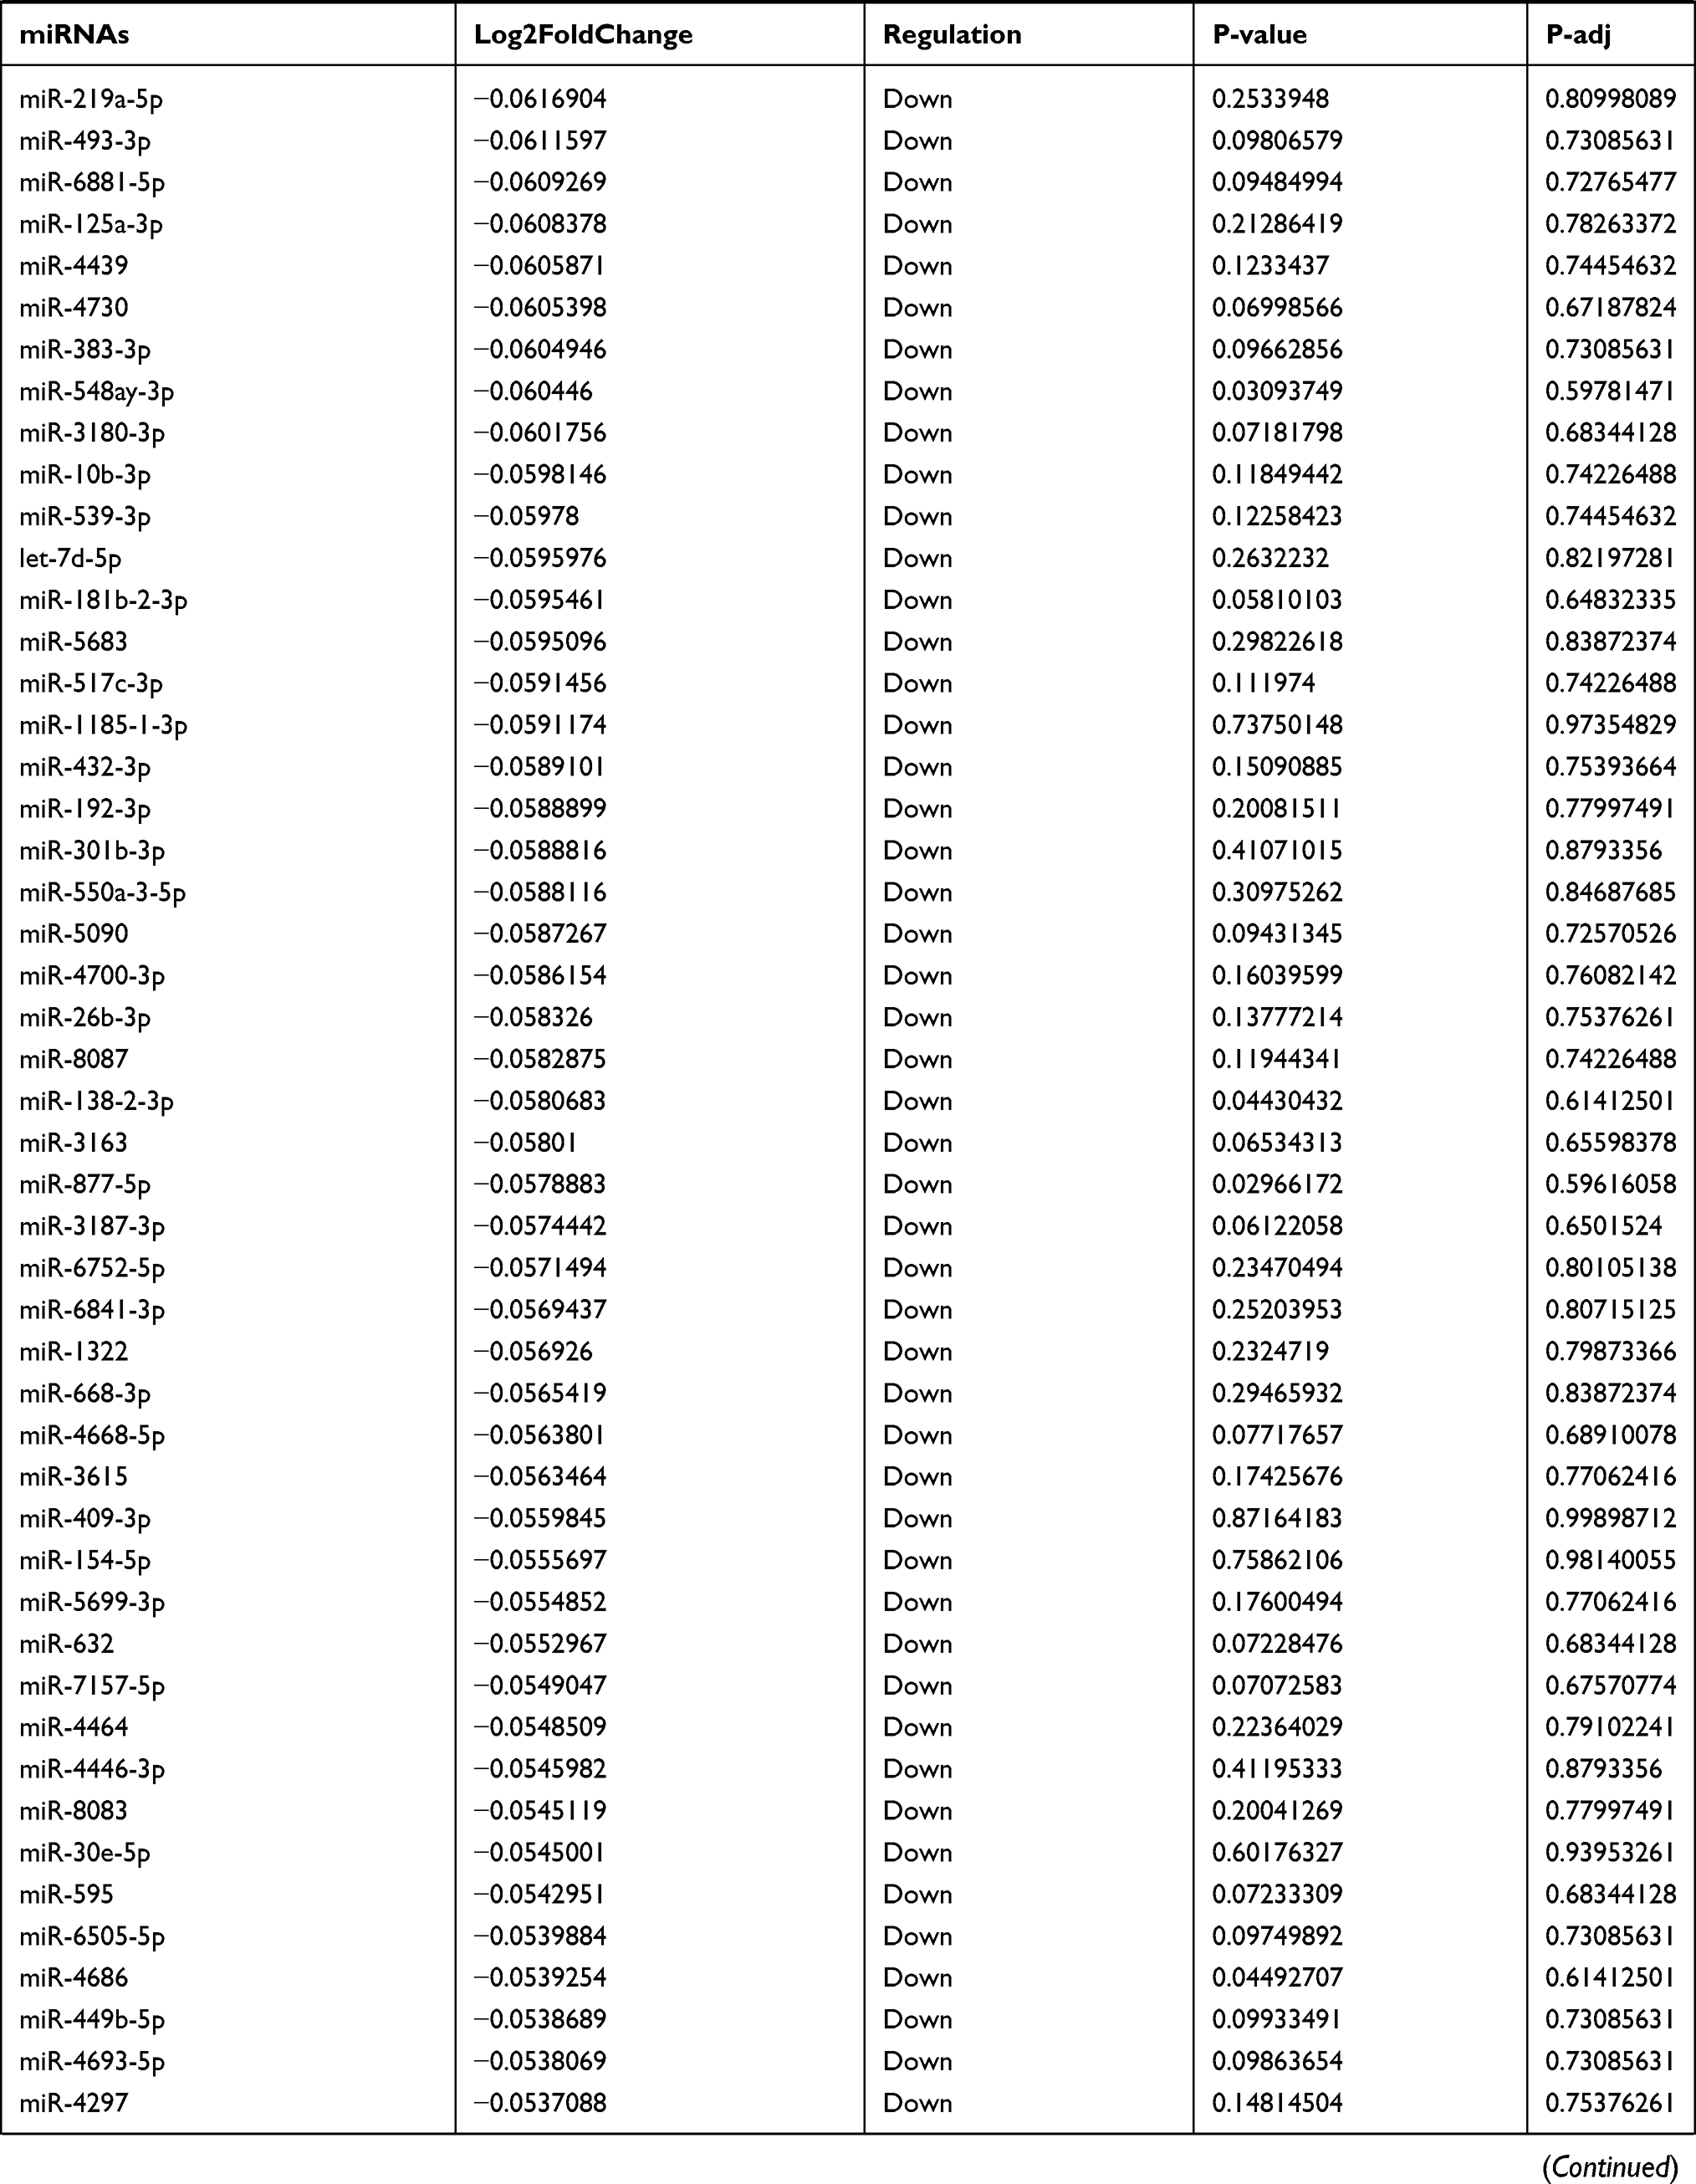 | 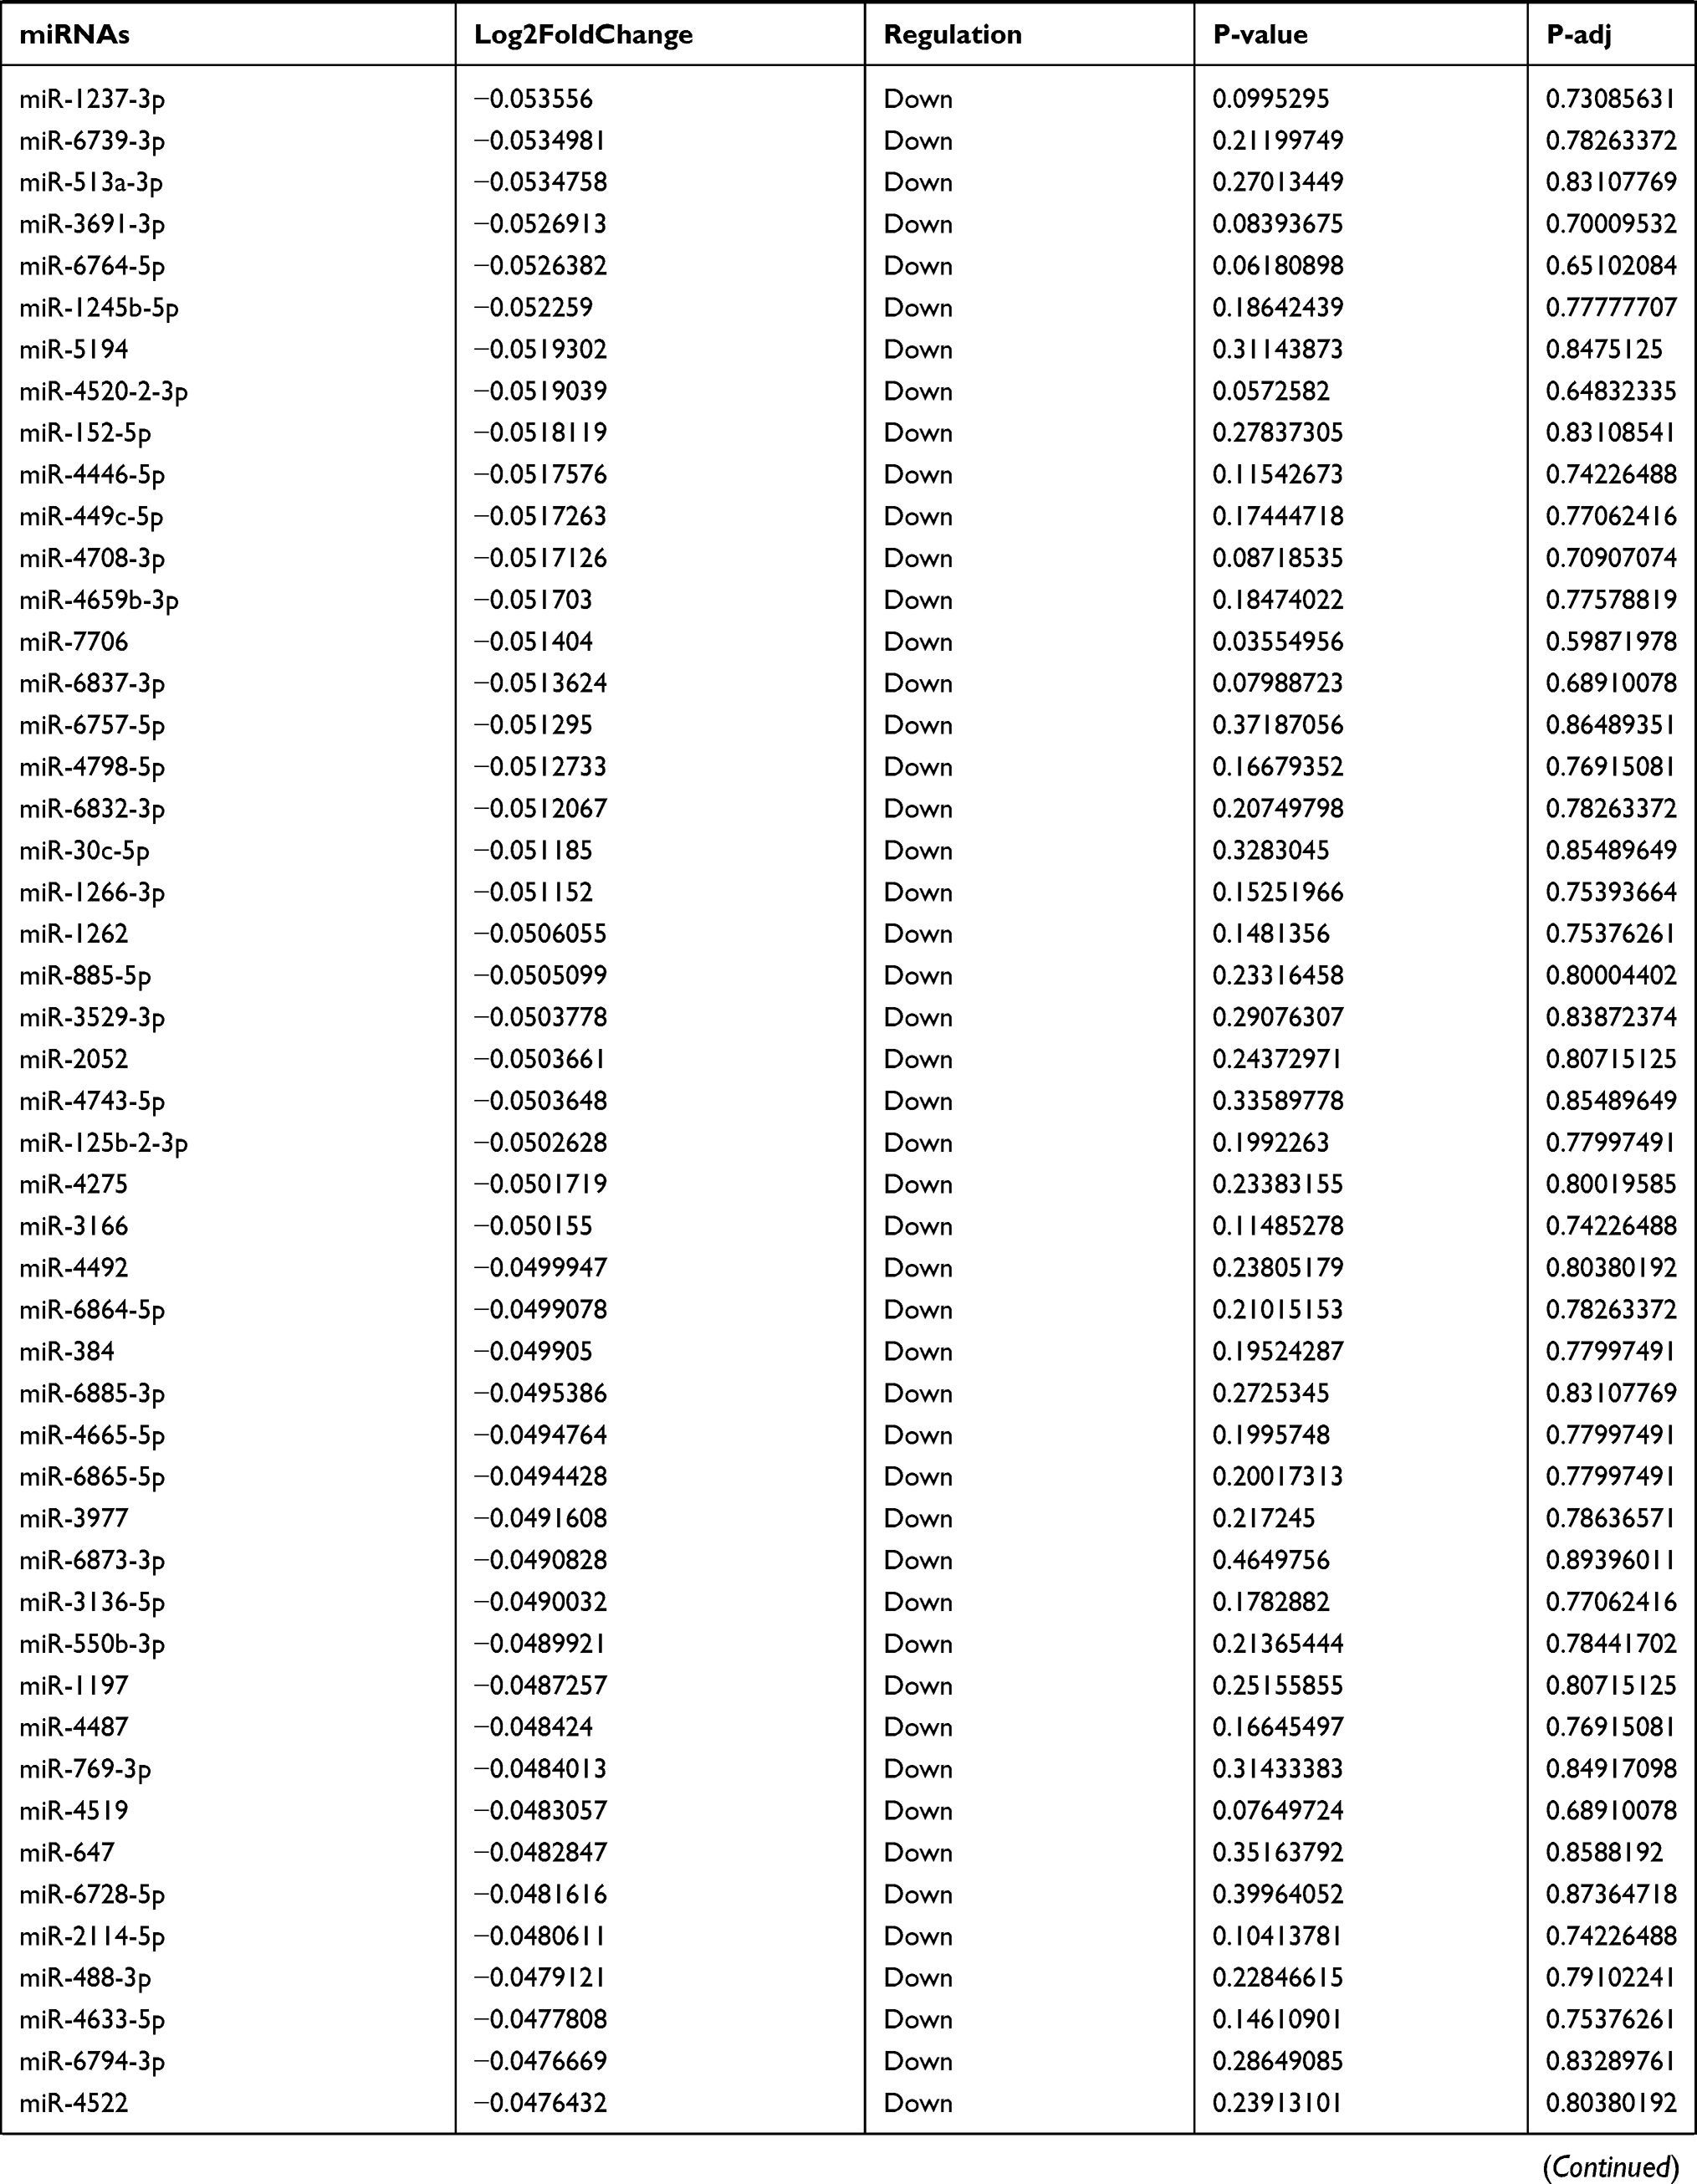 | 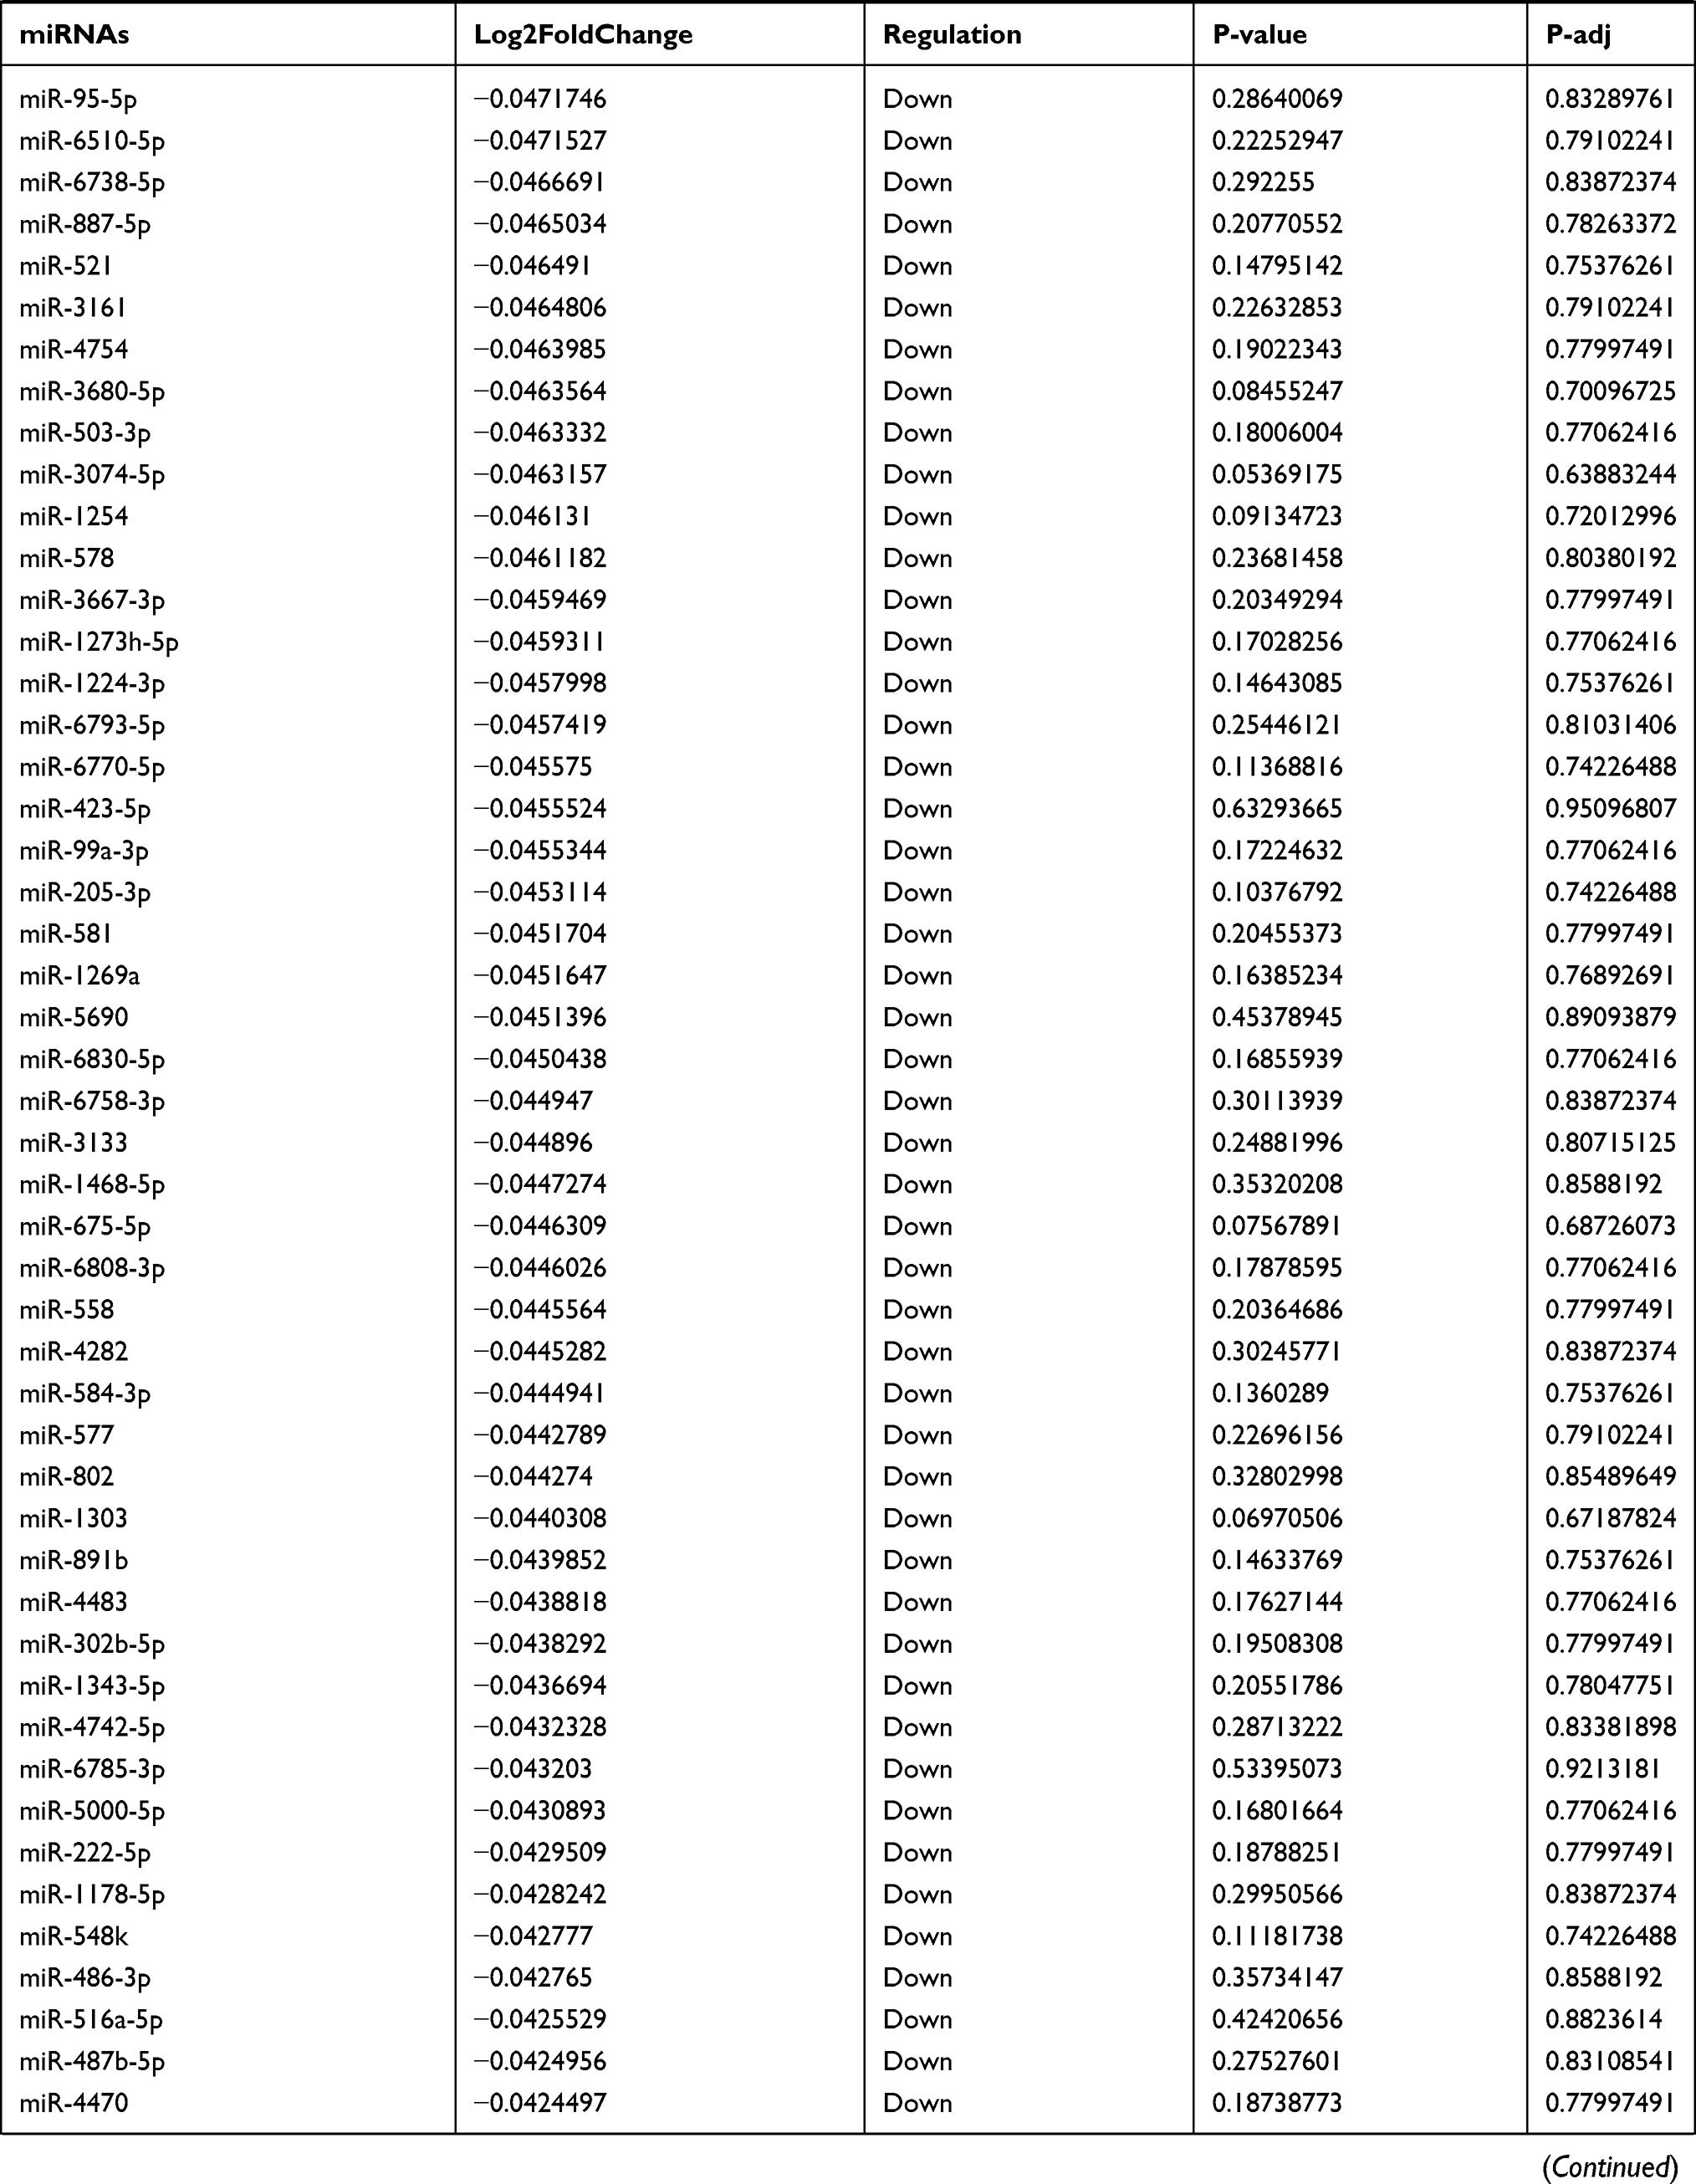 | 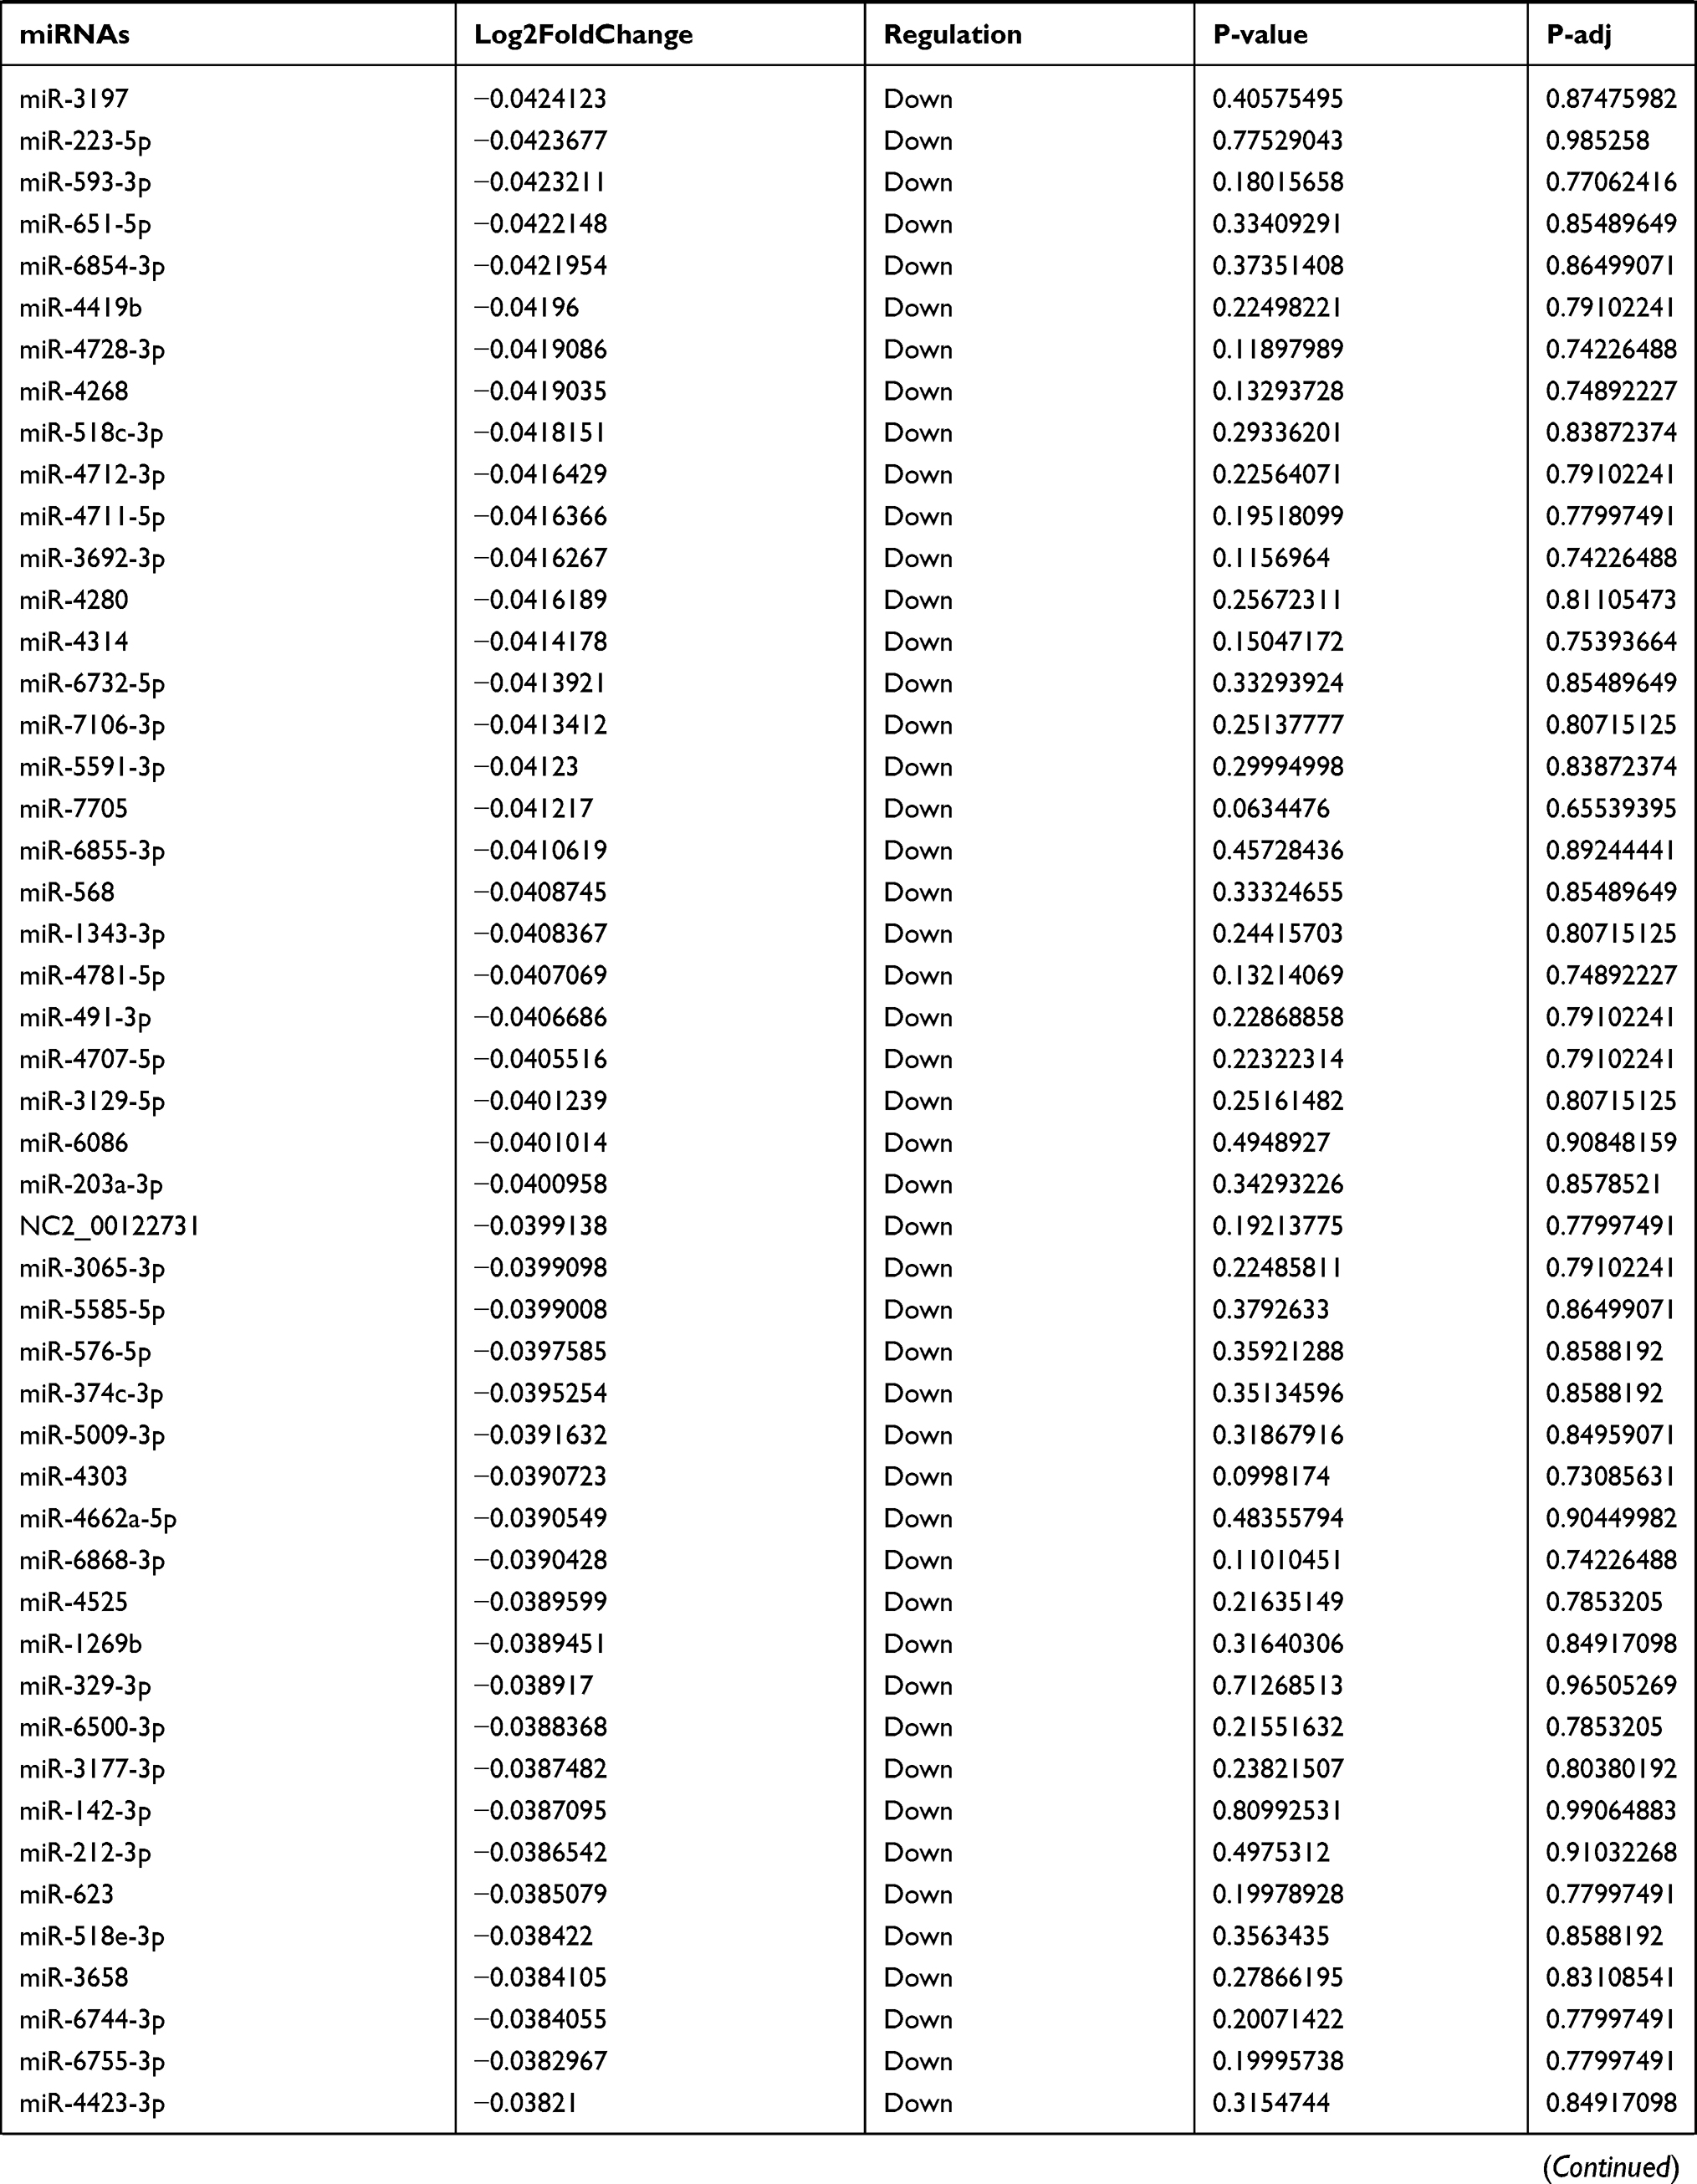 | 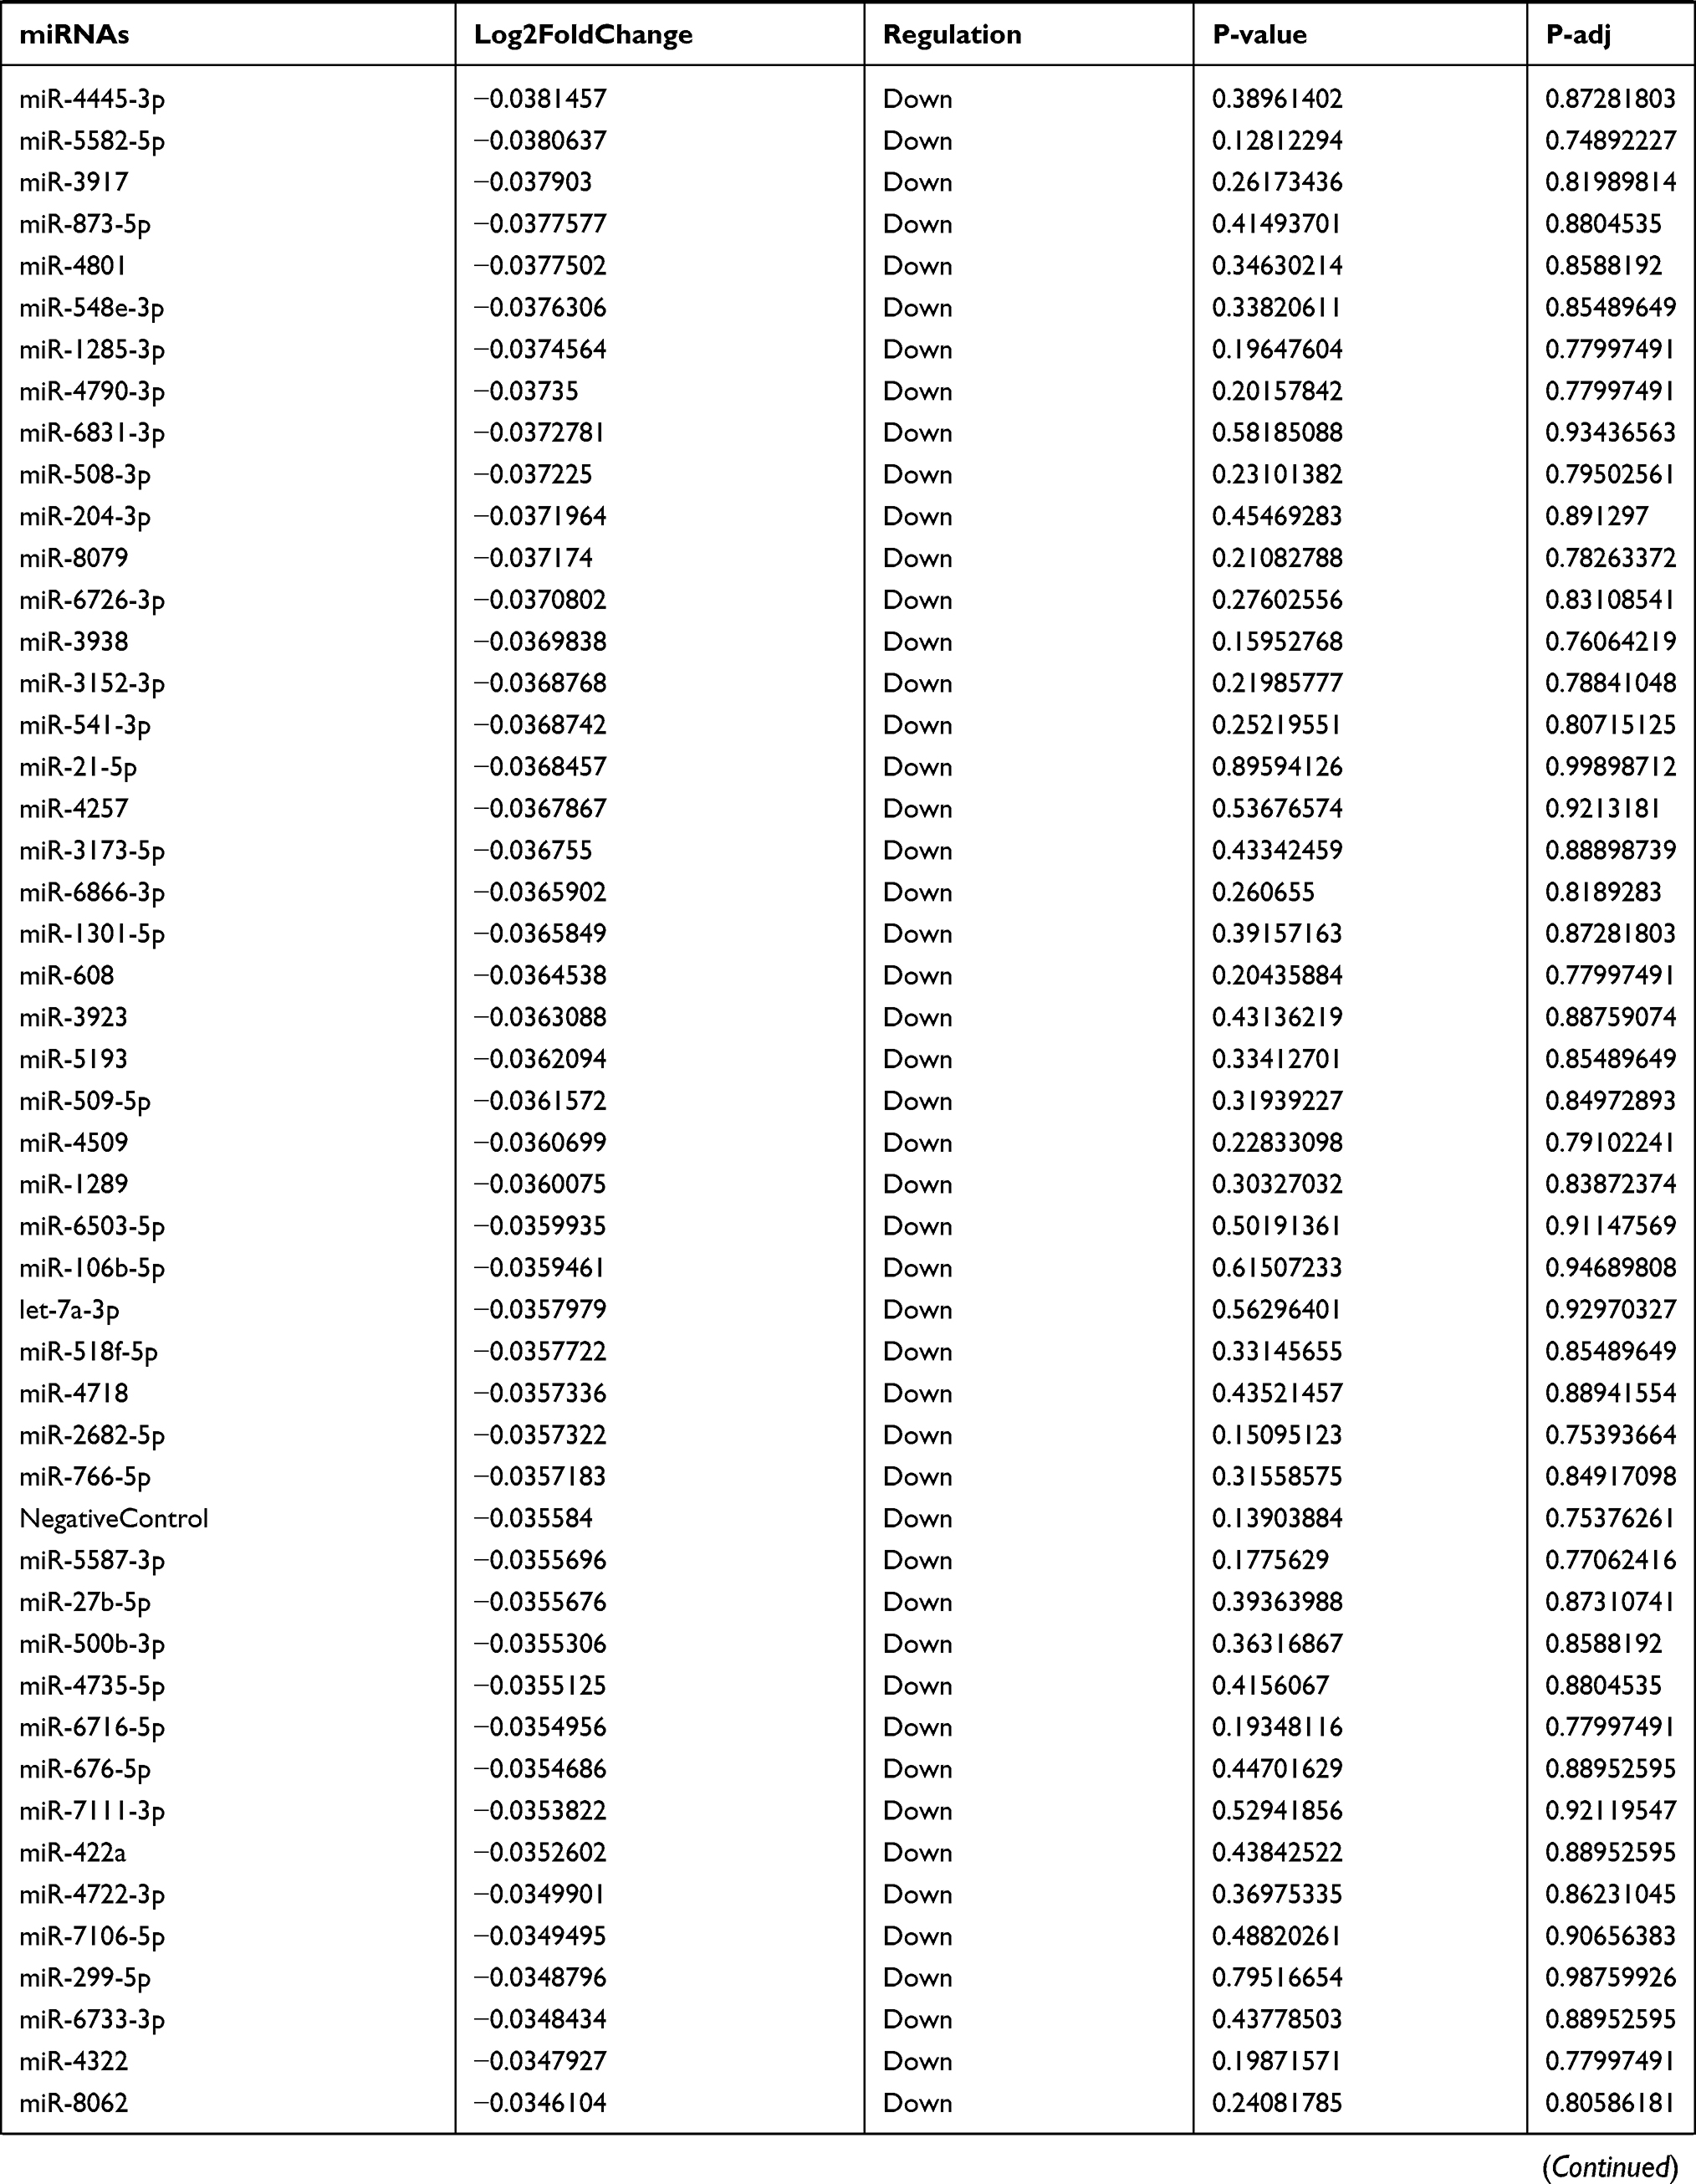 | 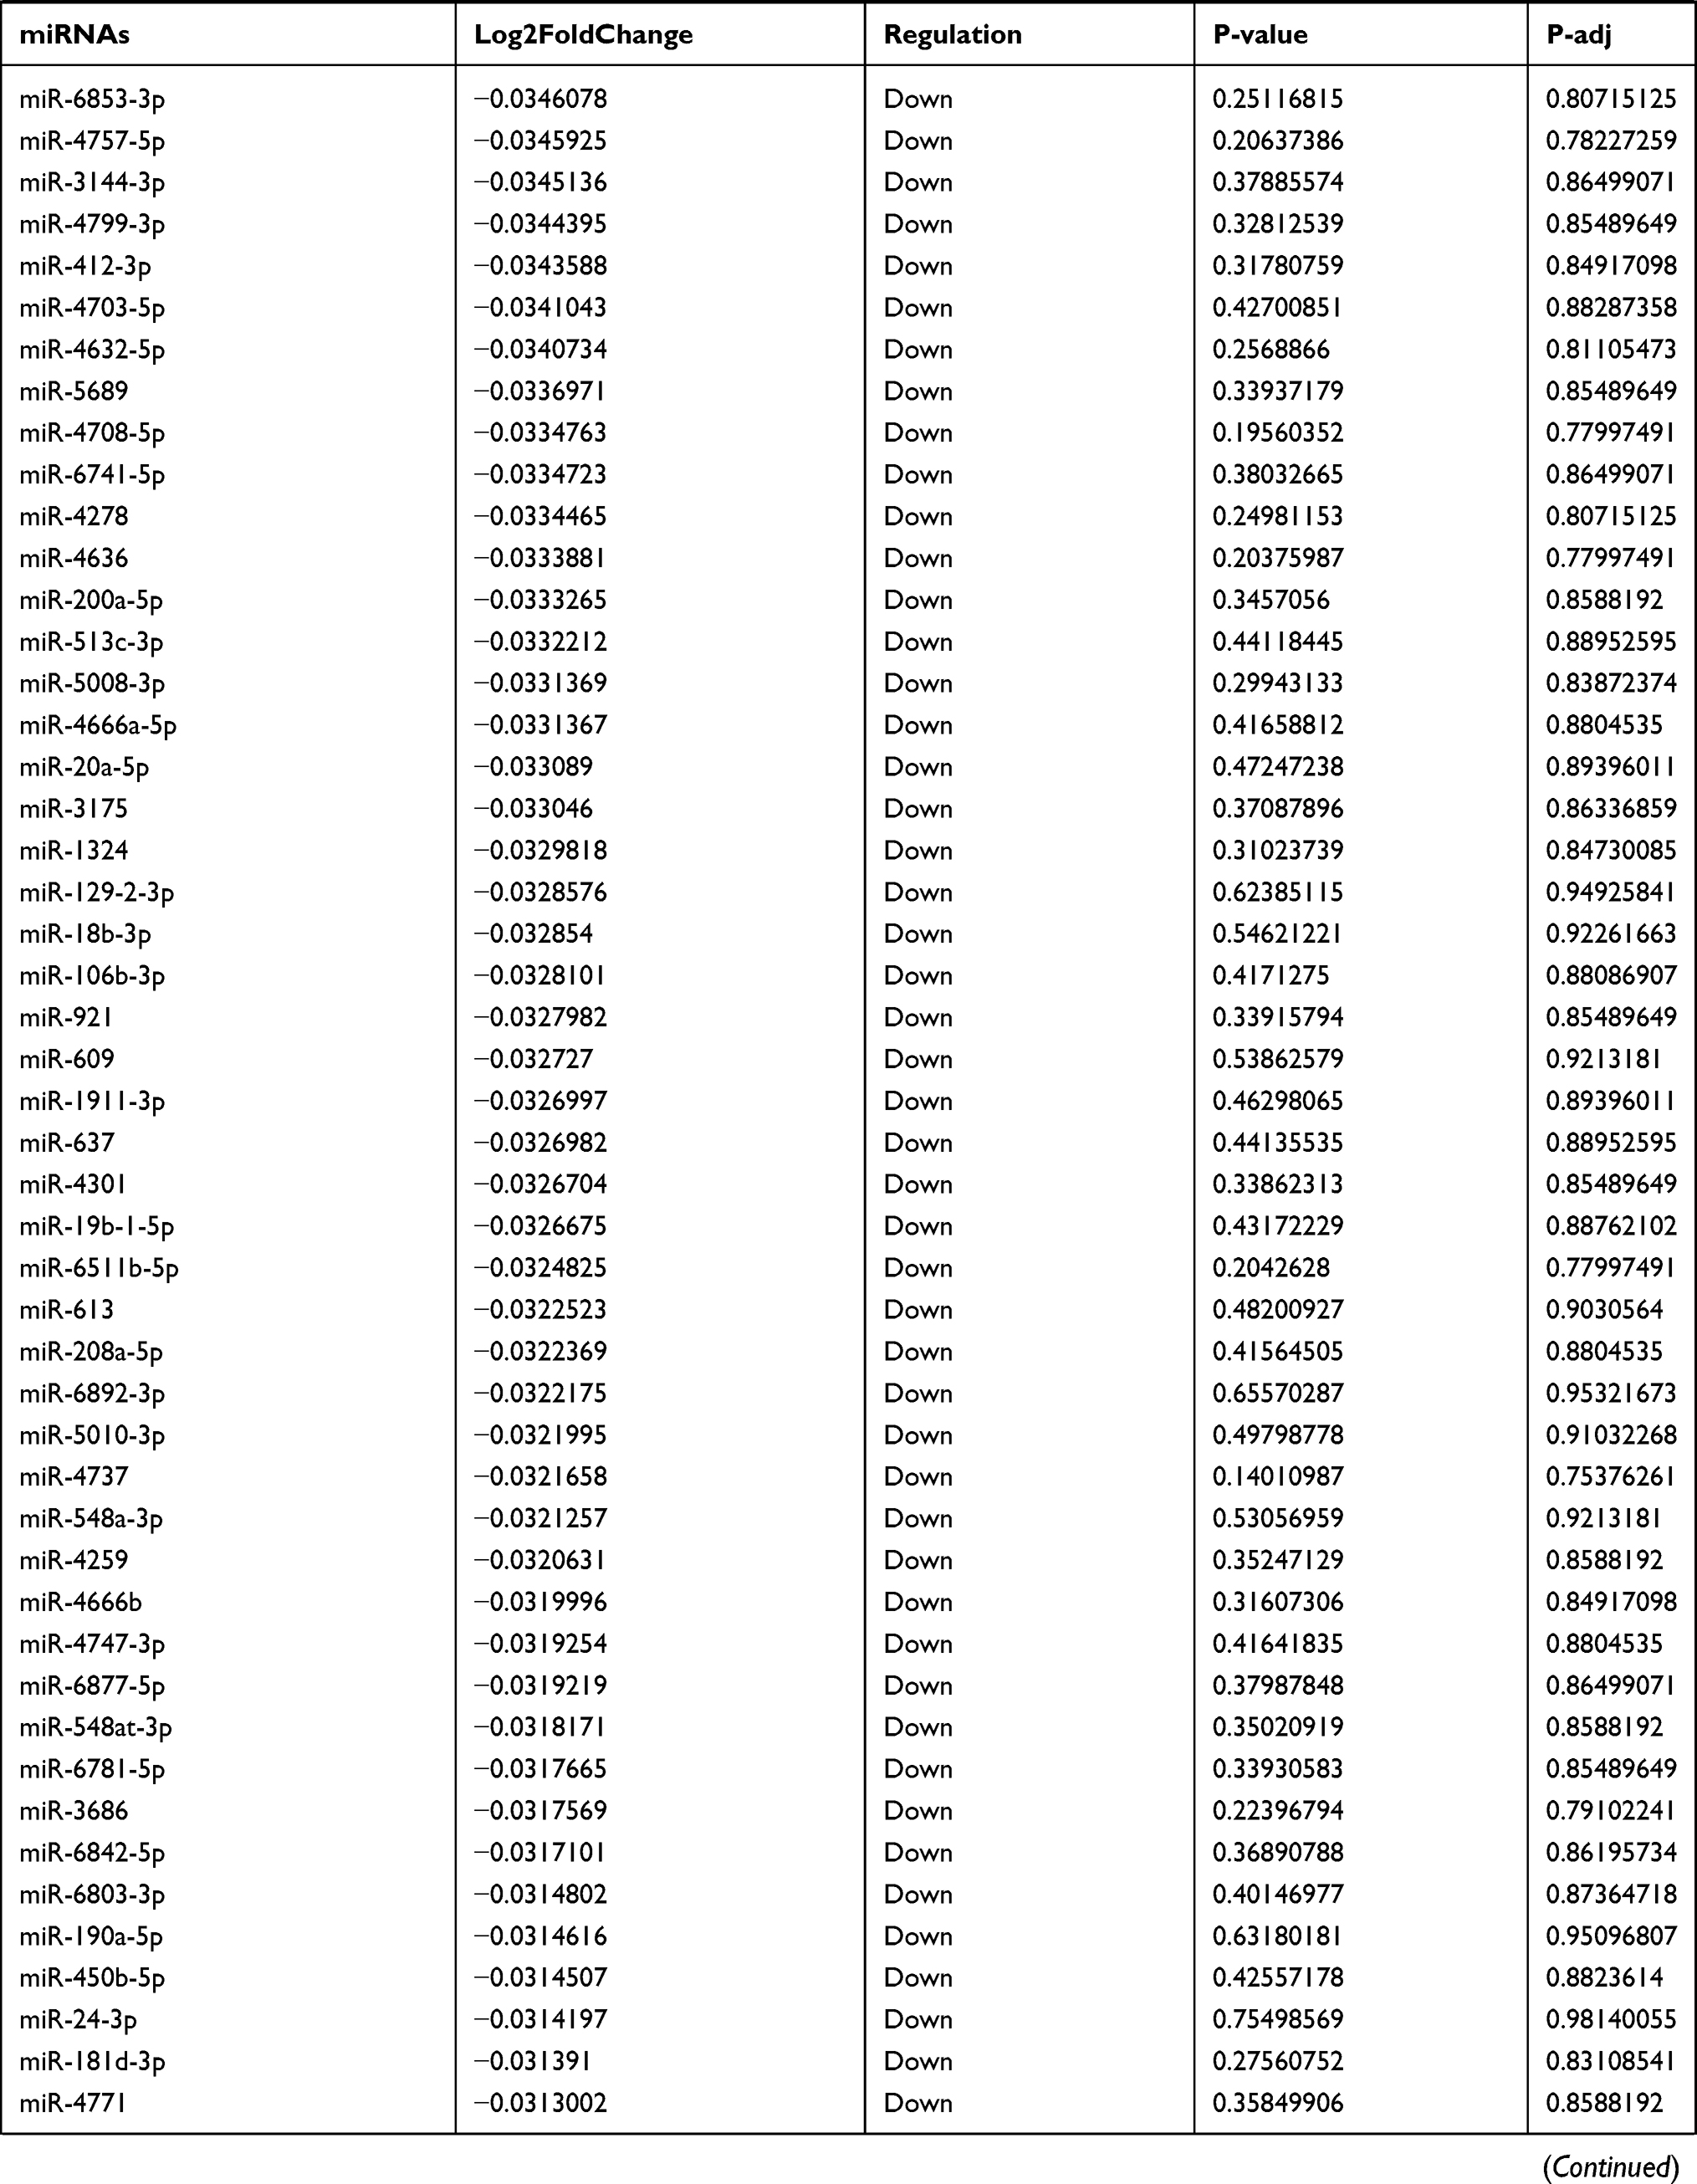 |  | 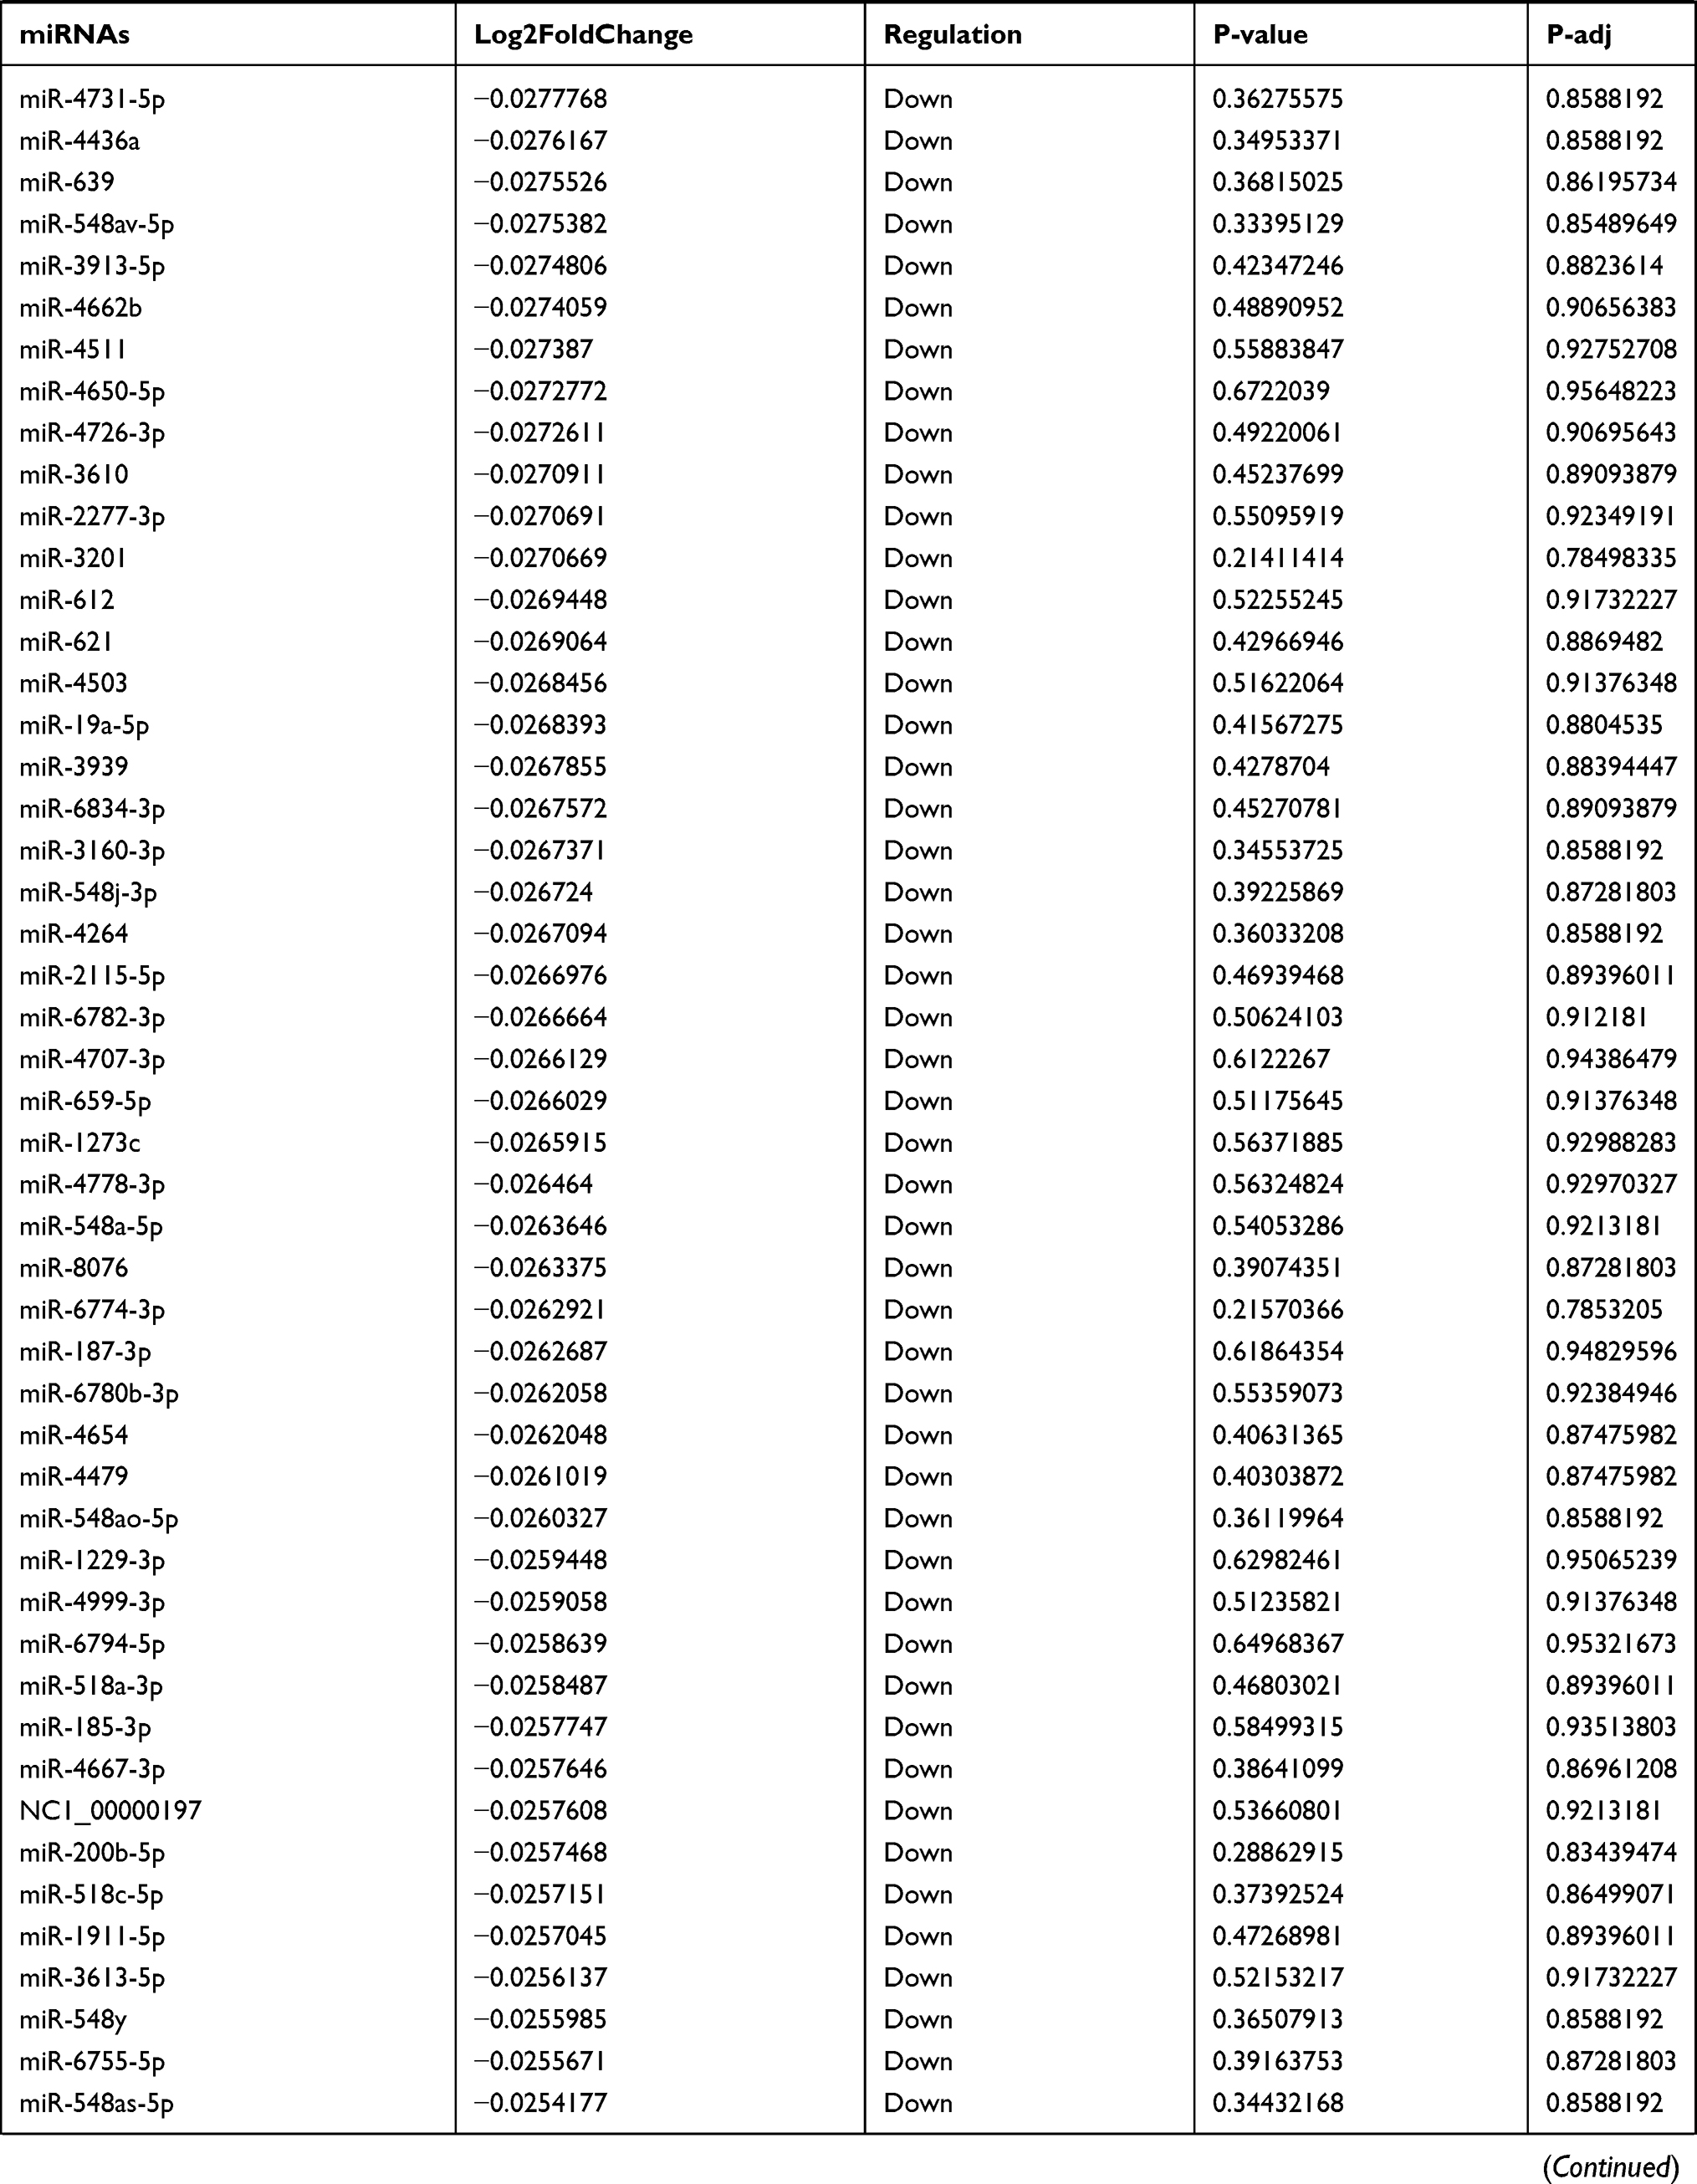 | 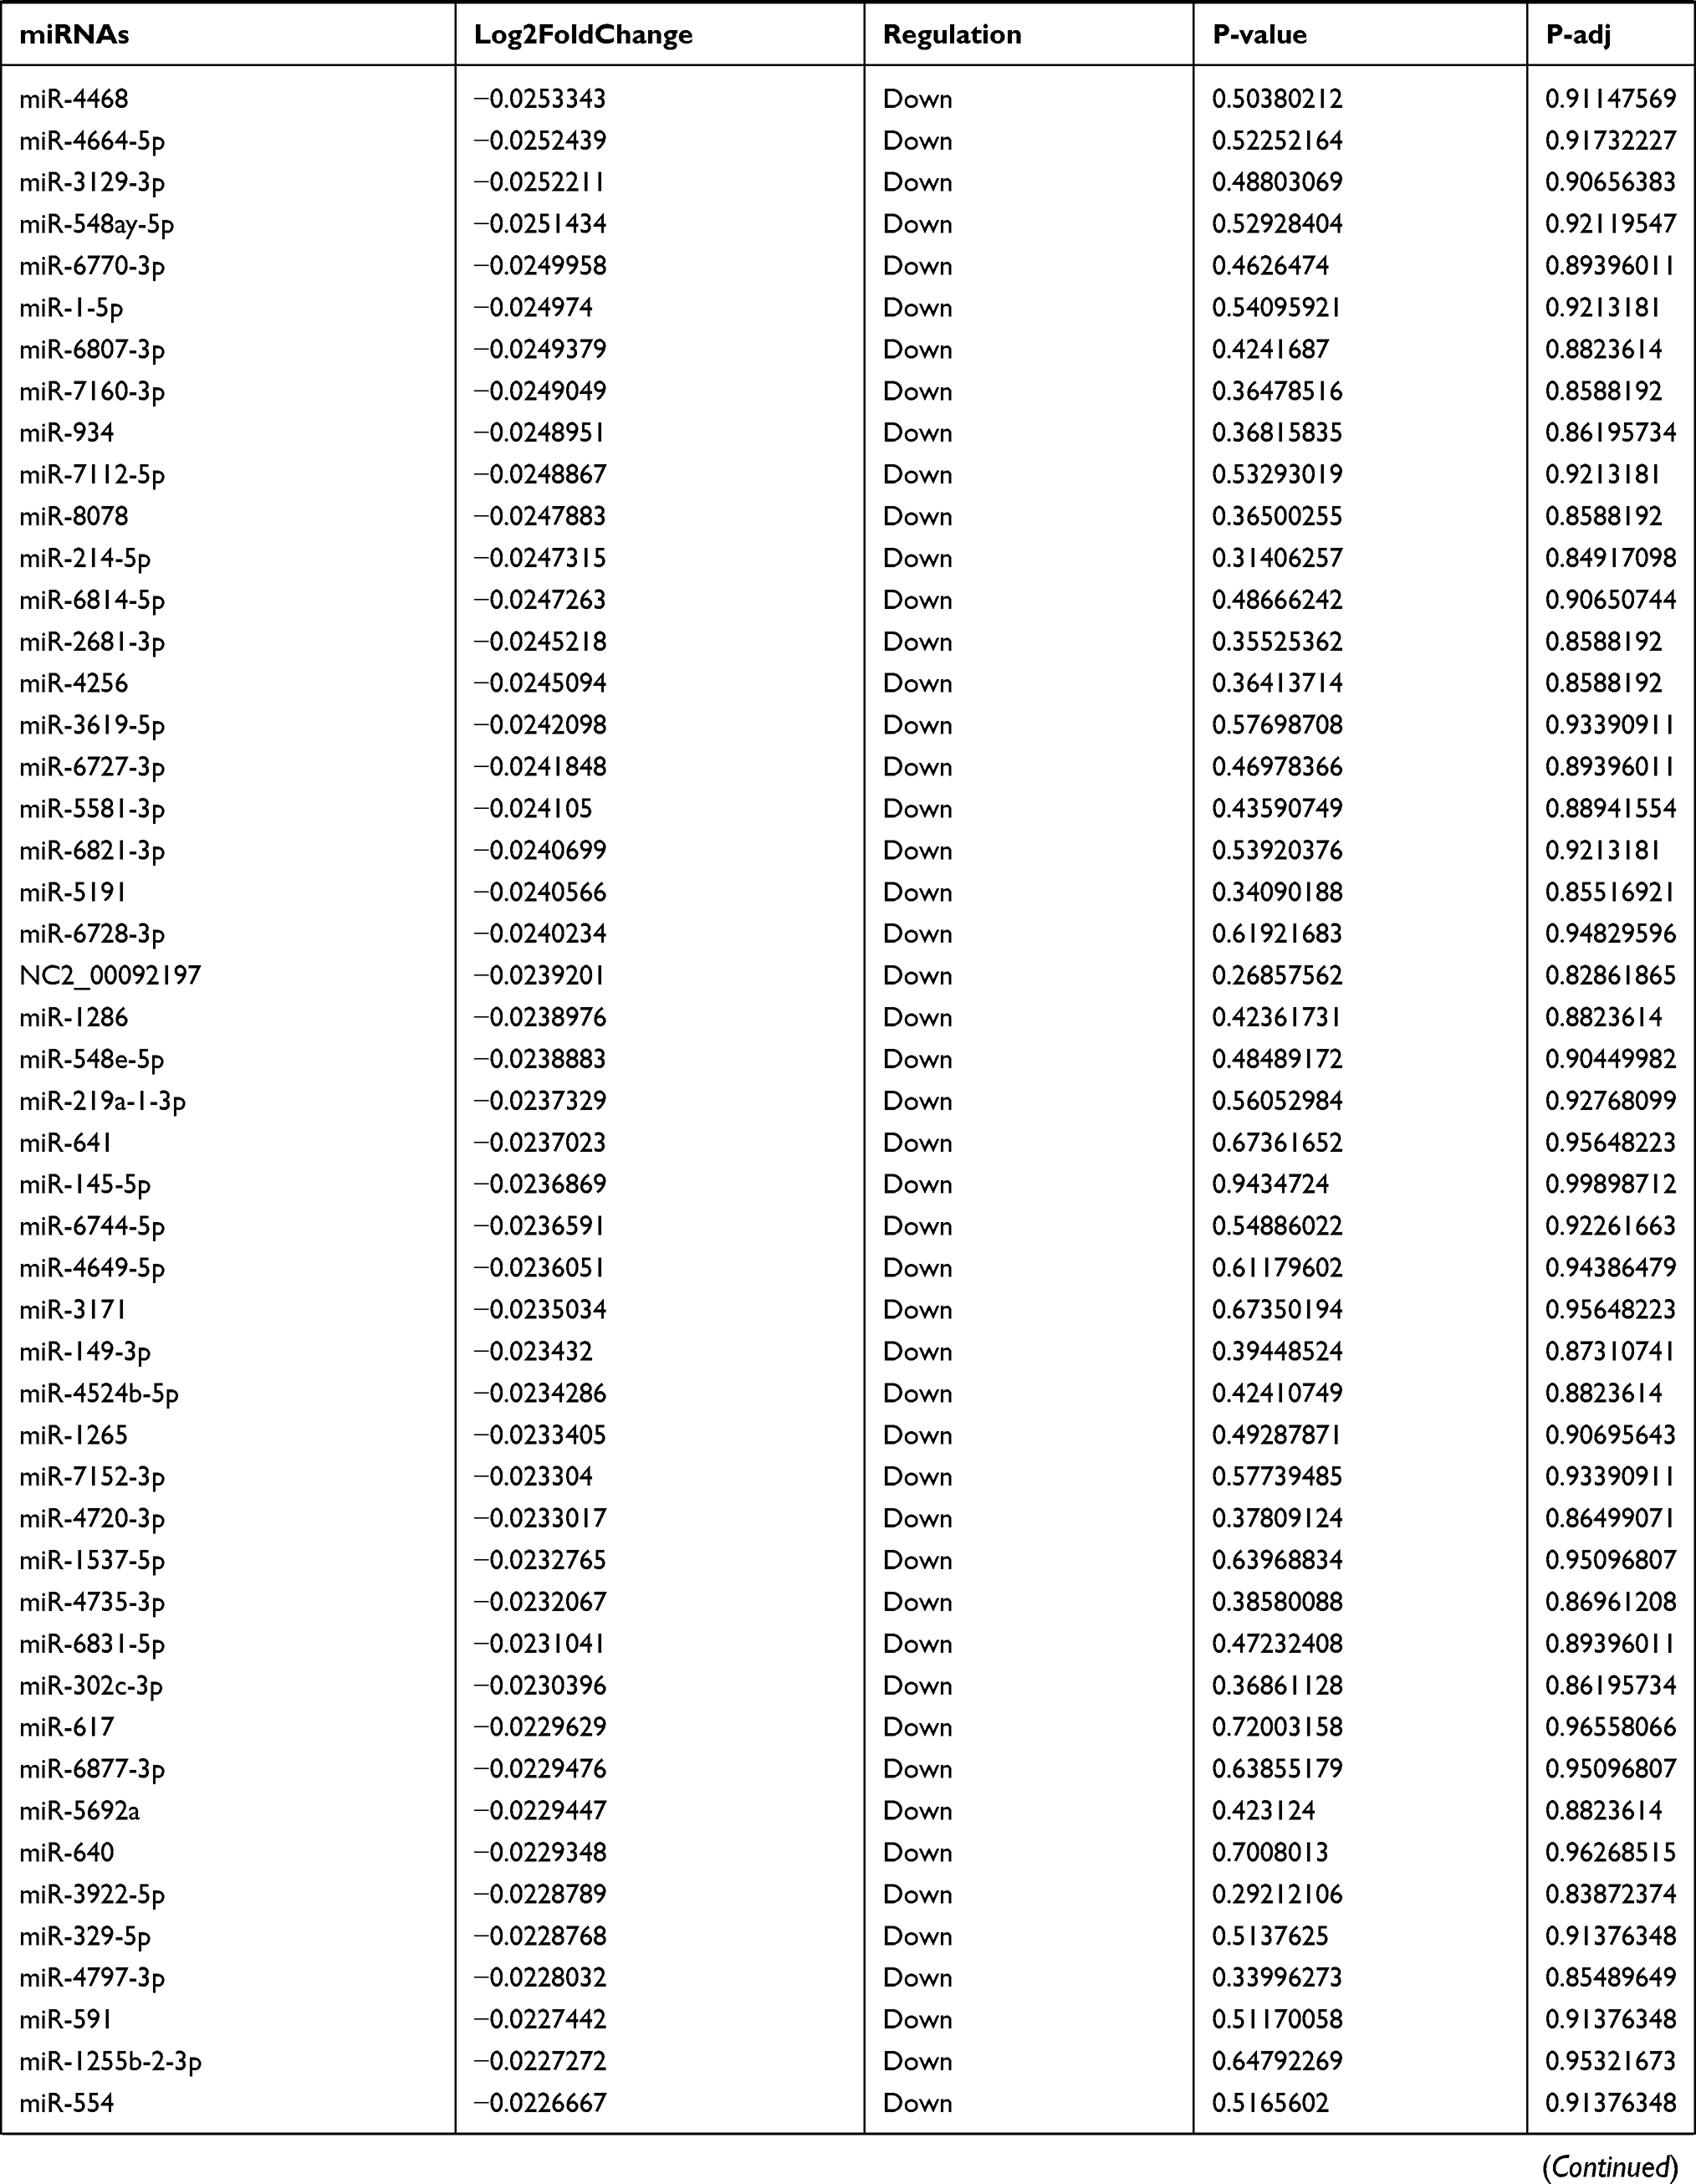 | 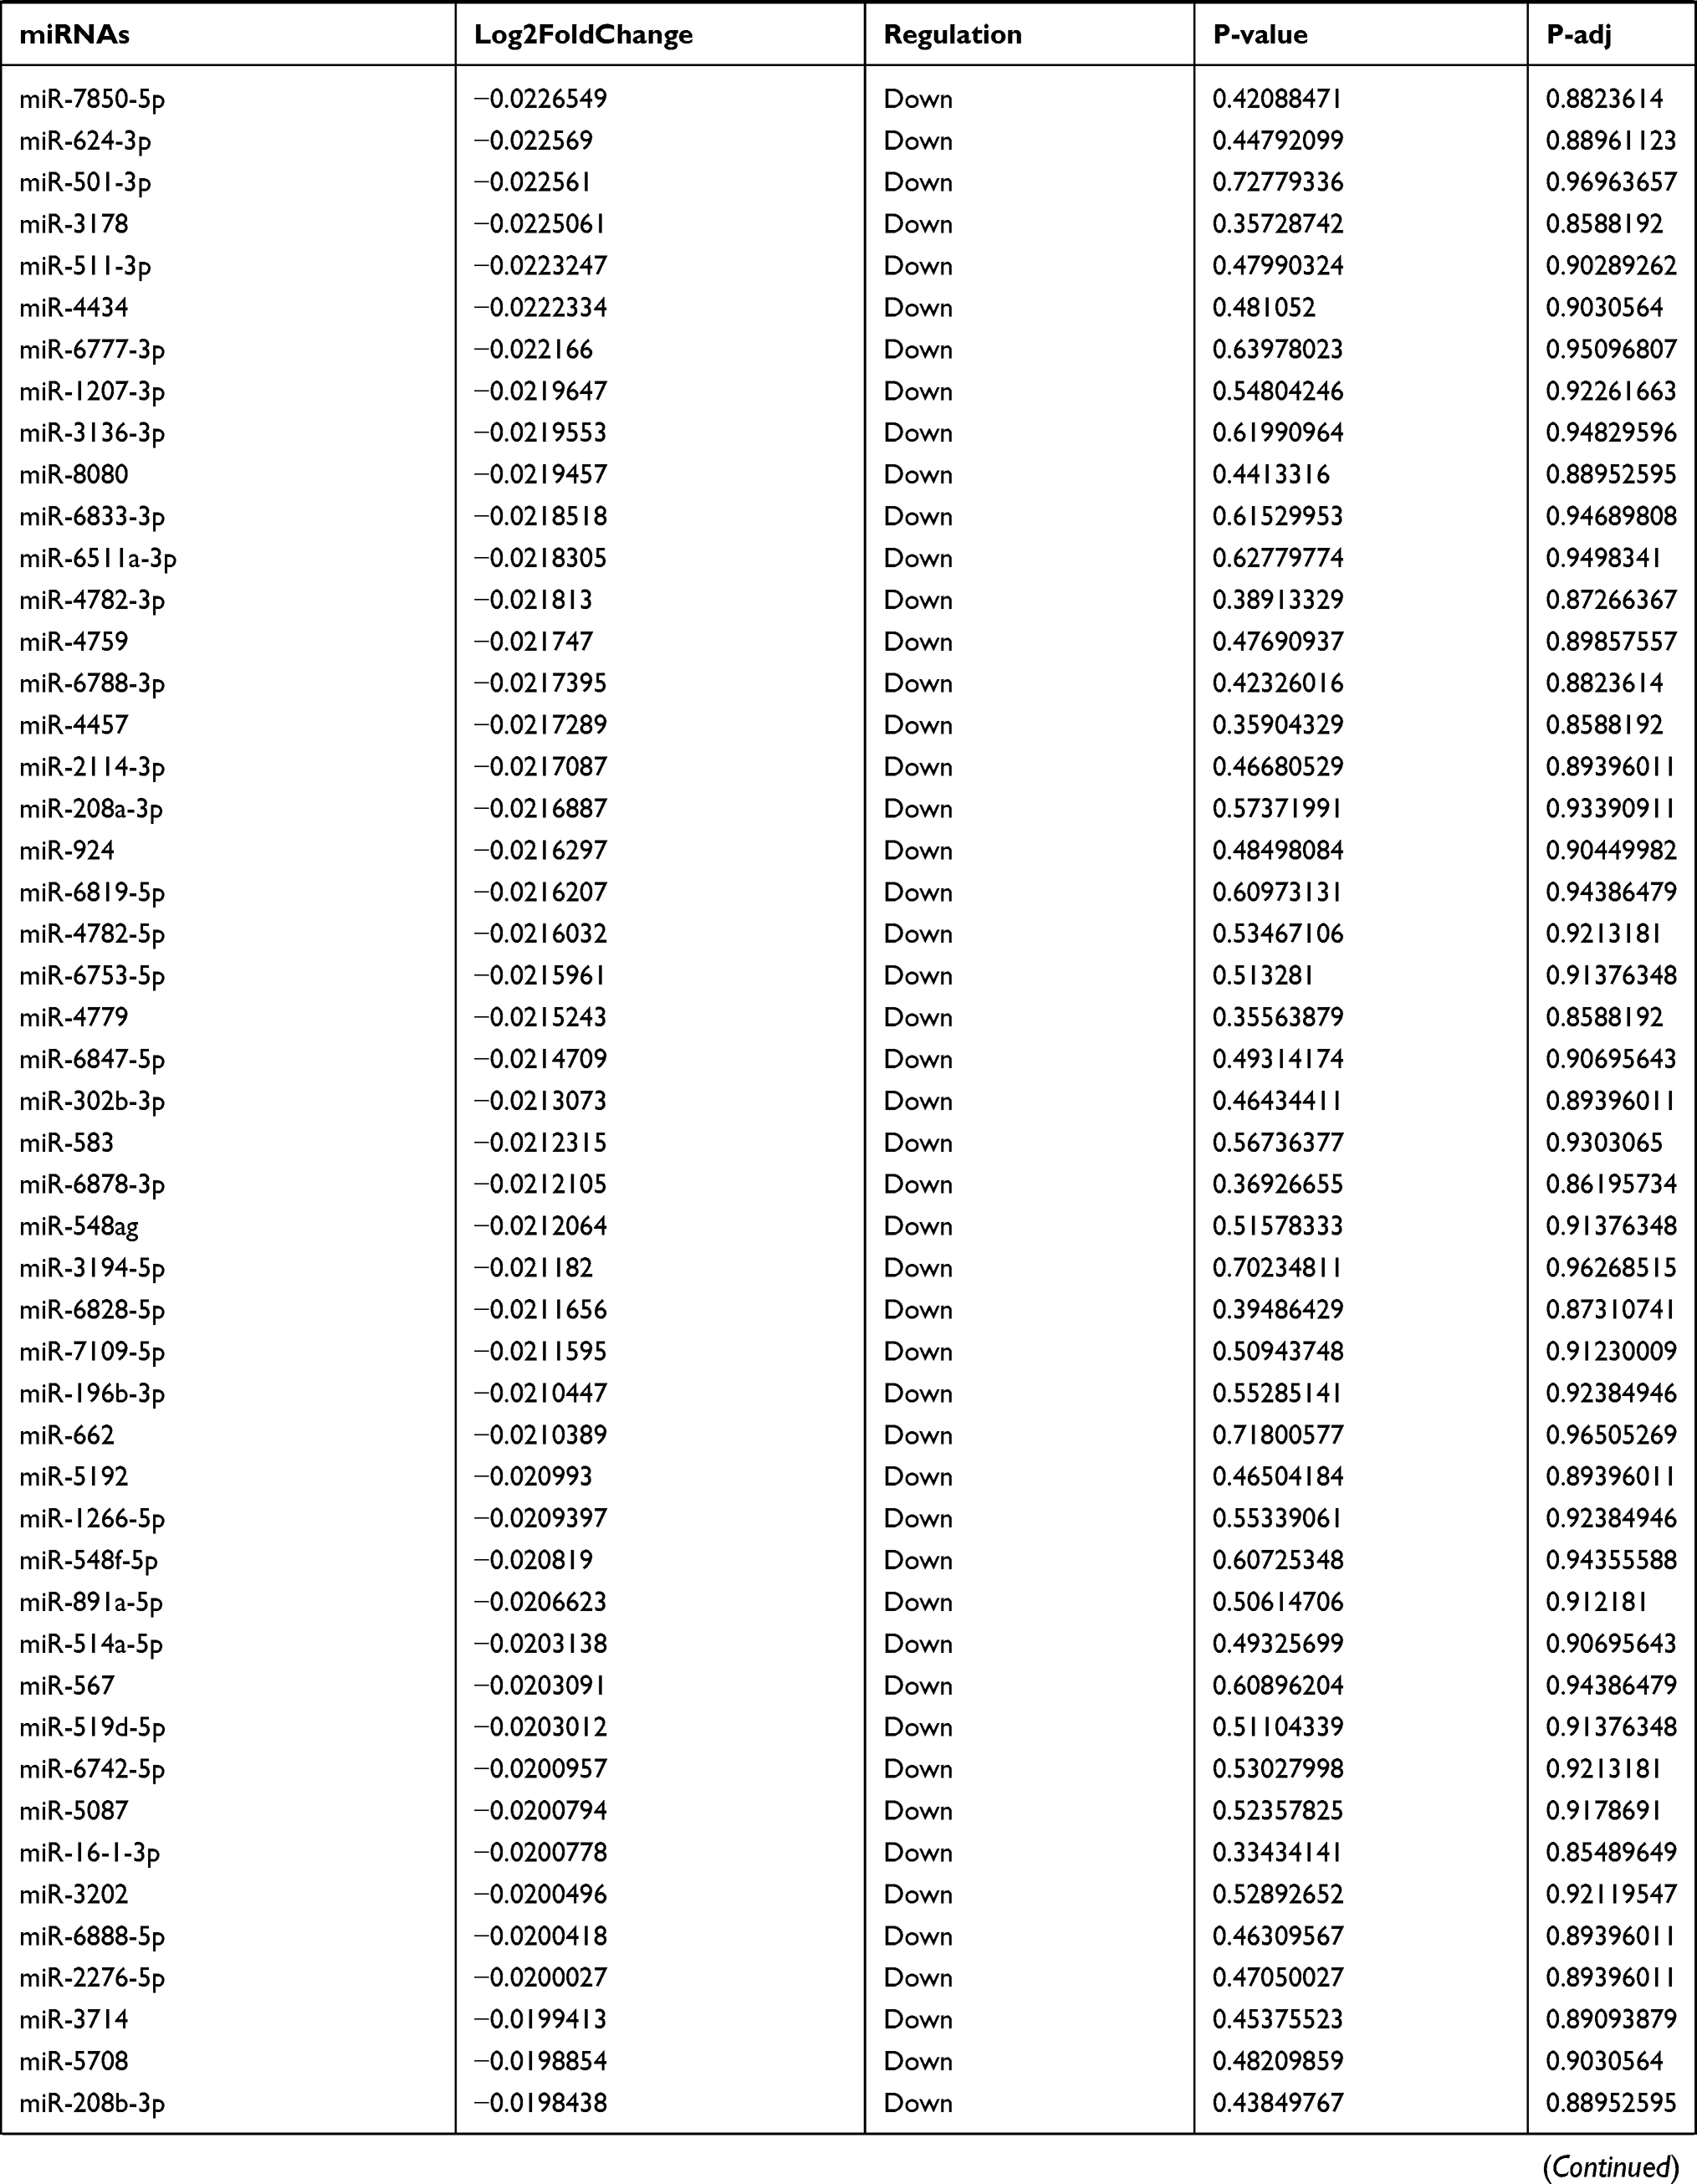 | 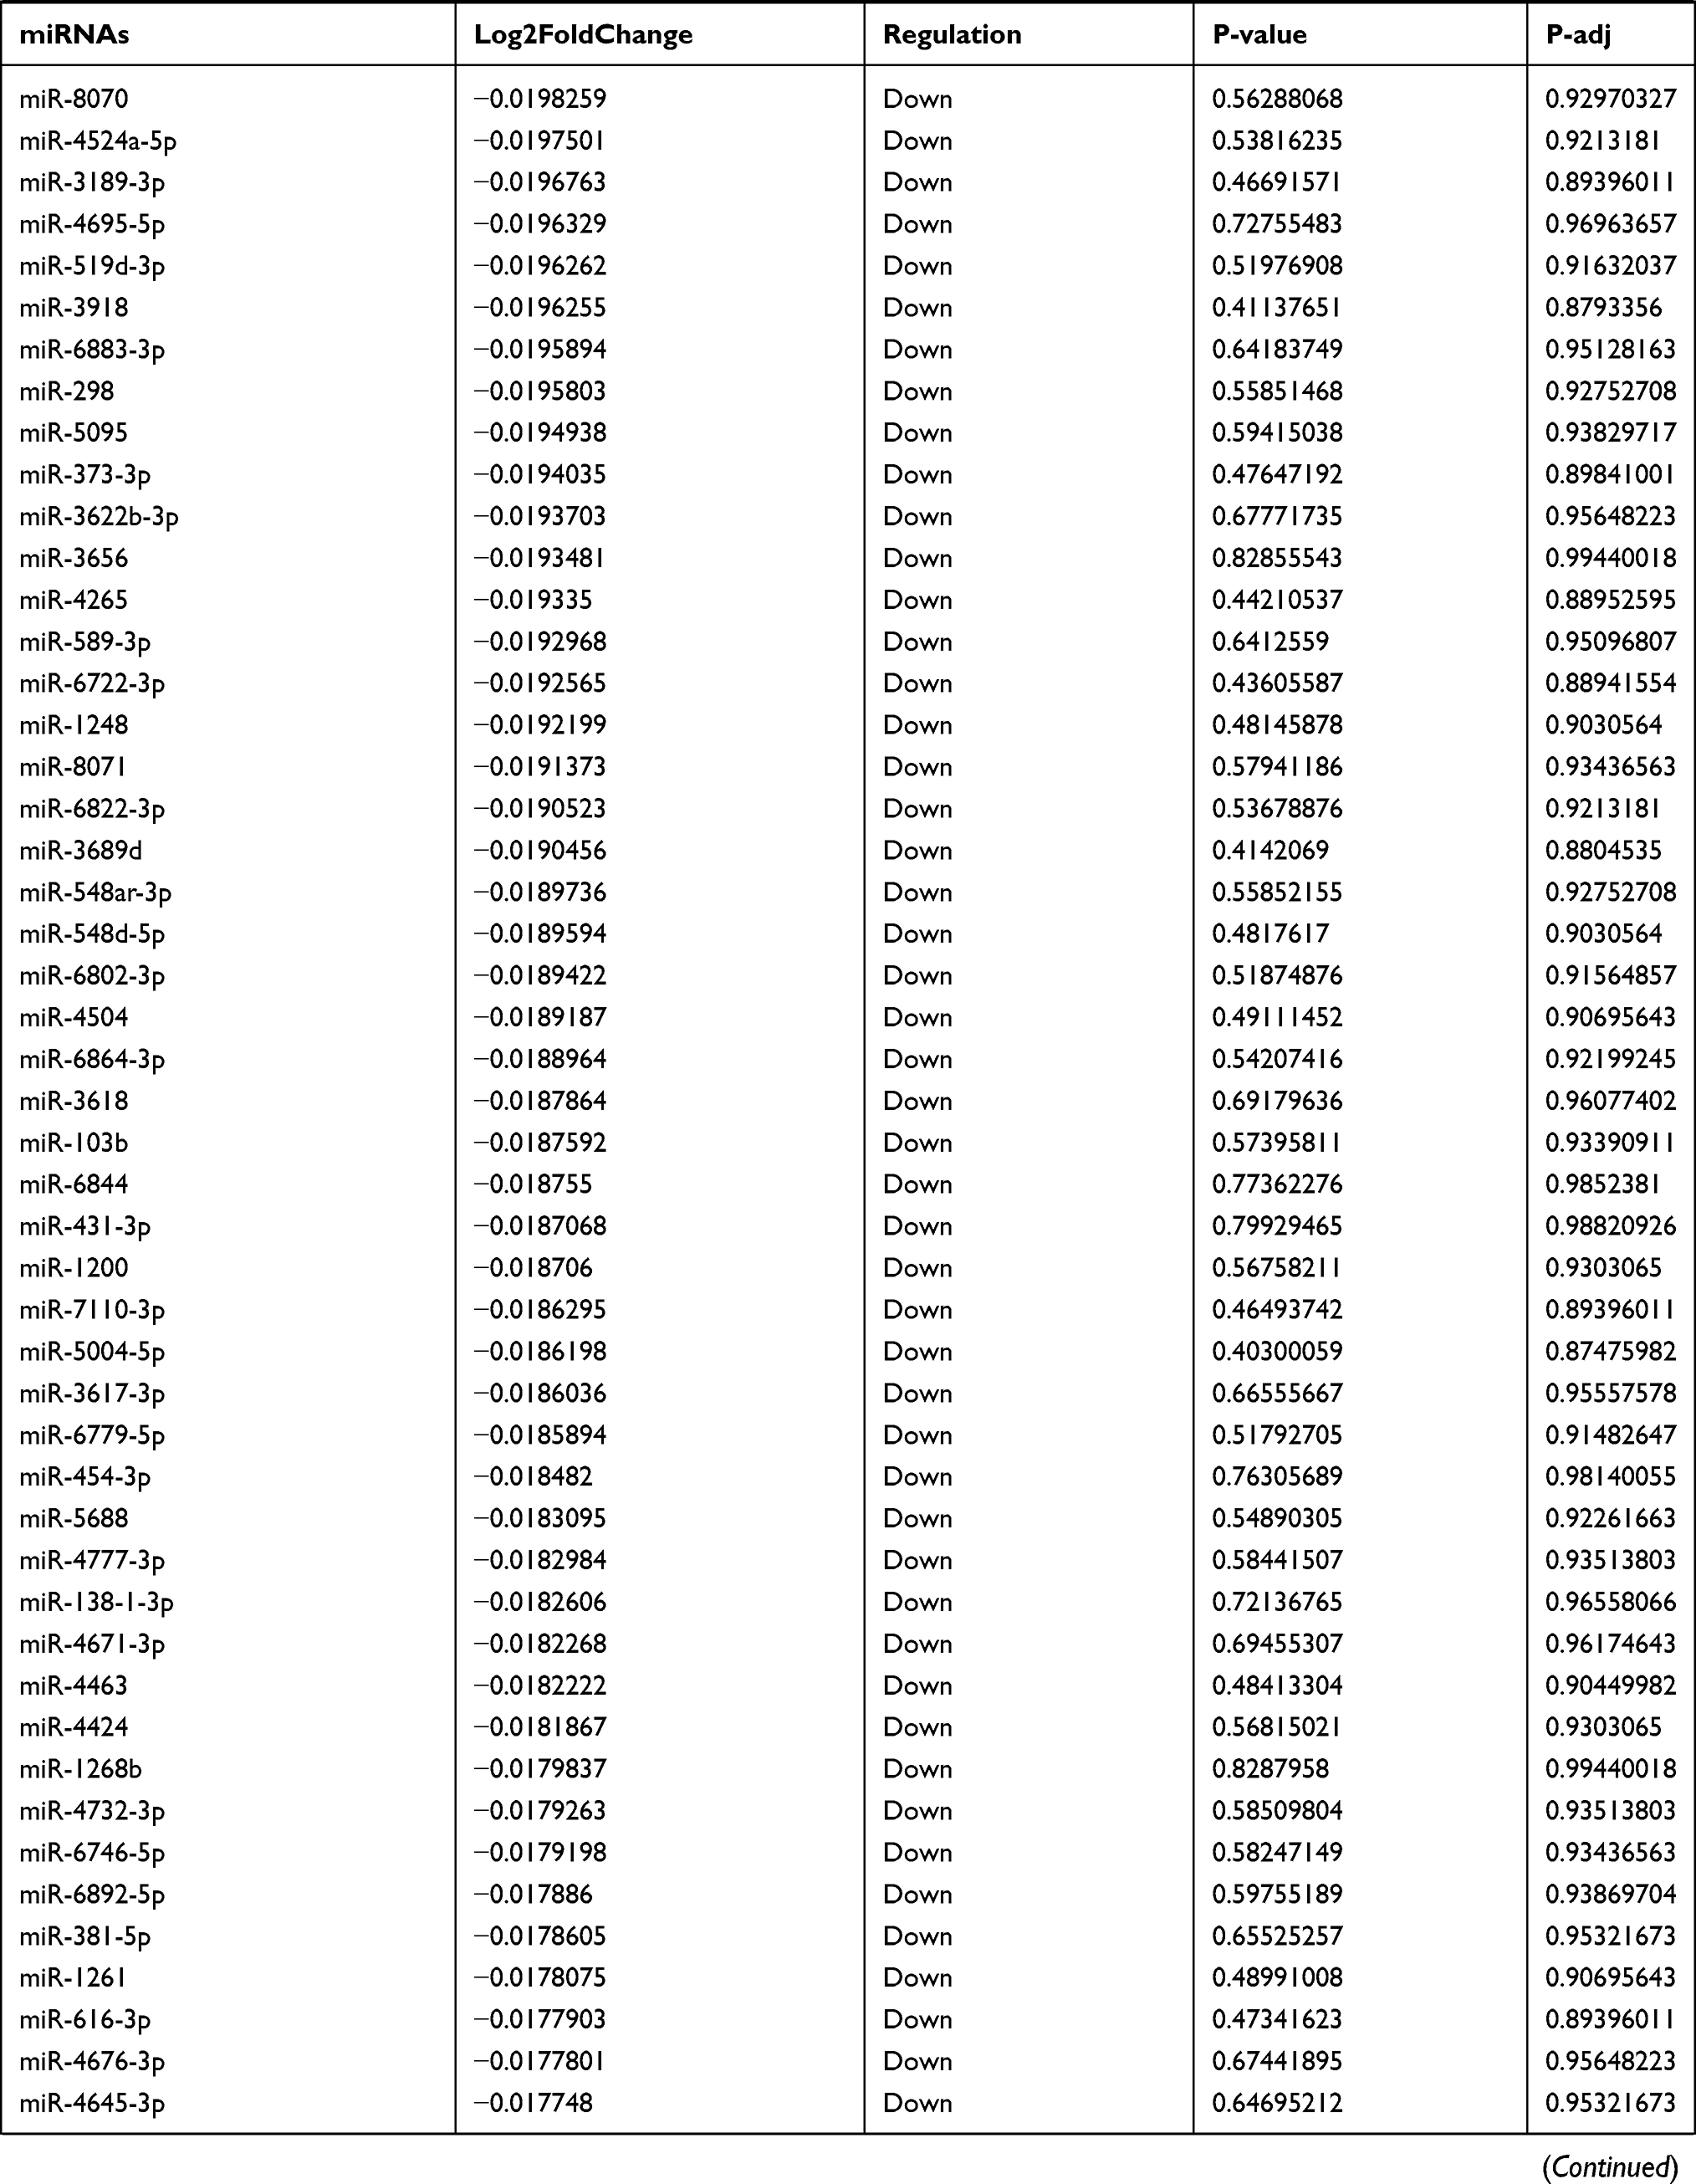 | 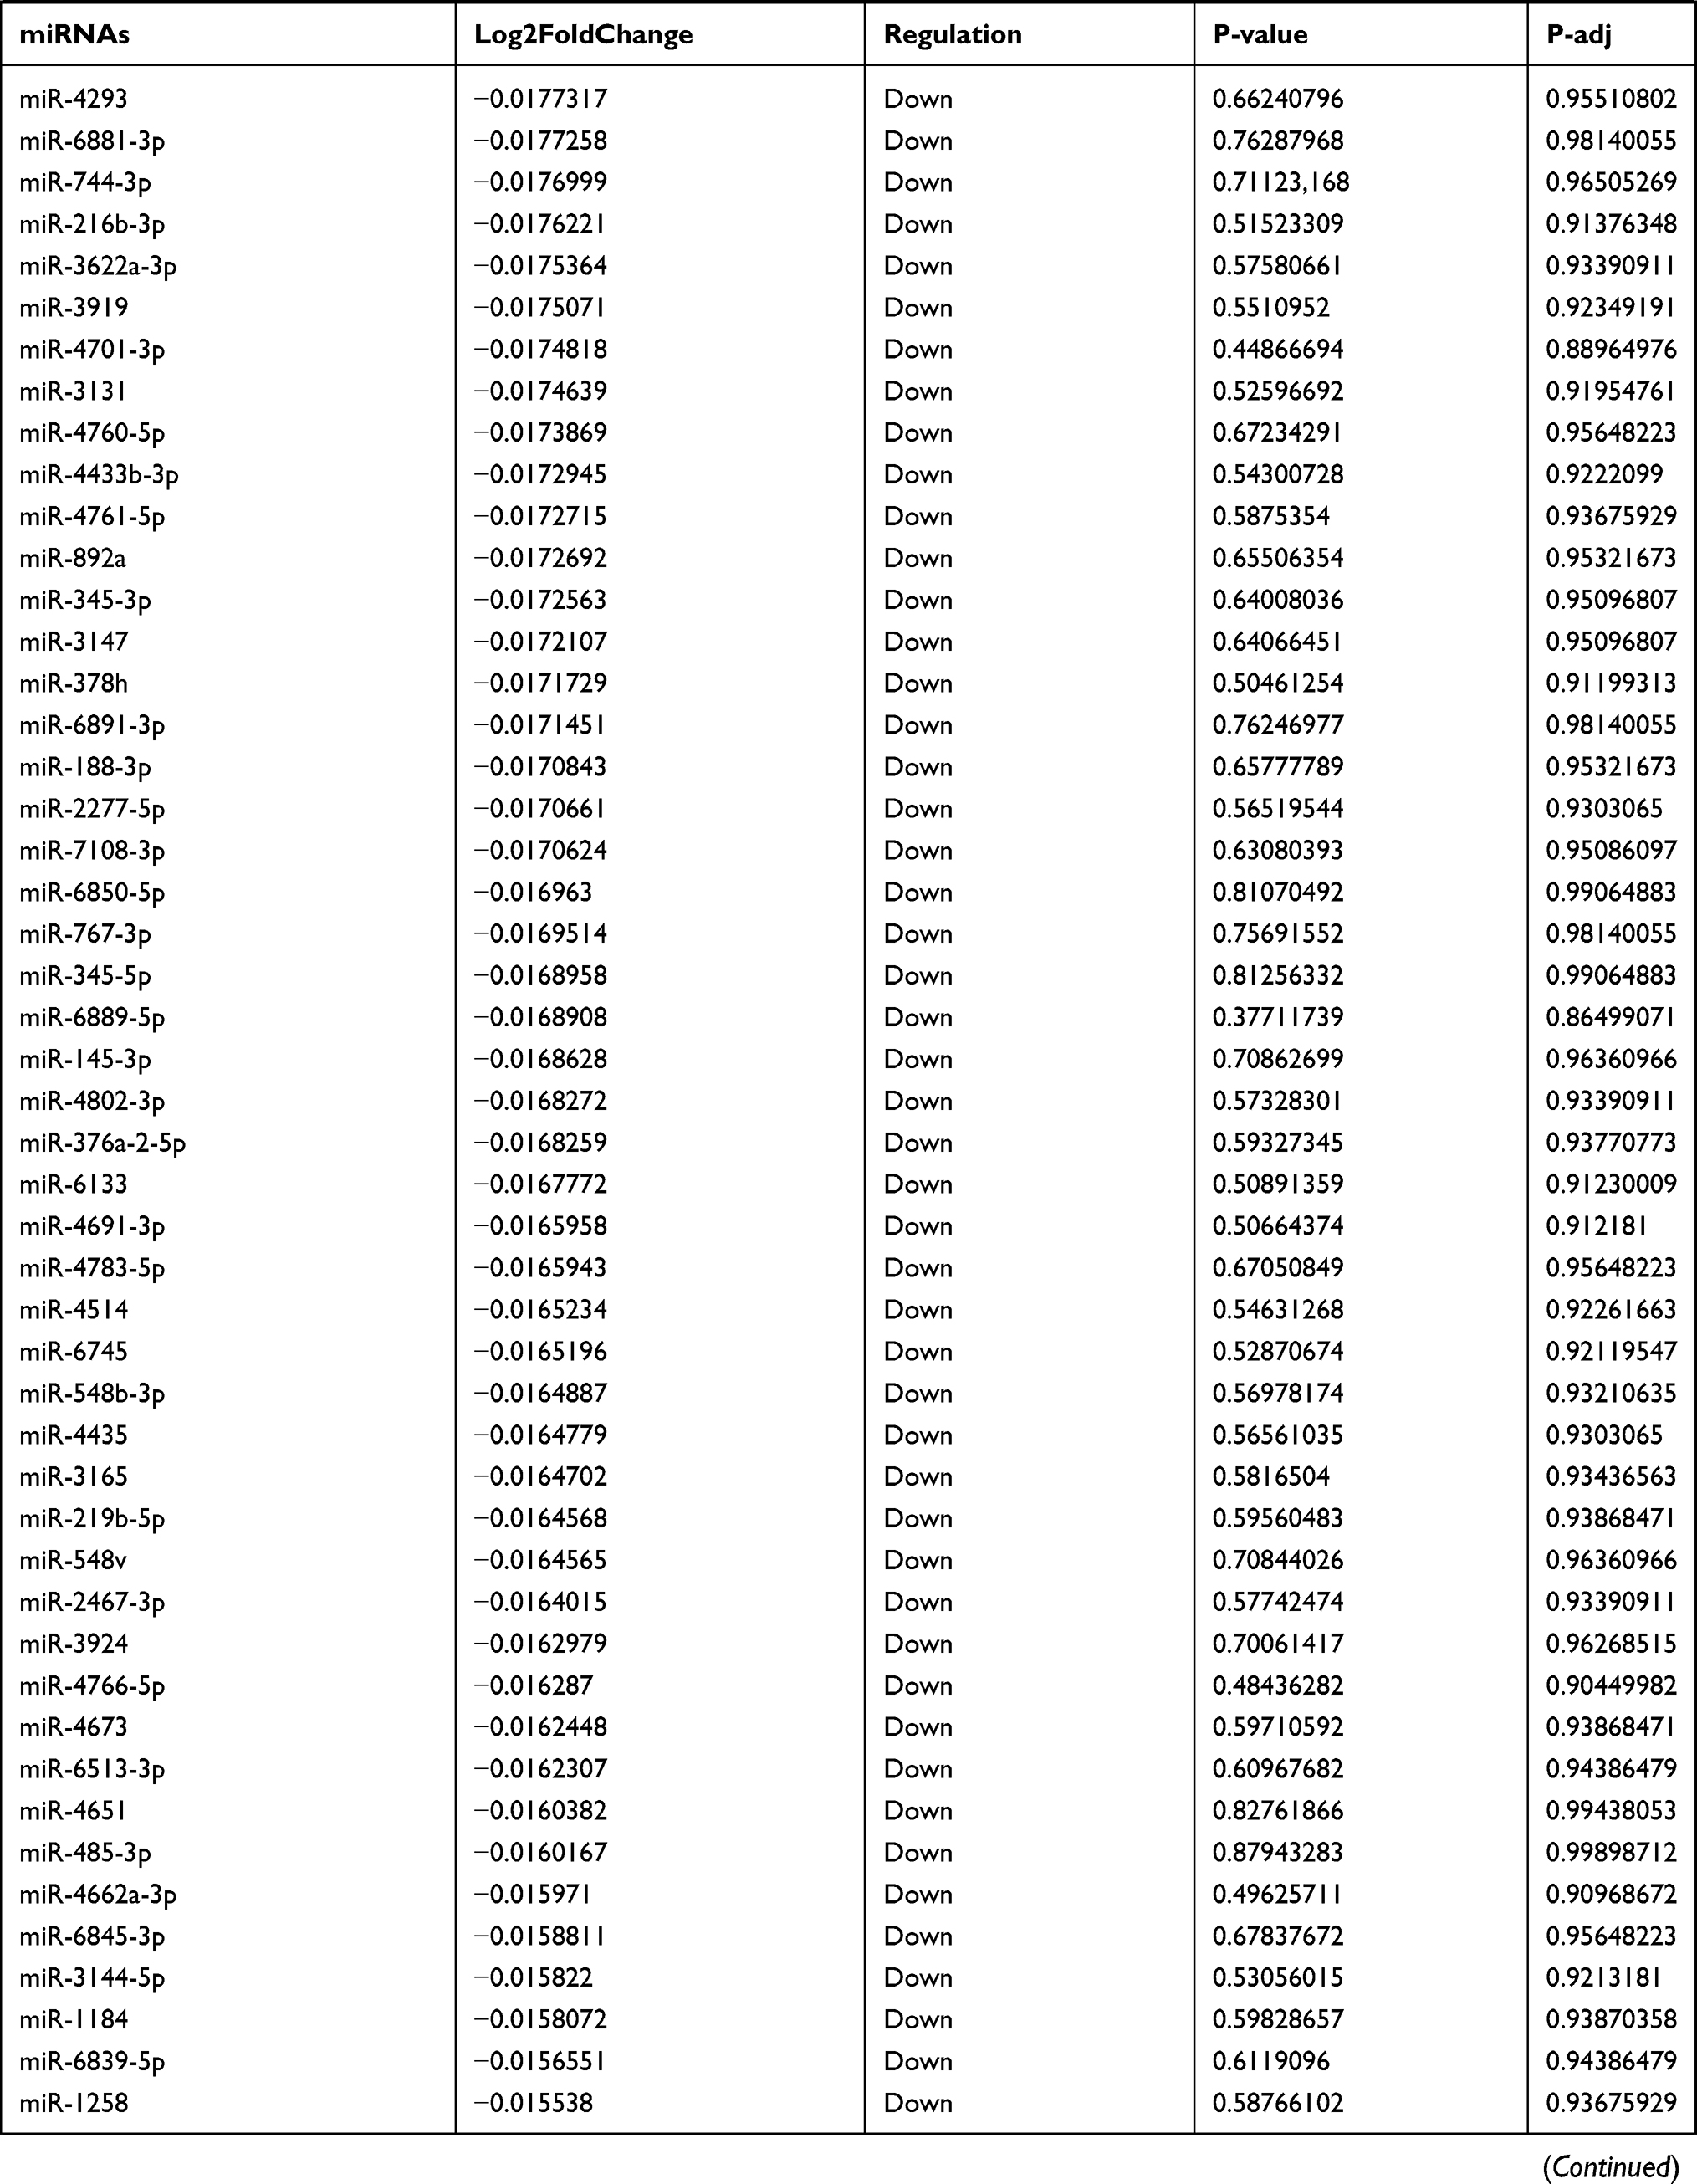 | 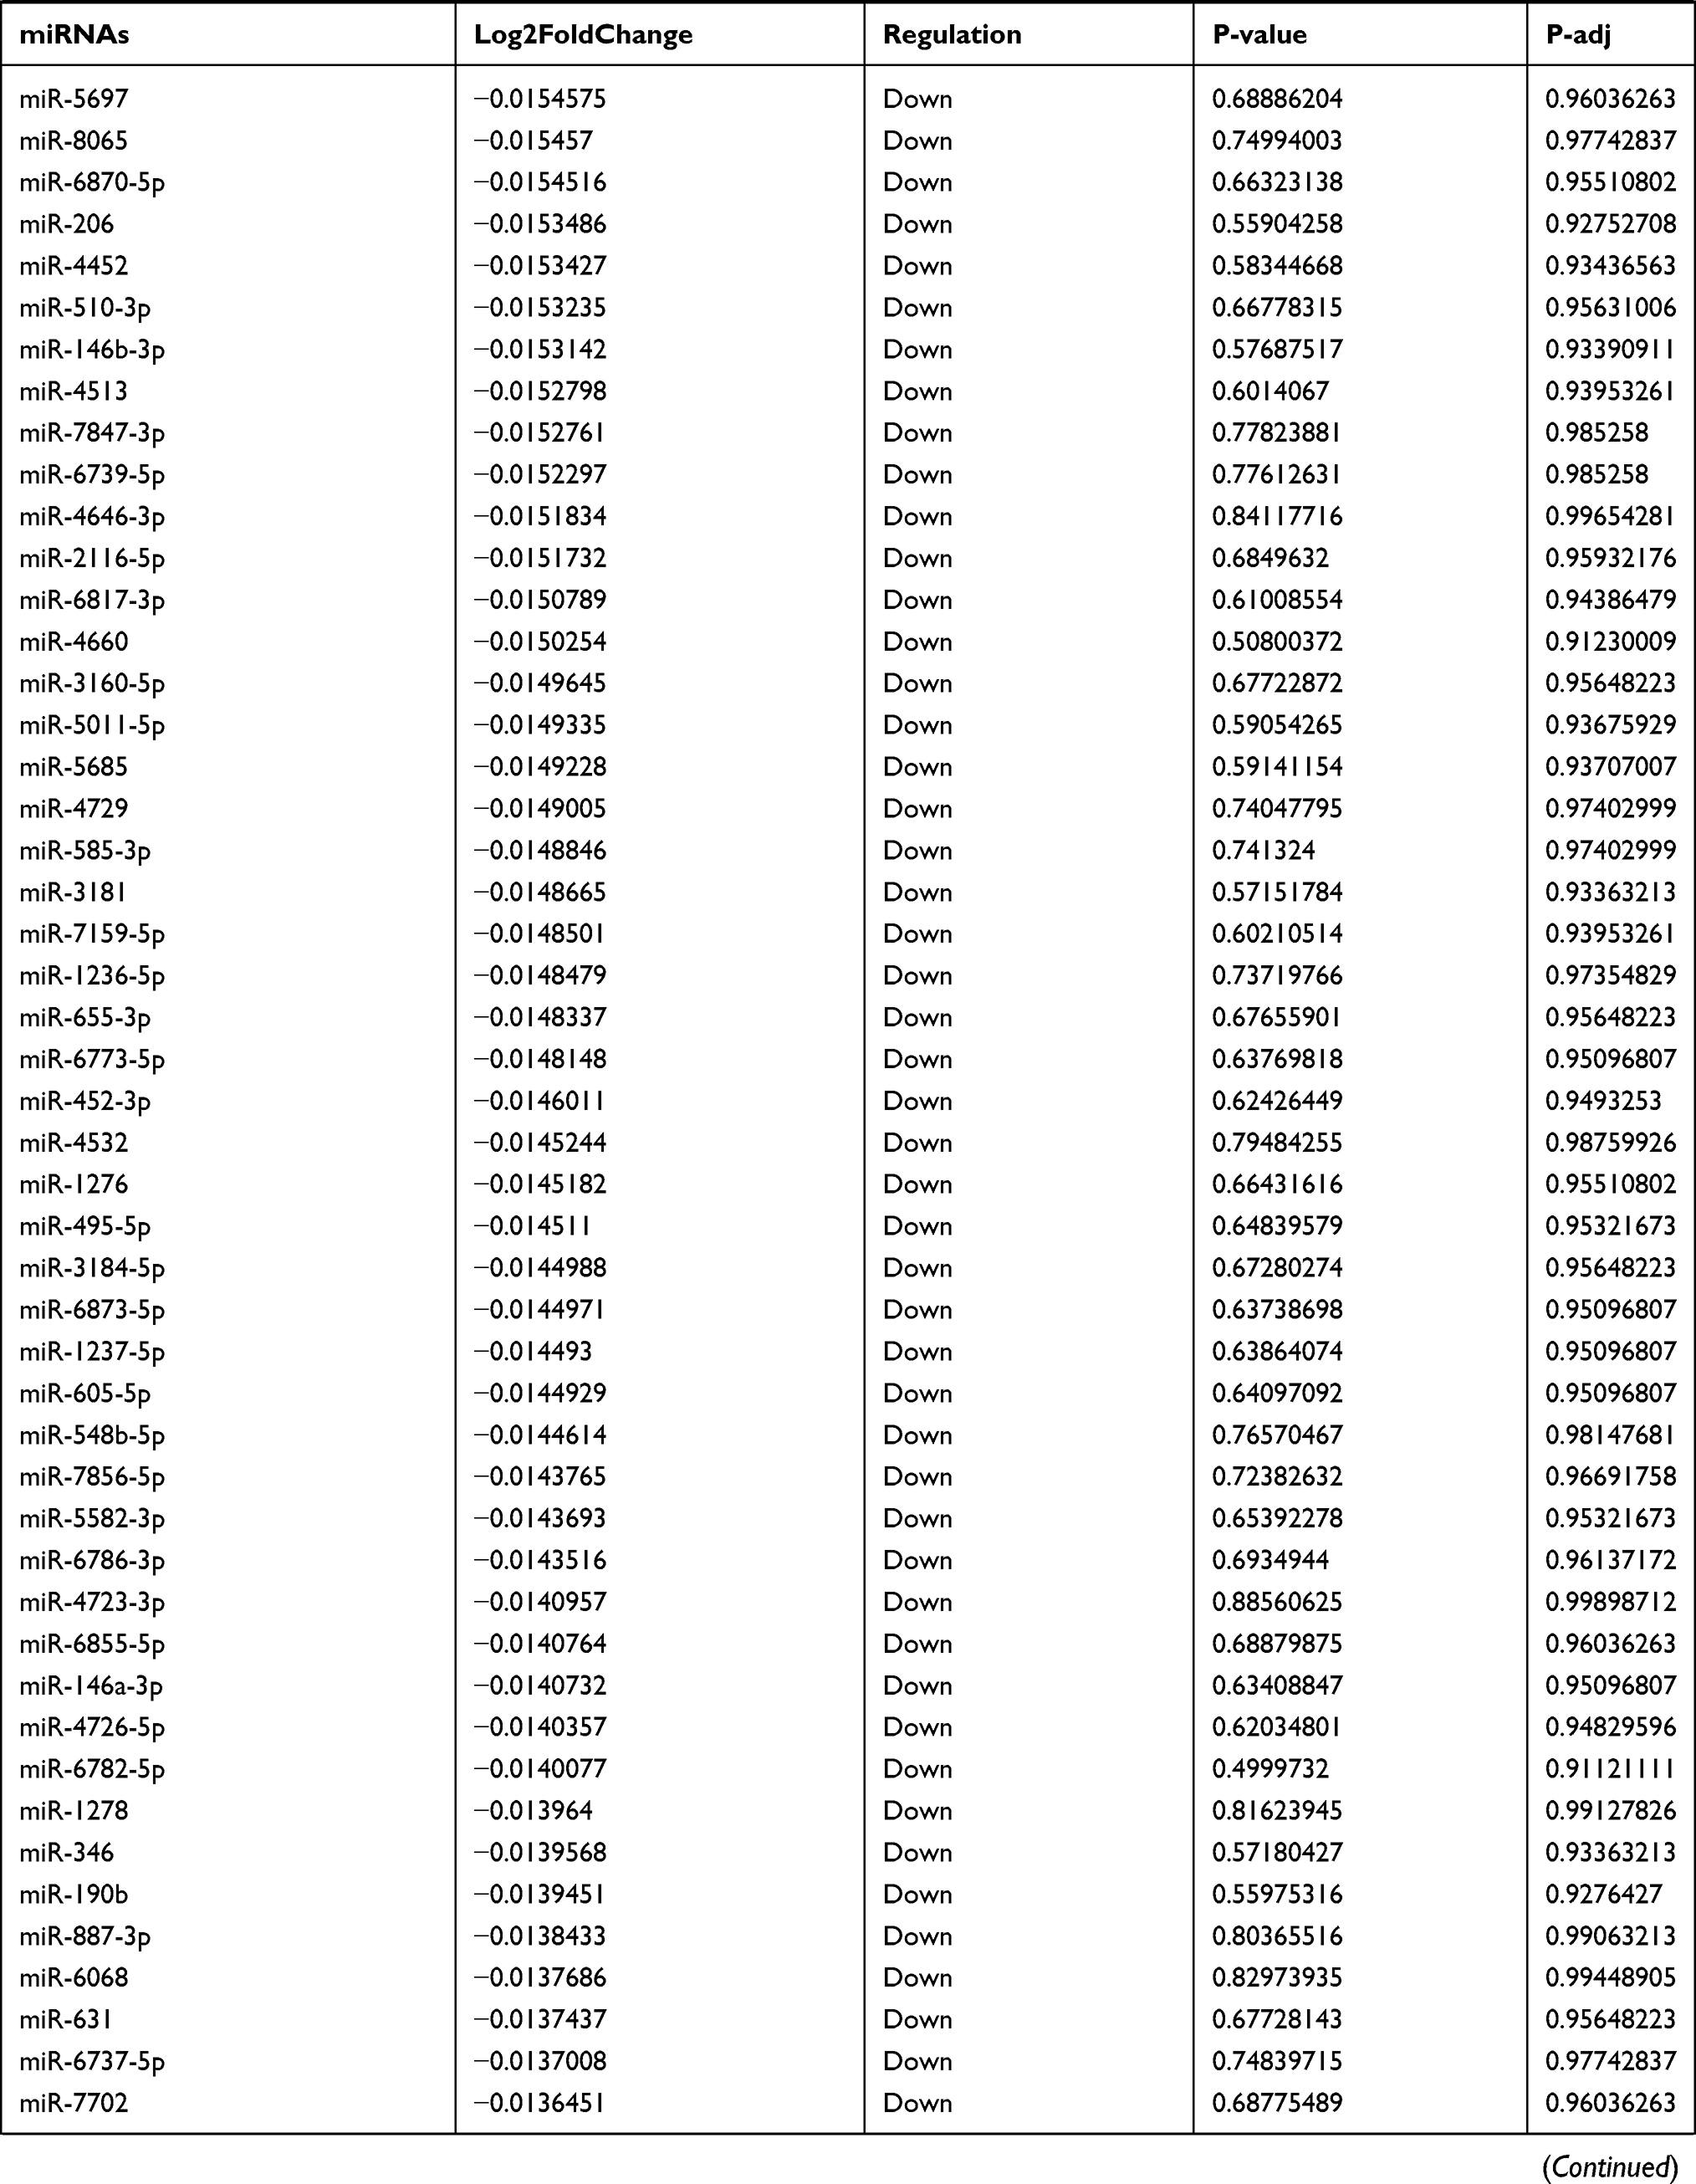 | 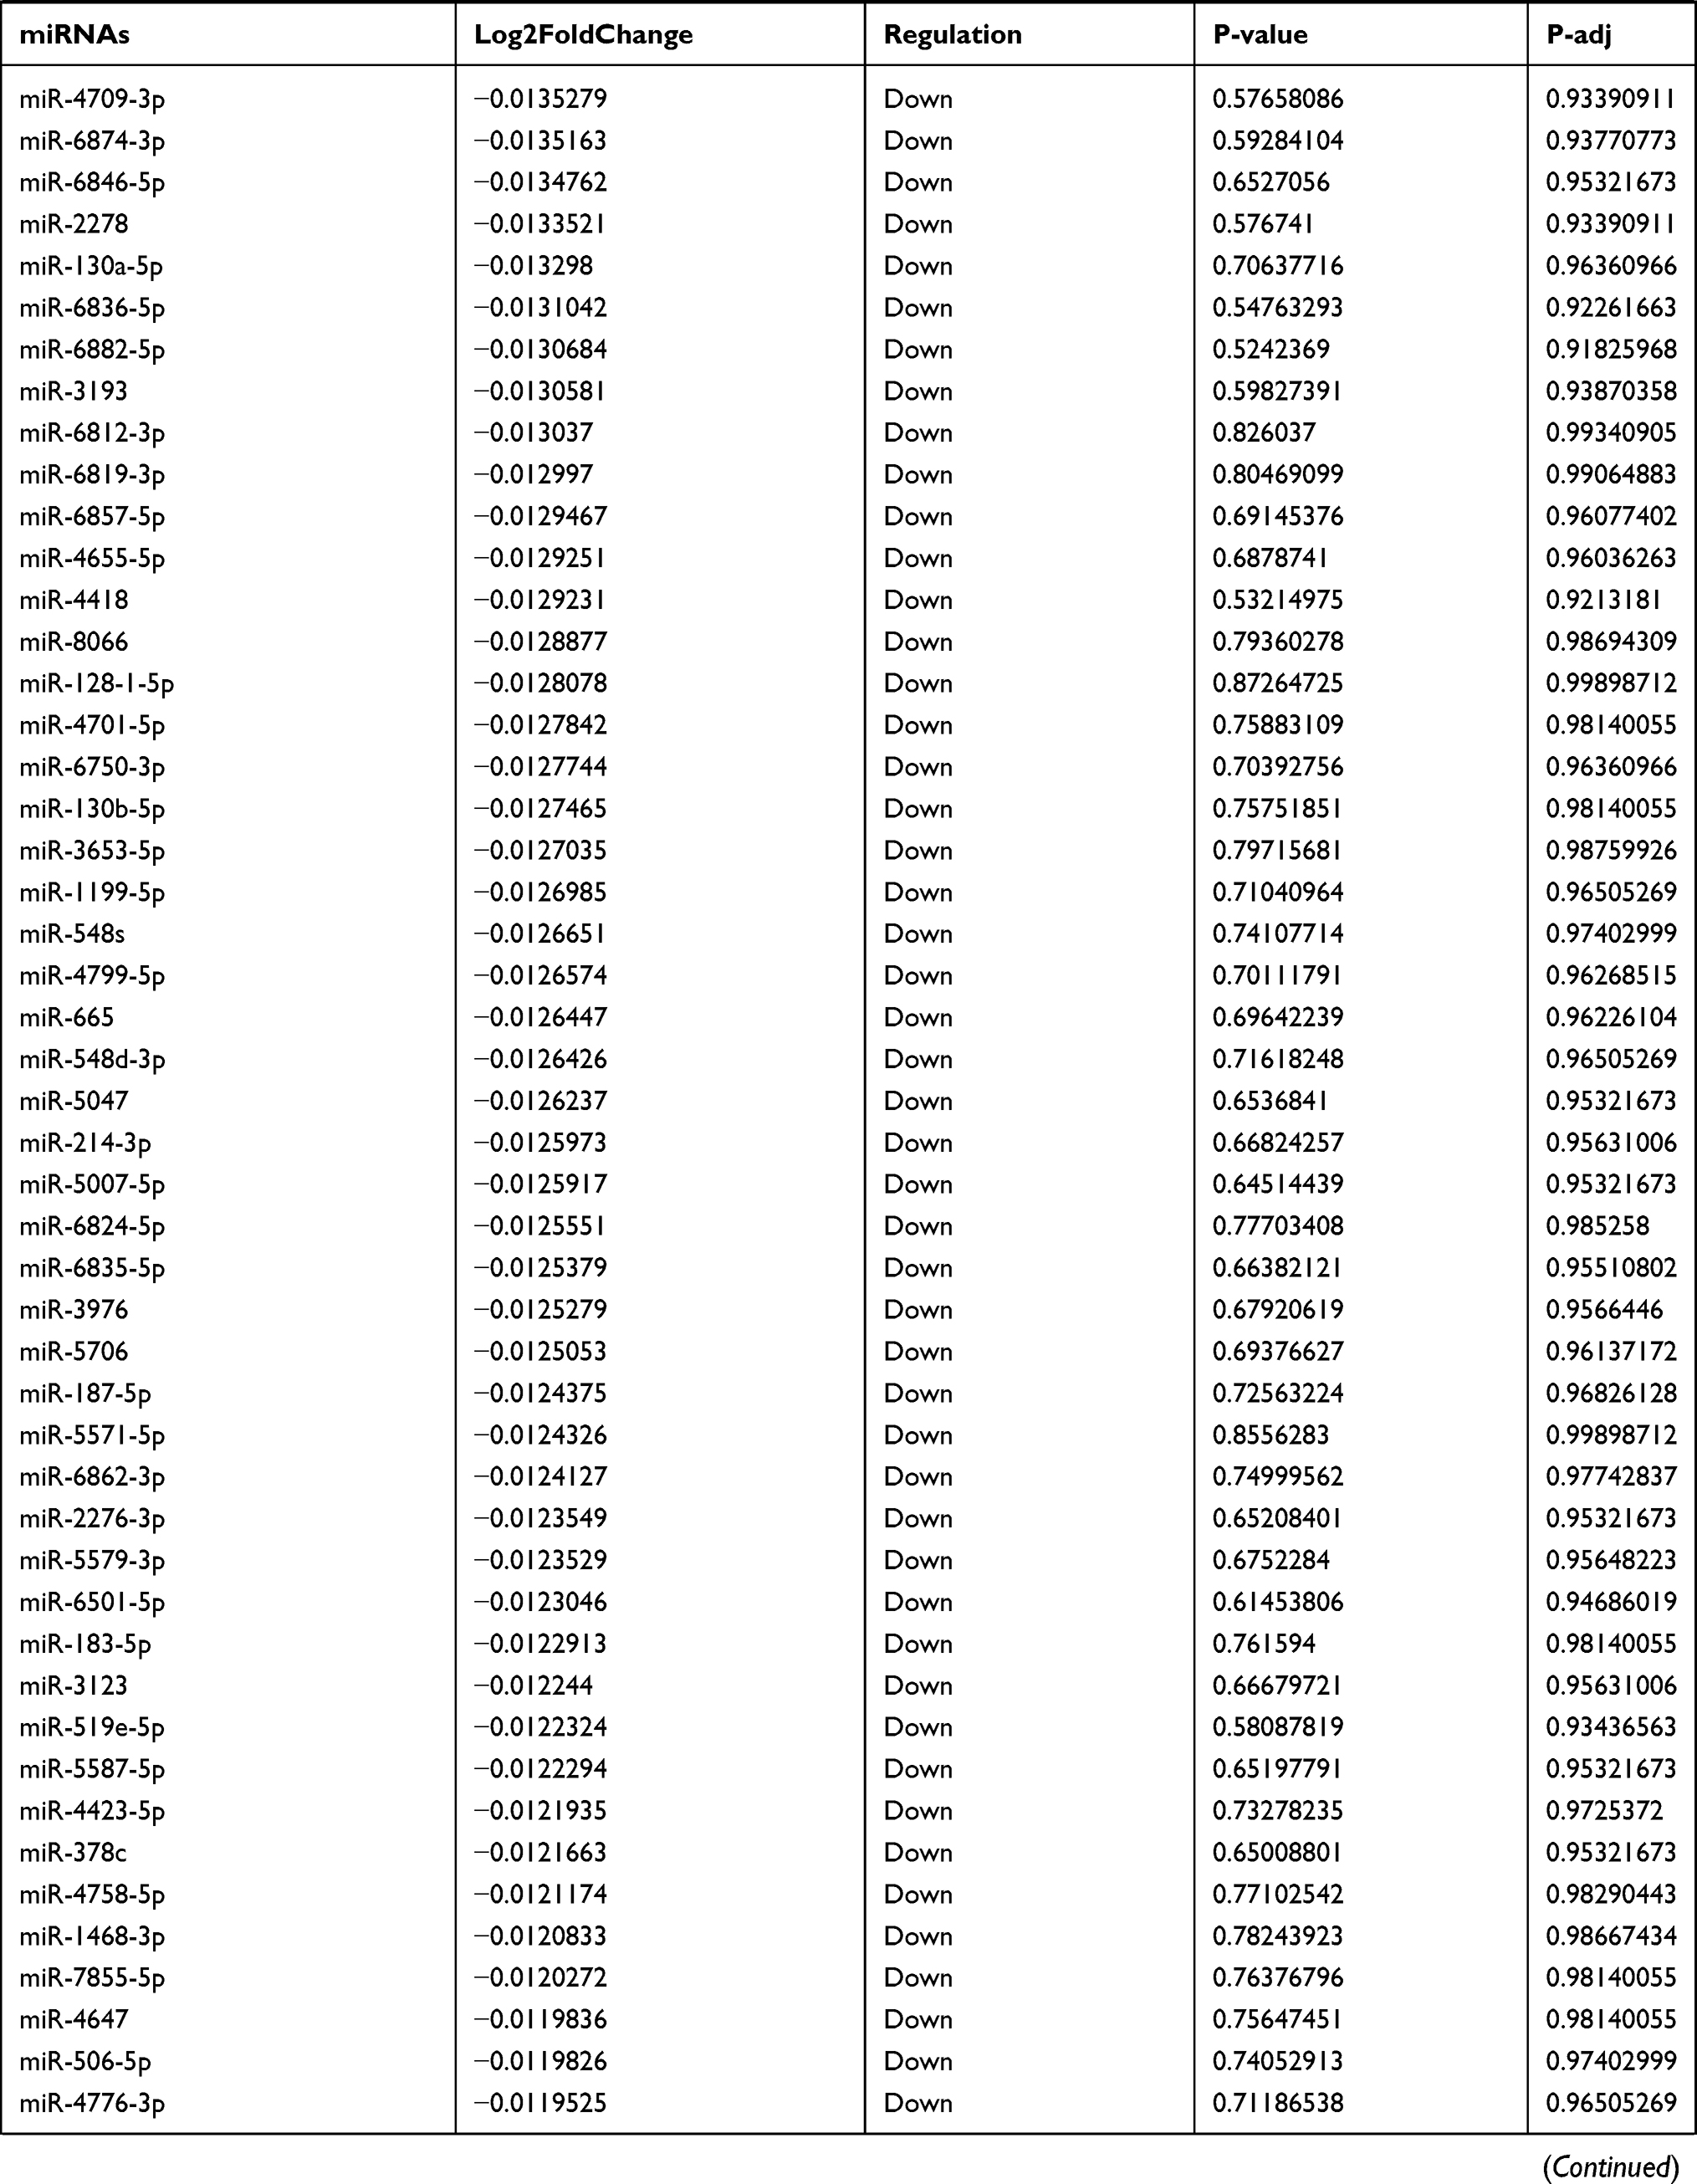 | 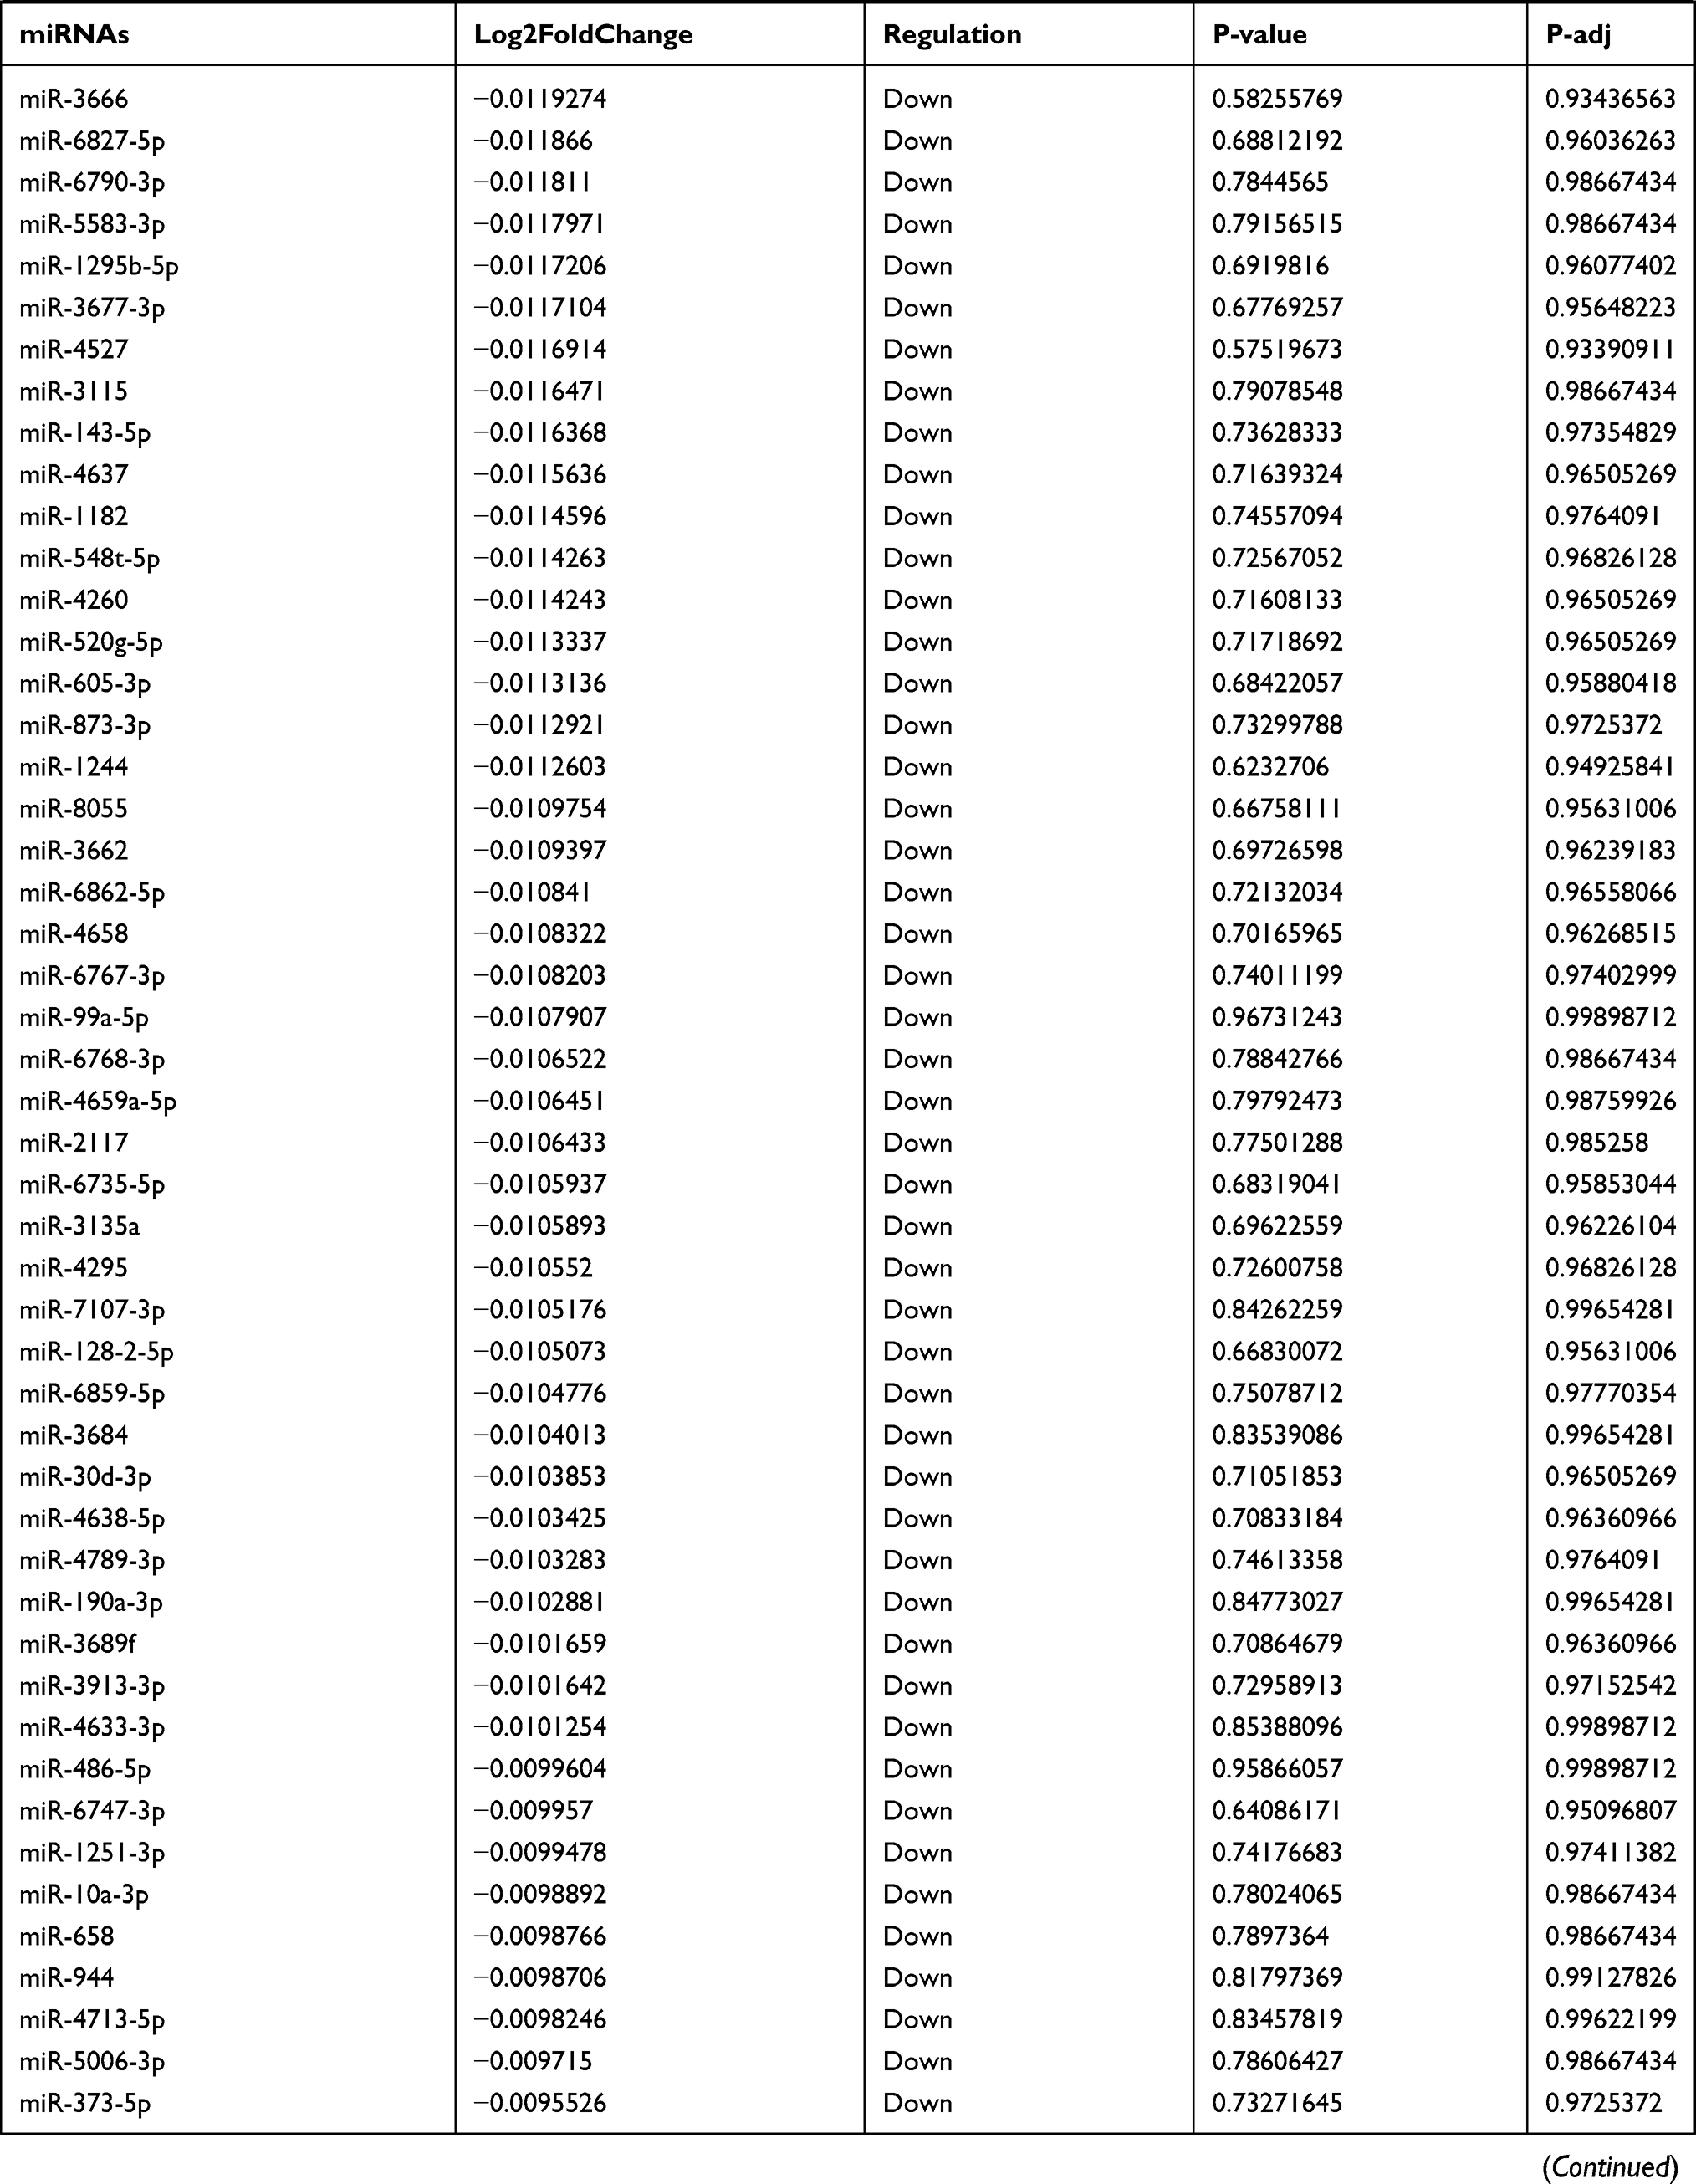 | 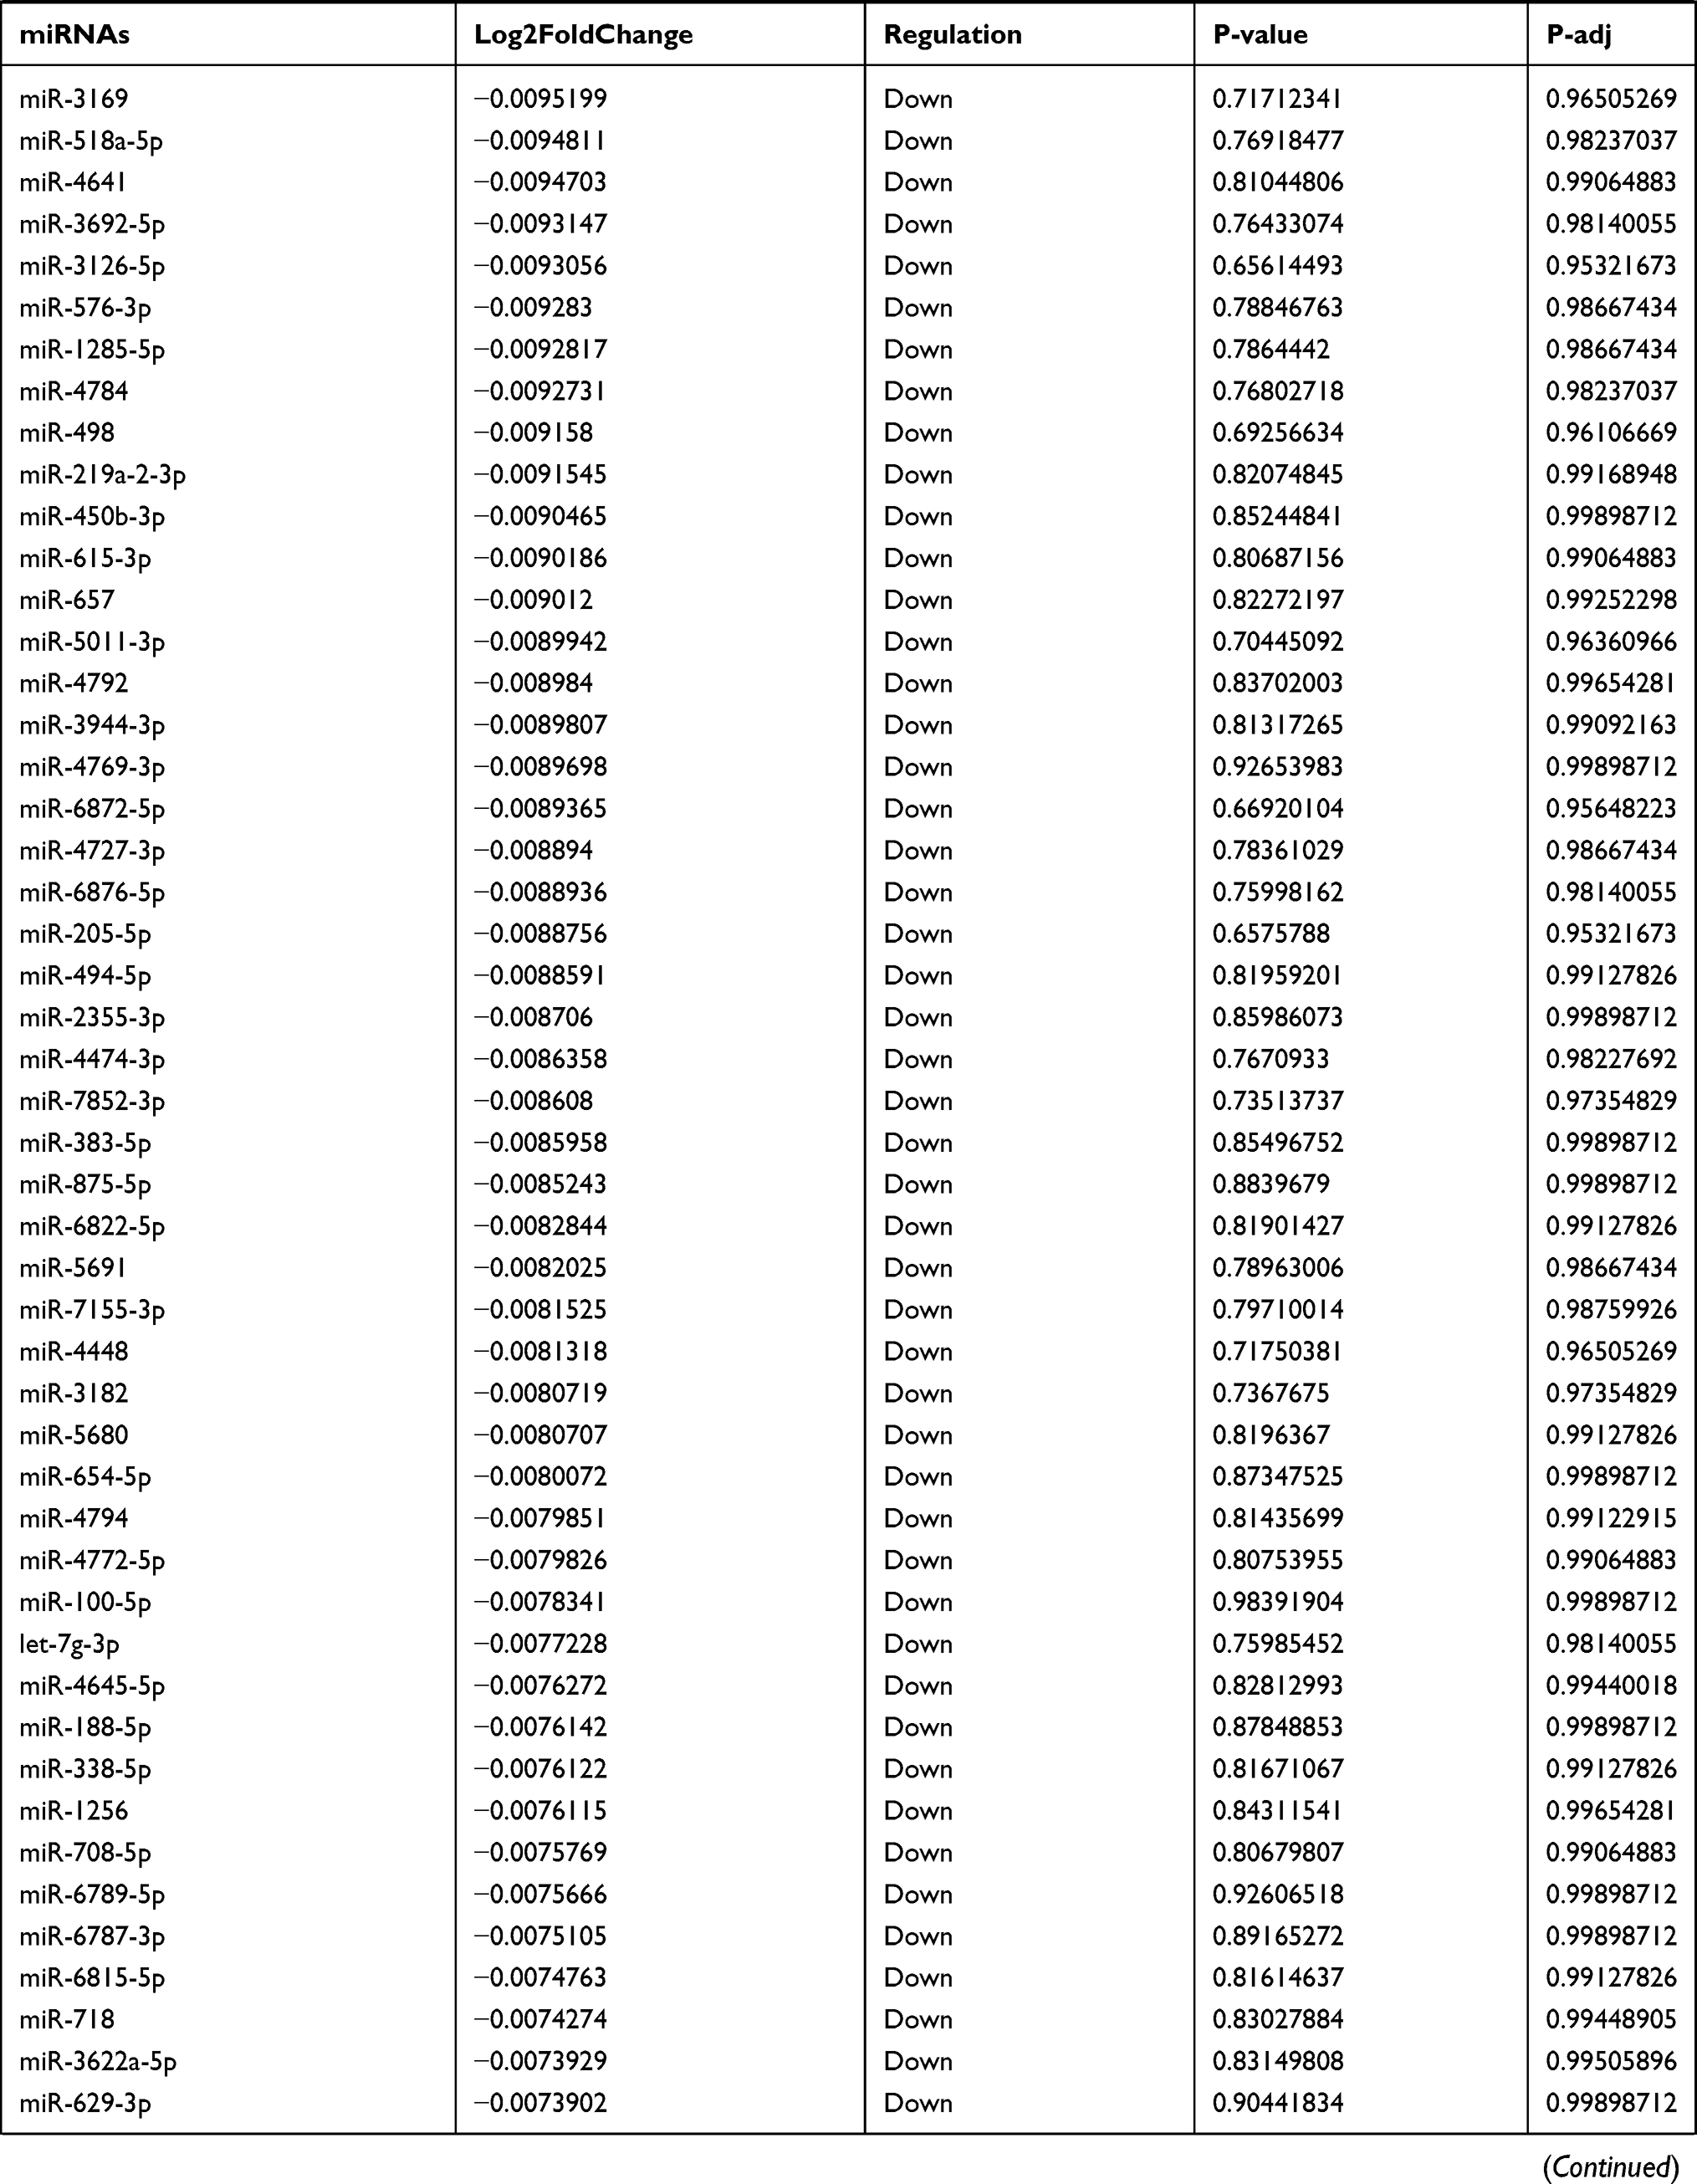 | 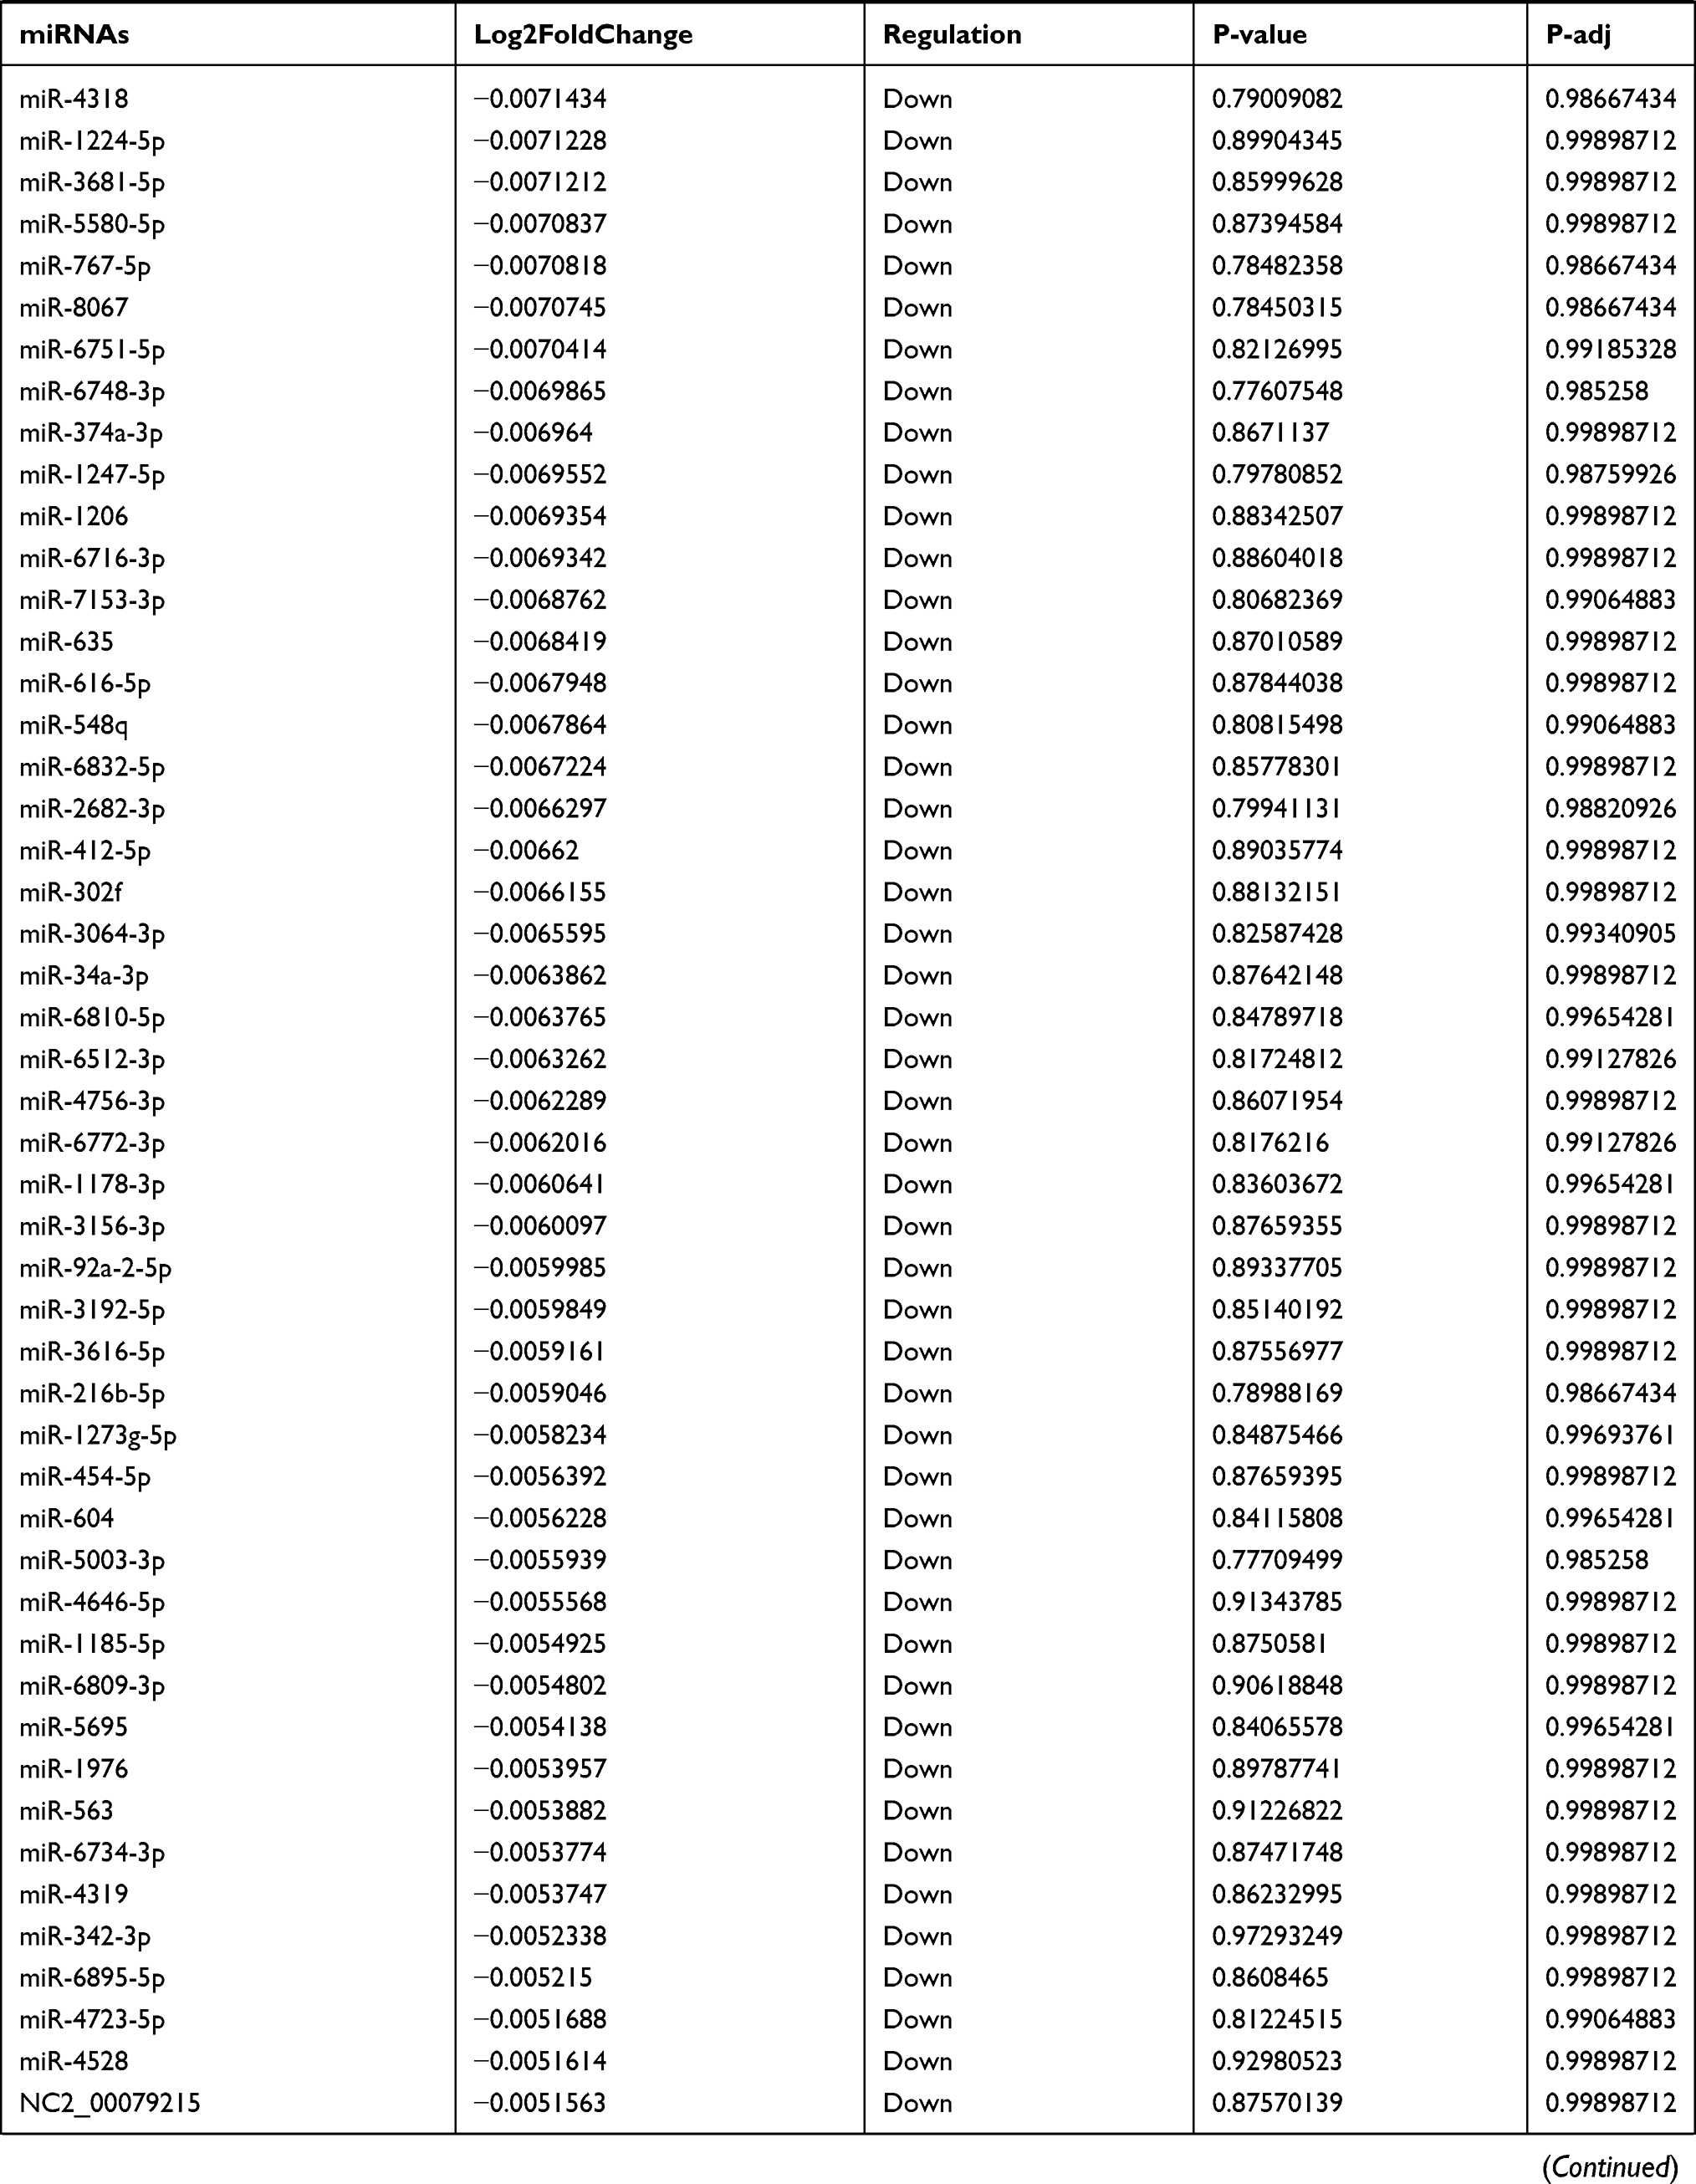 | 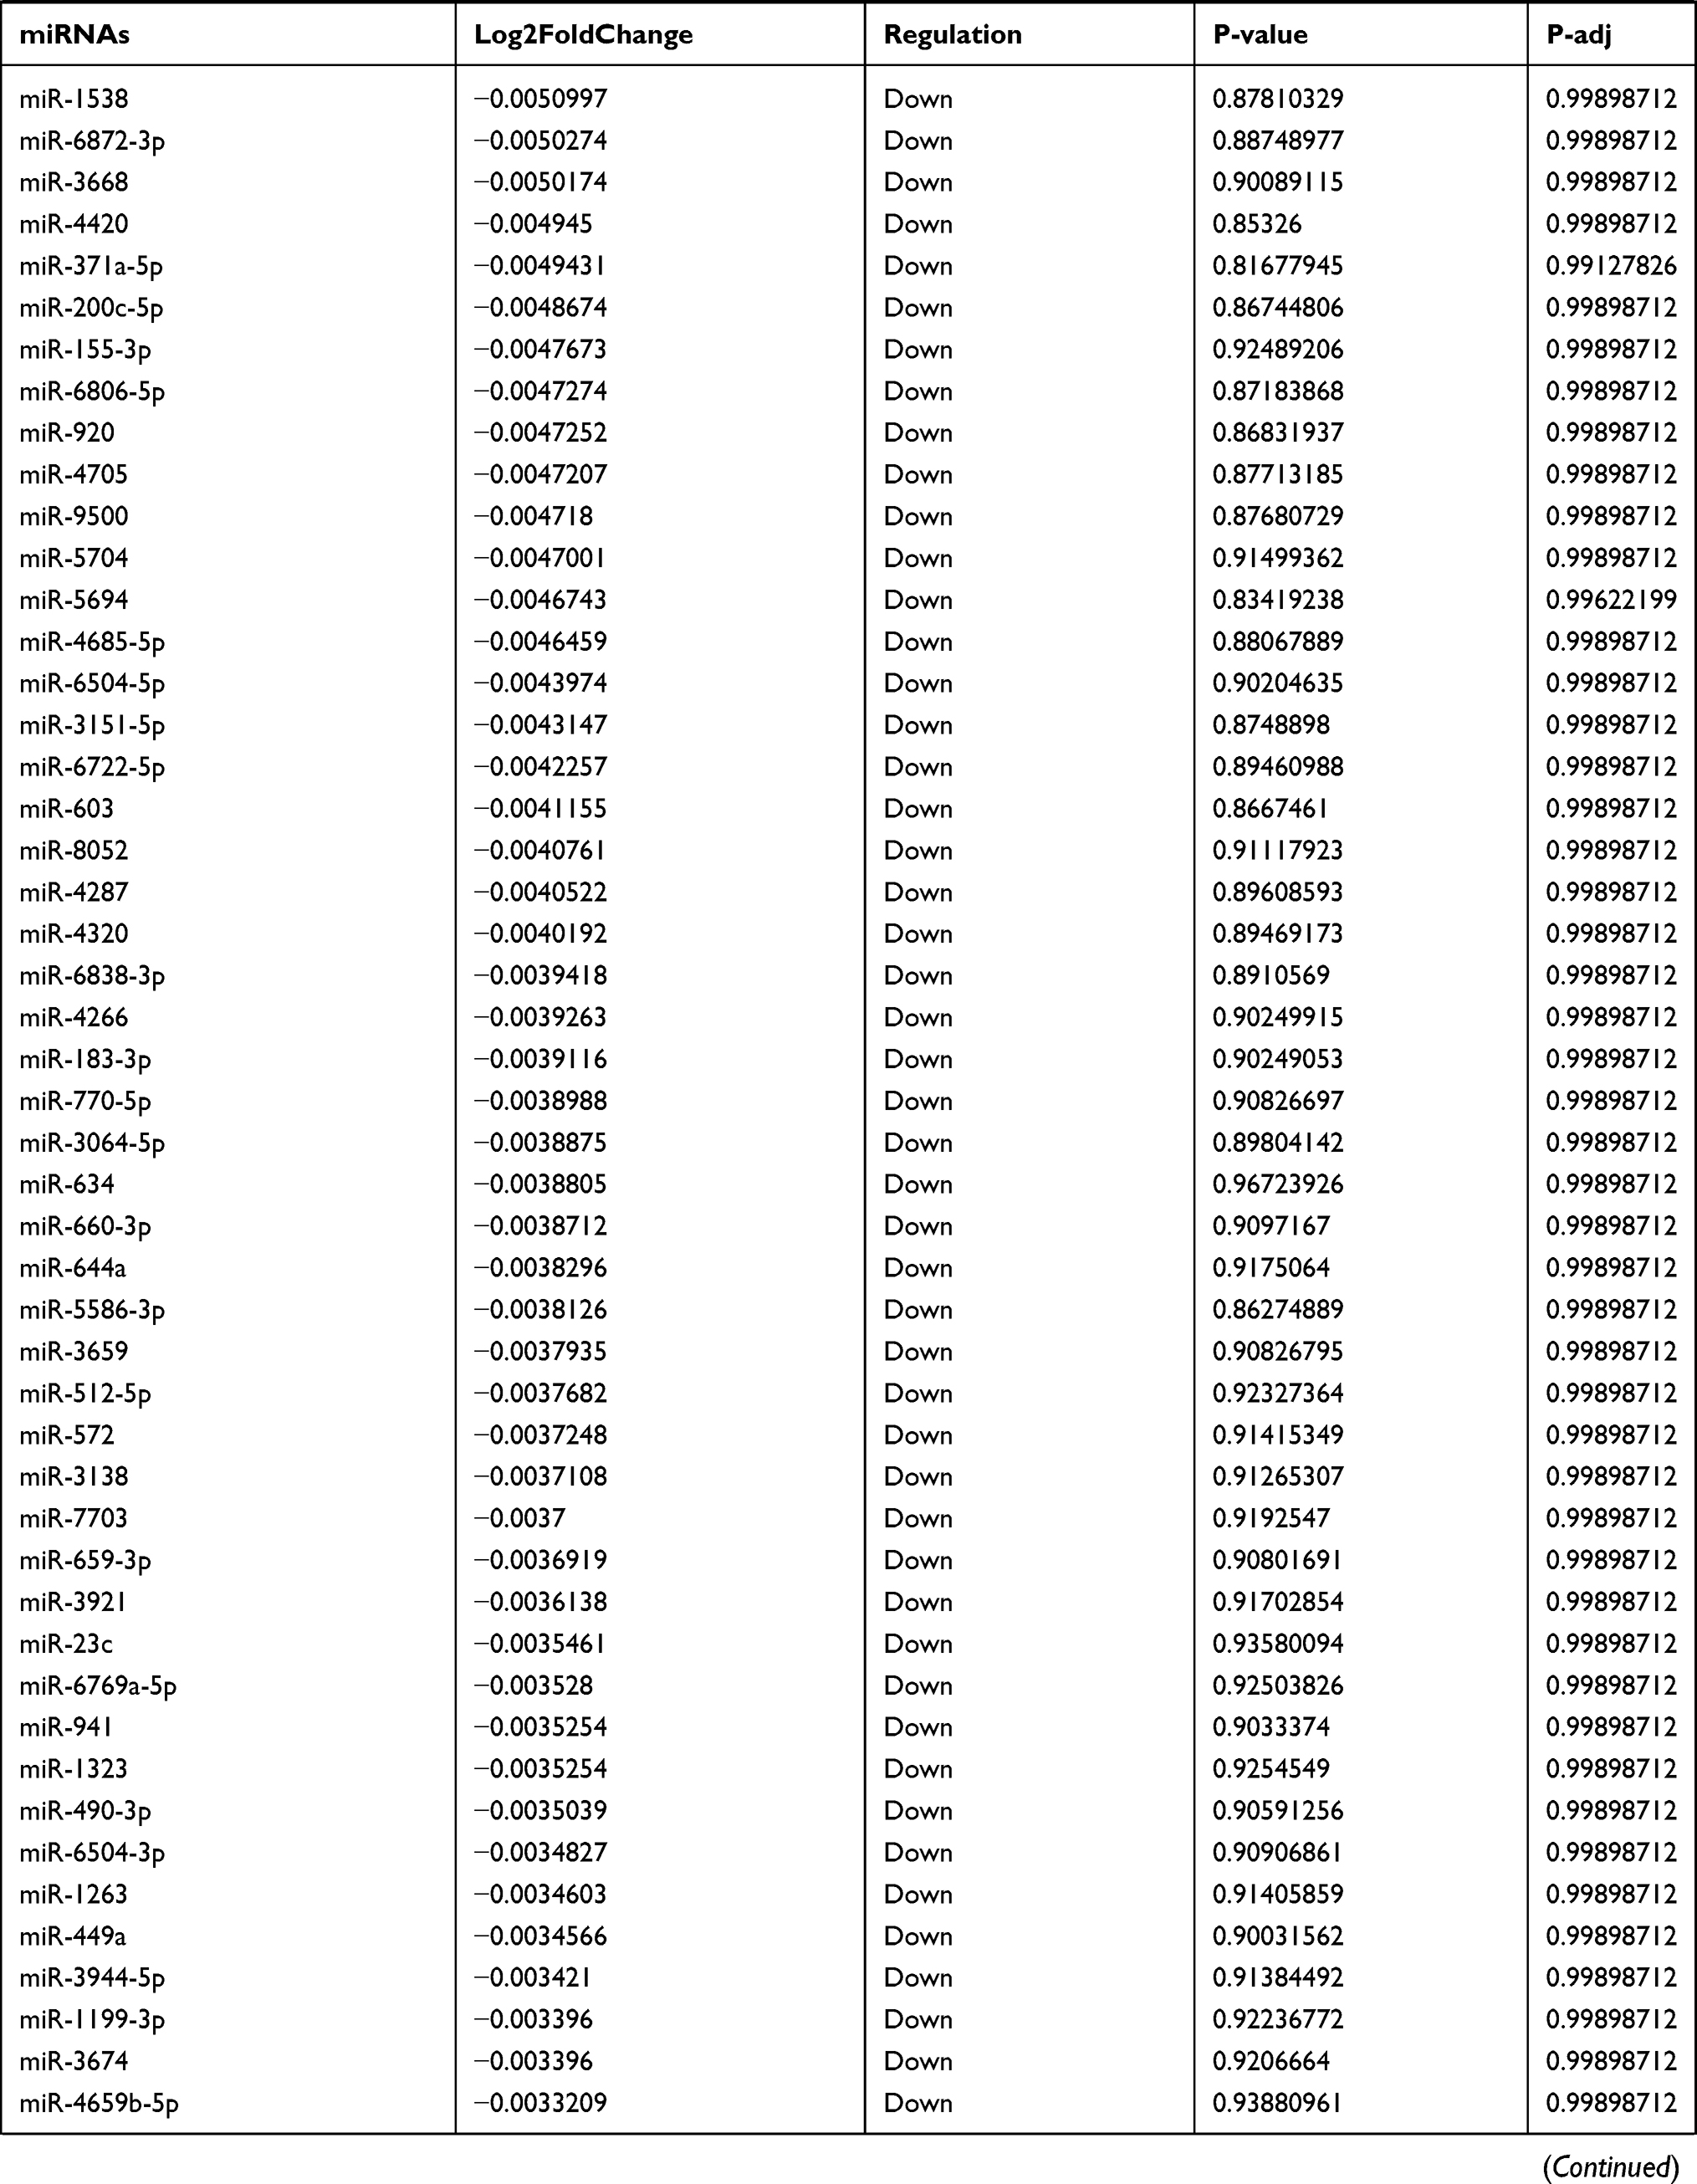 | 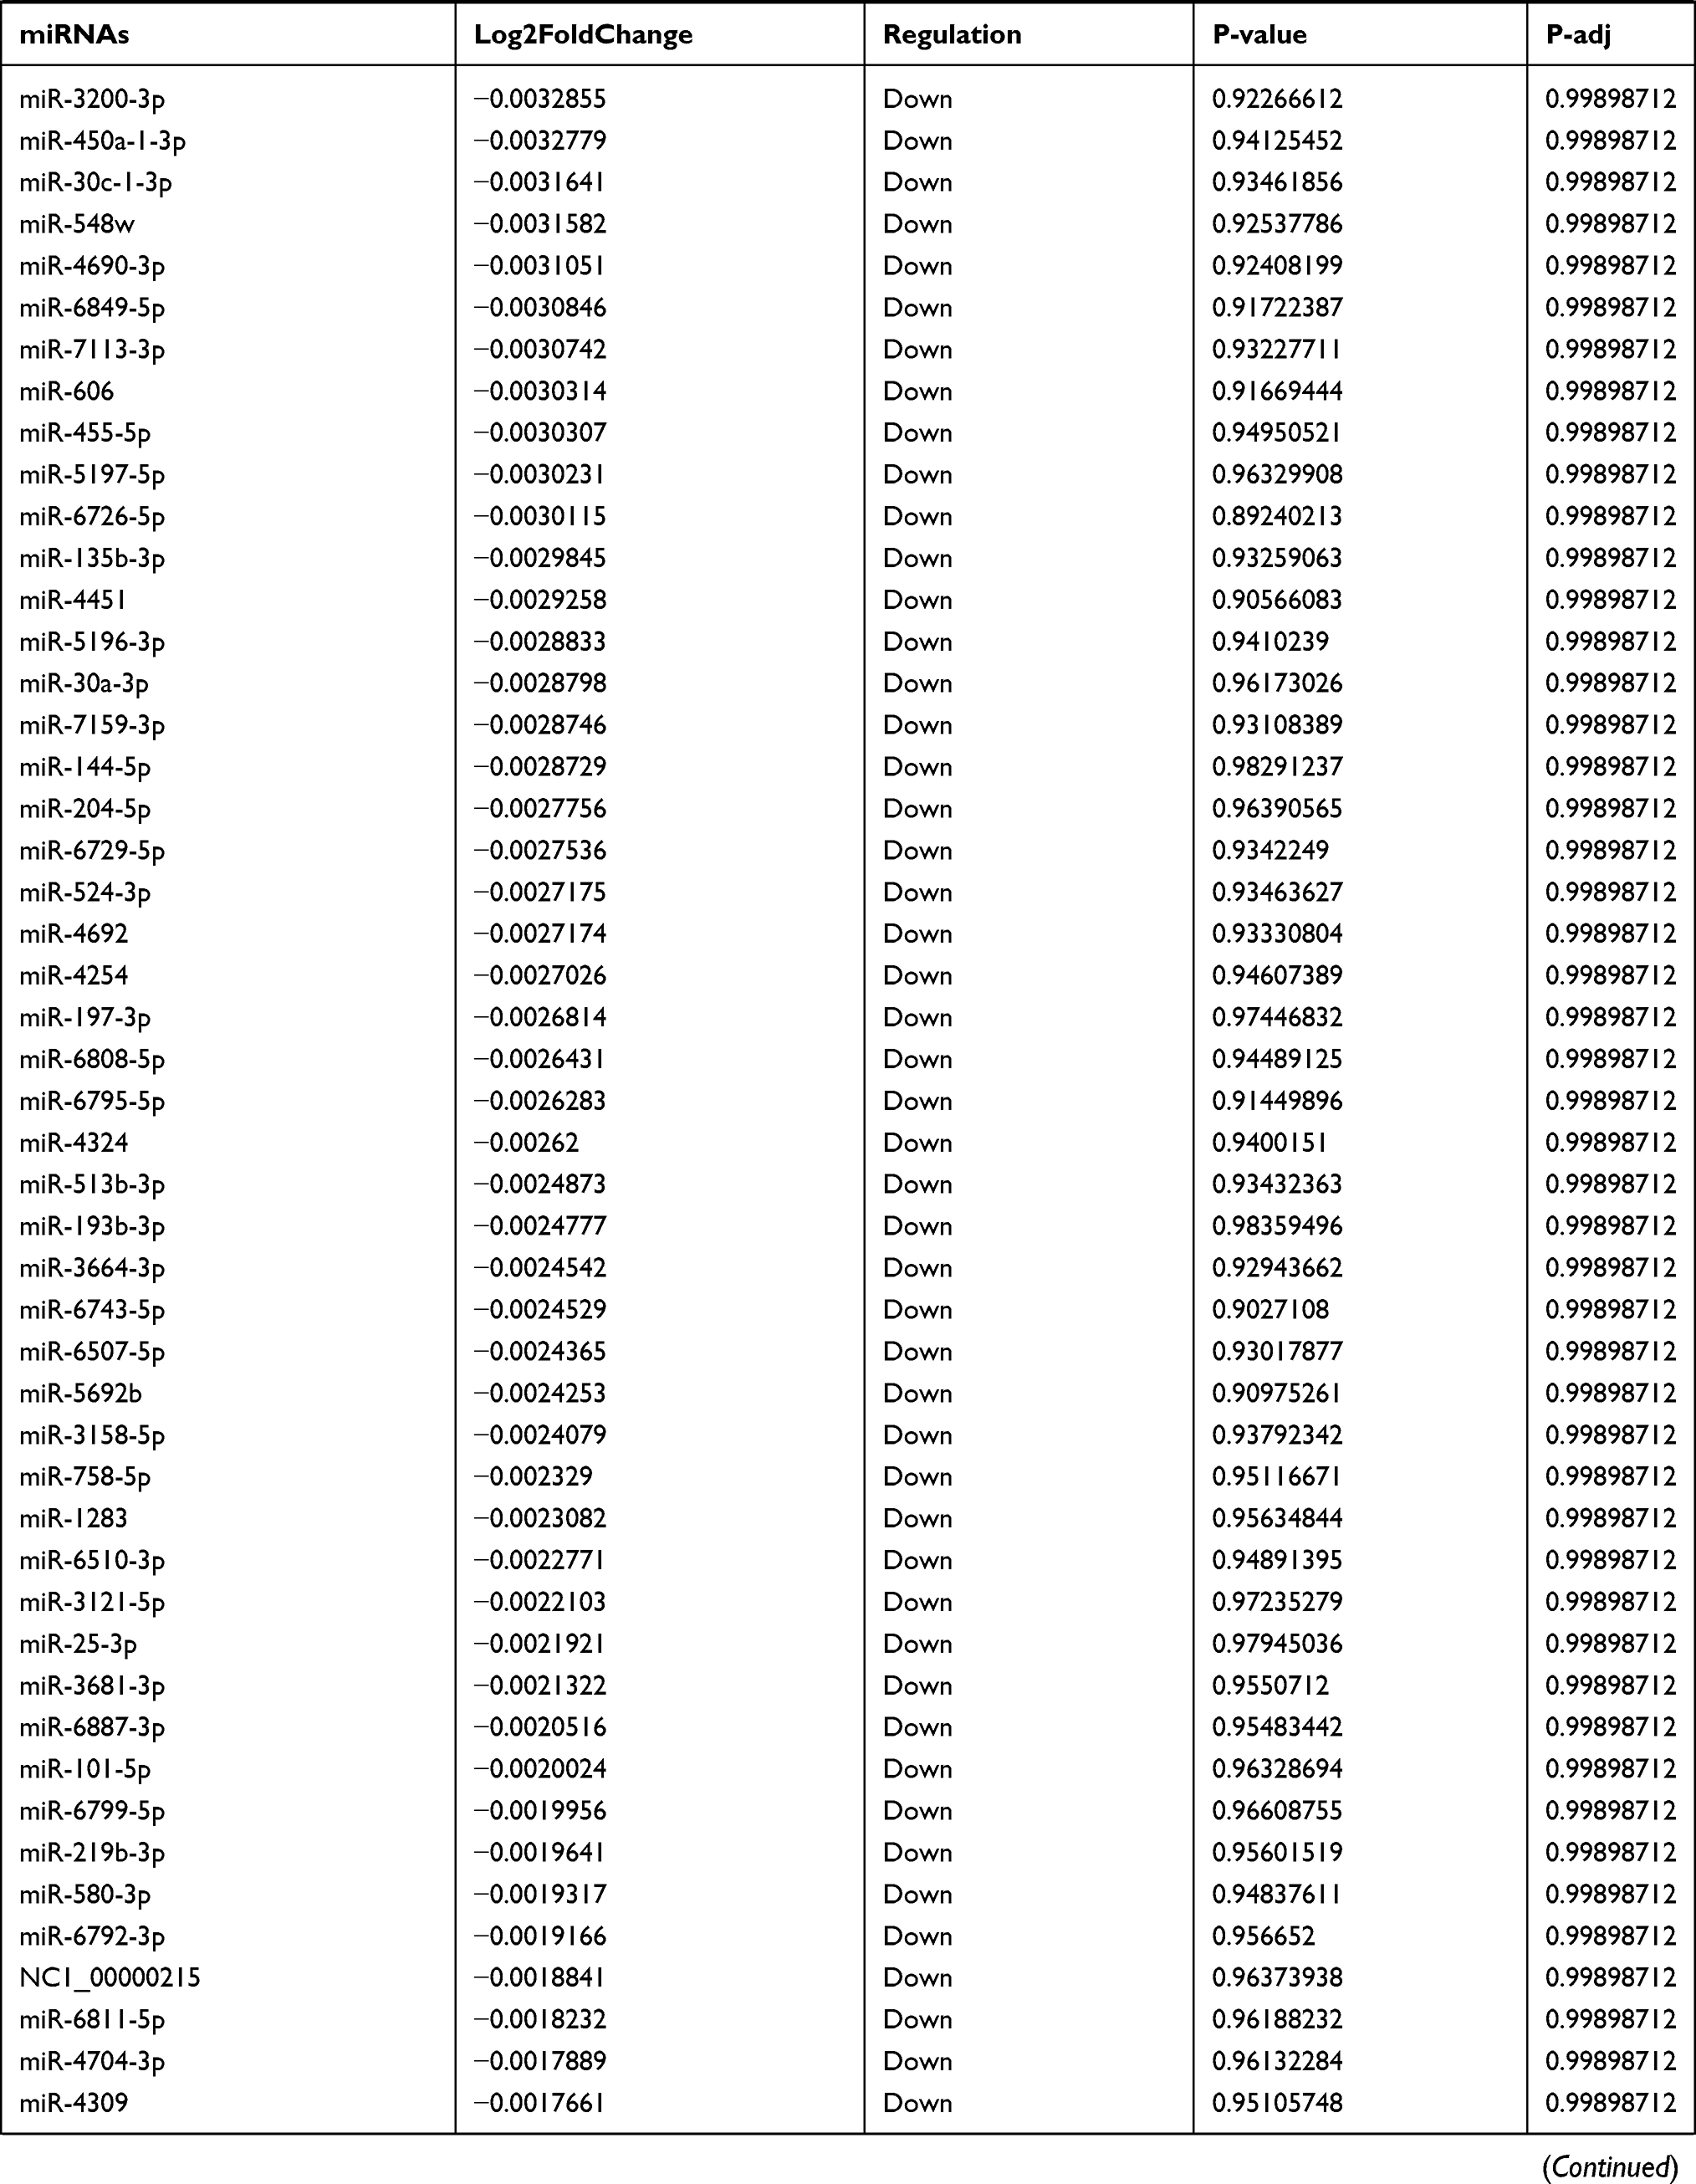 | 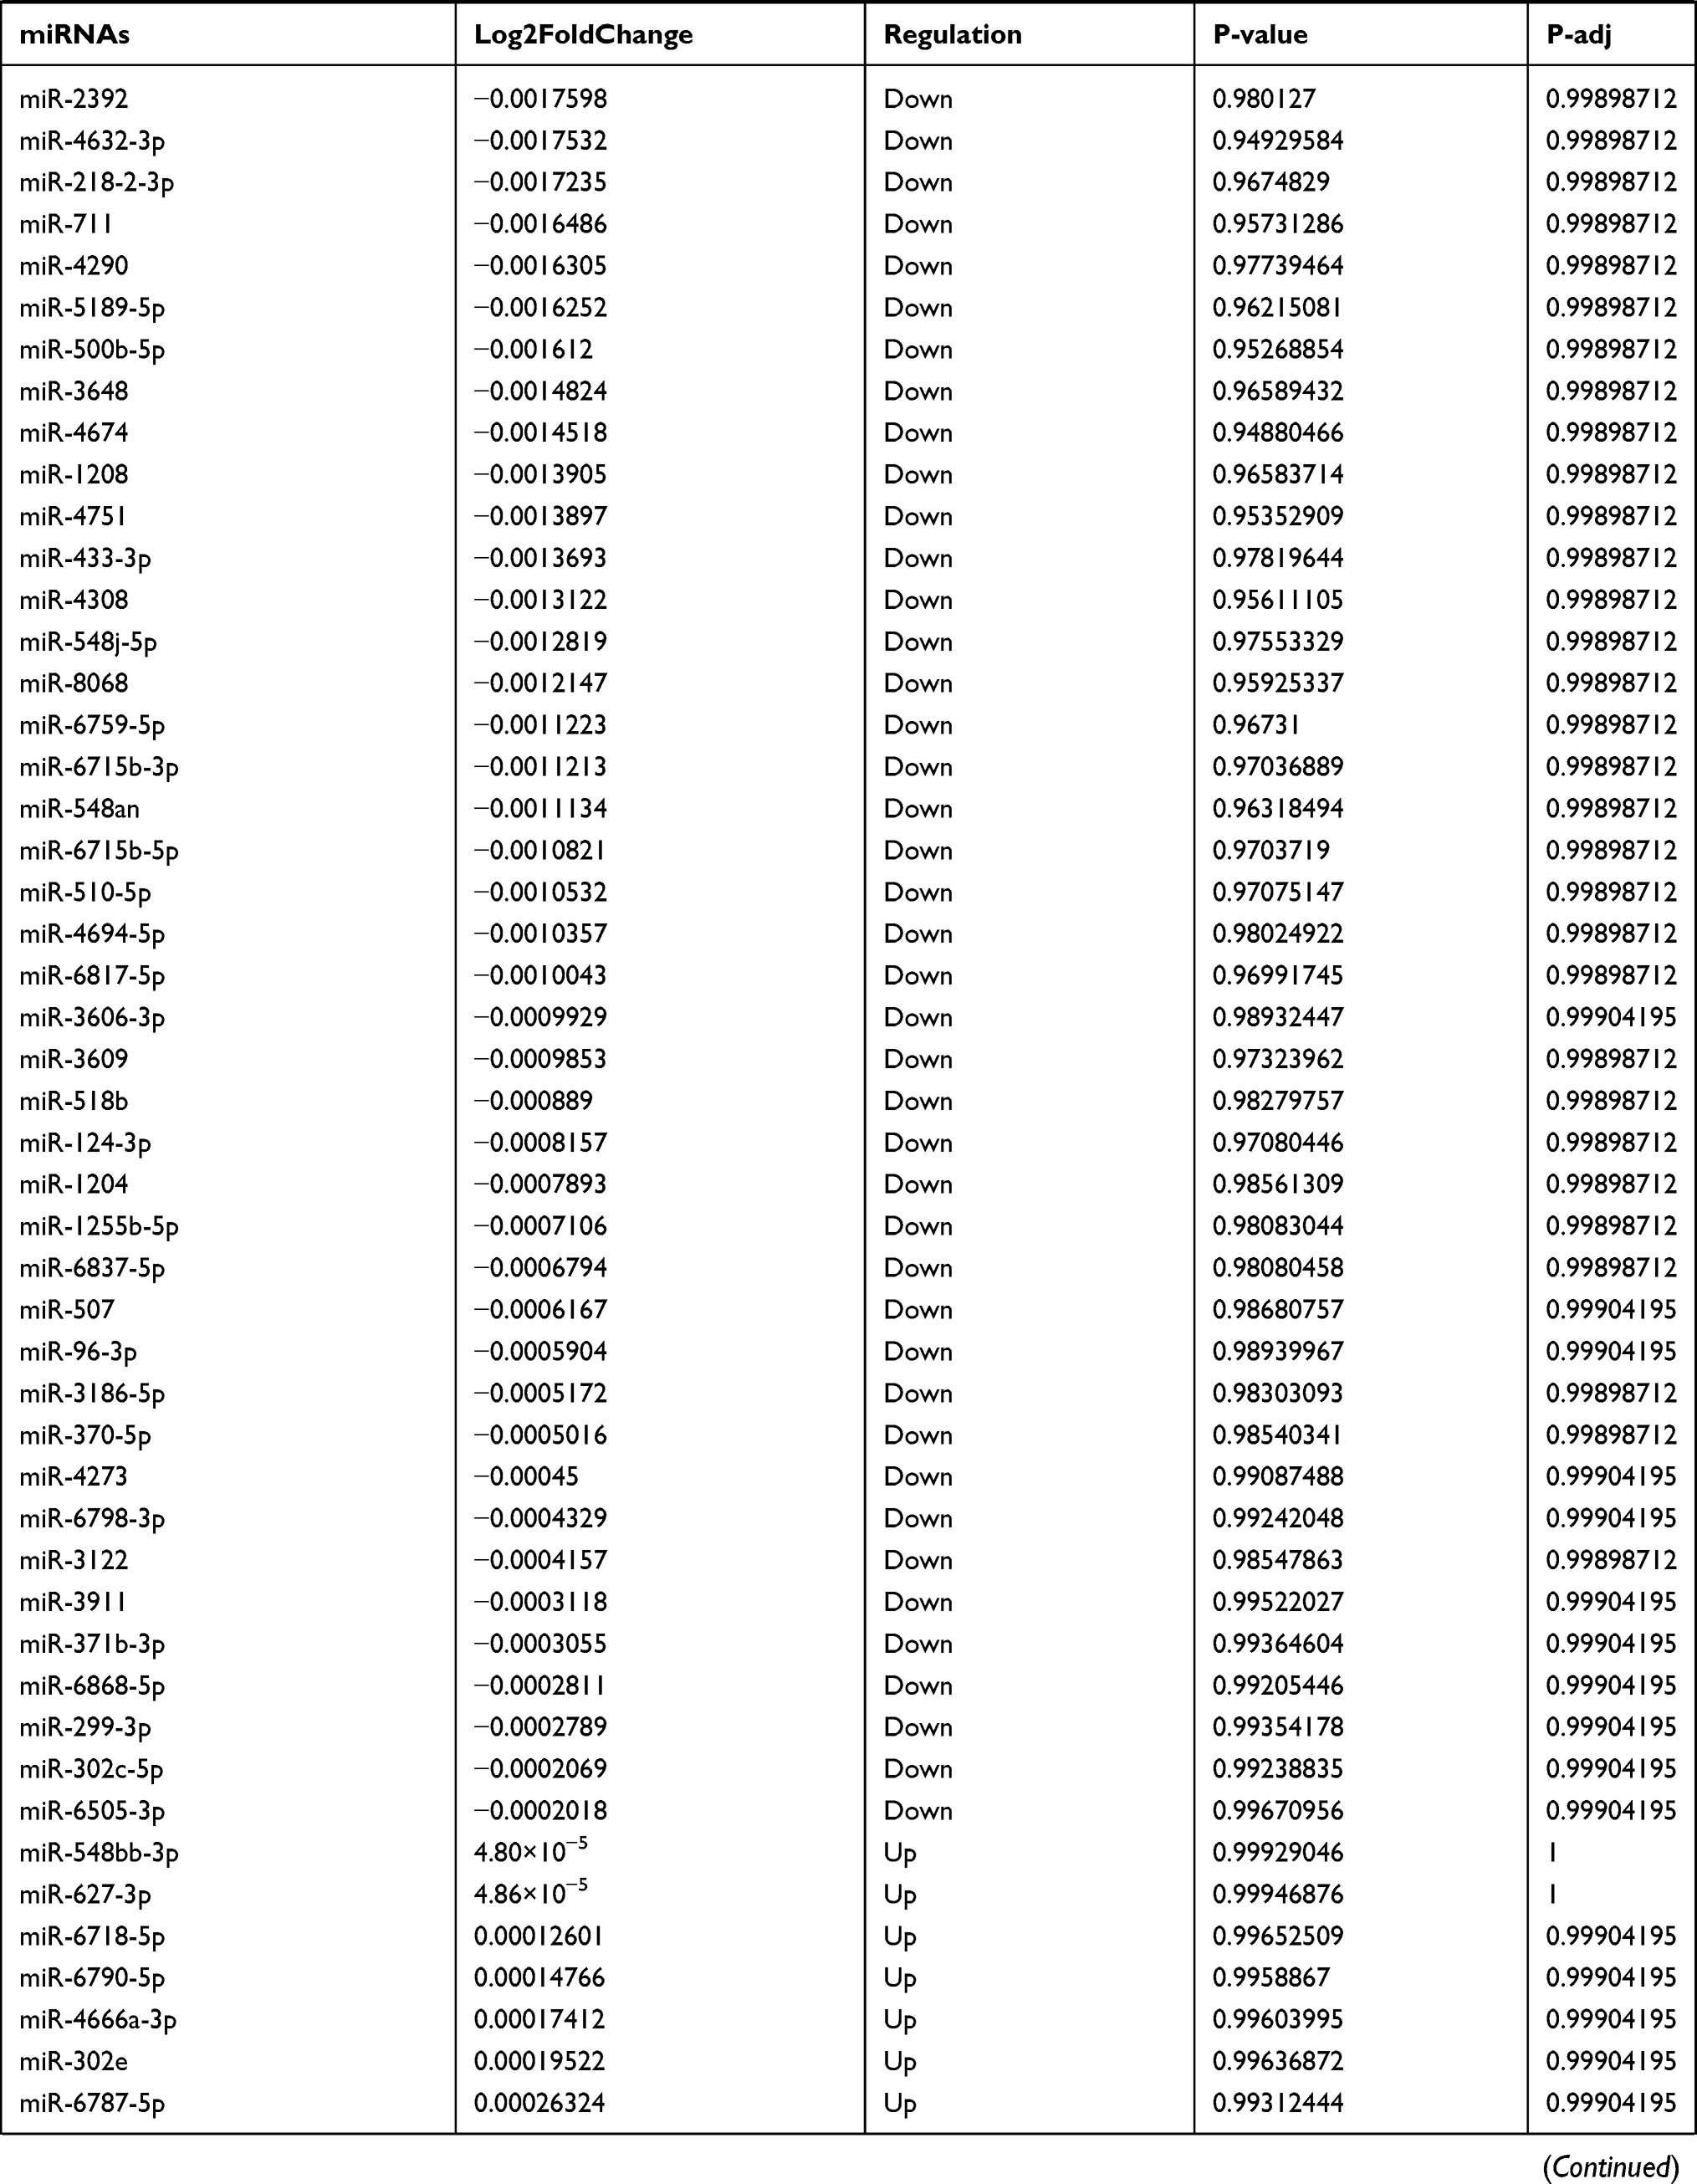 | 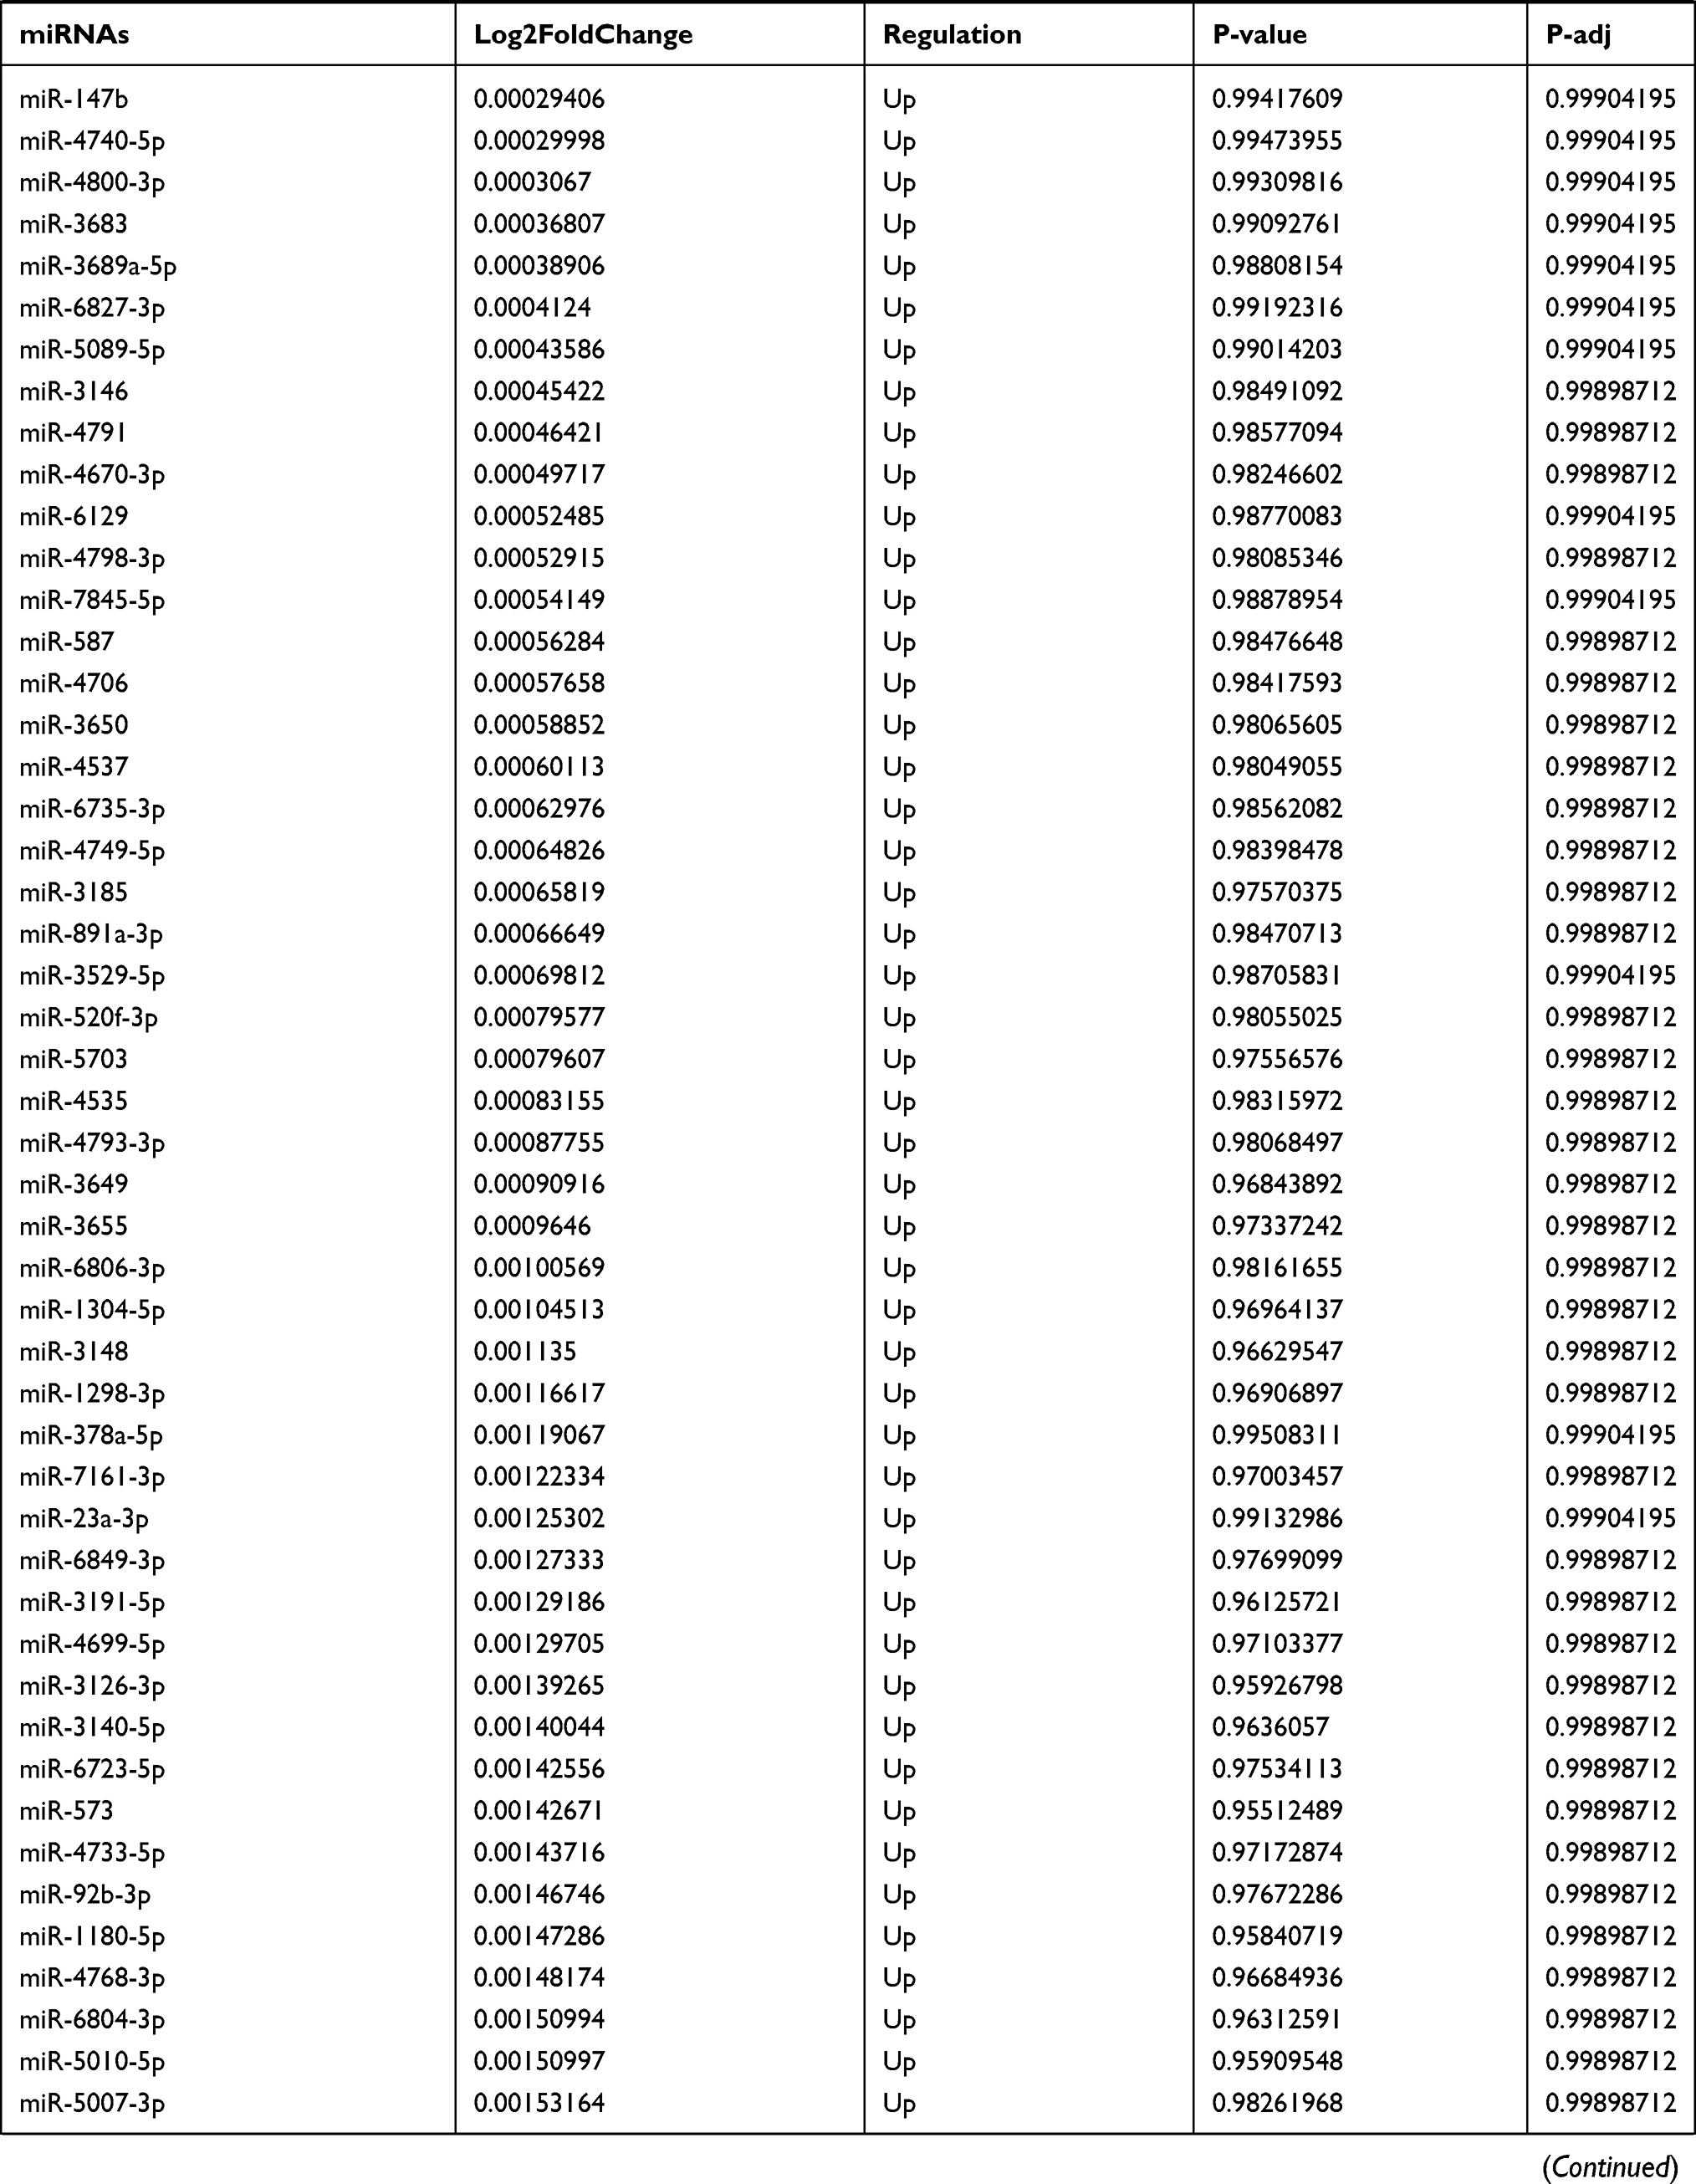 | 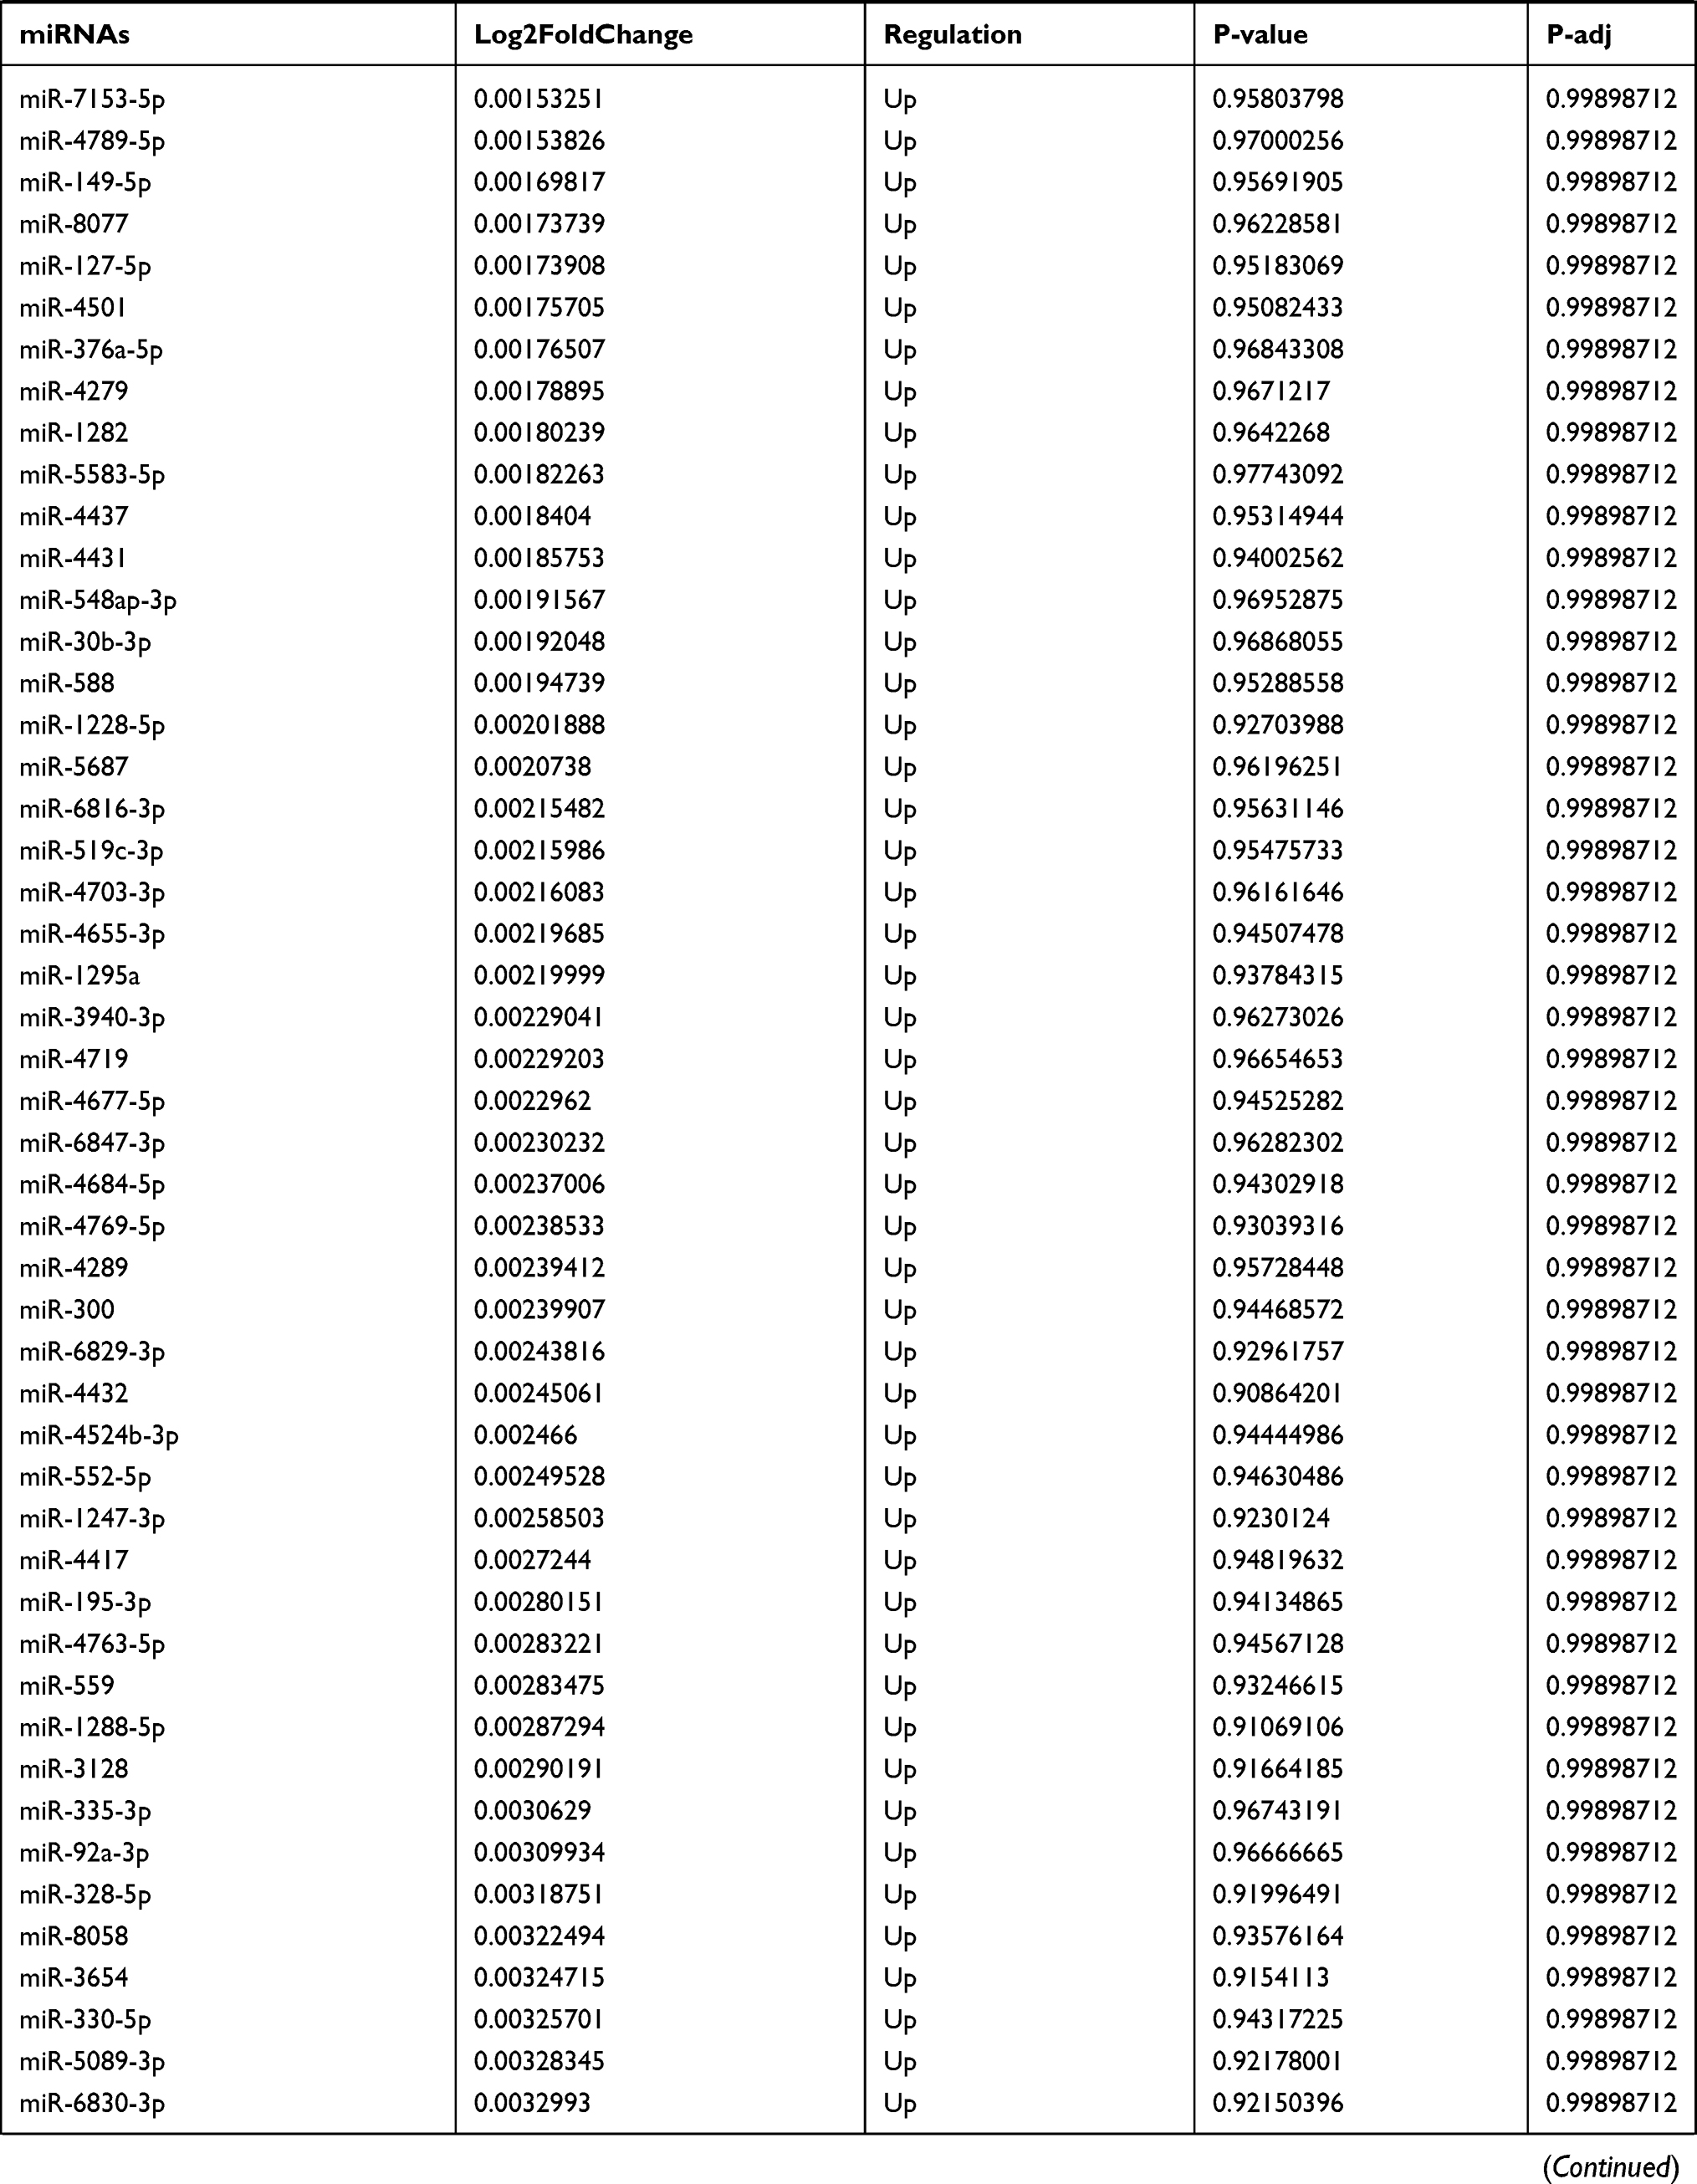 | 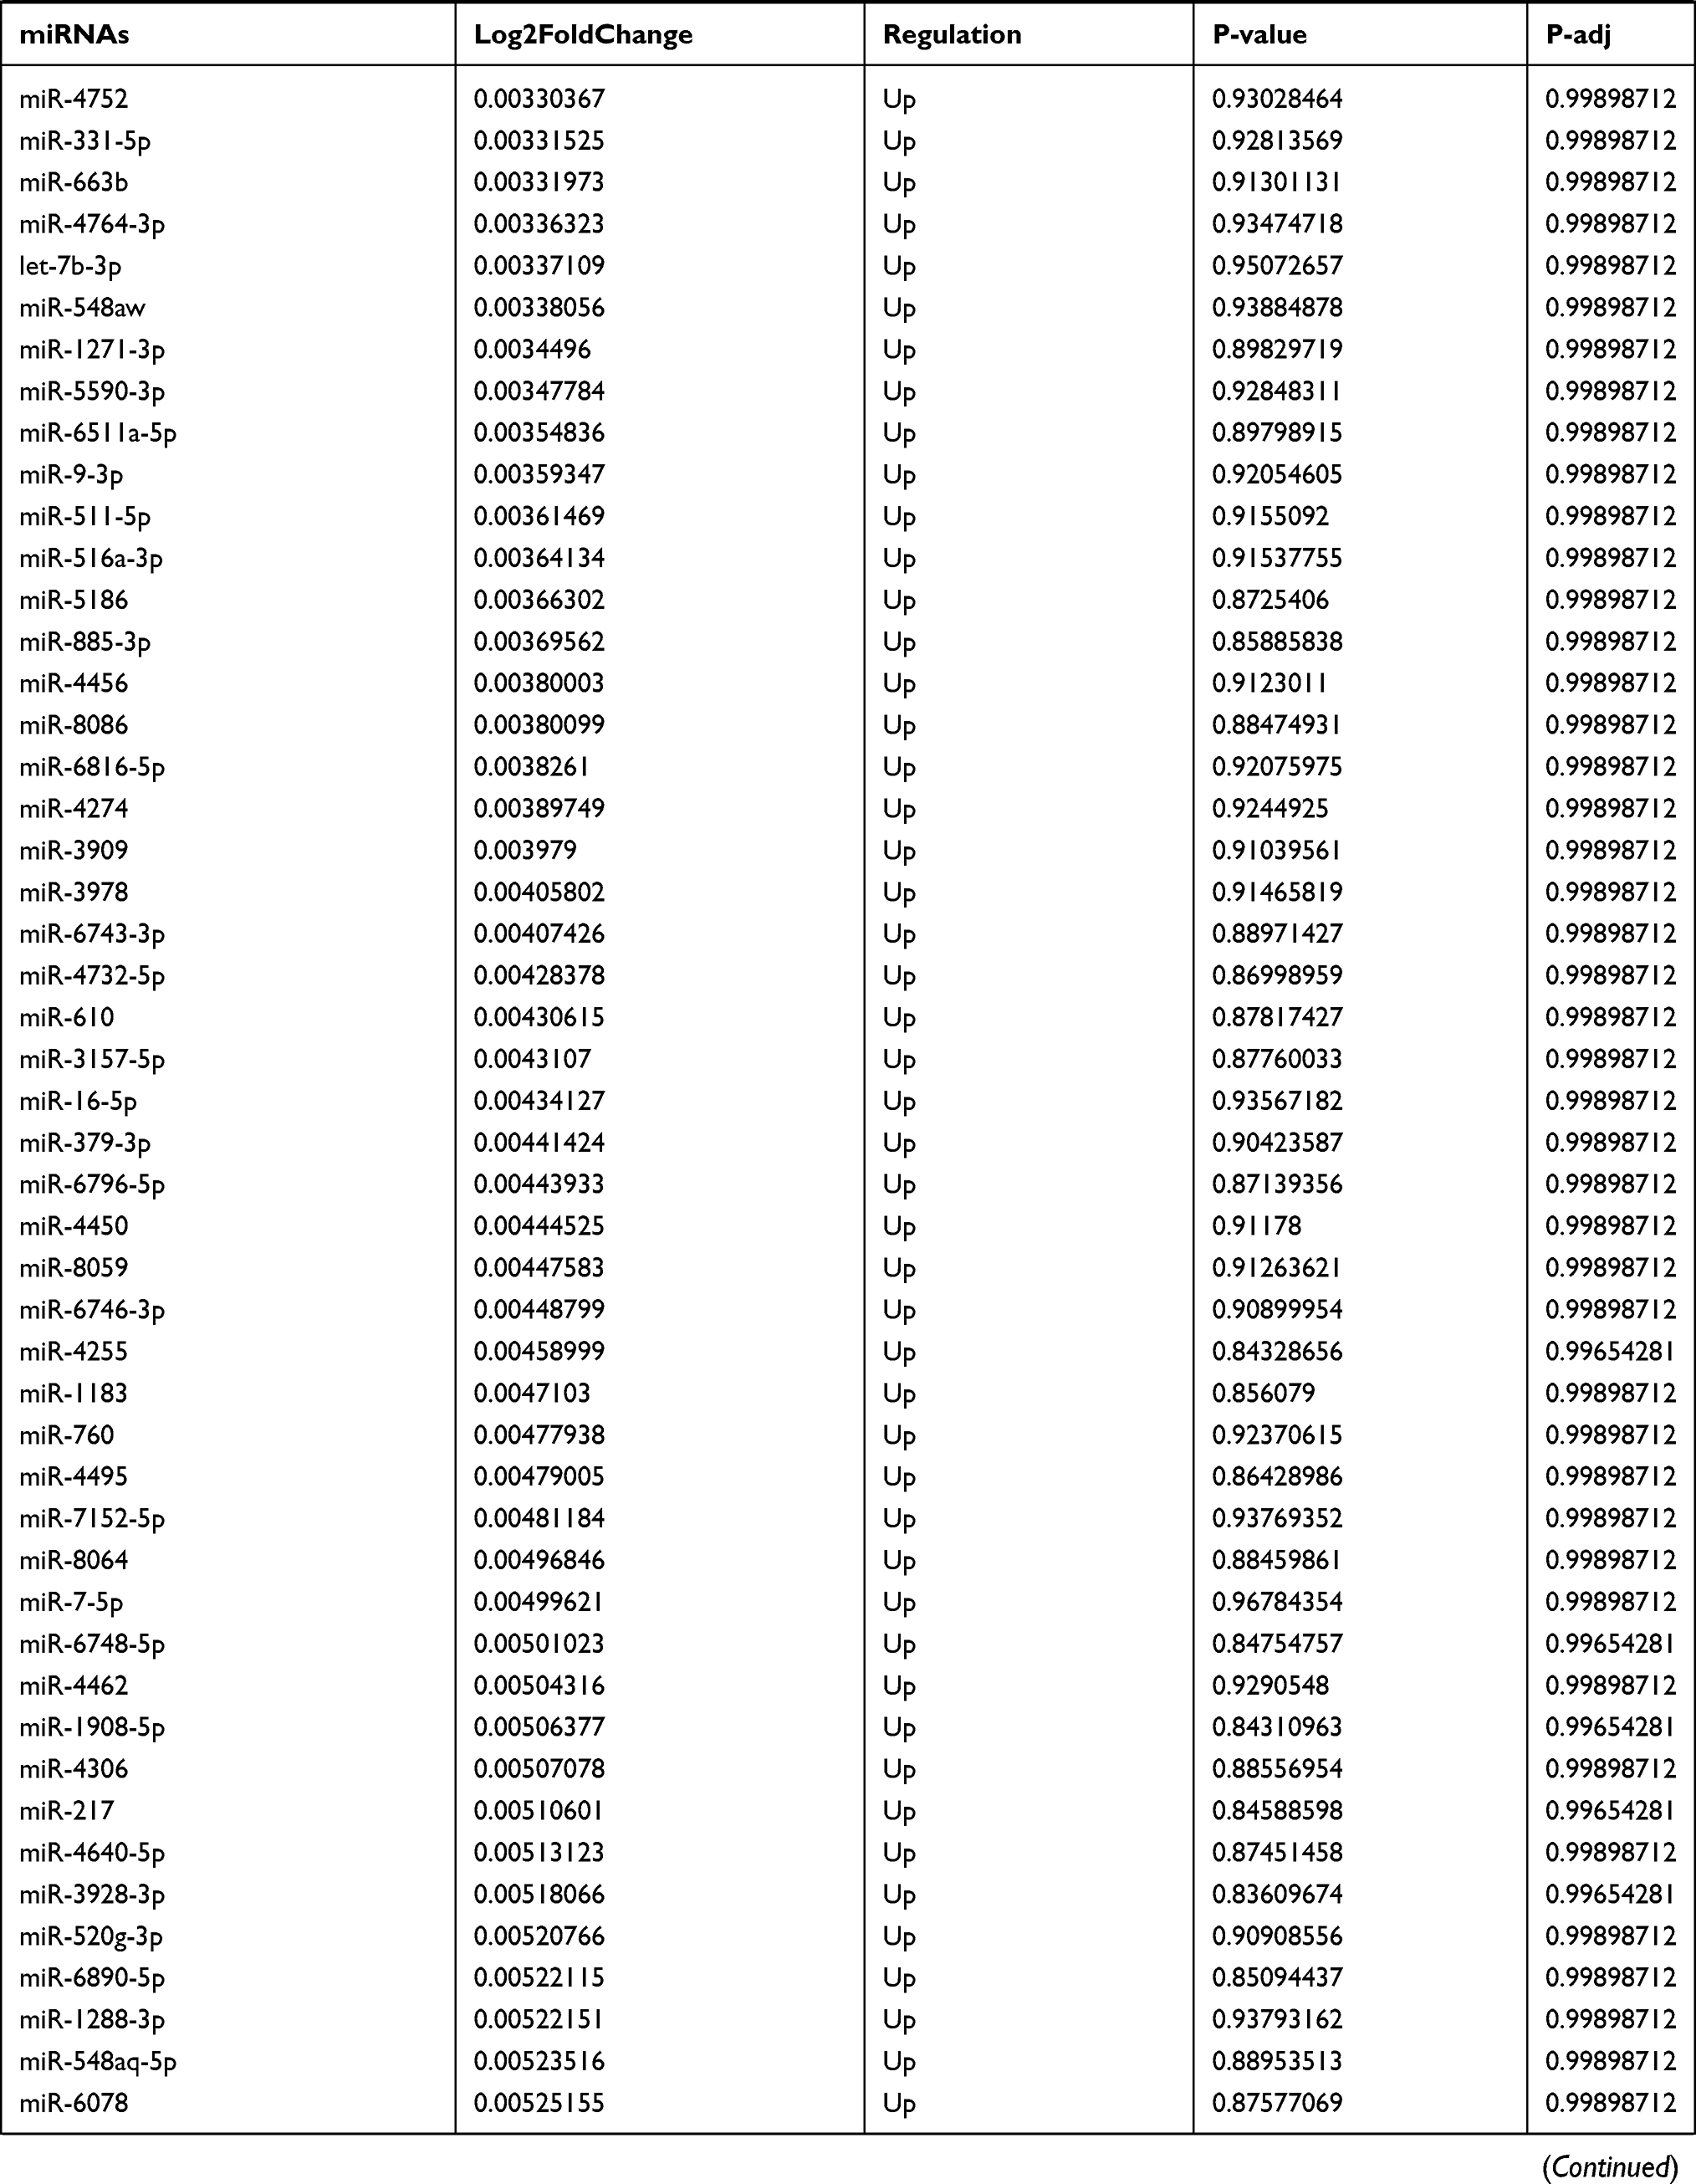 | 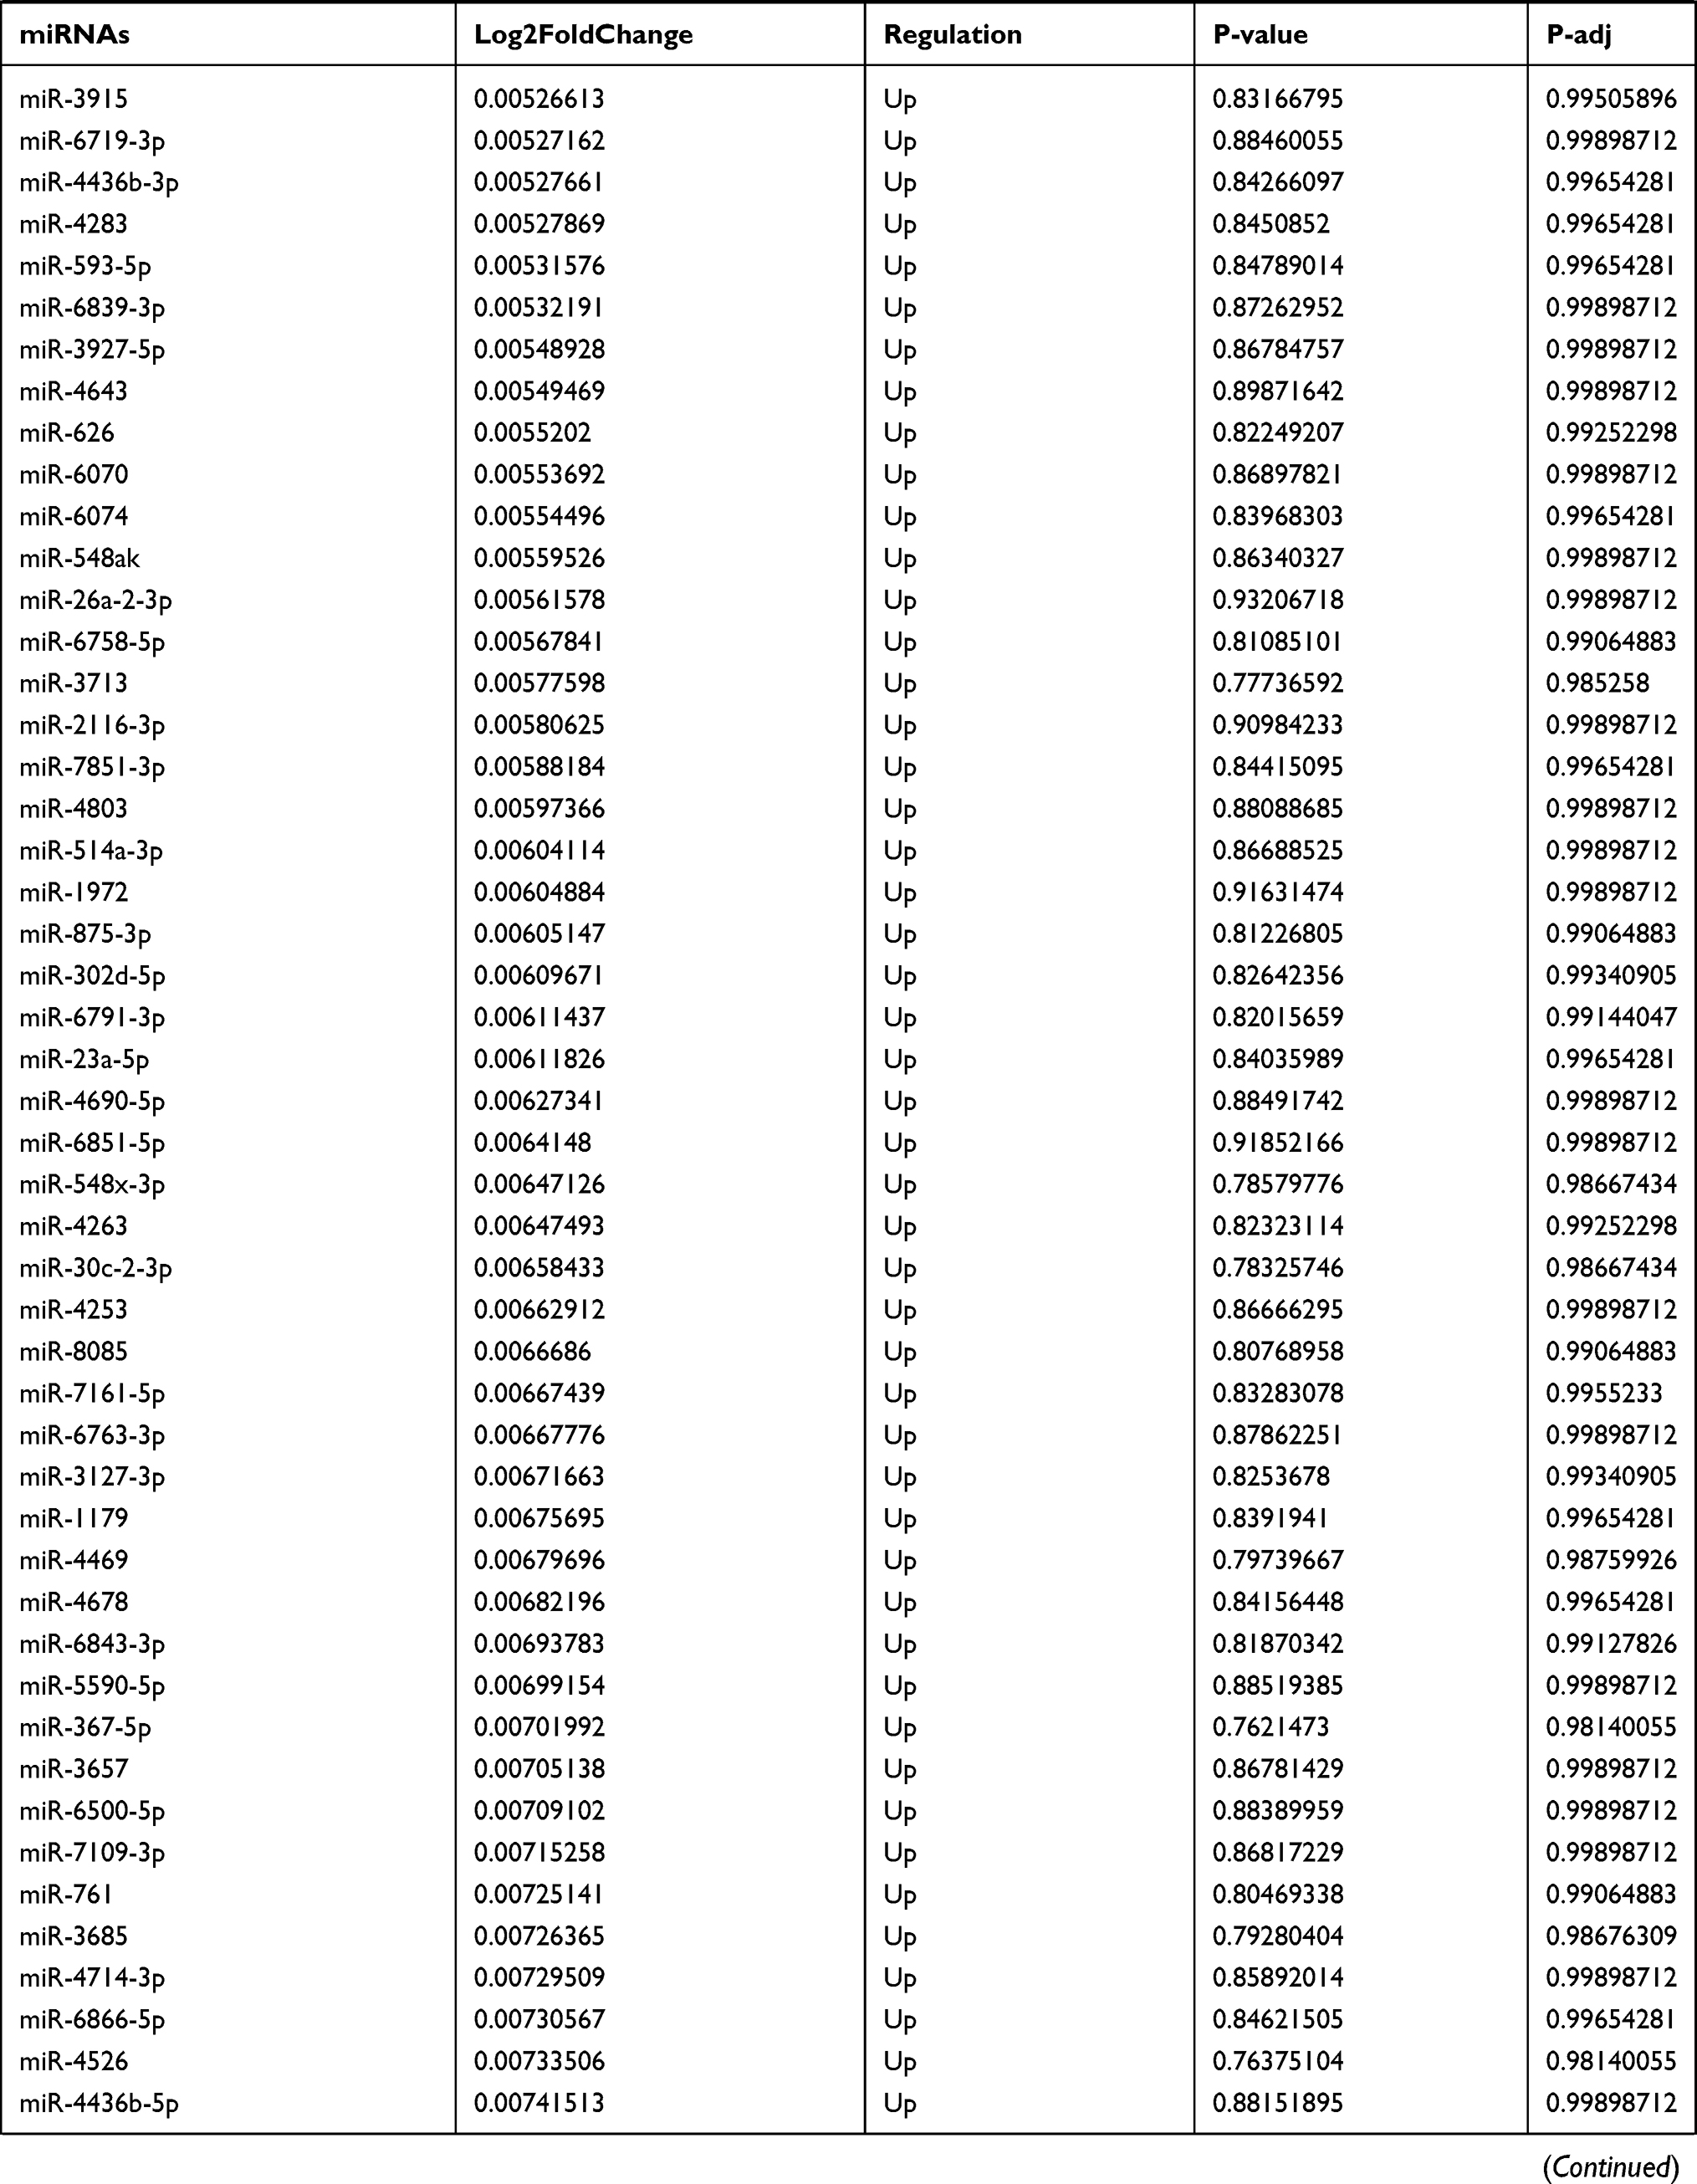 | 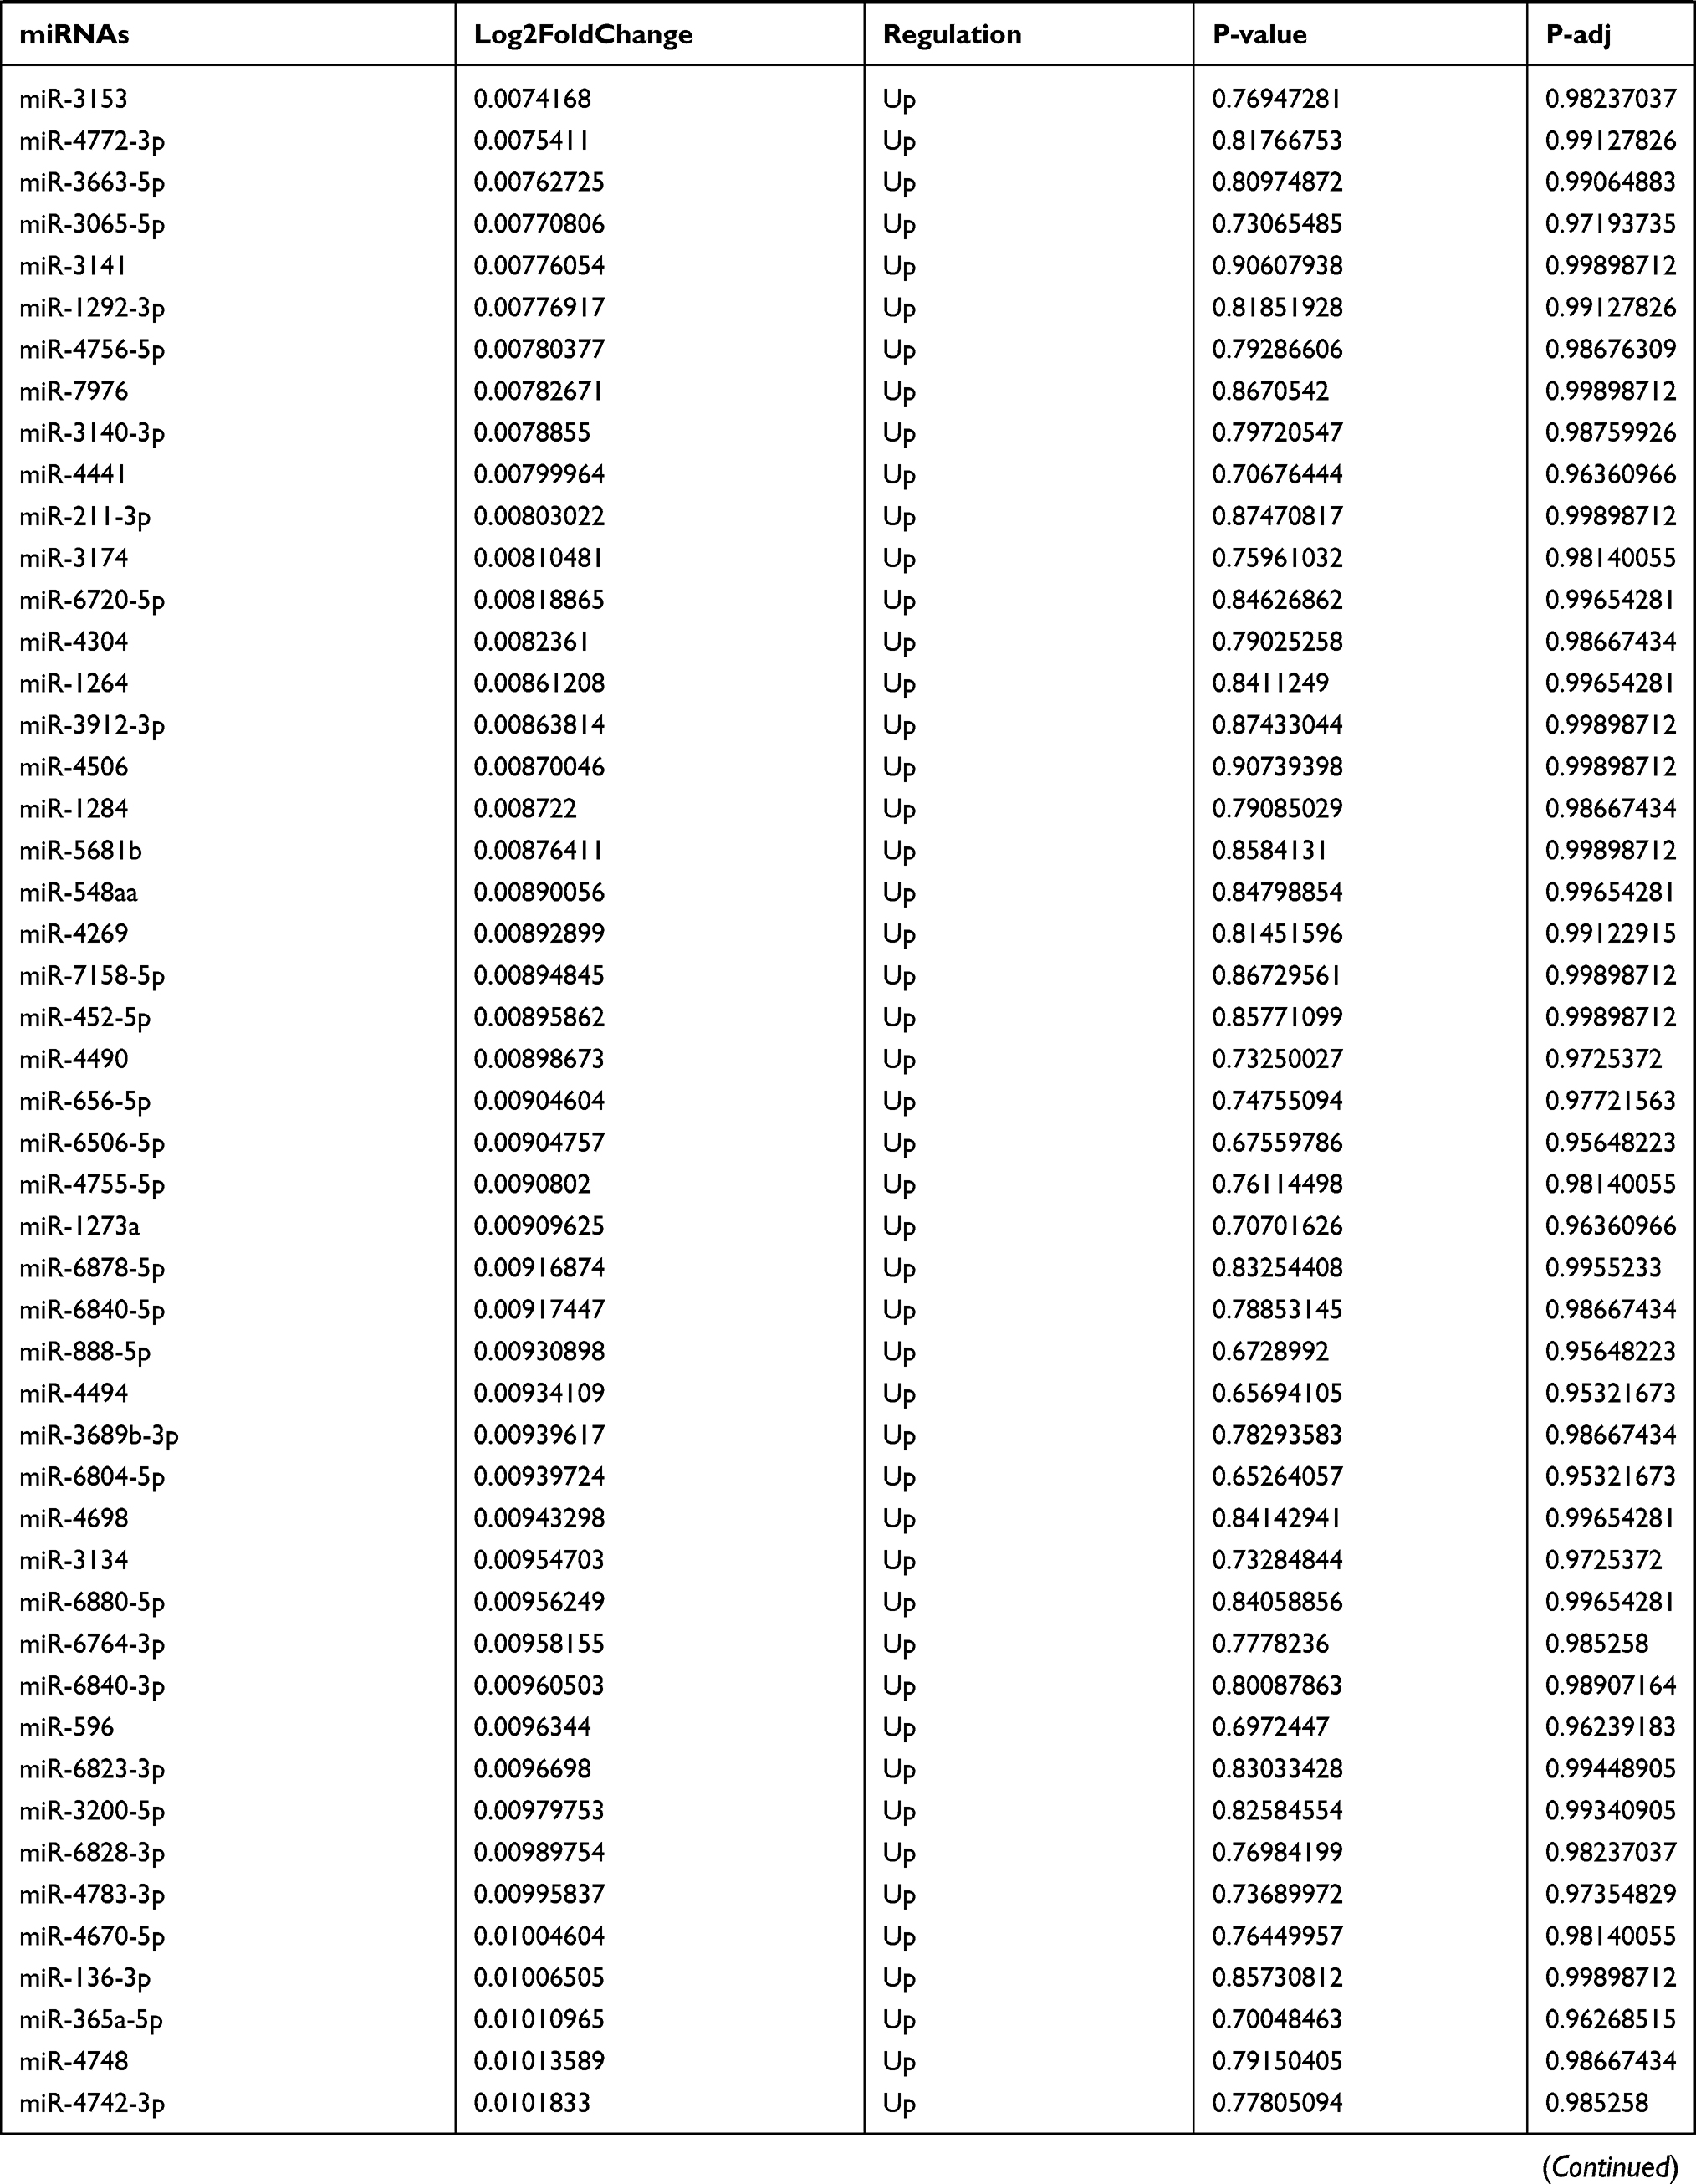 | 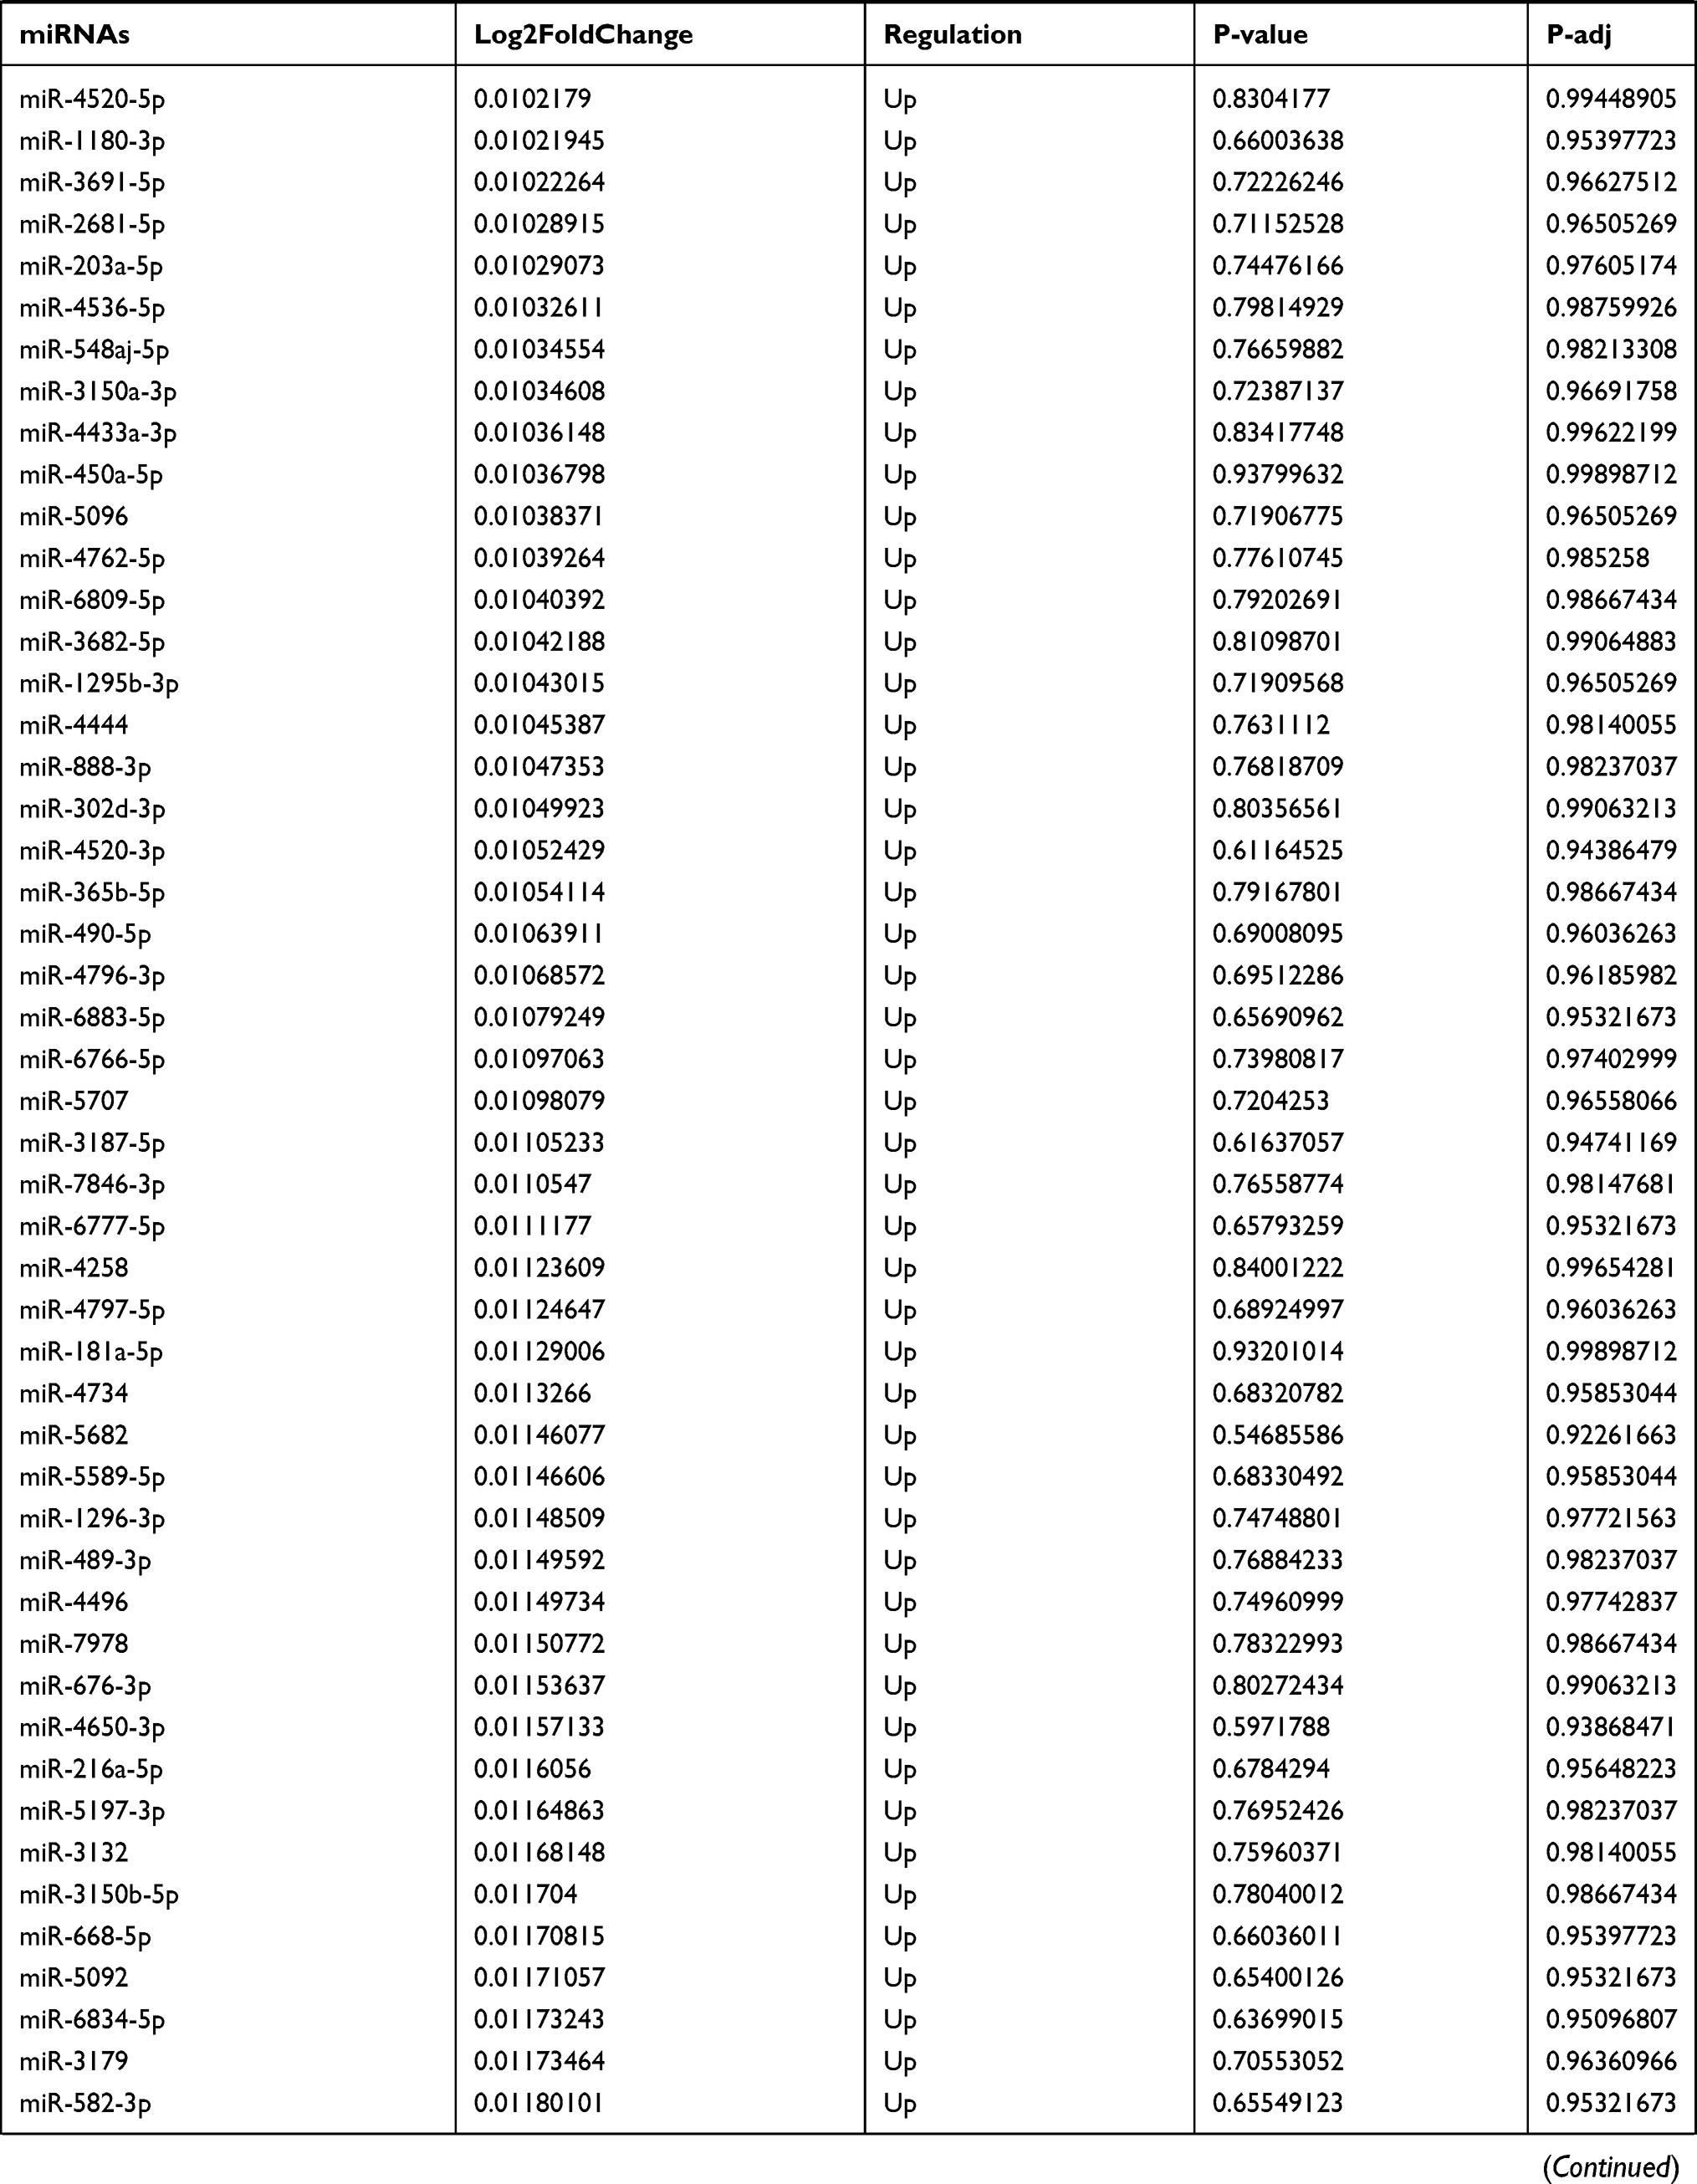 | 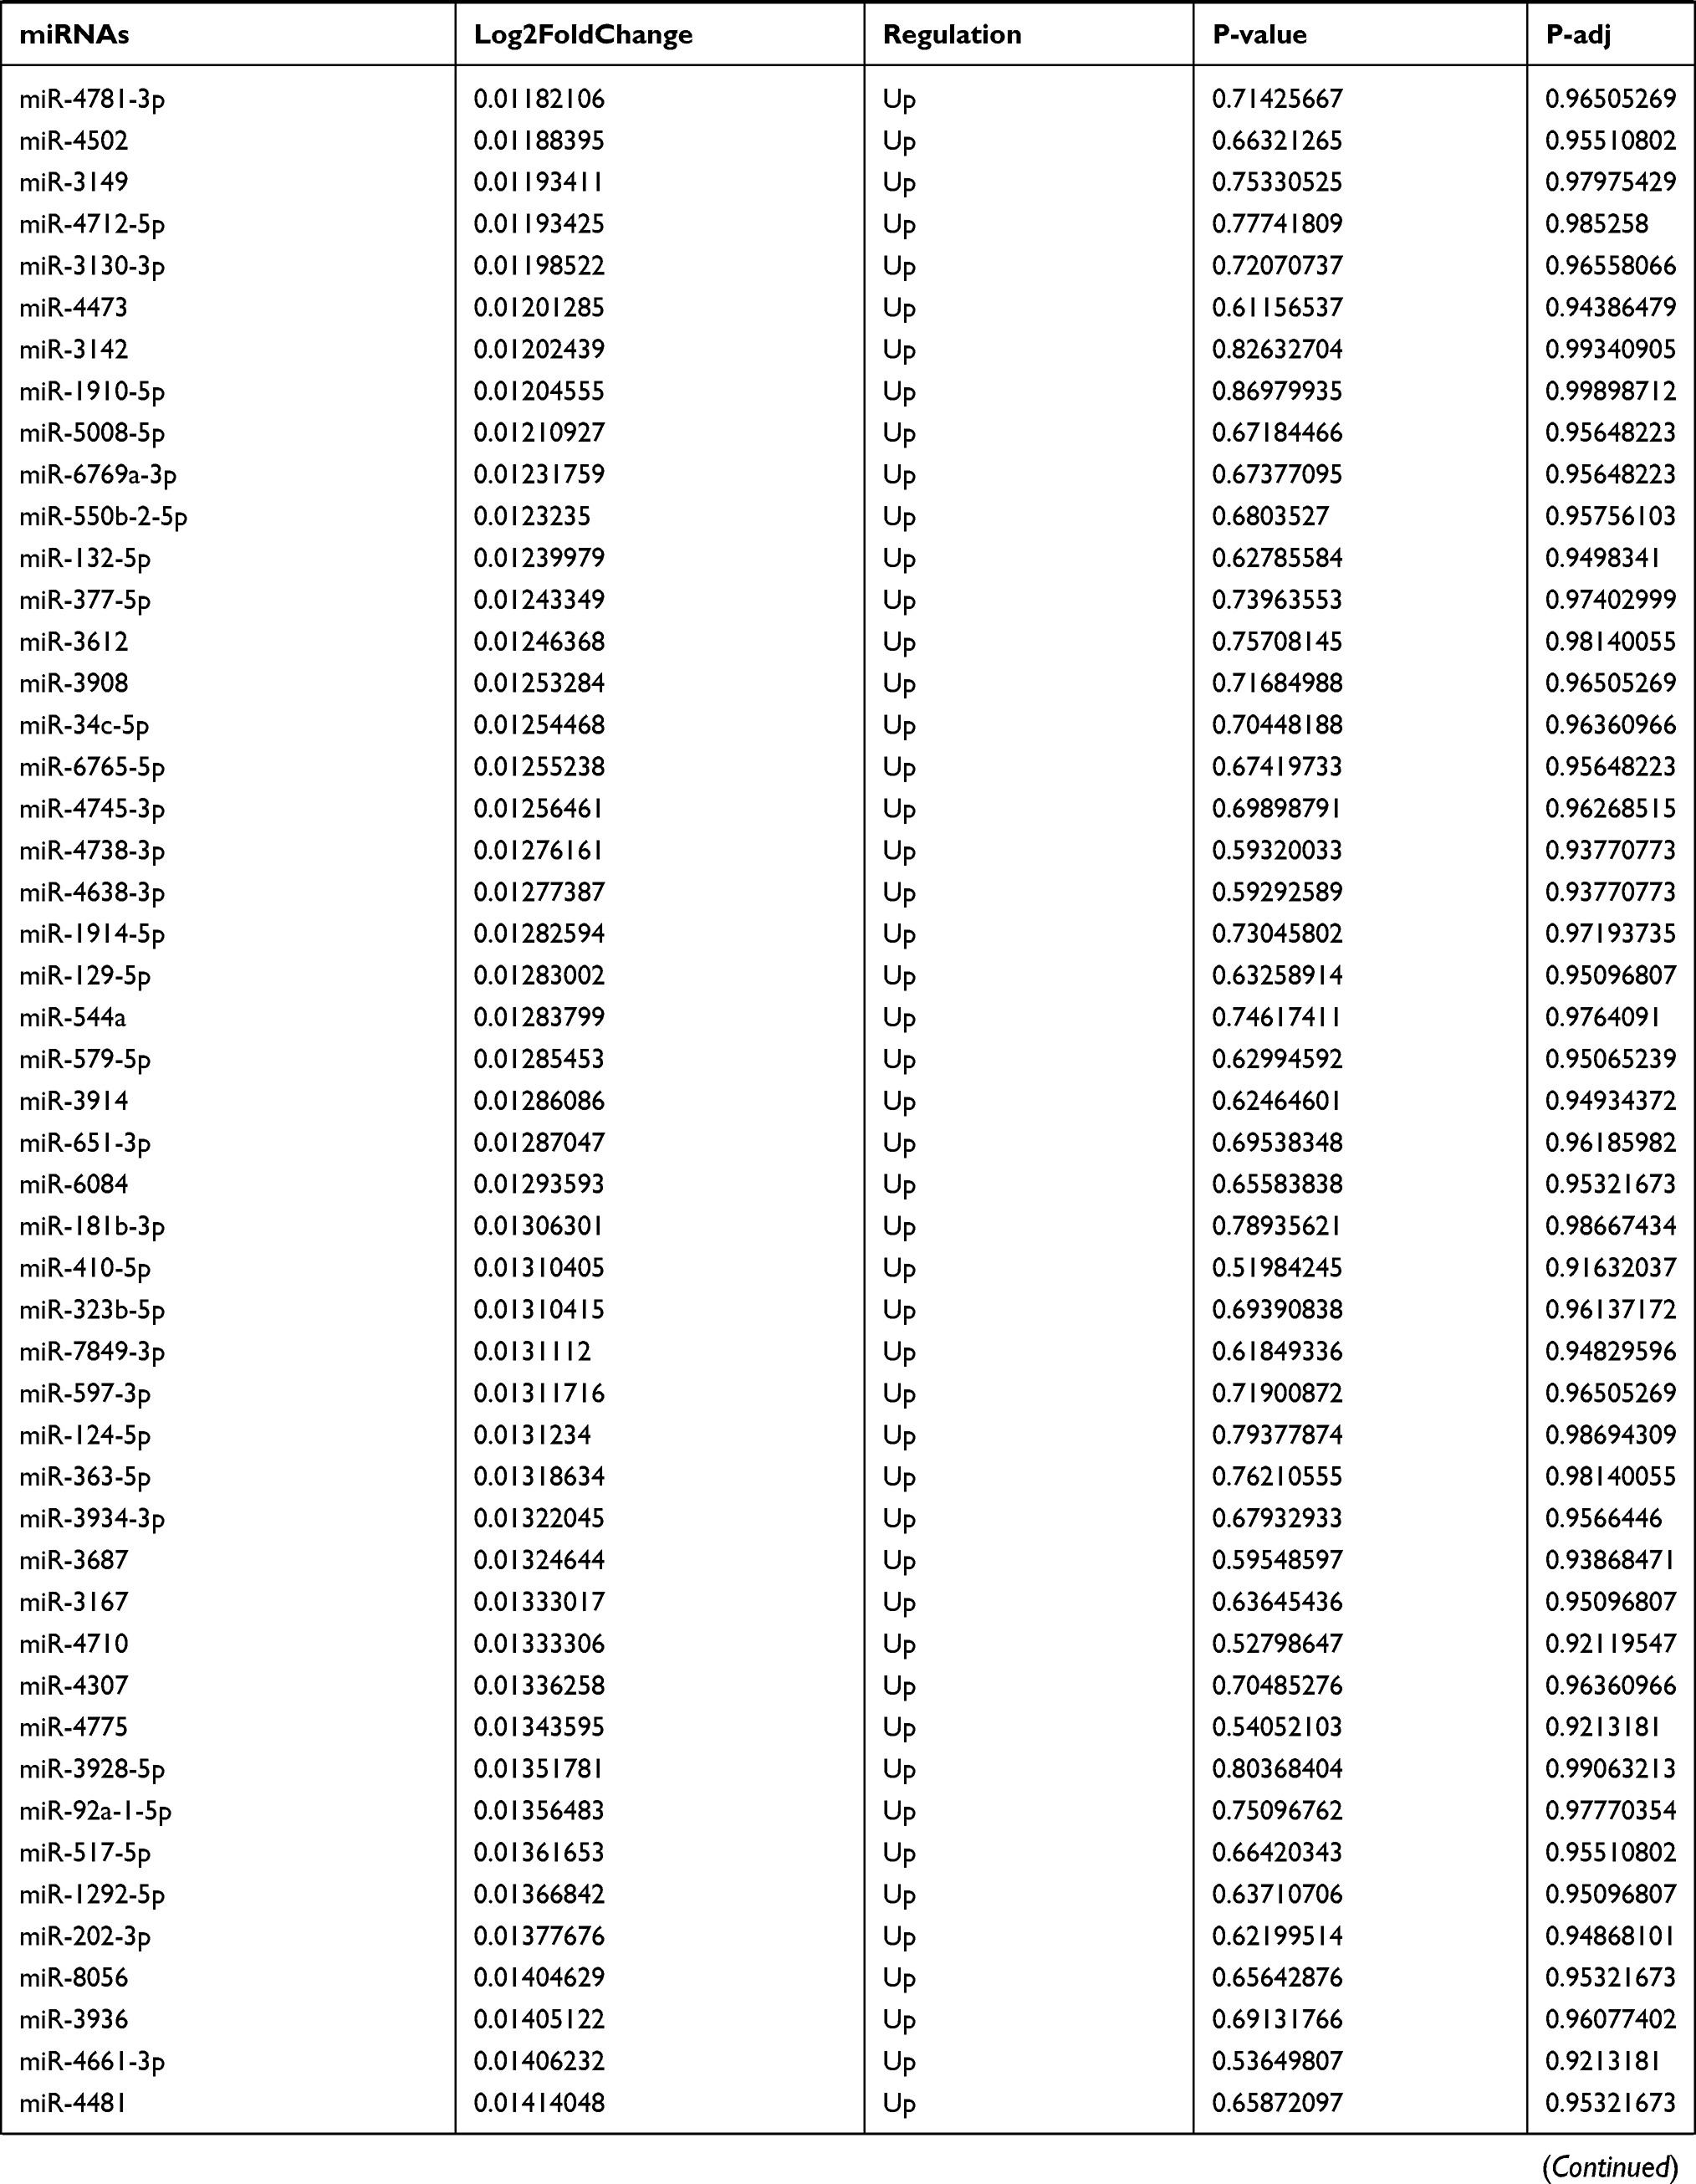 | 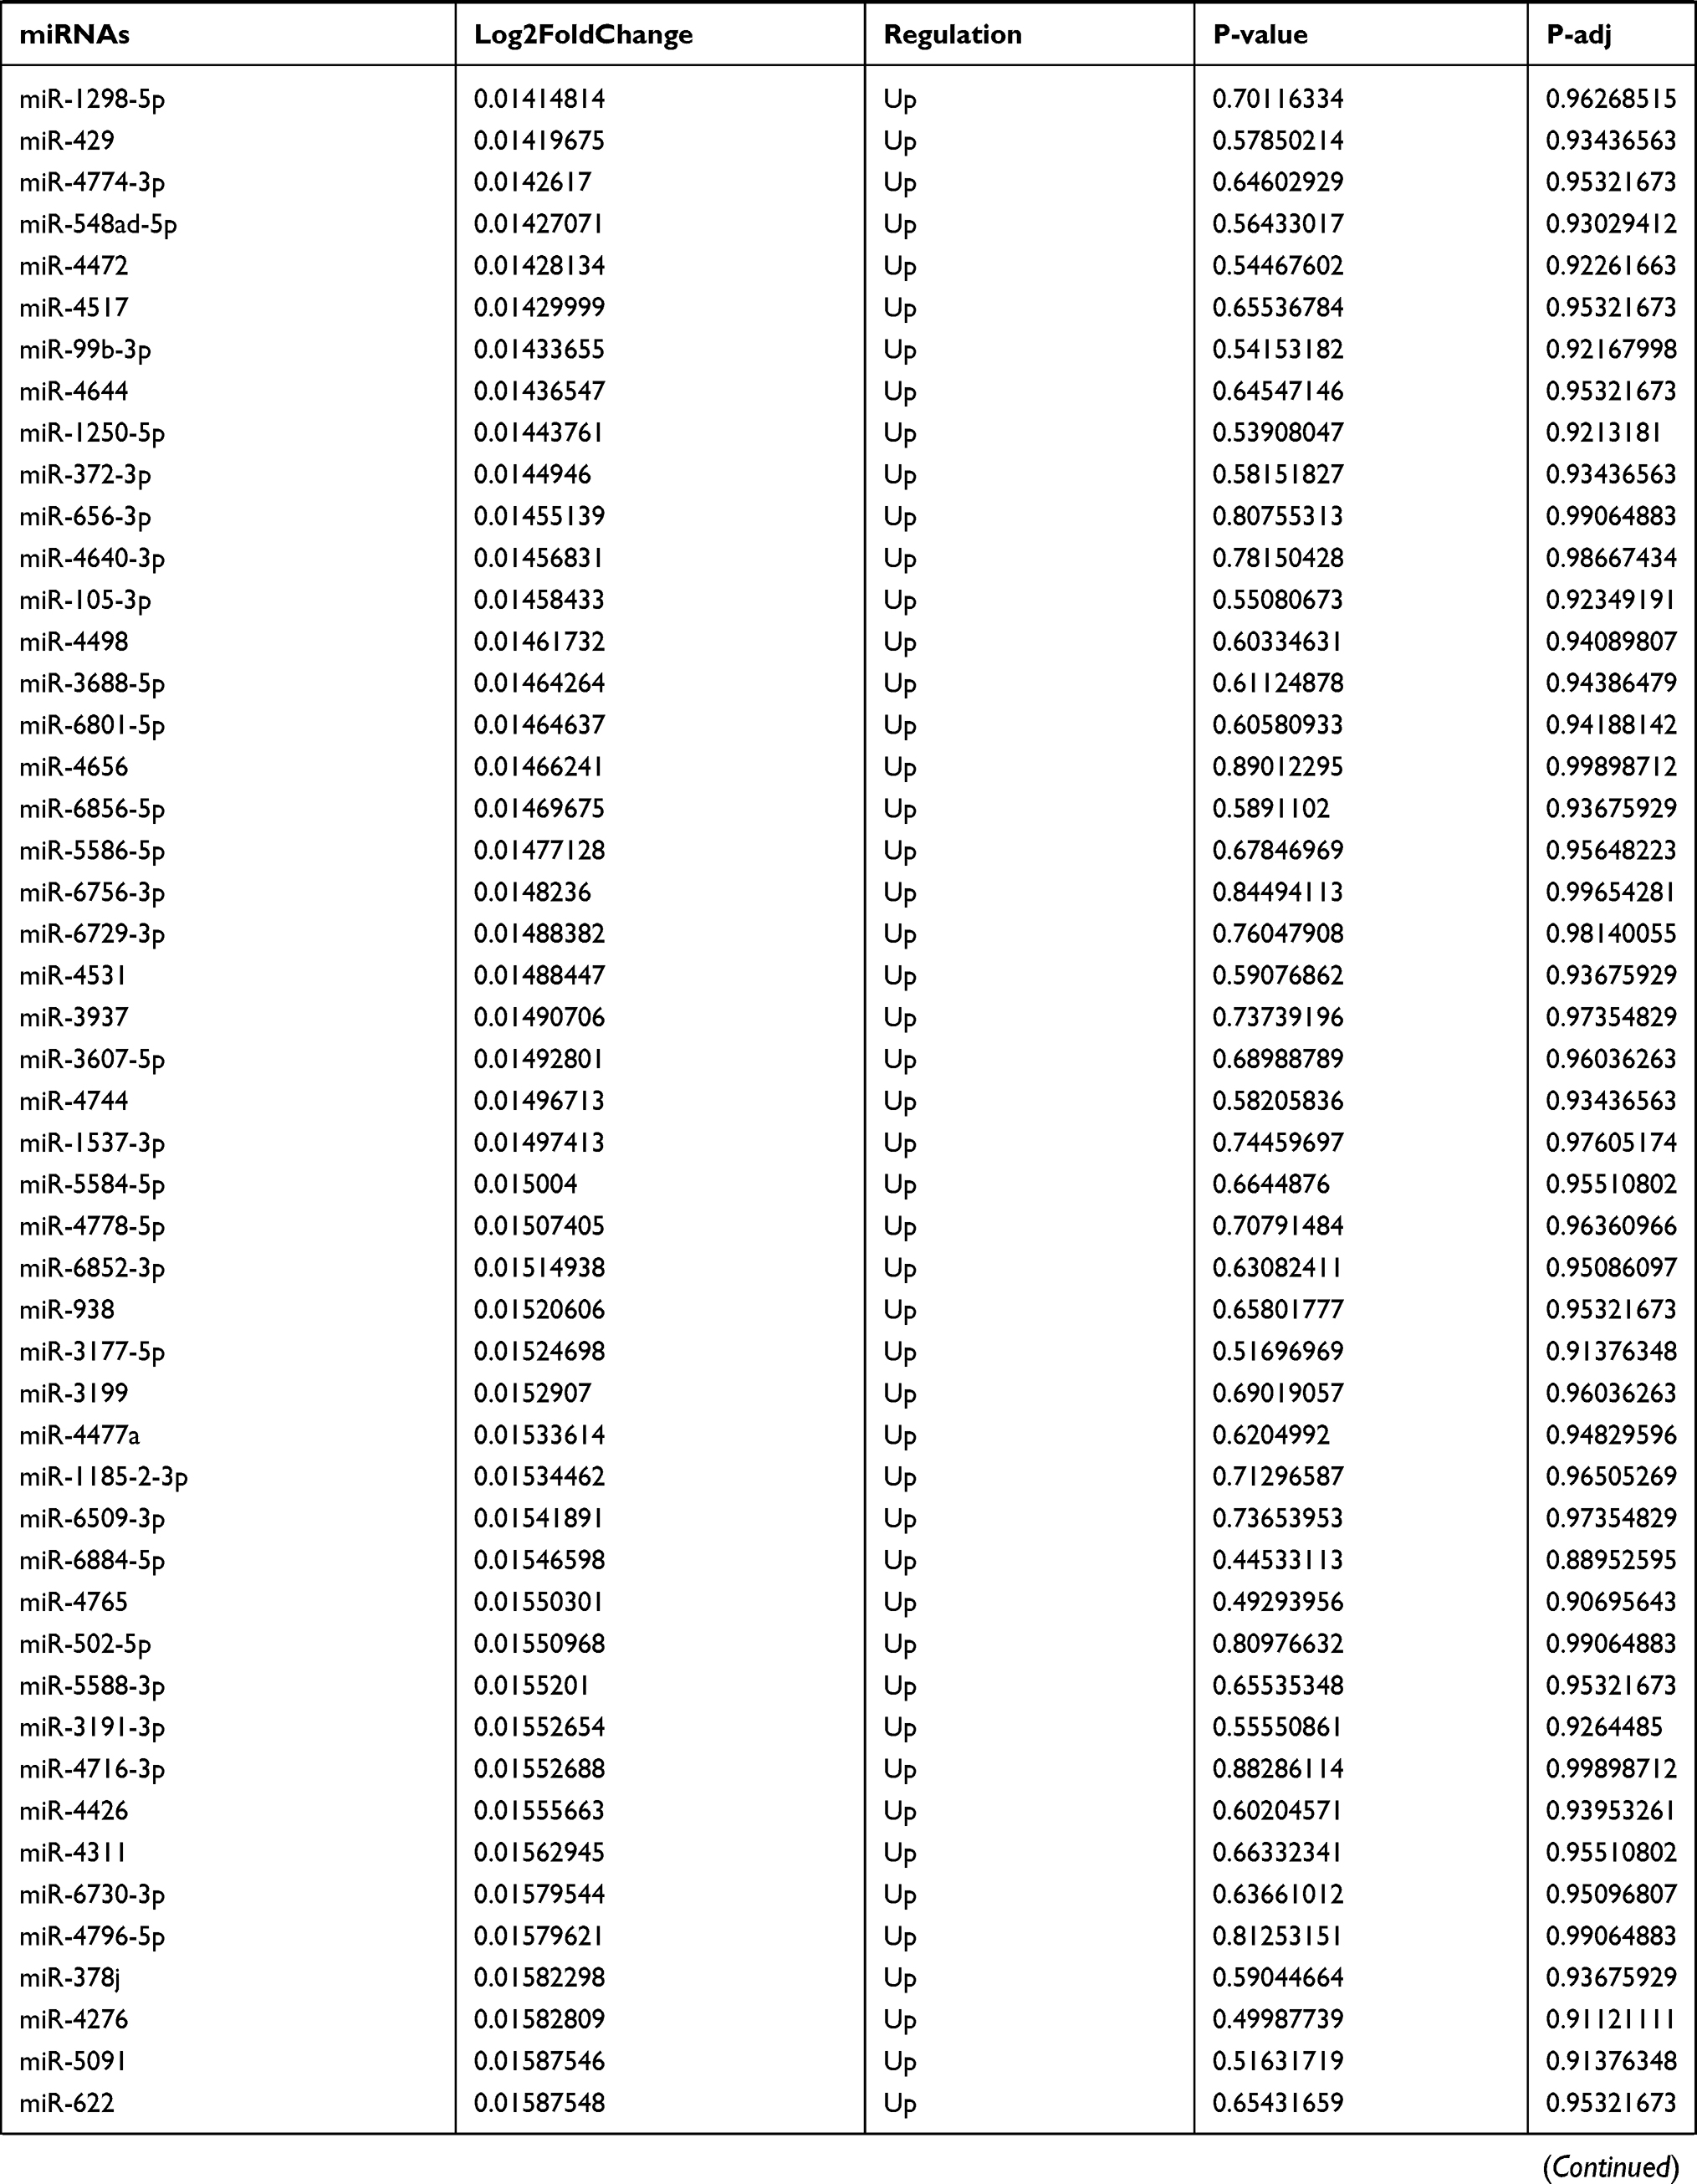 | 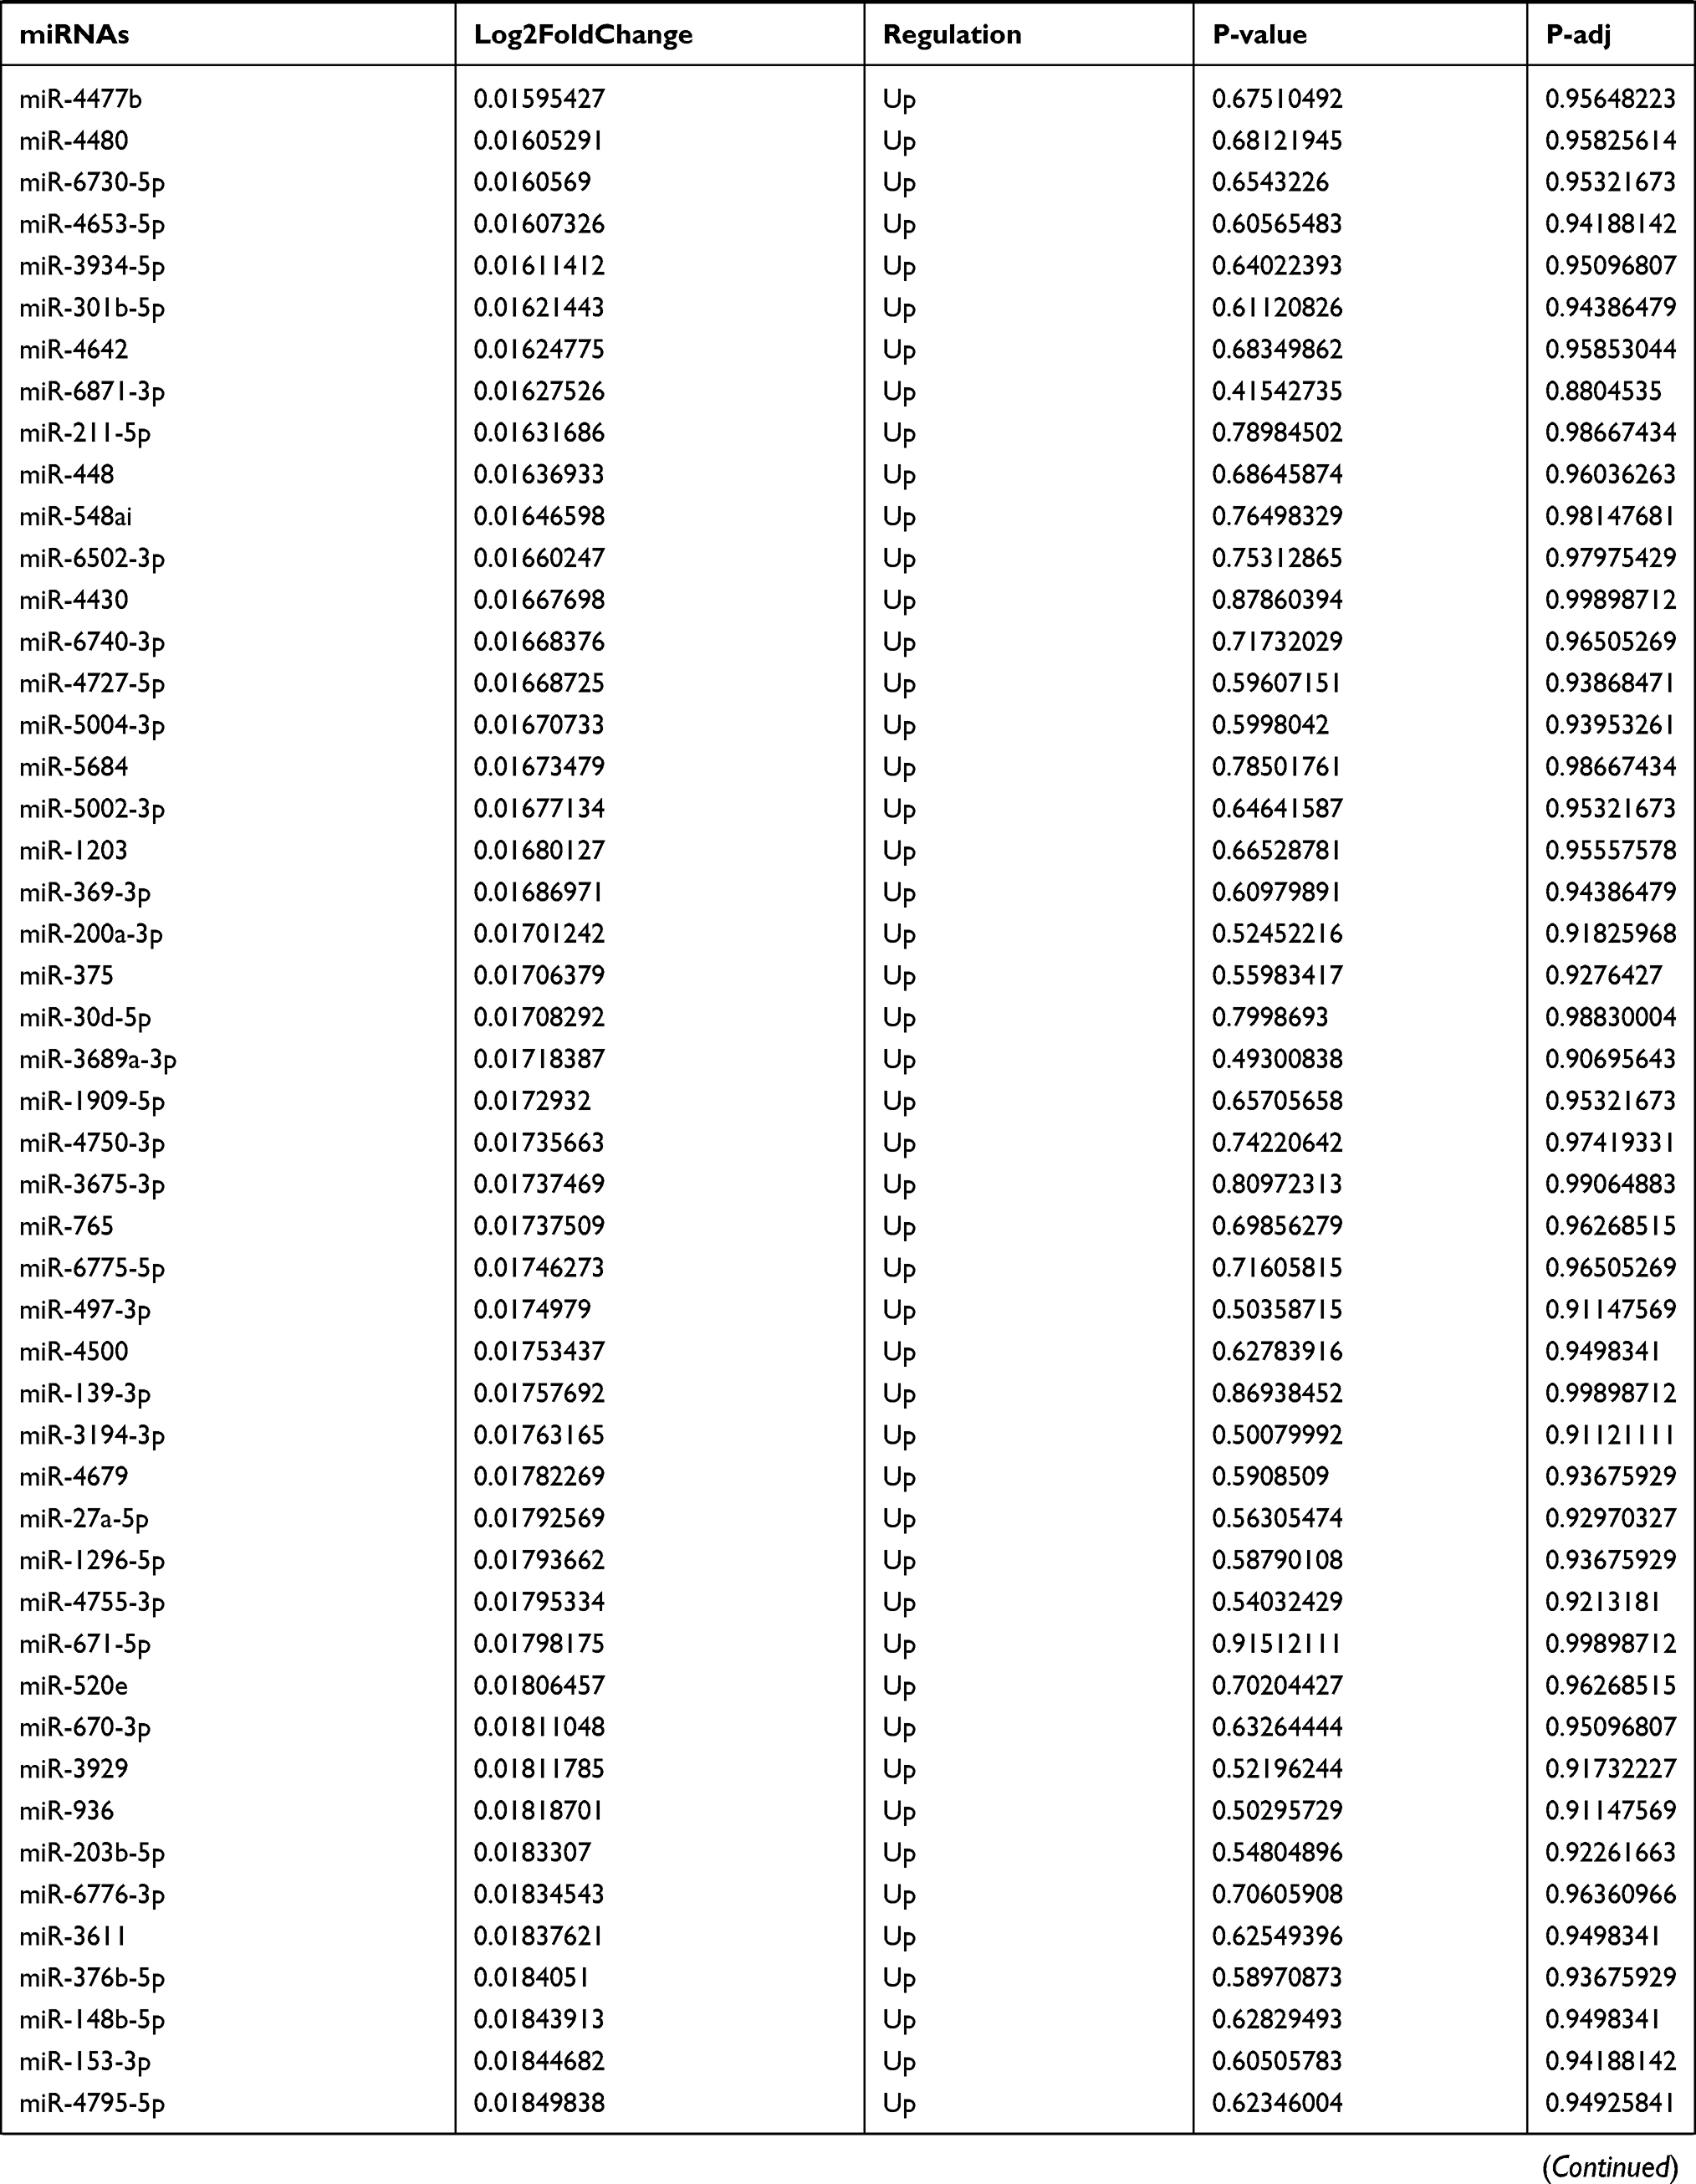 | 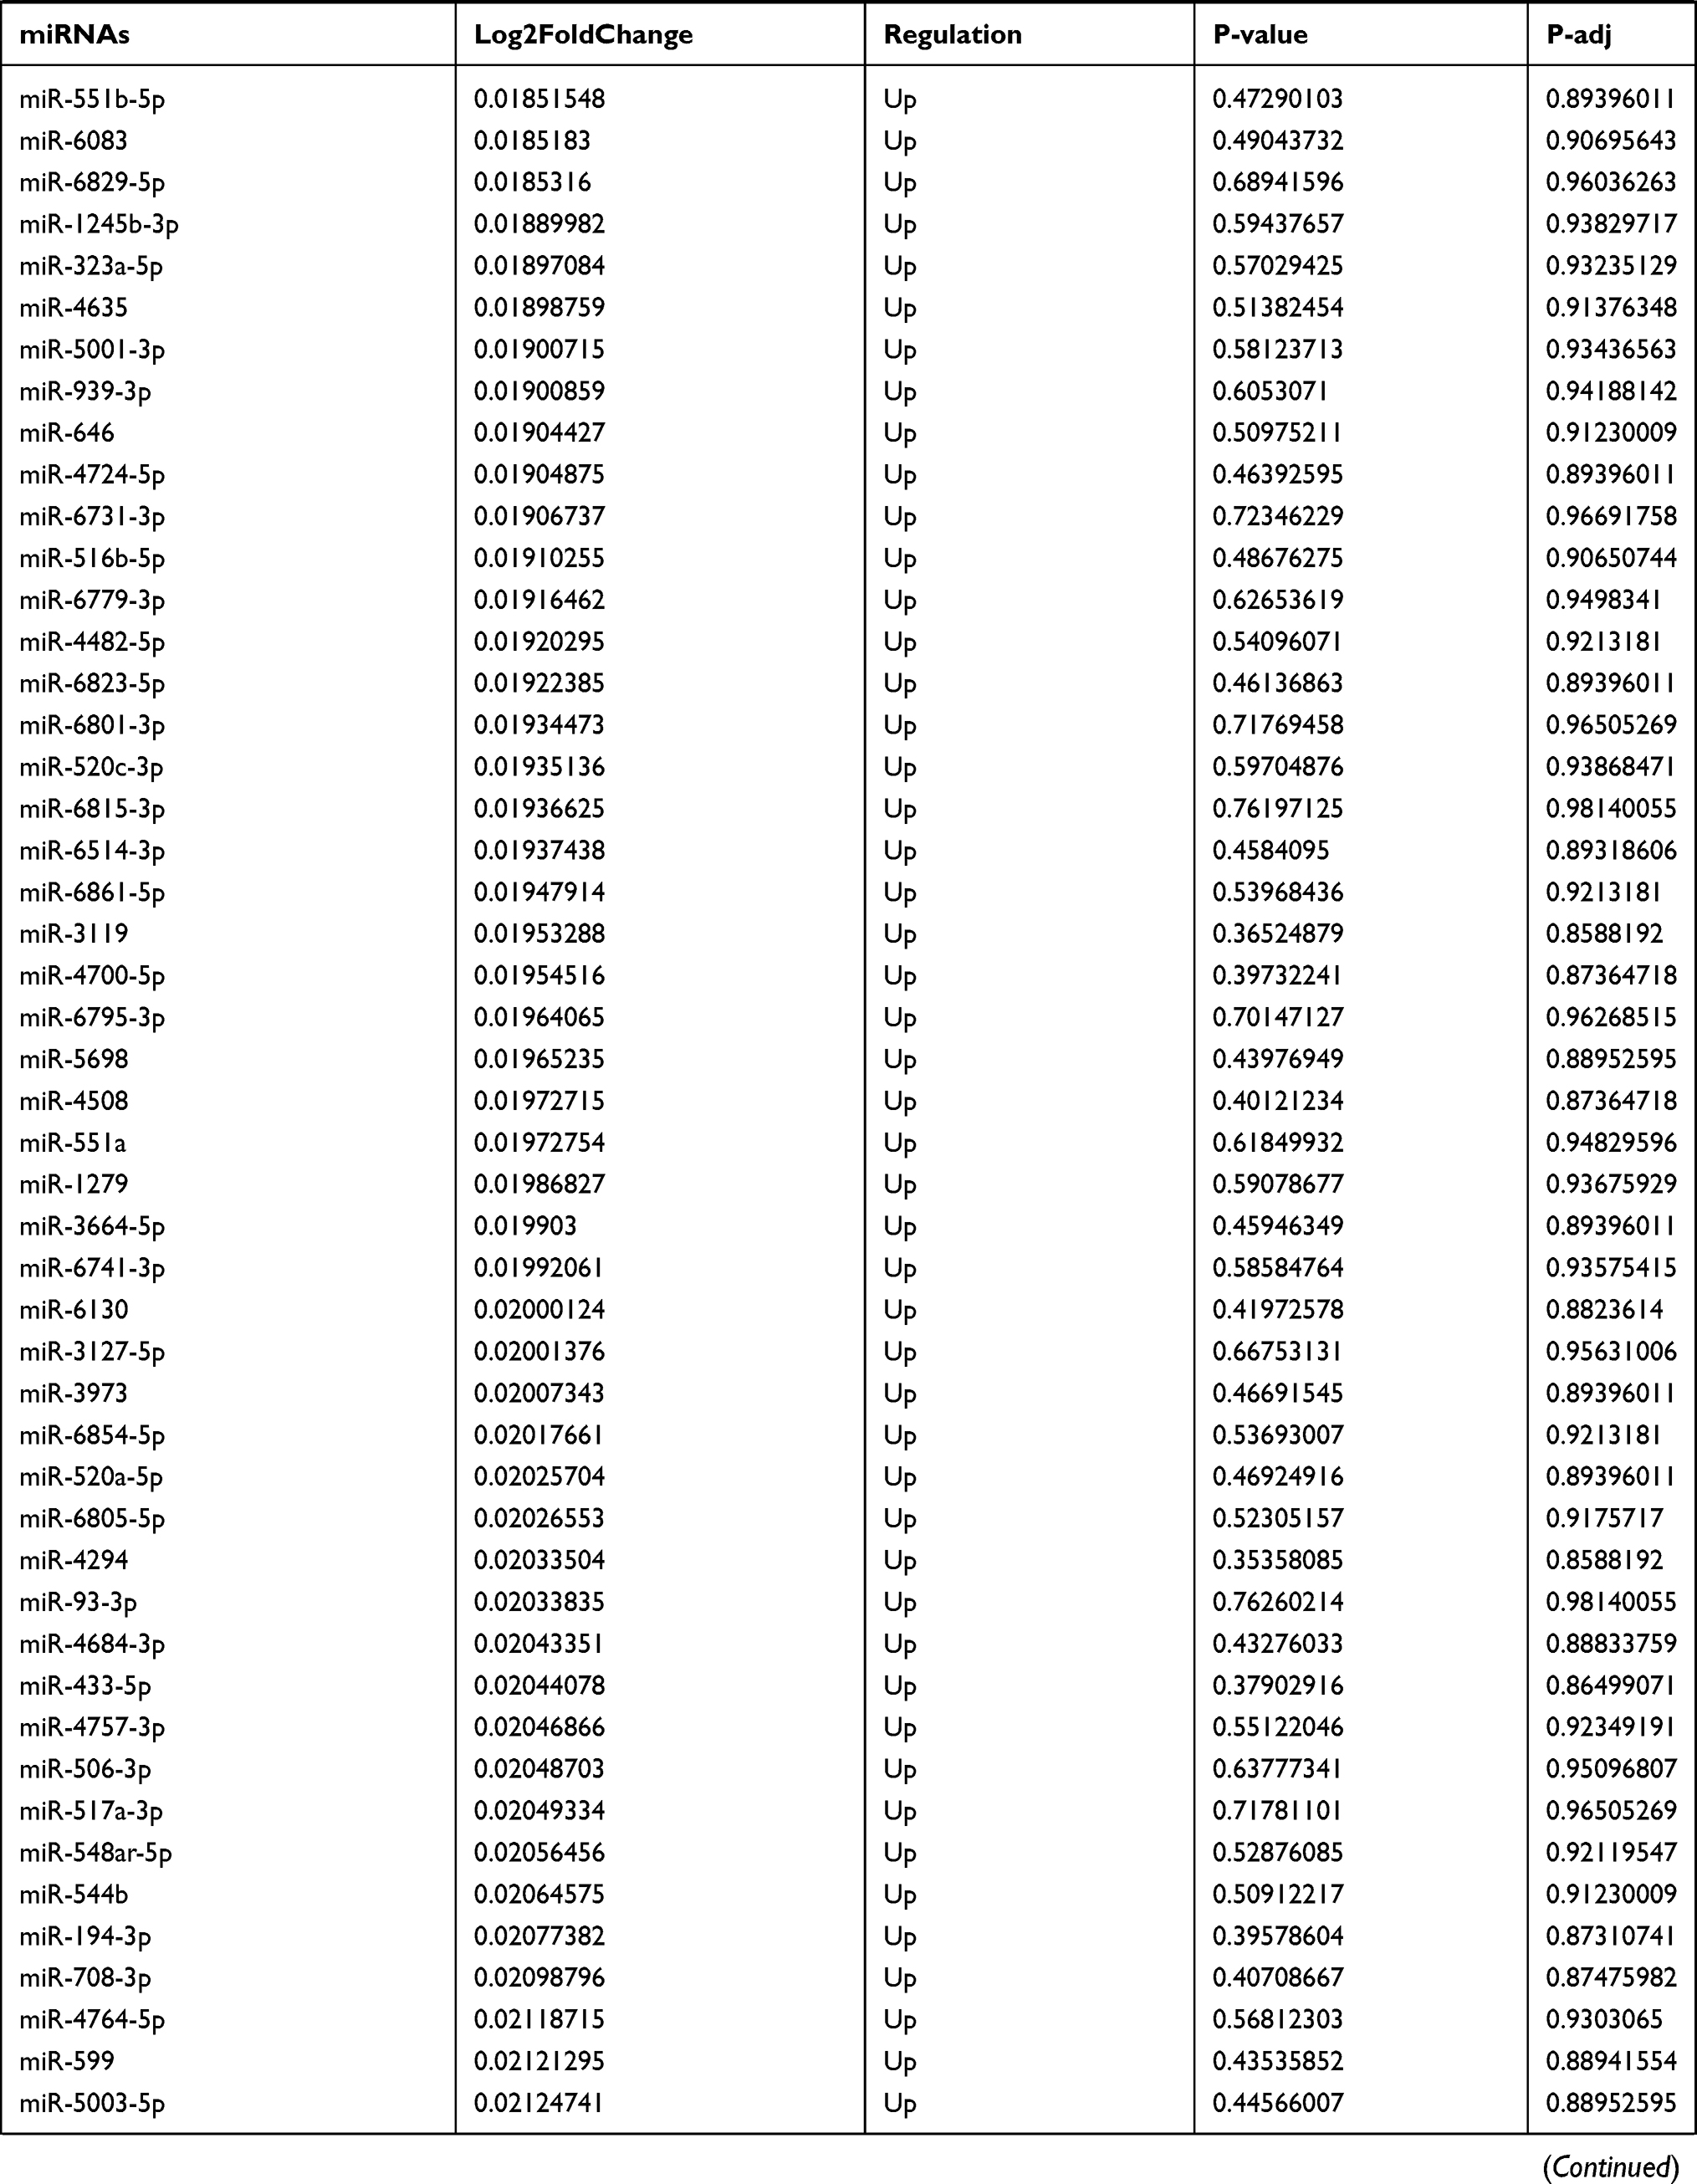 | 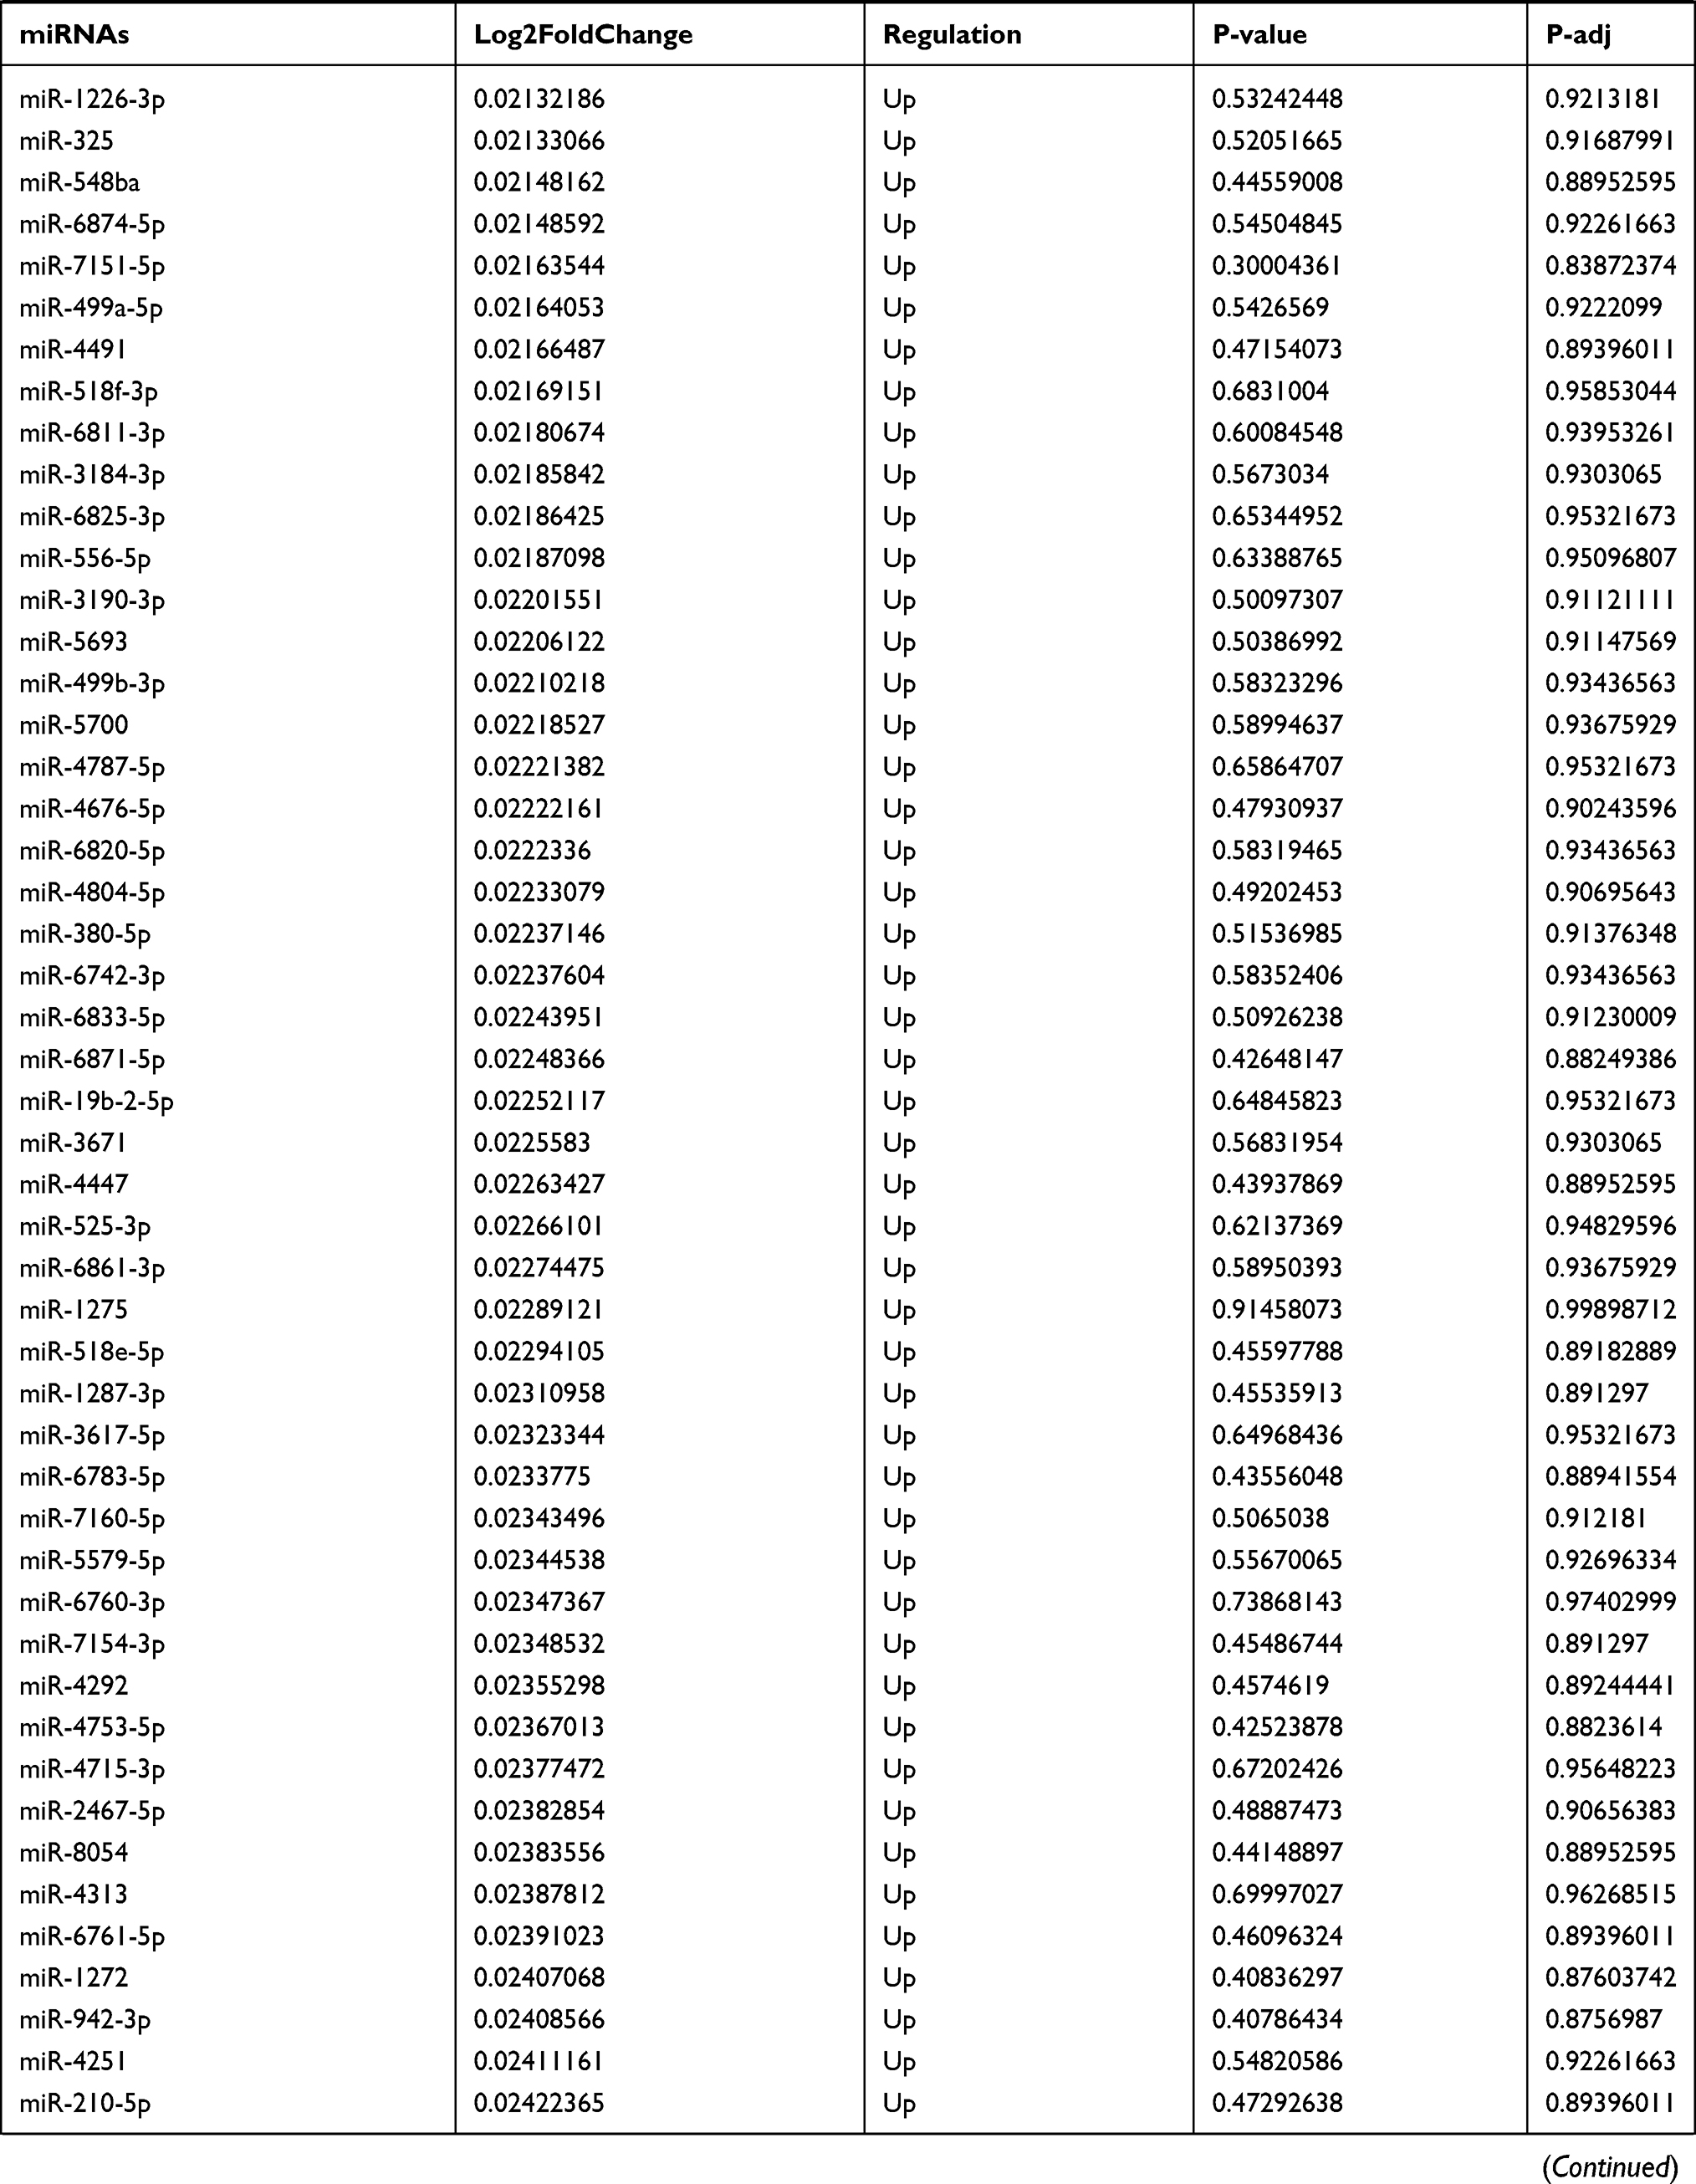 | 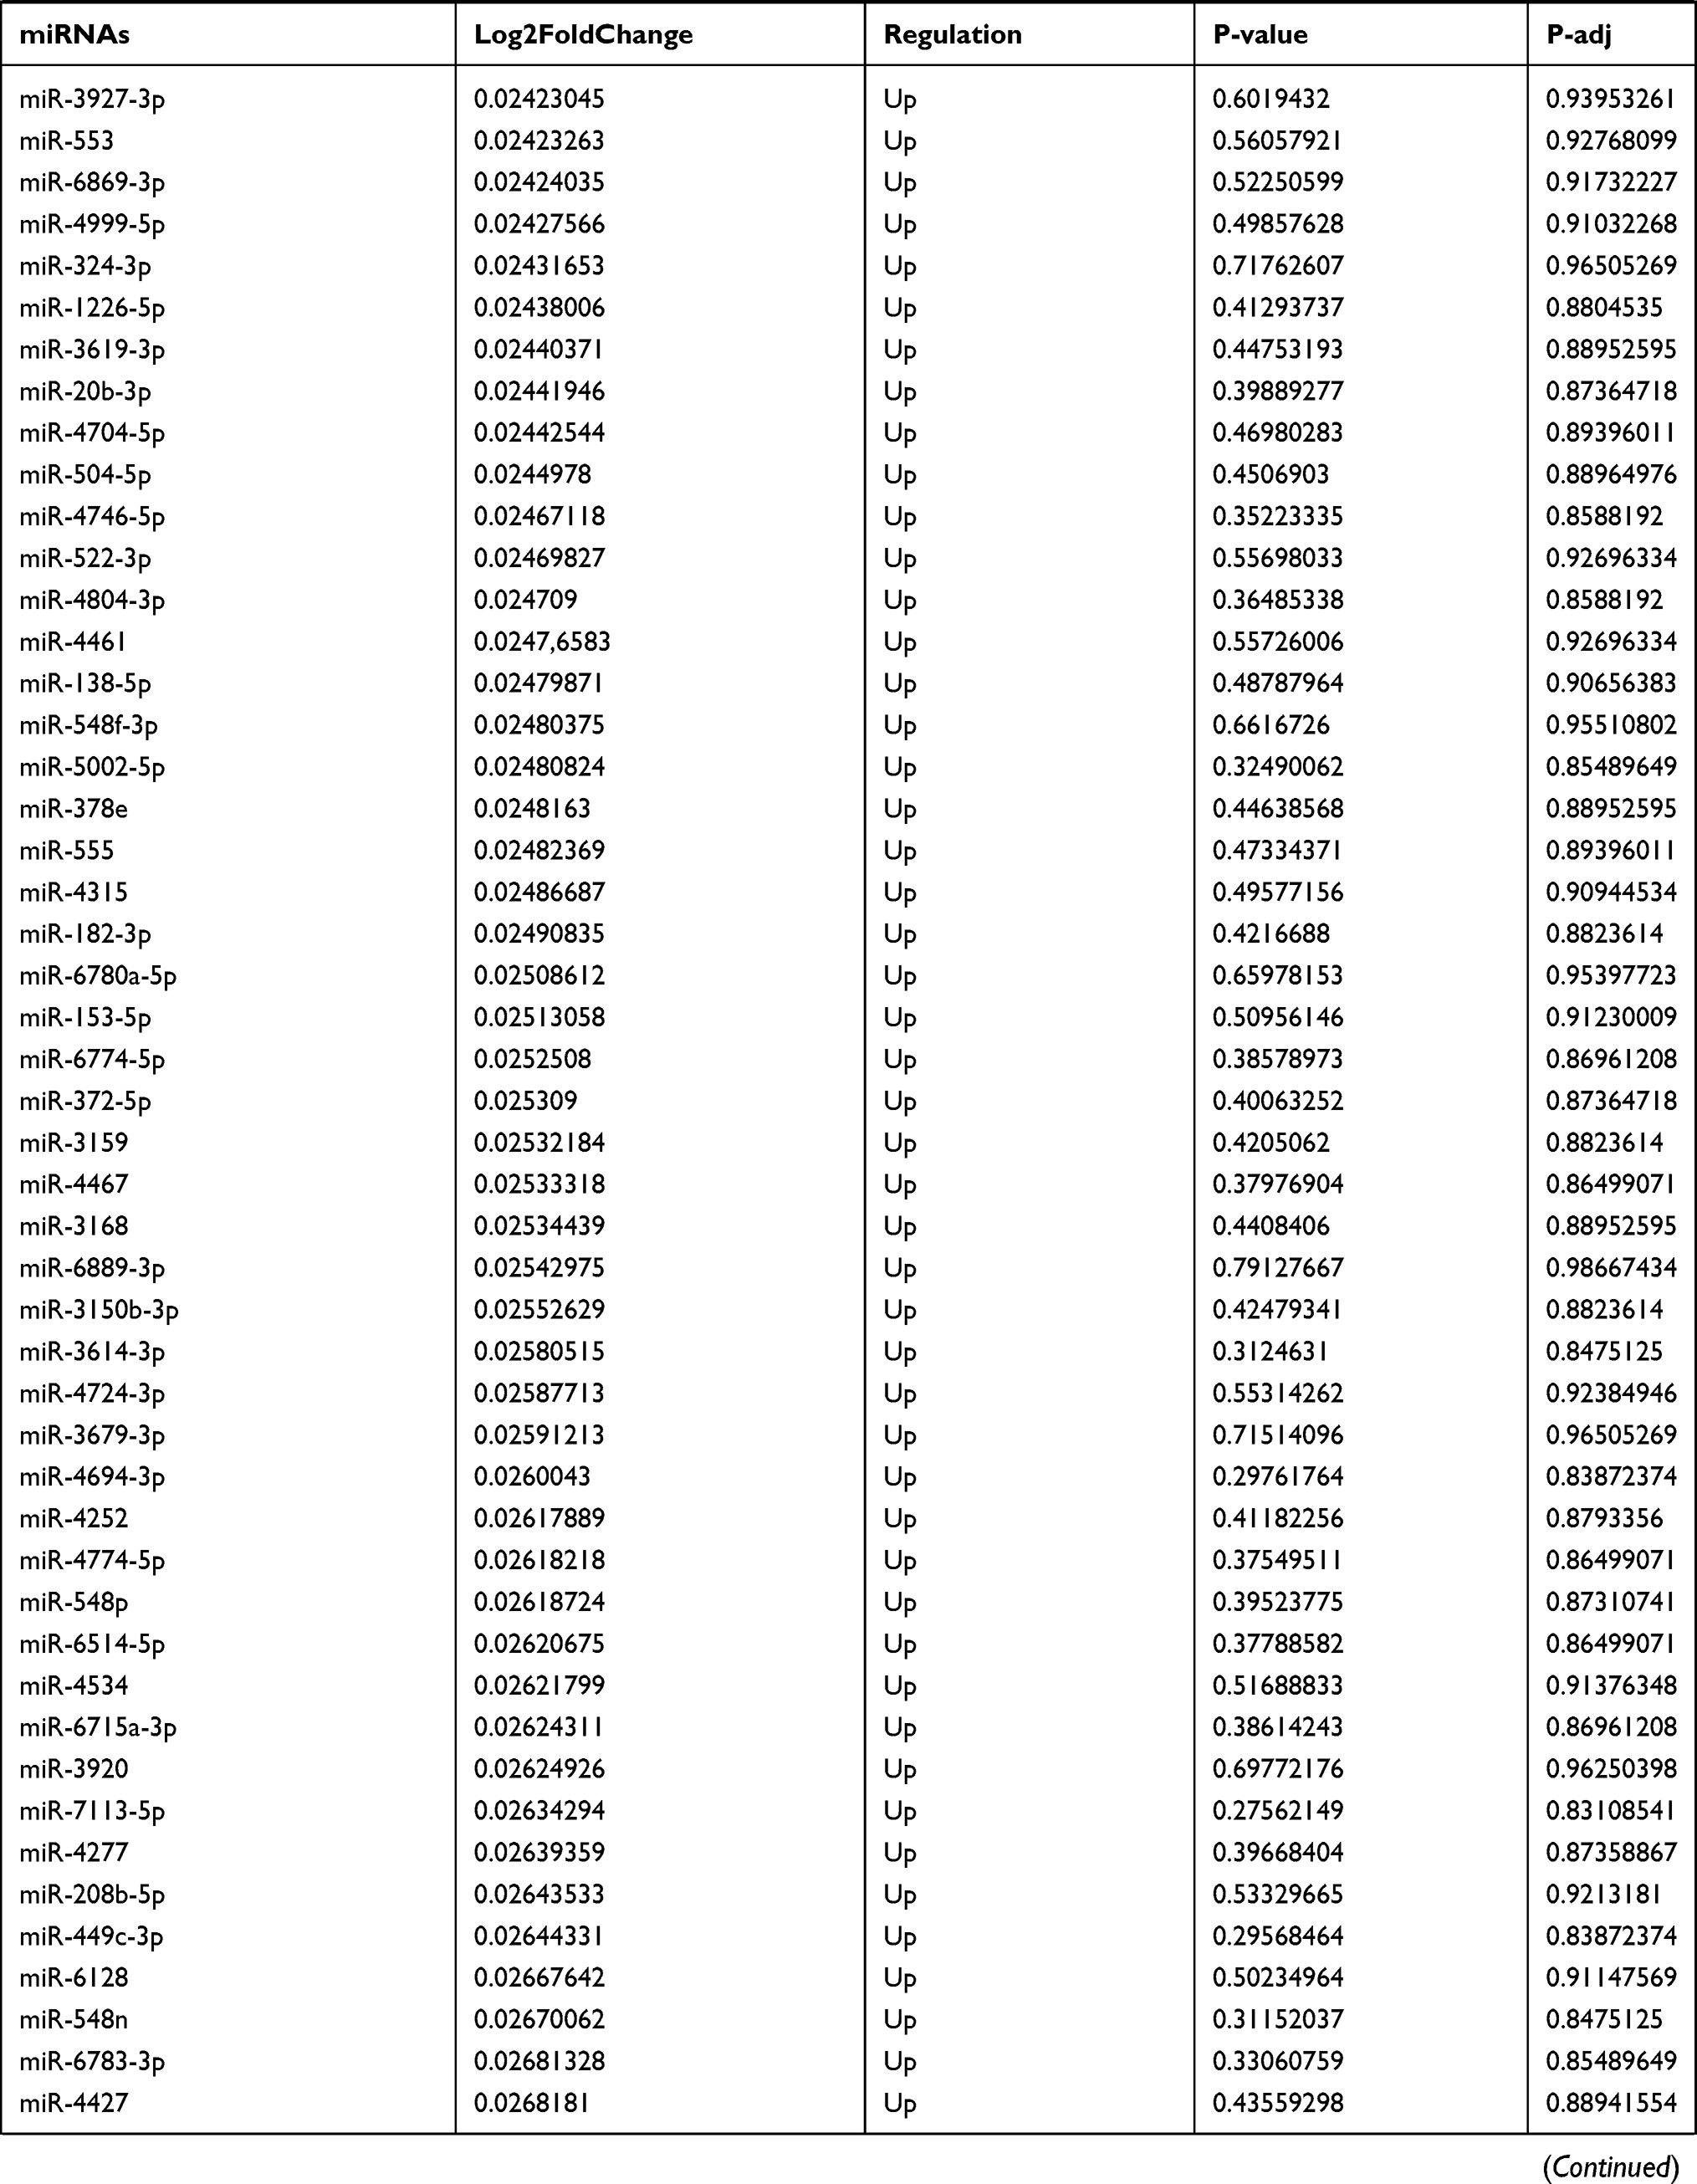 | 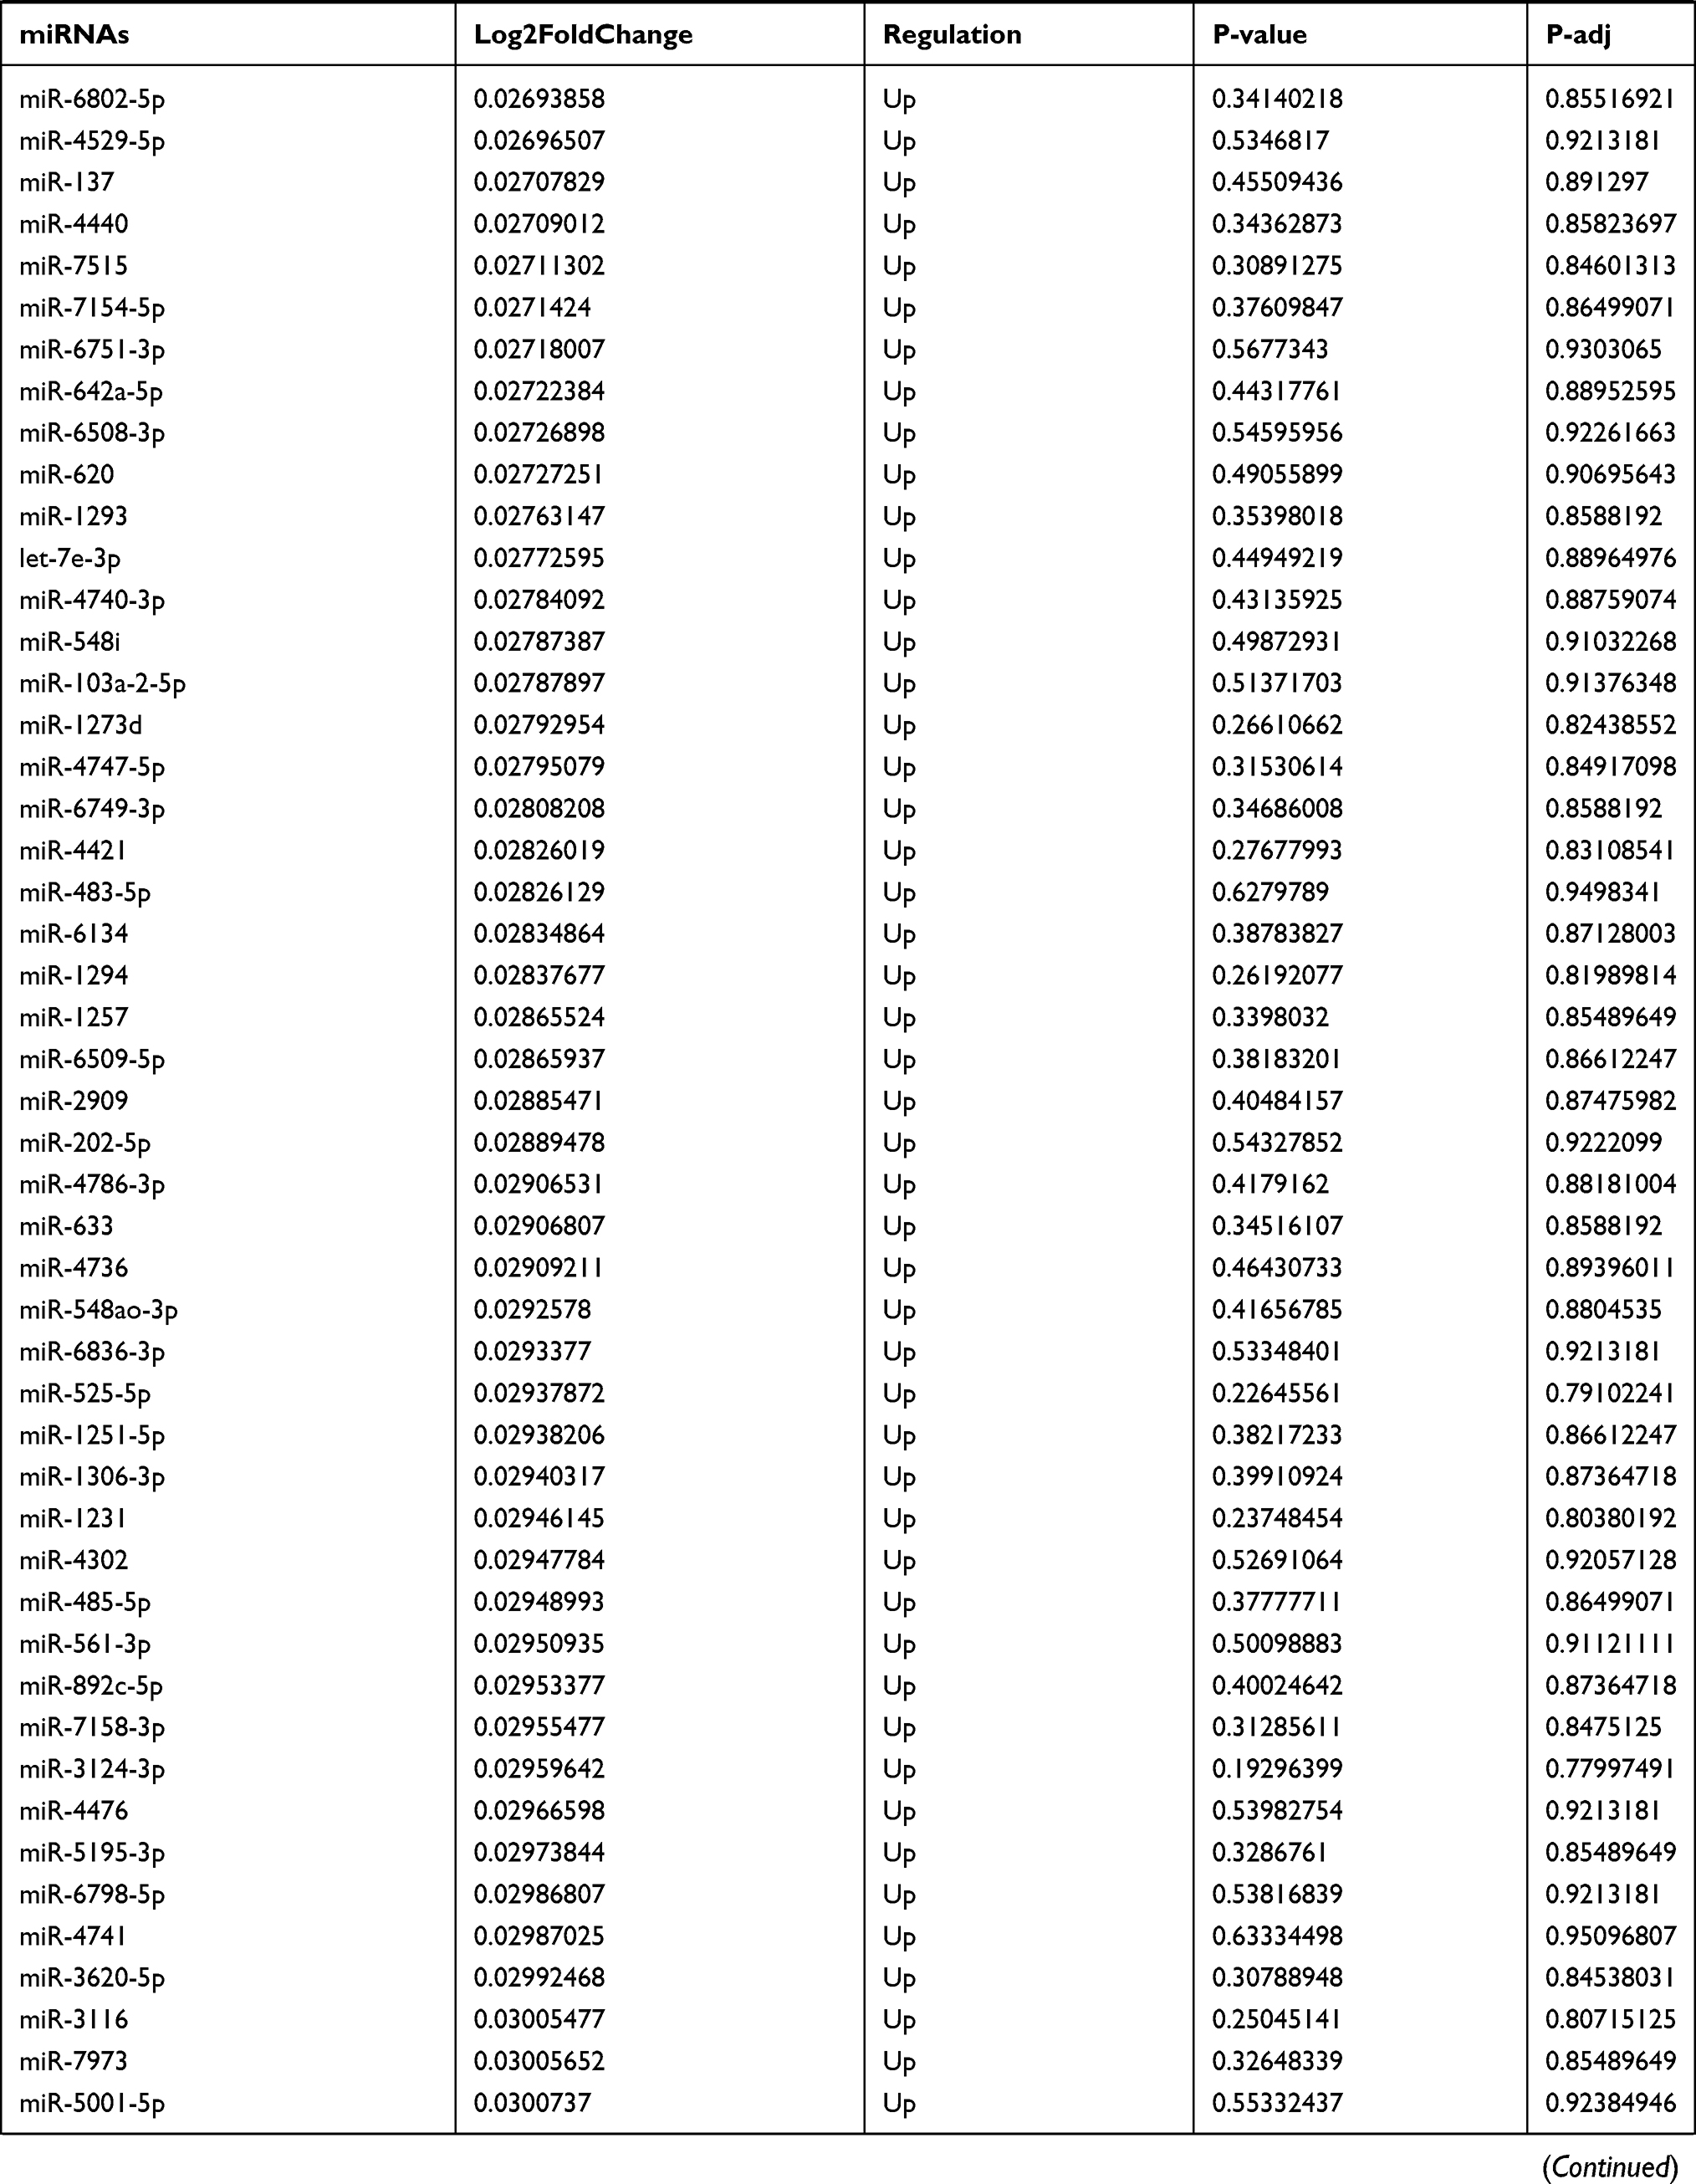 |  | 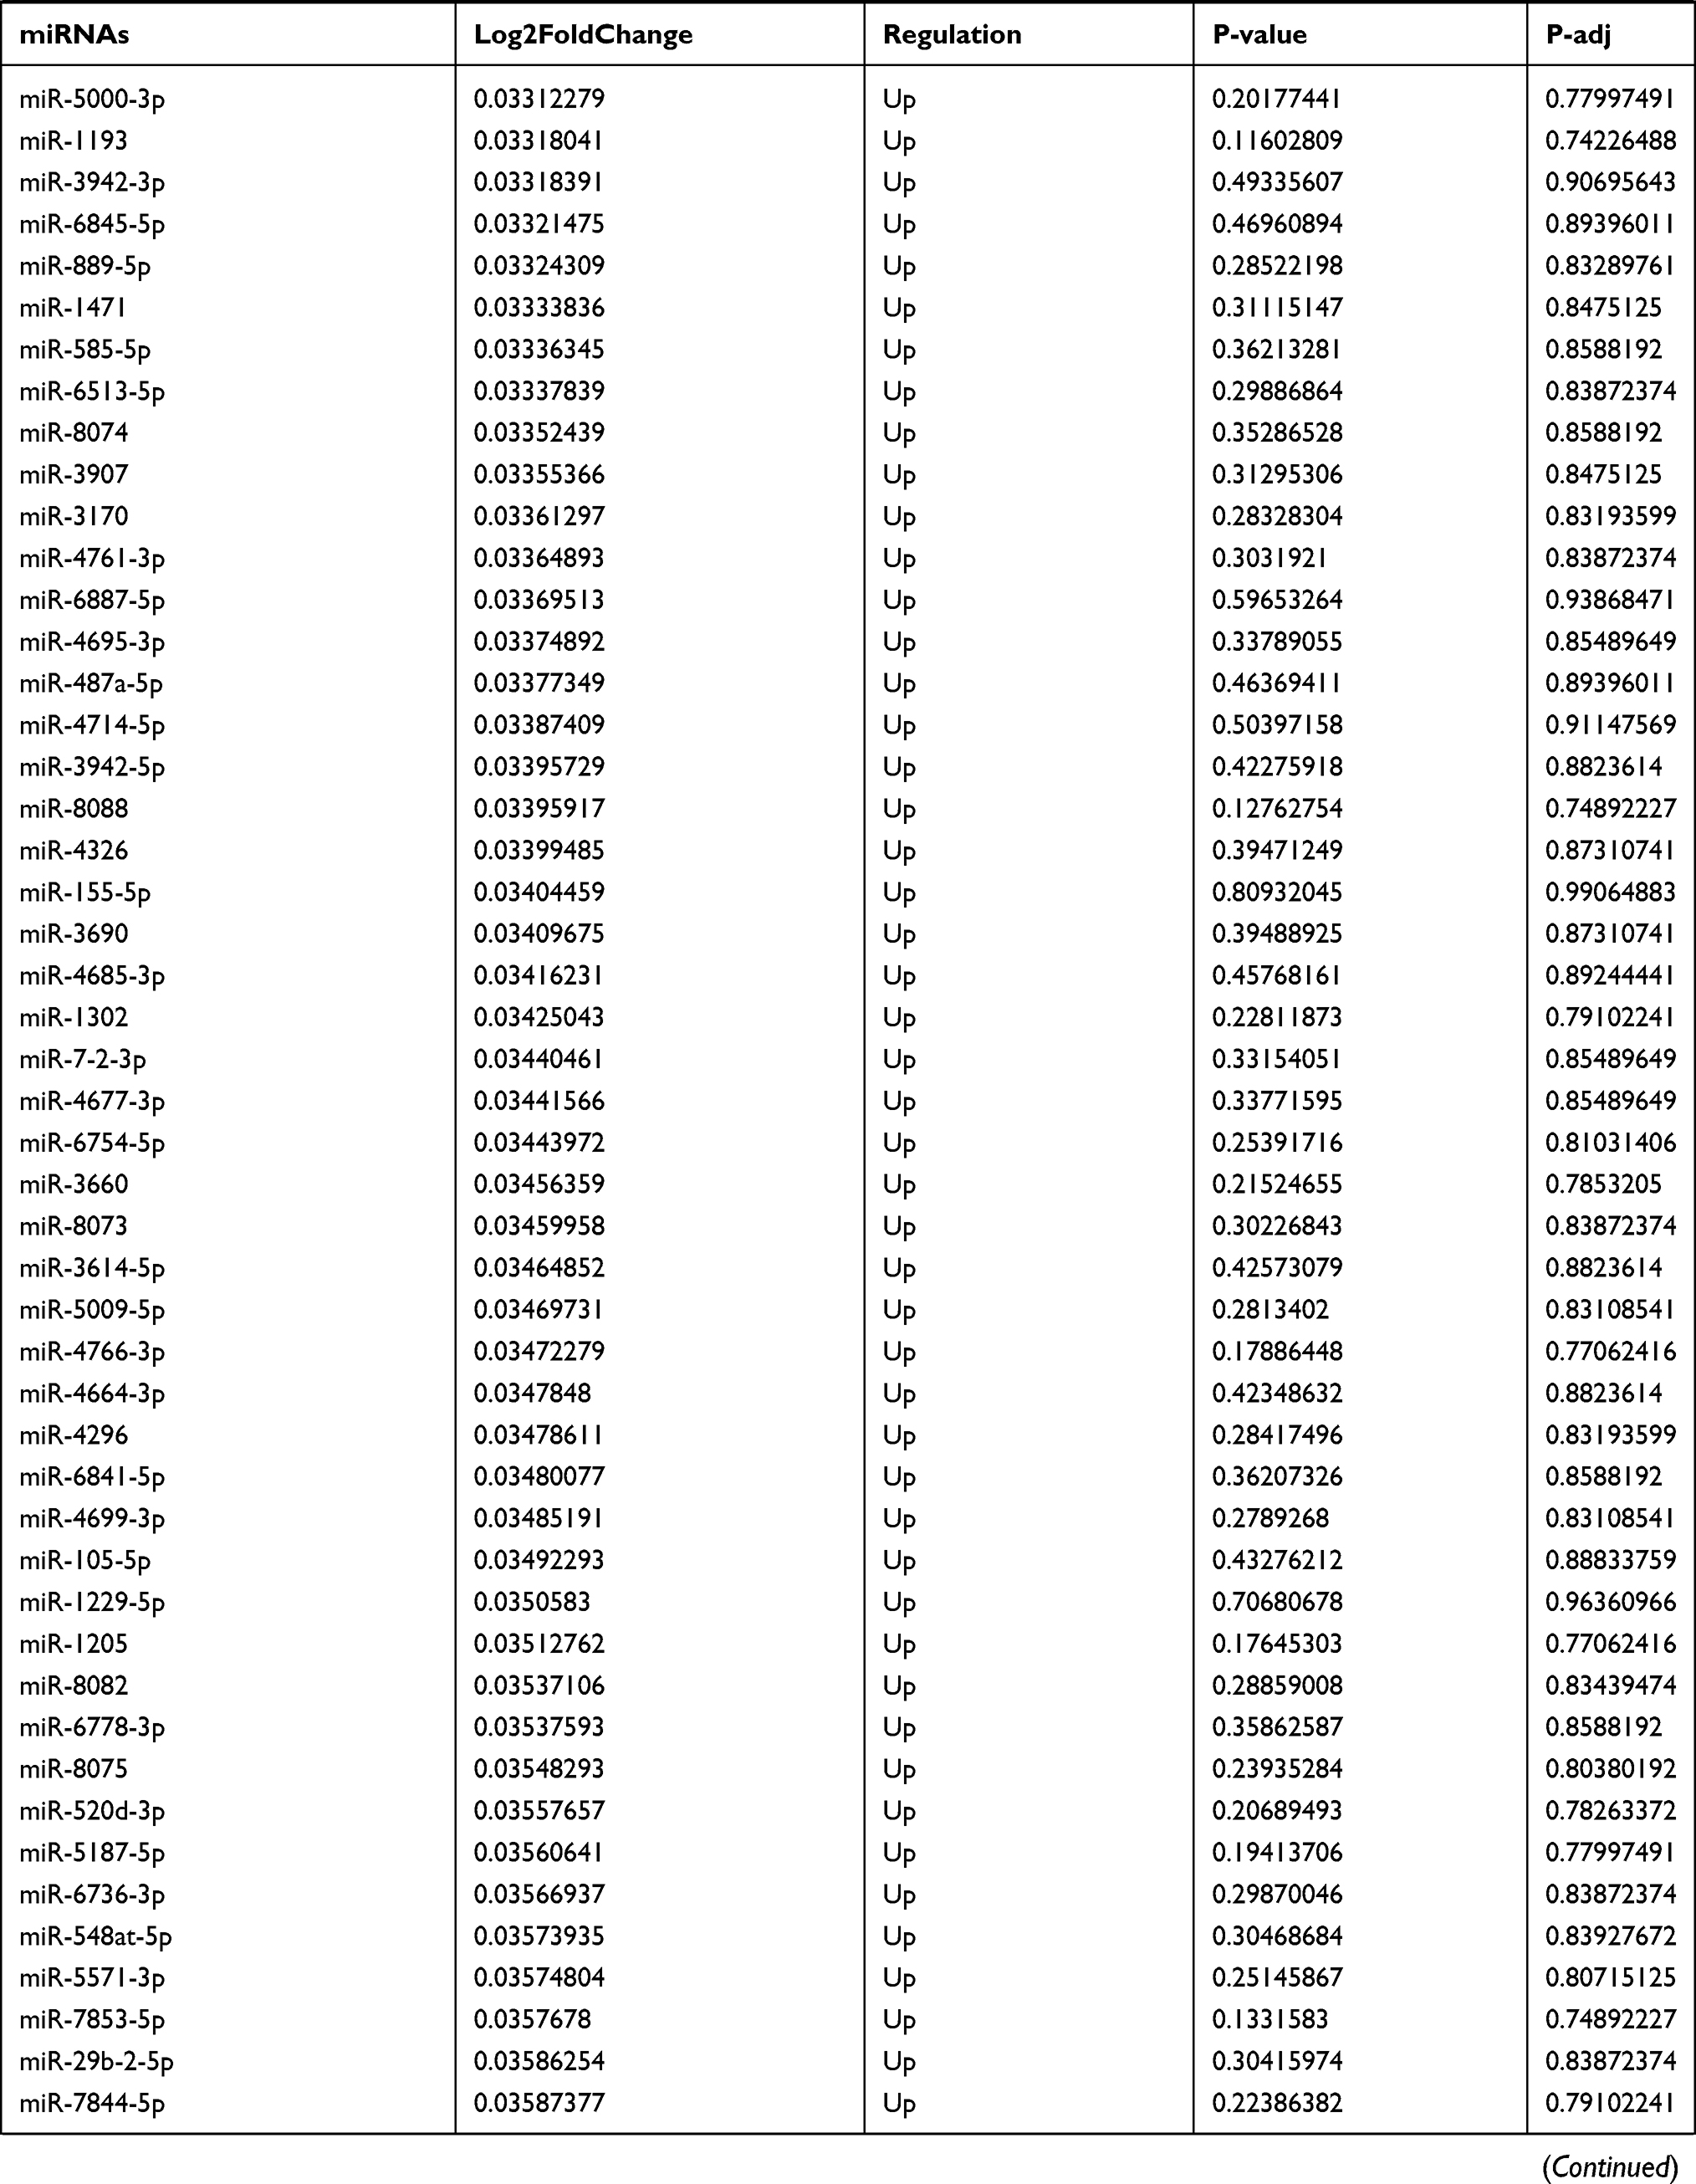 | 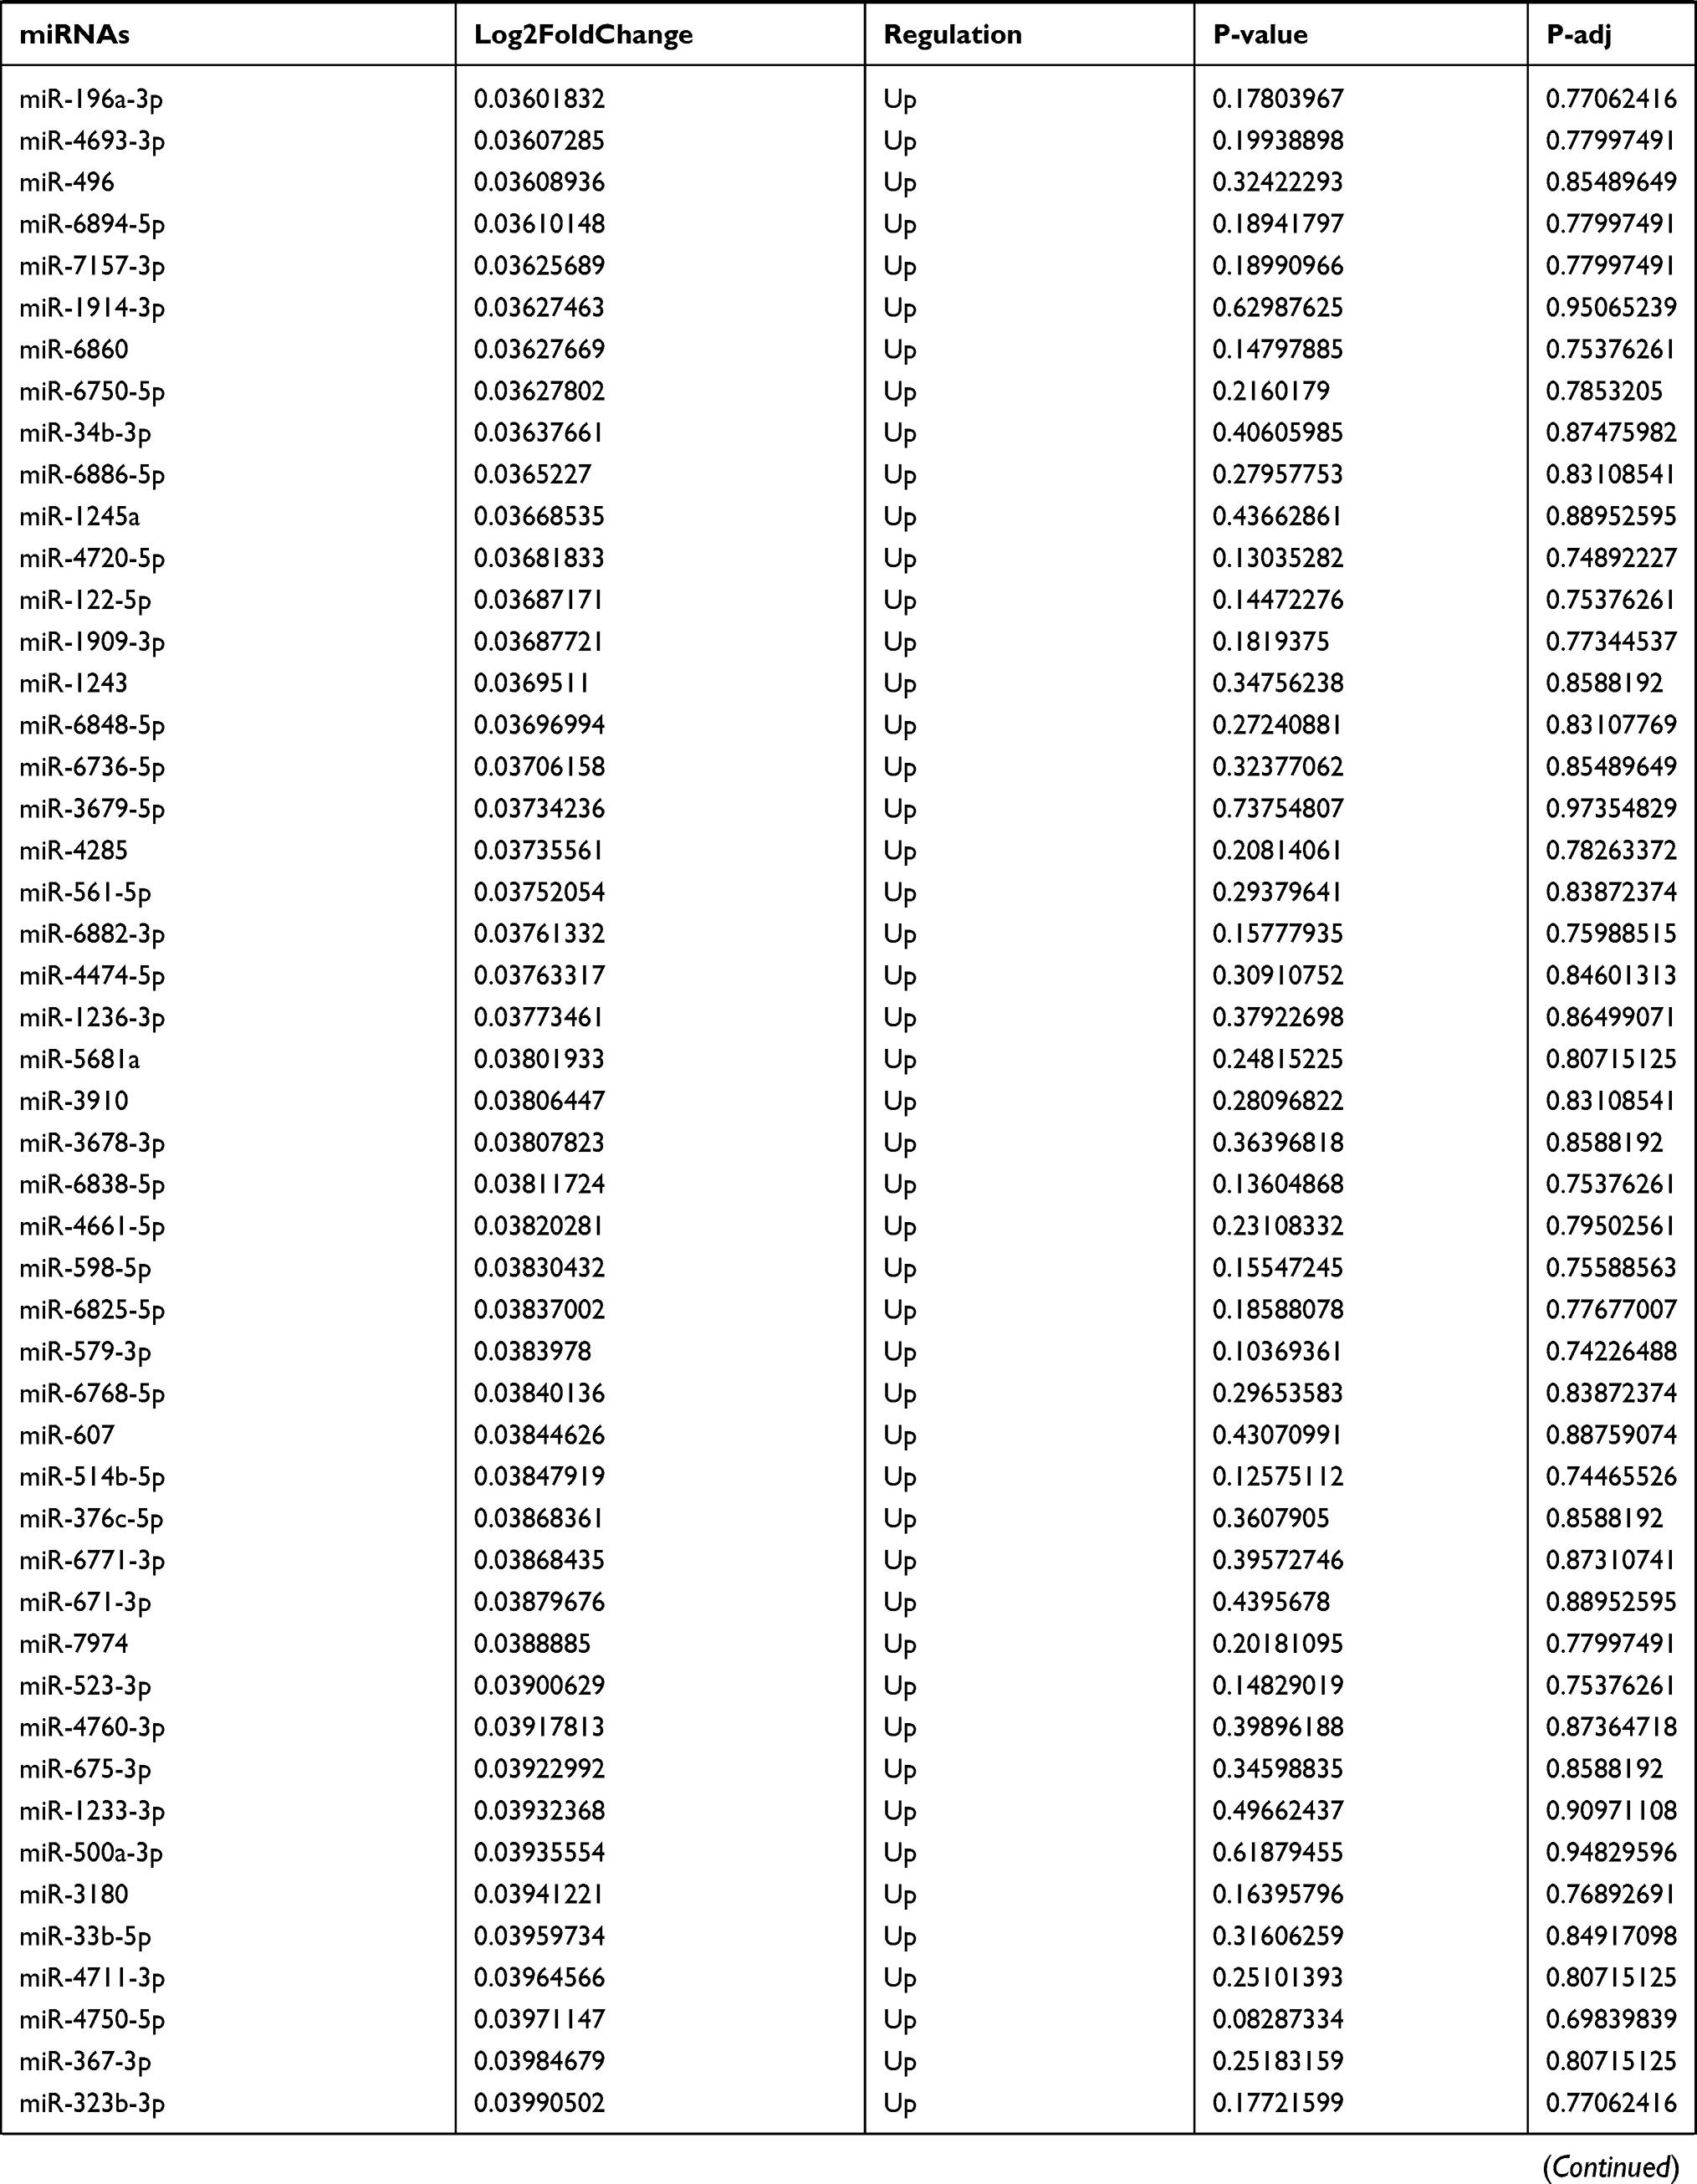 | 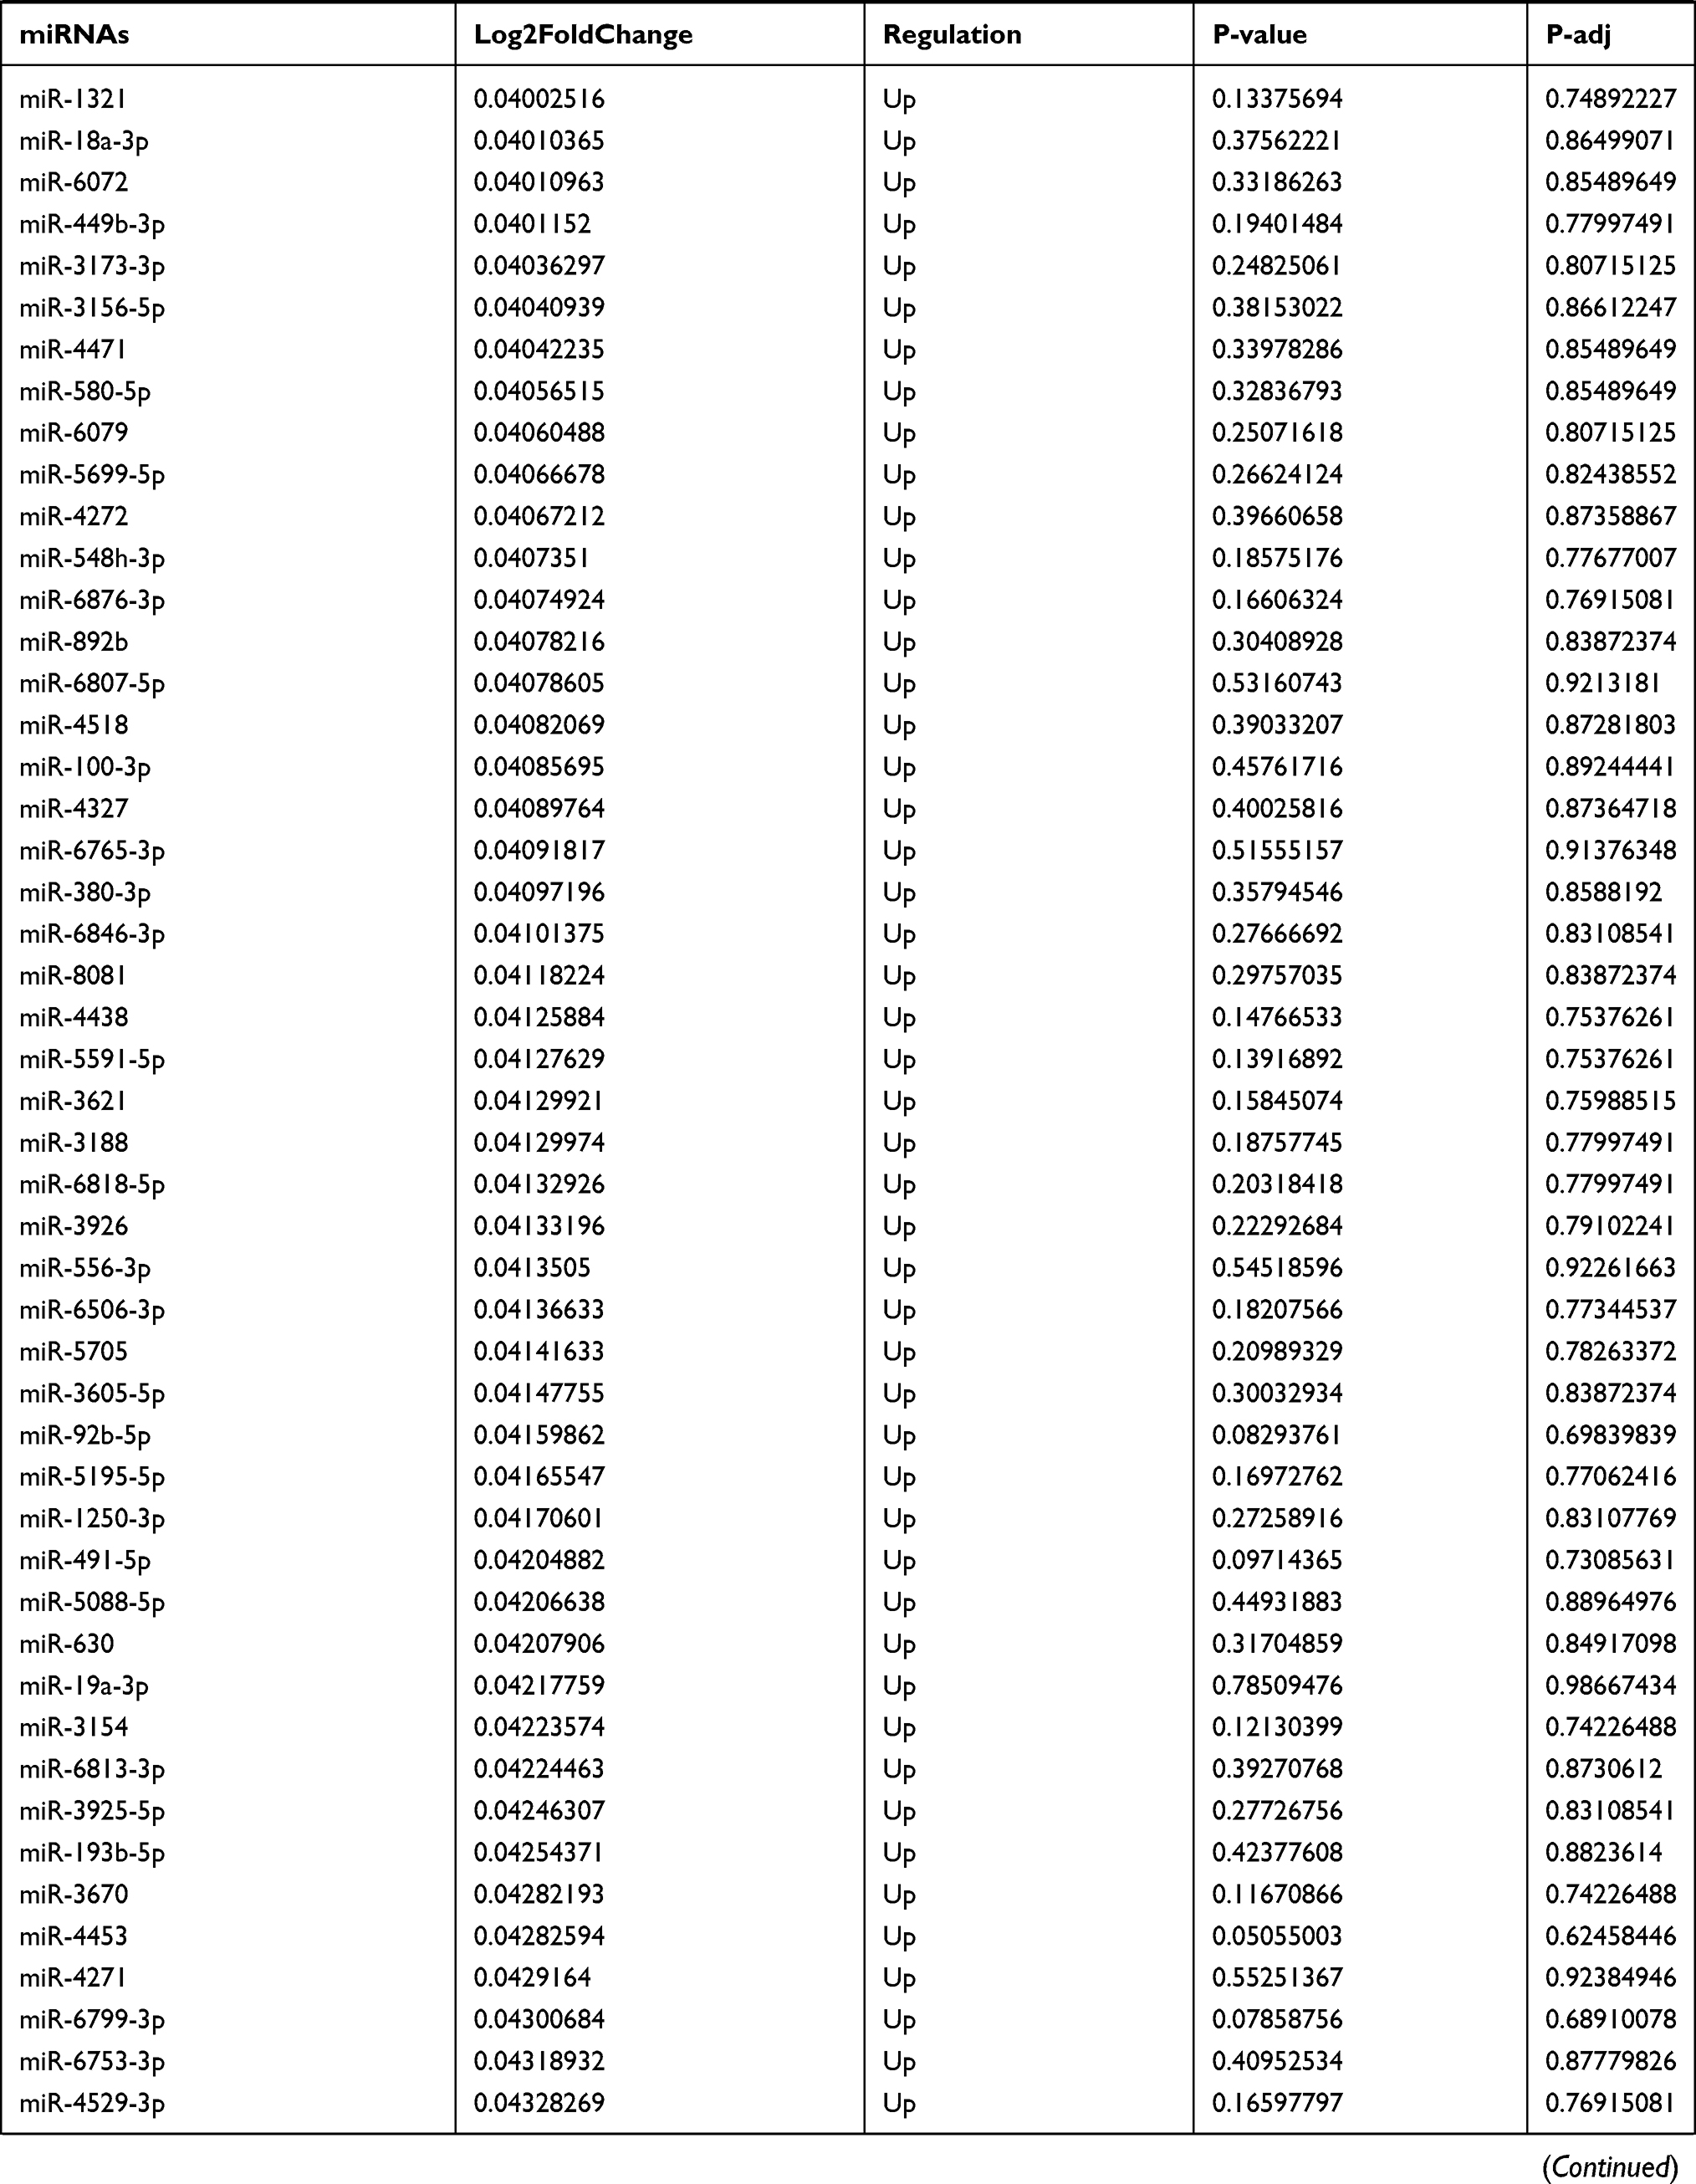 | 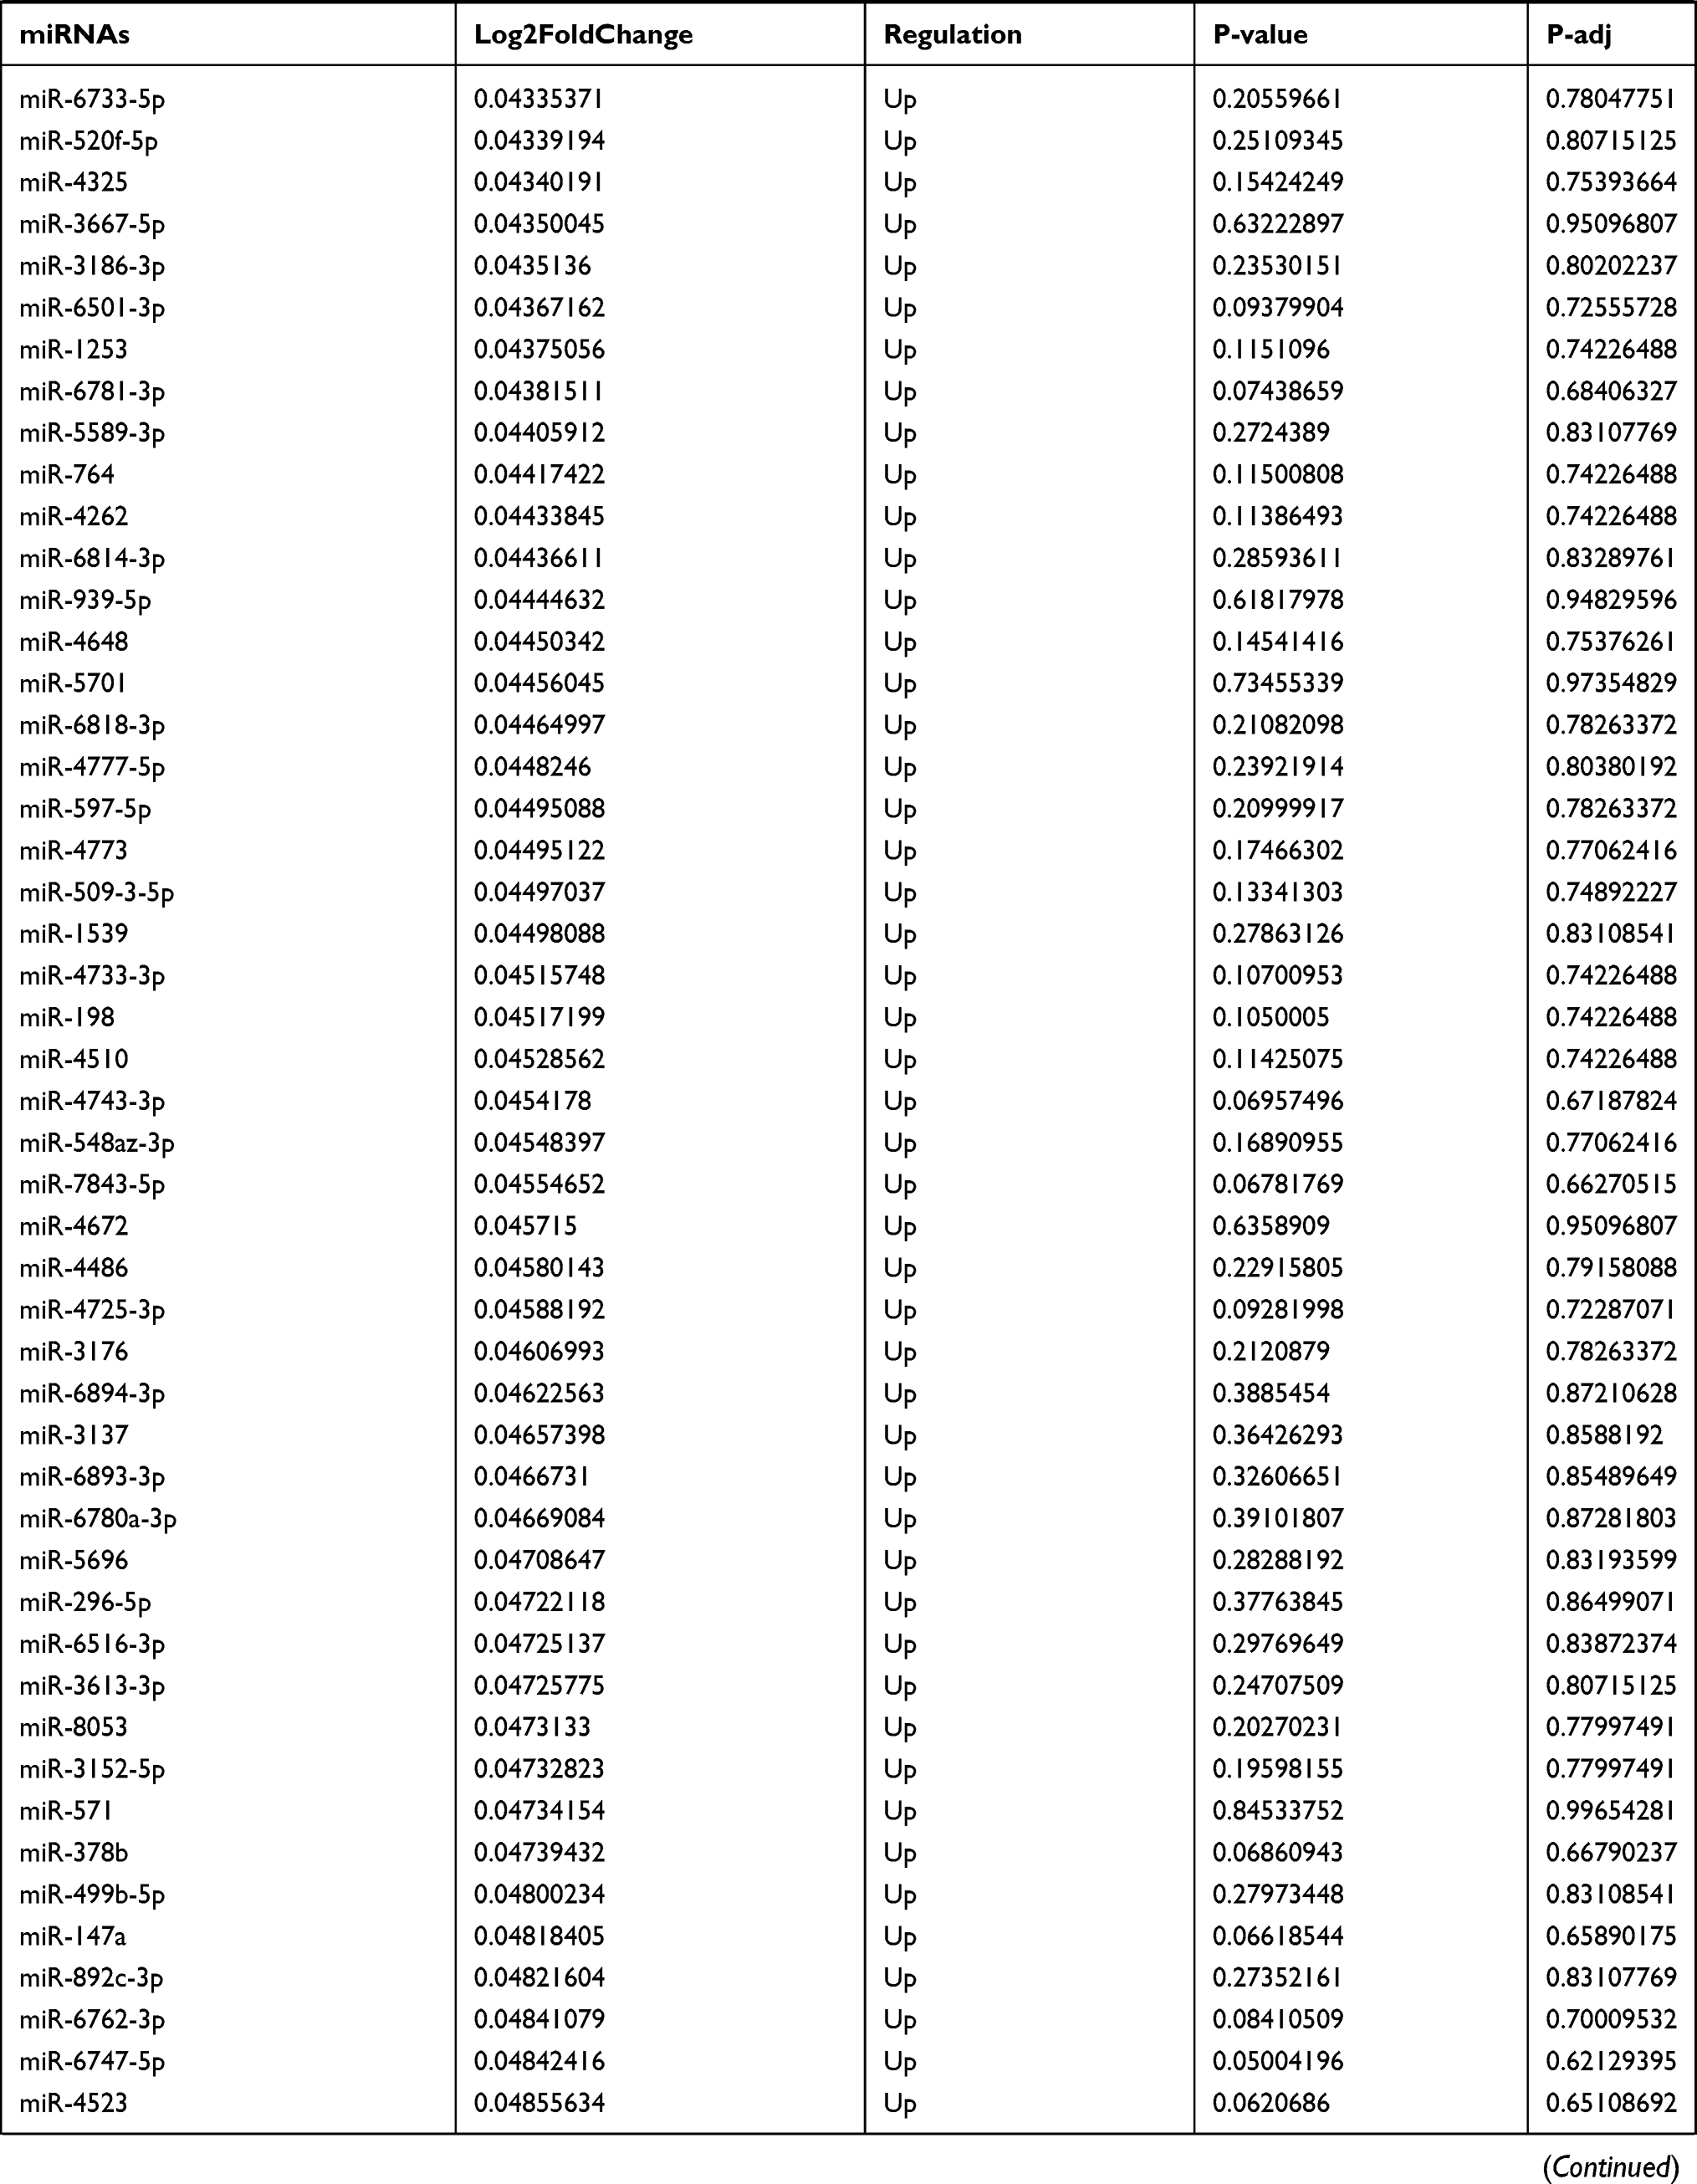 | 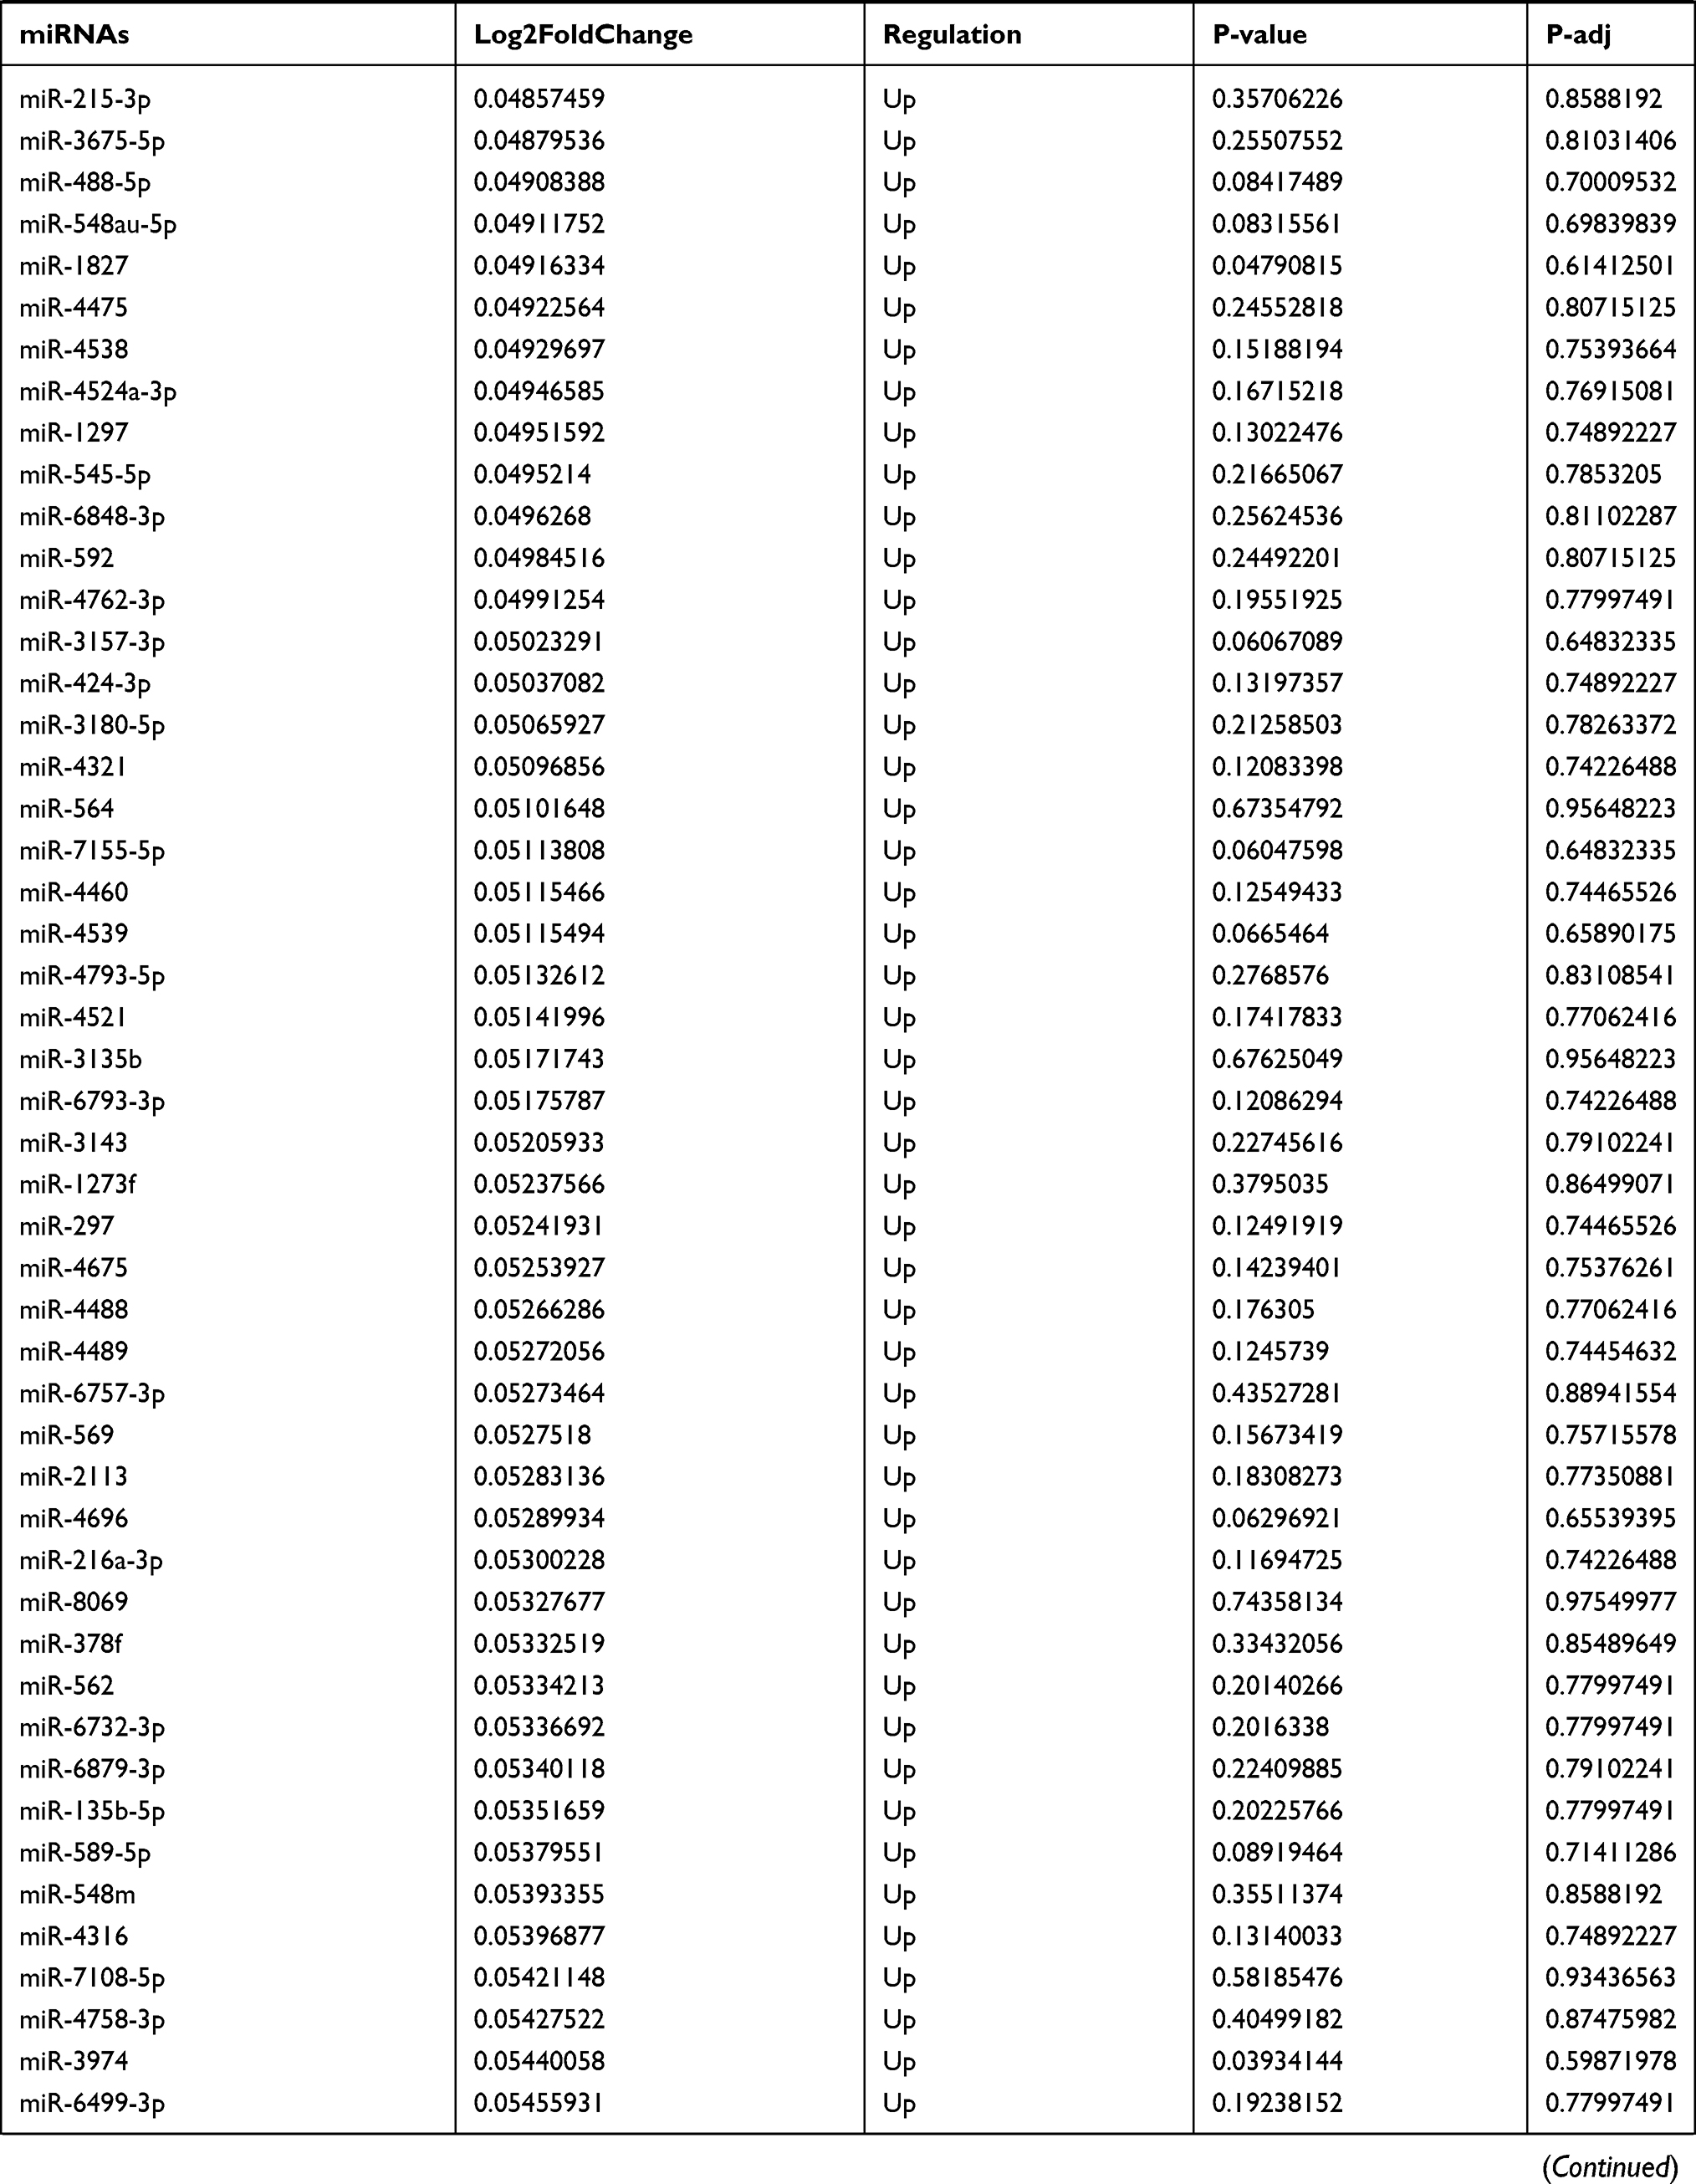 | 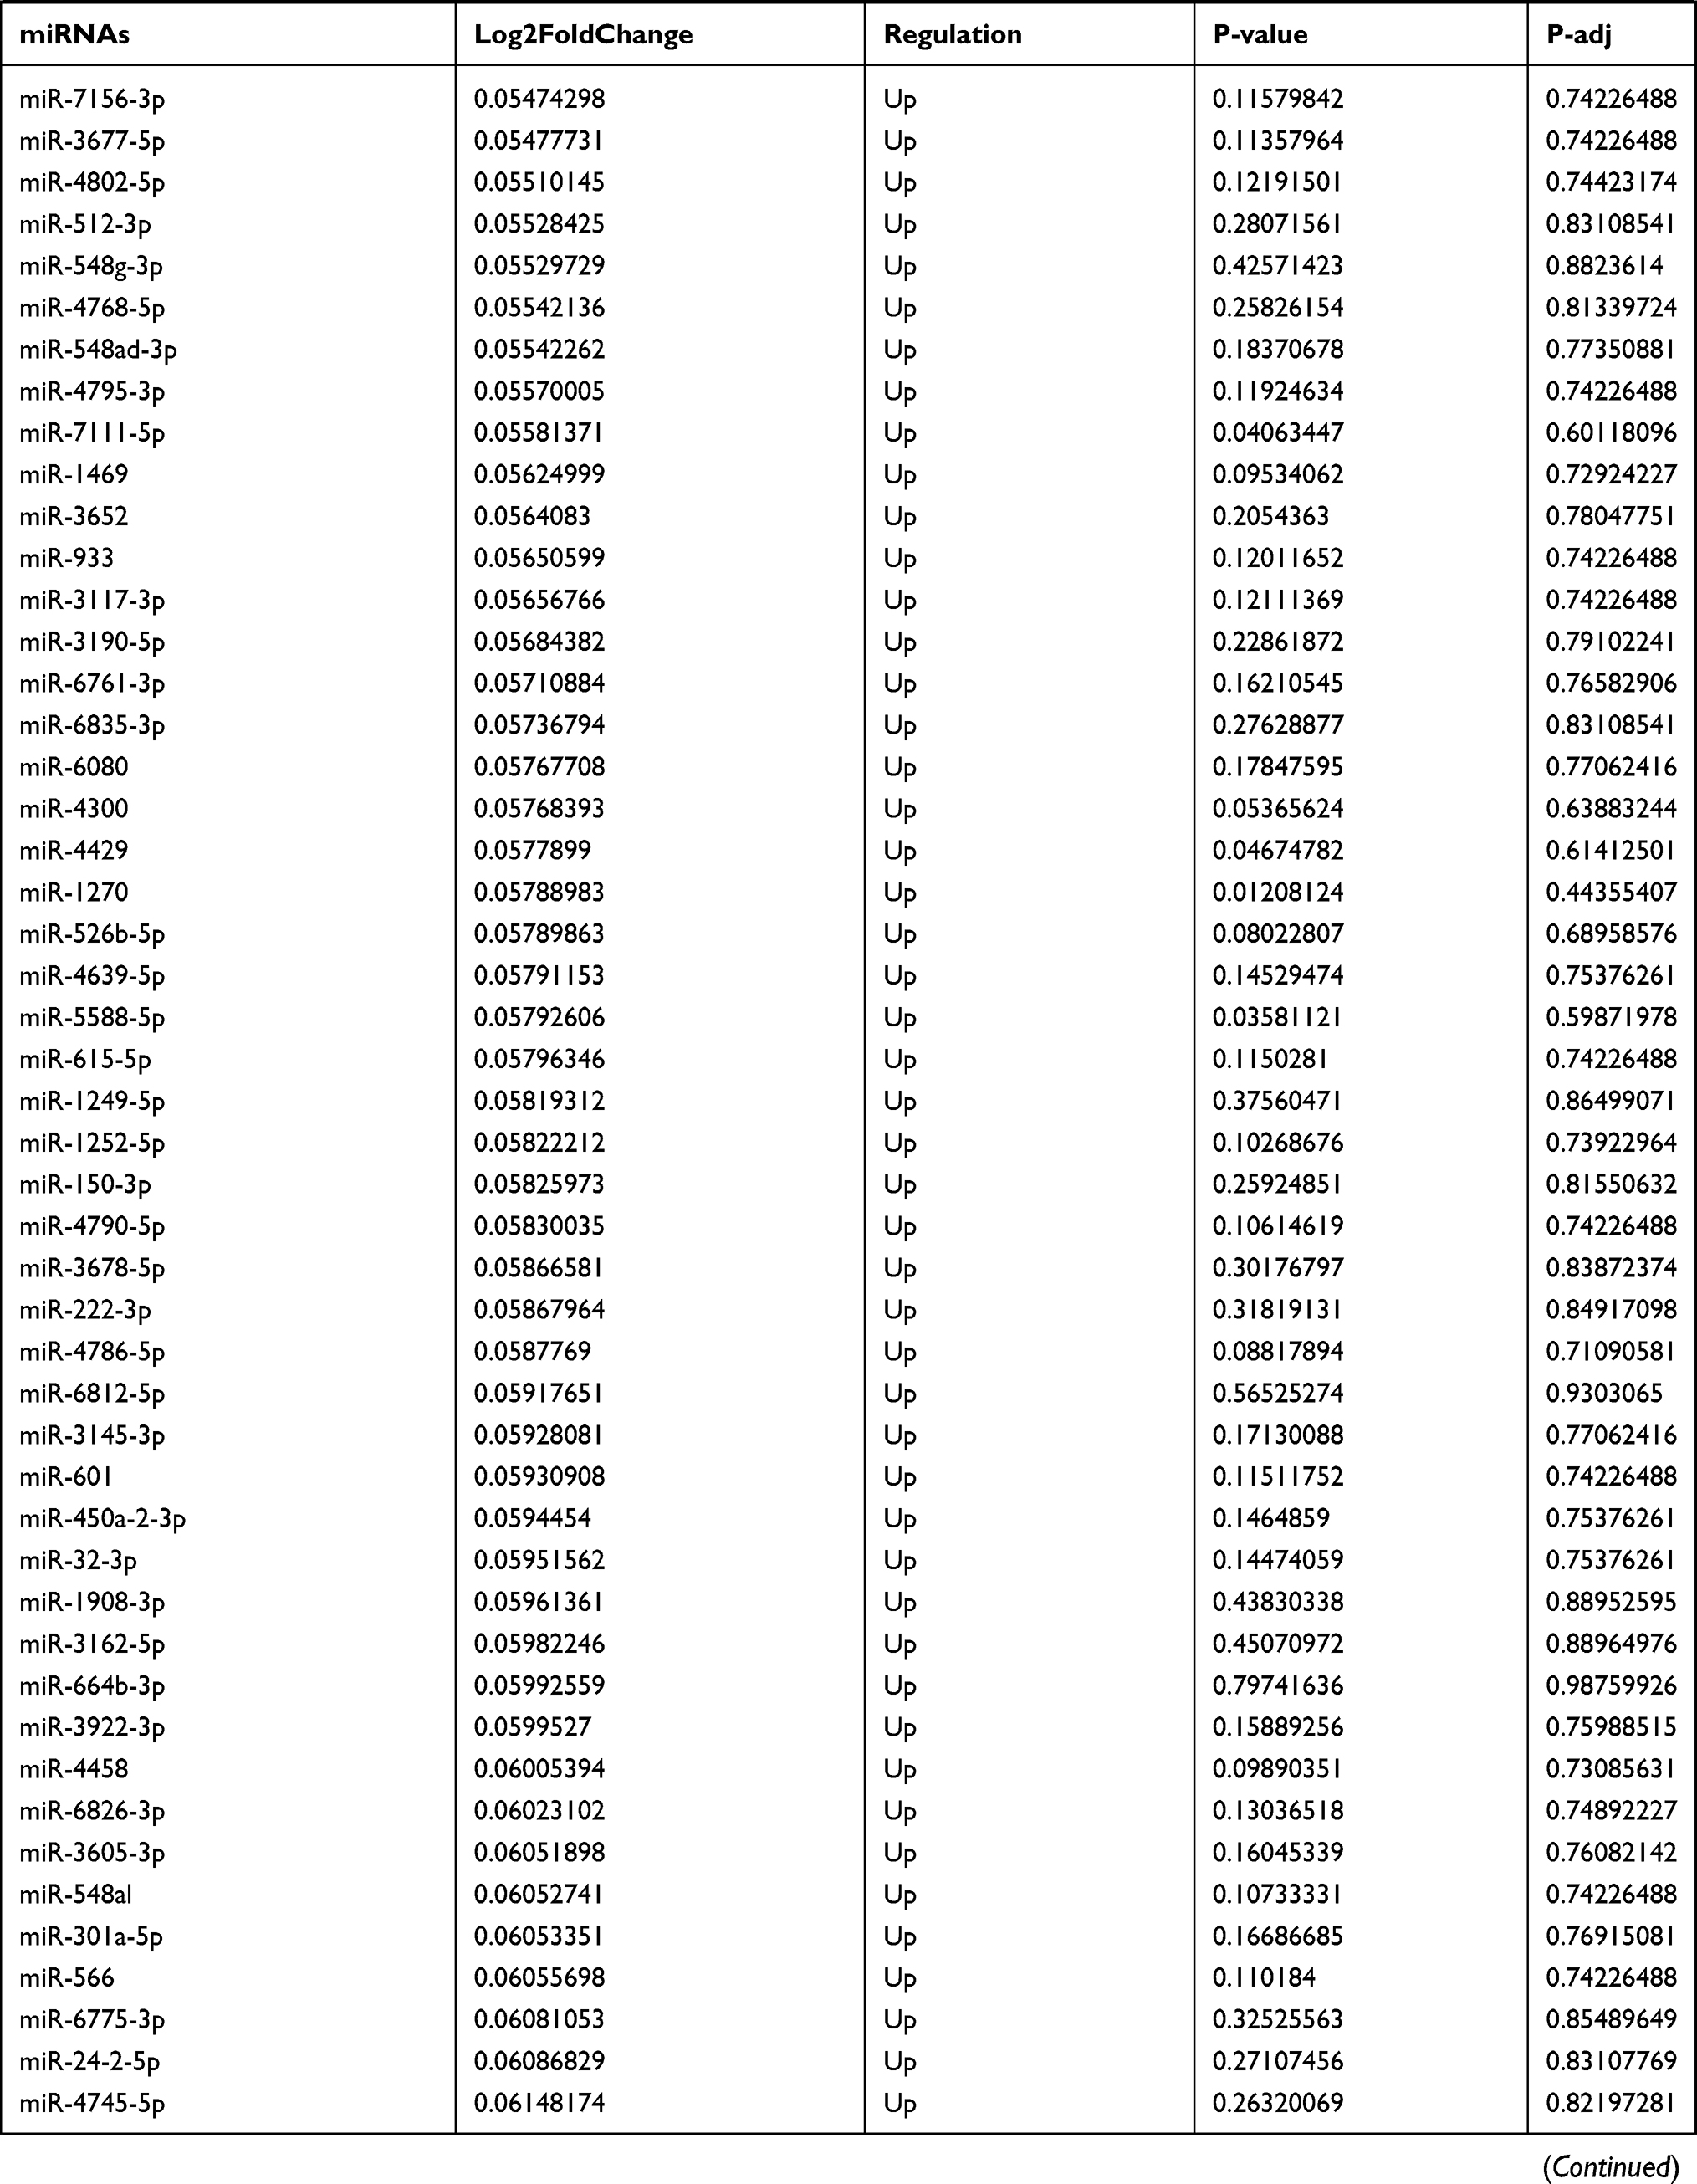 | 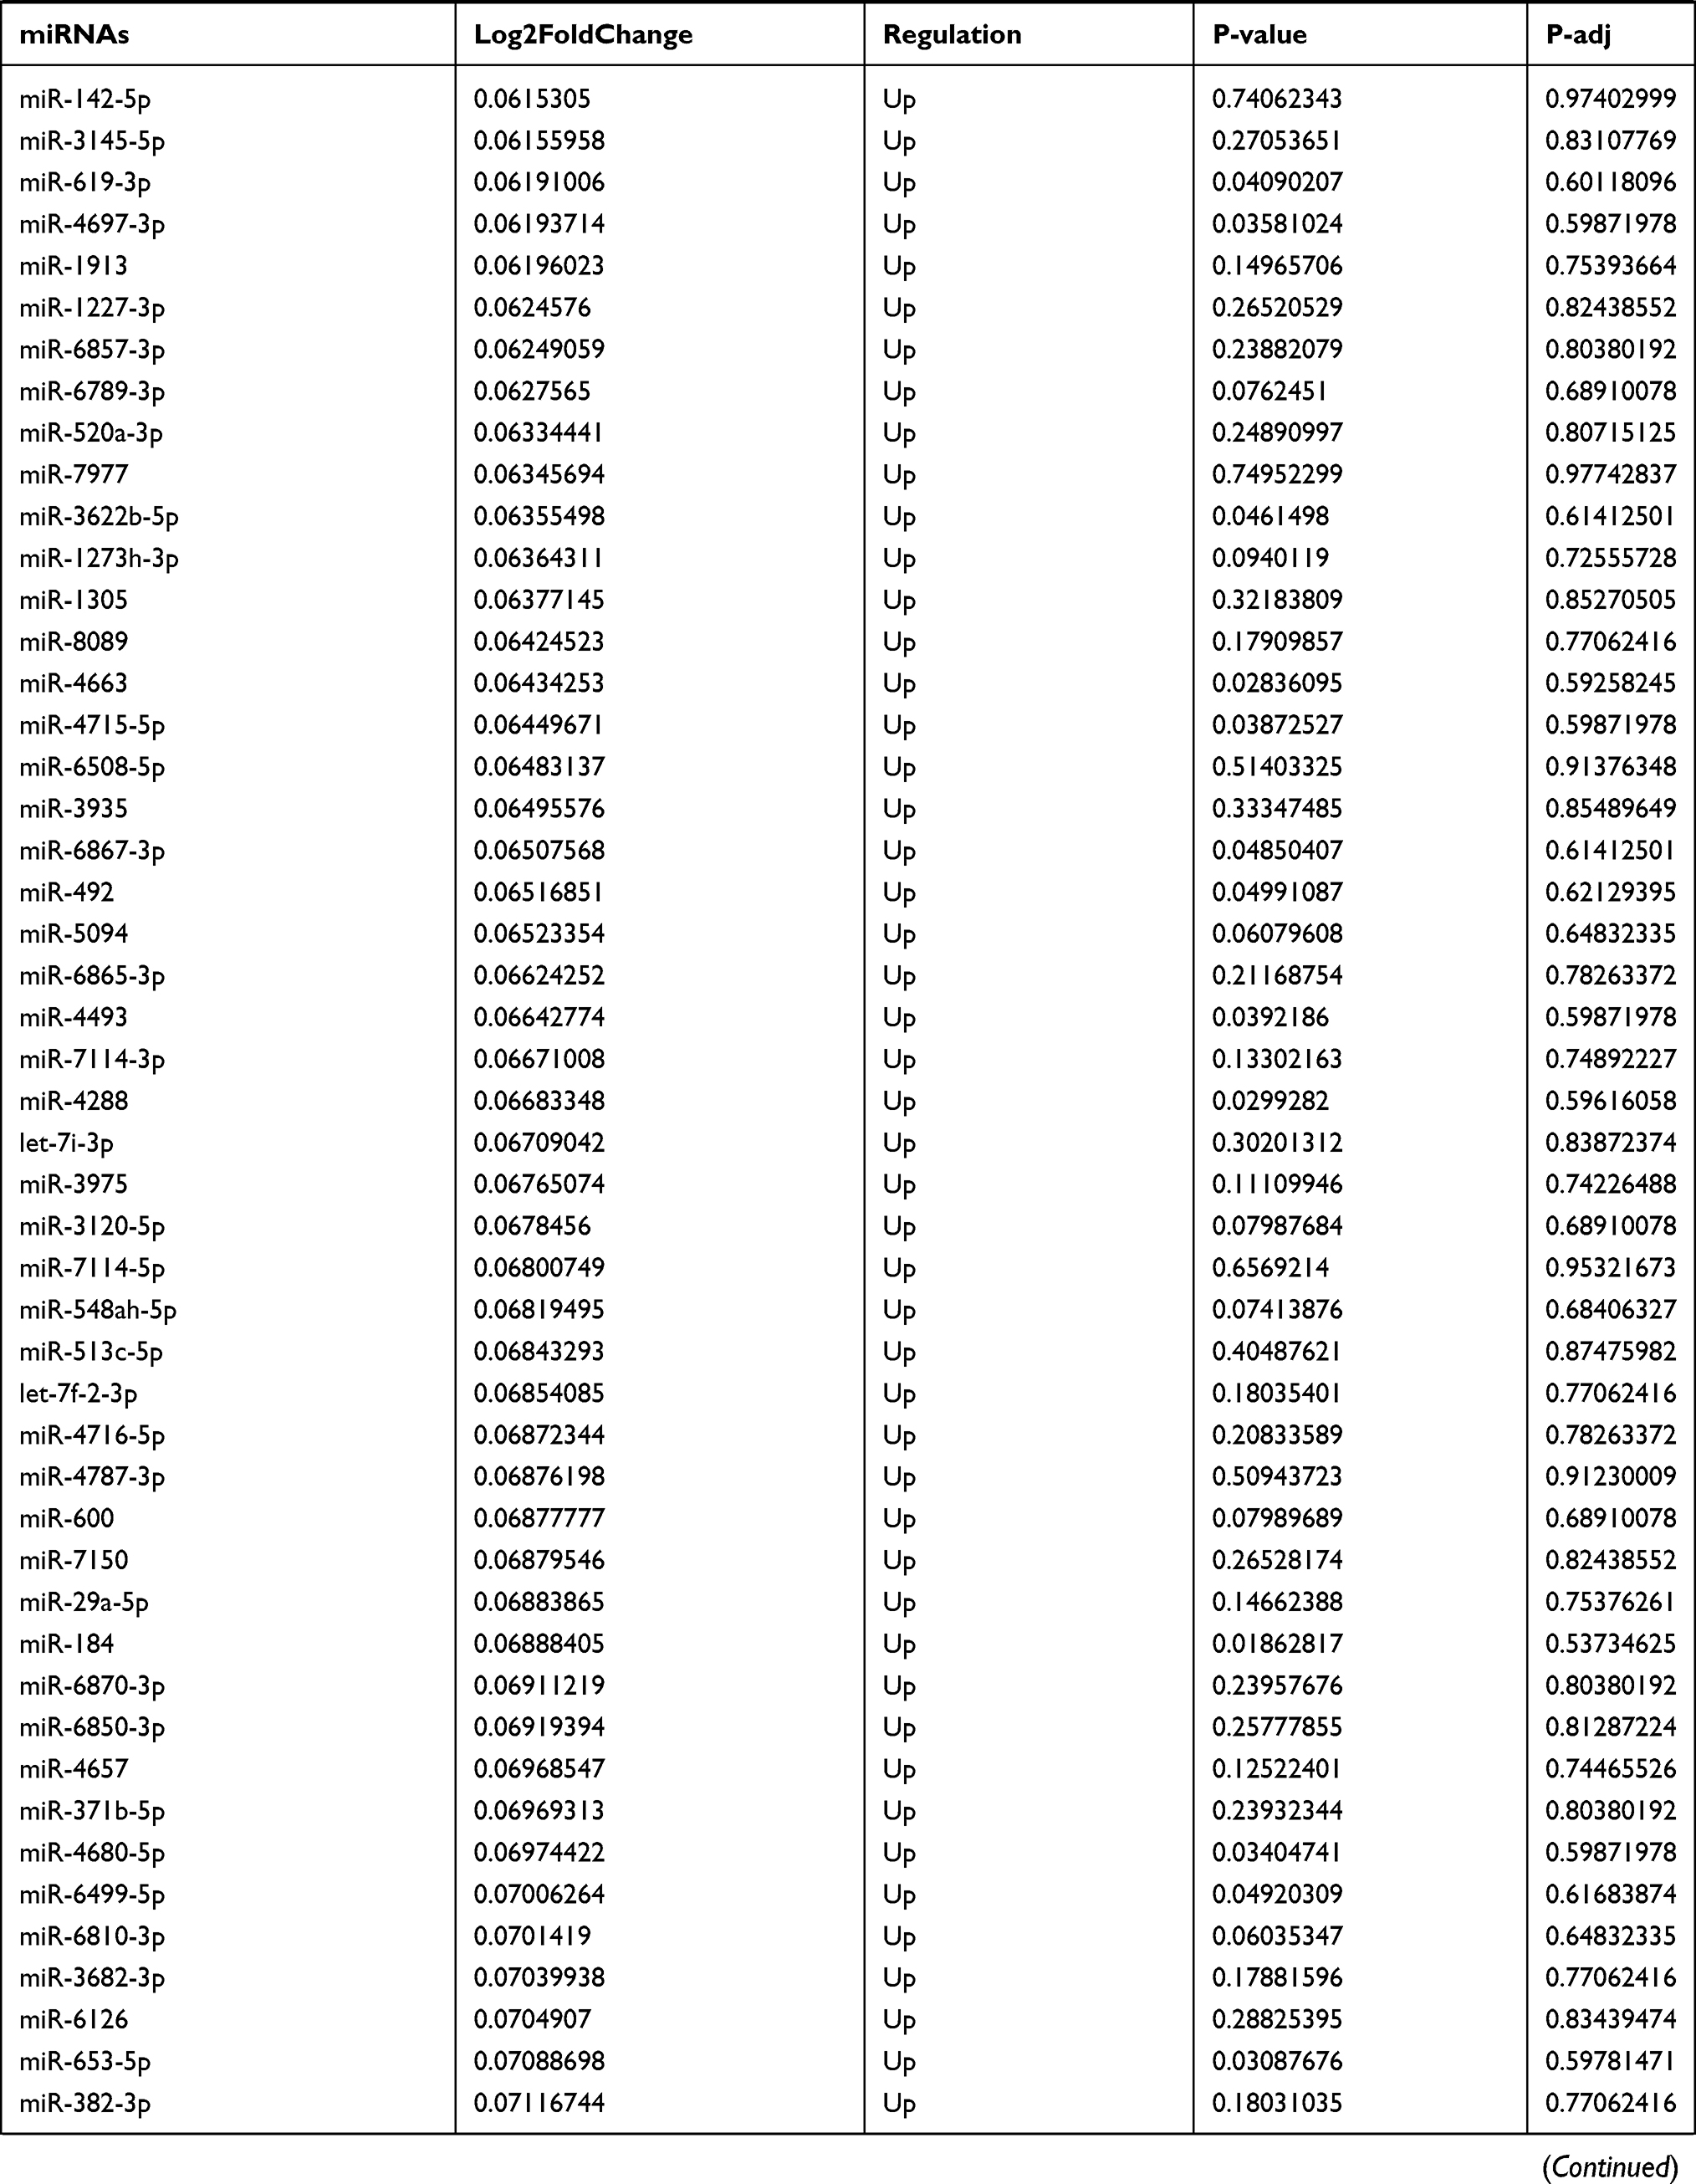 | 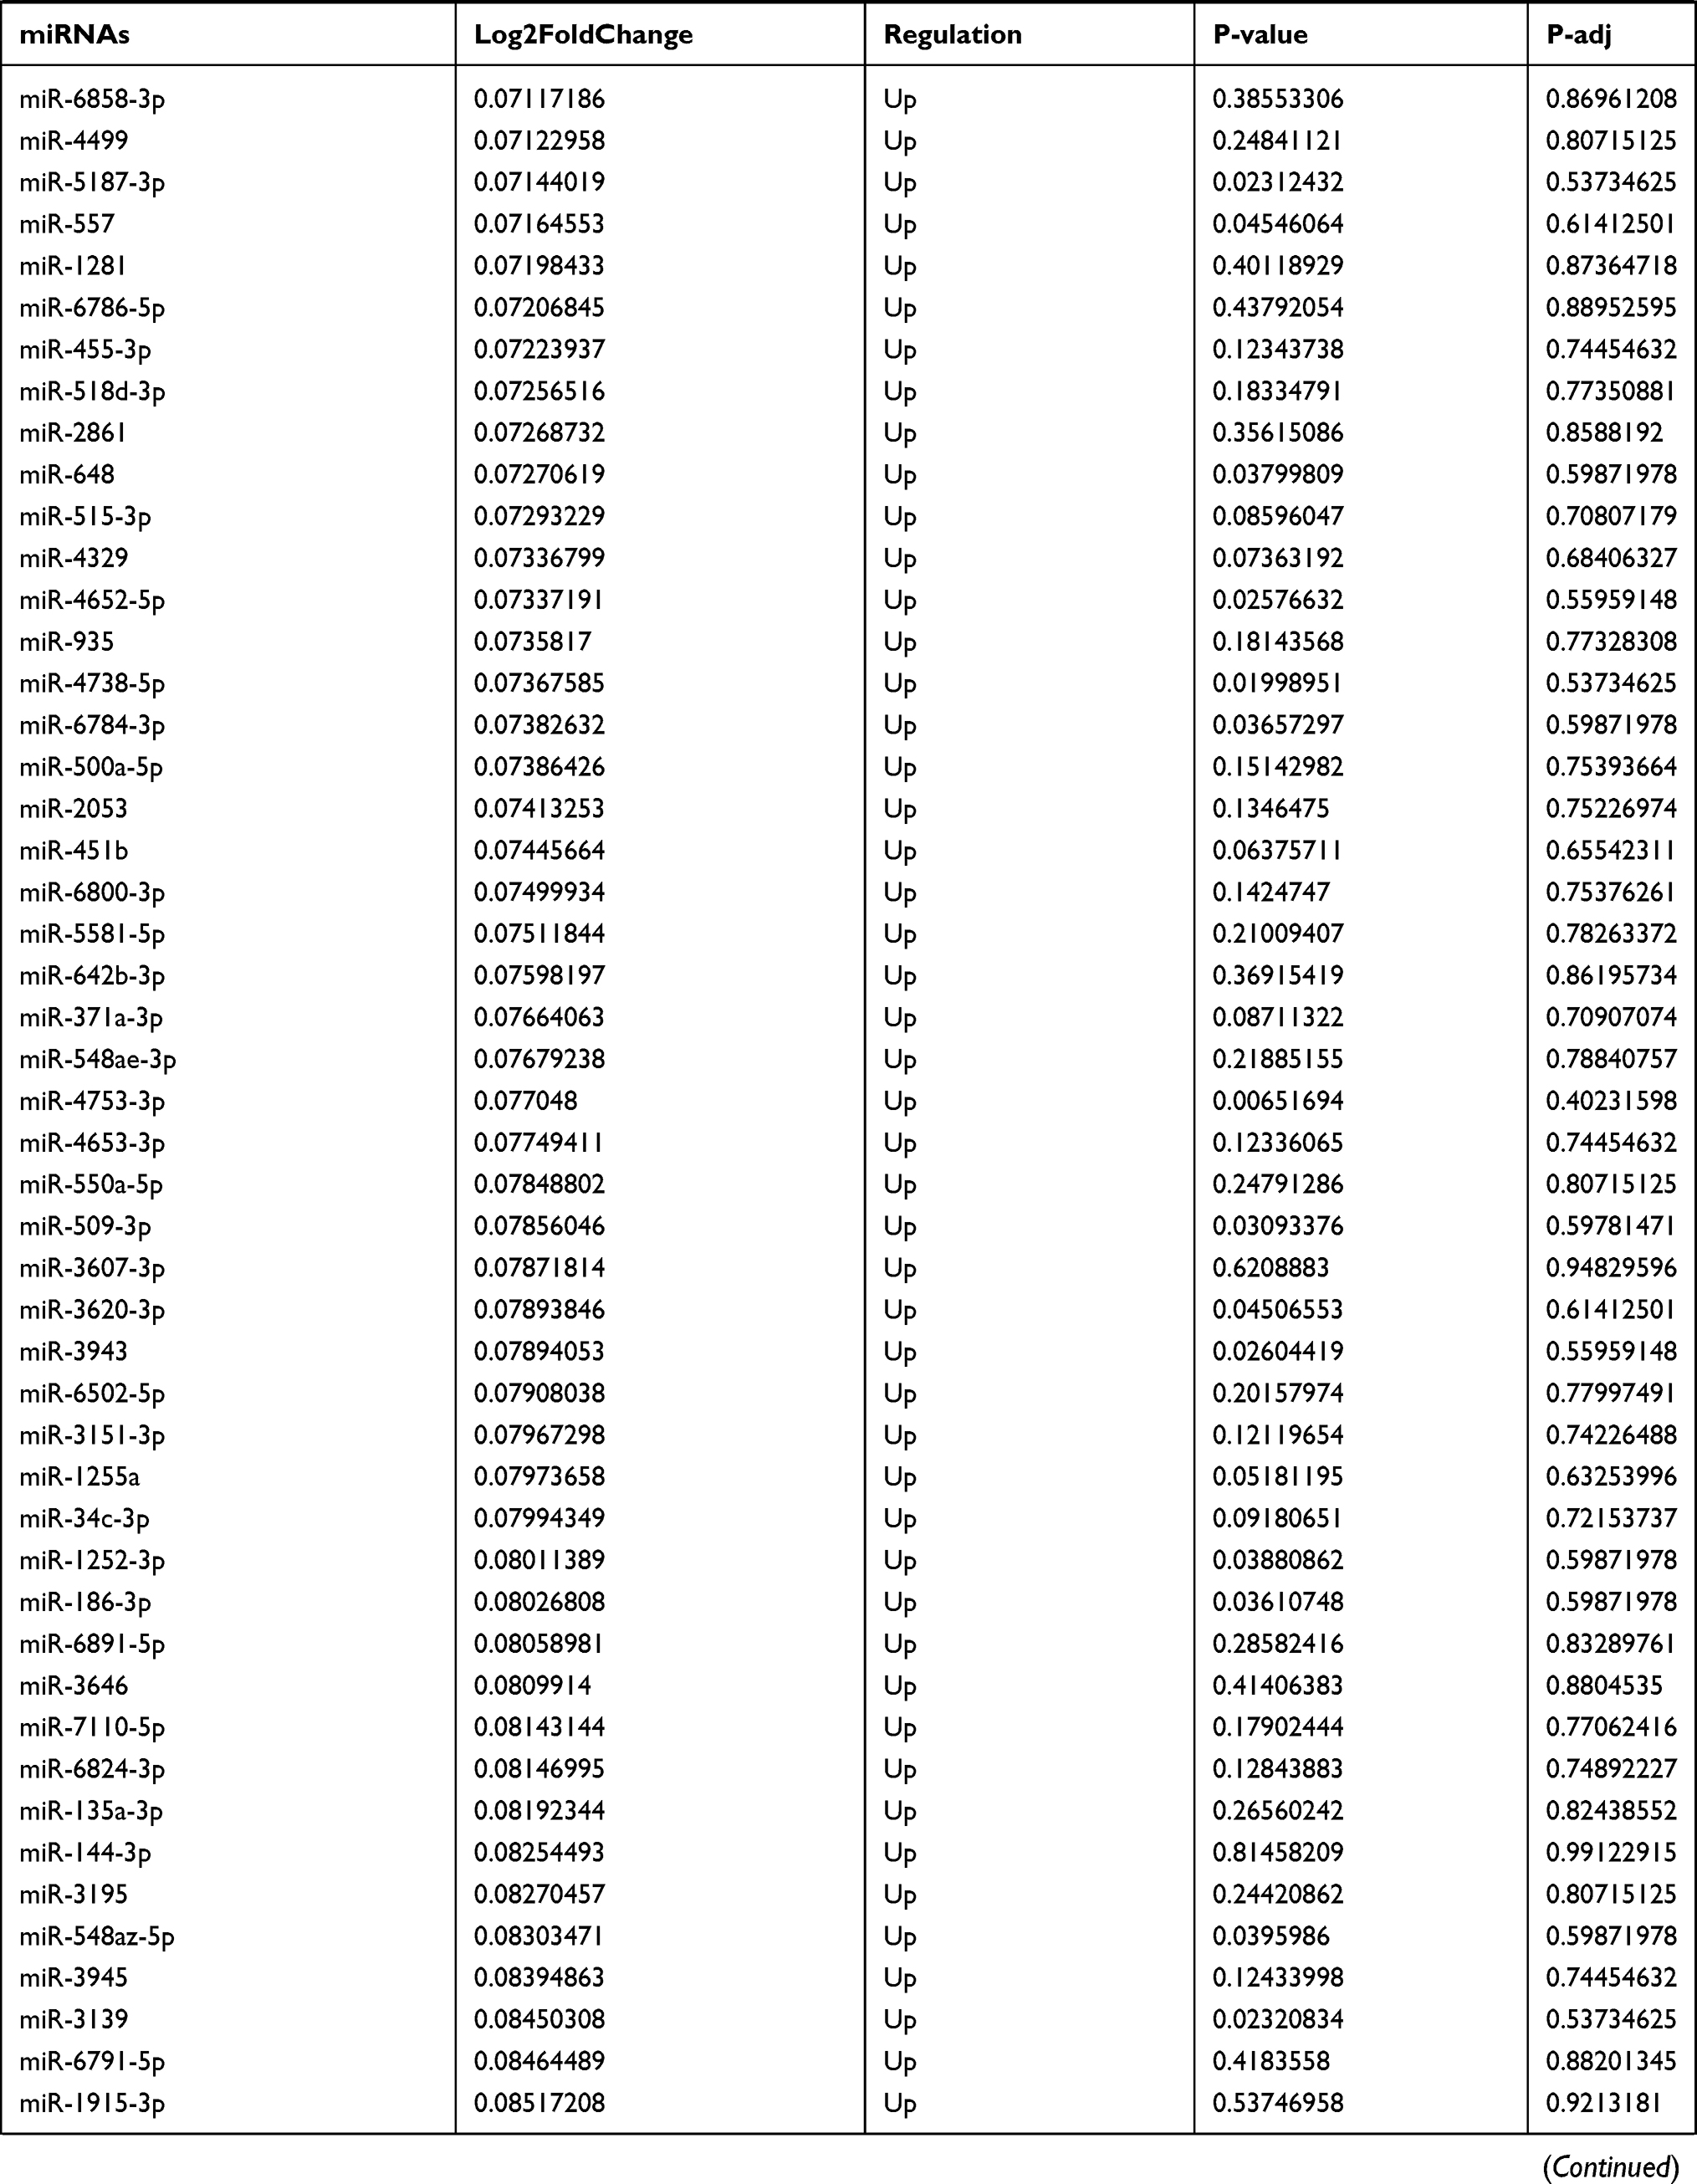 | 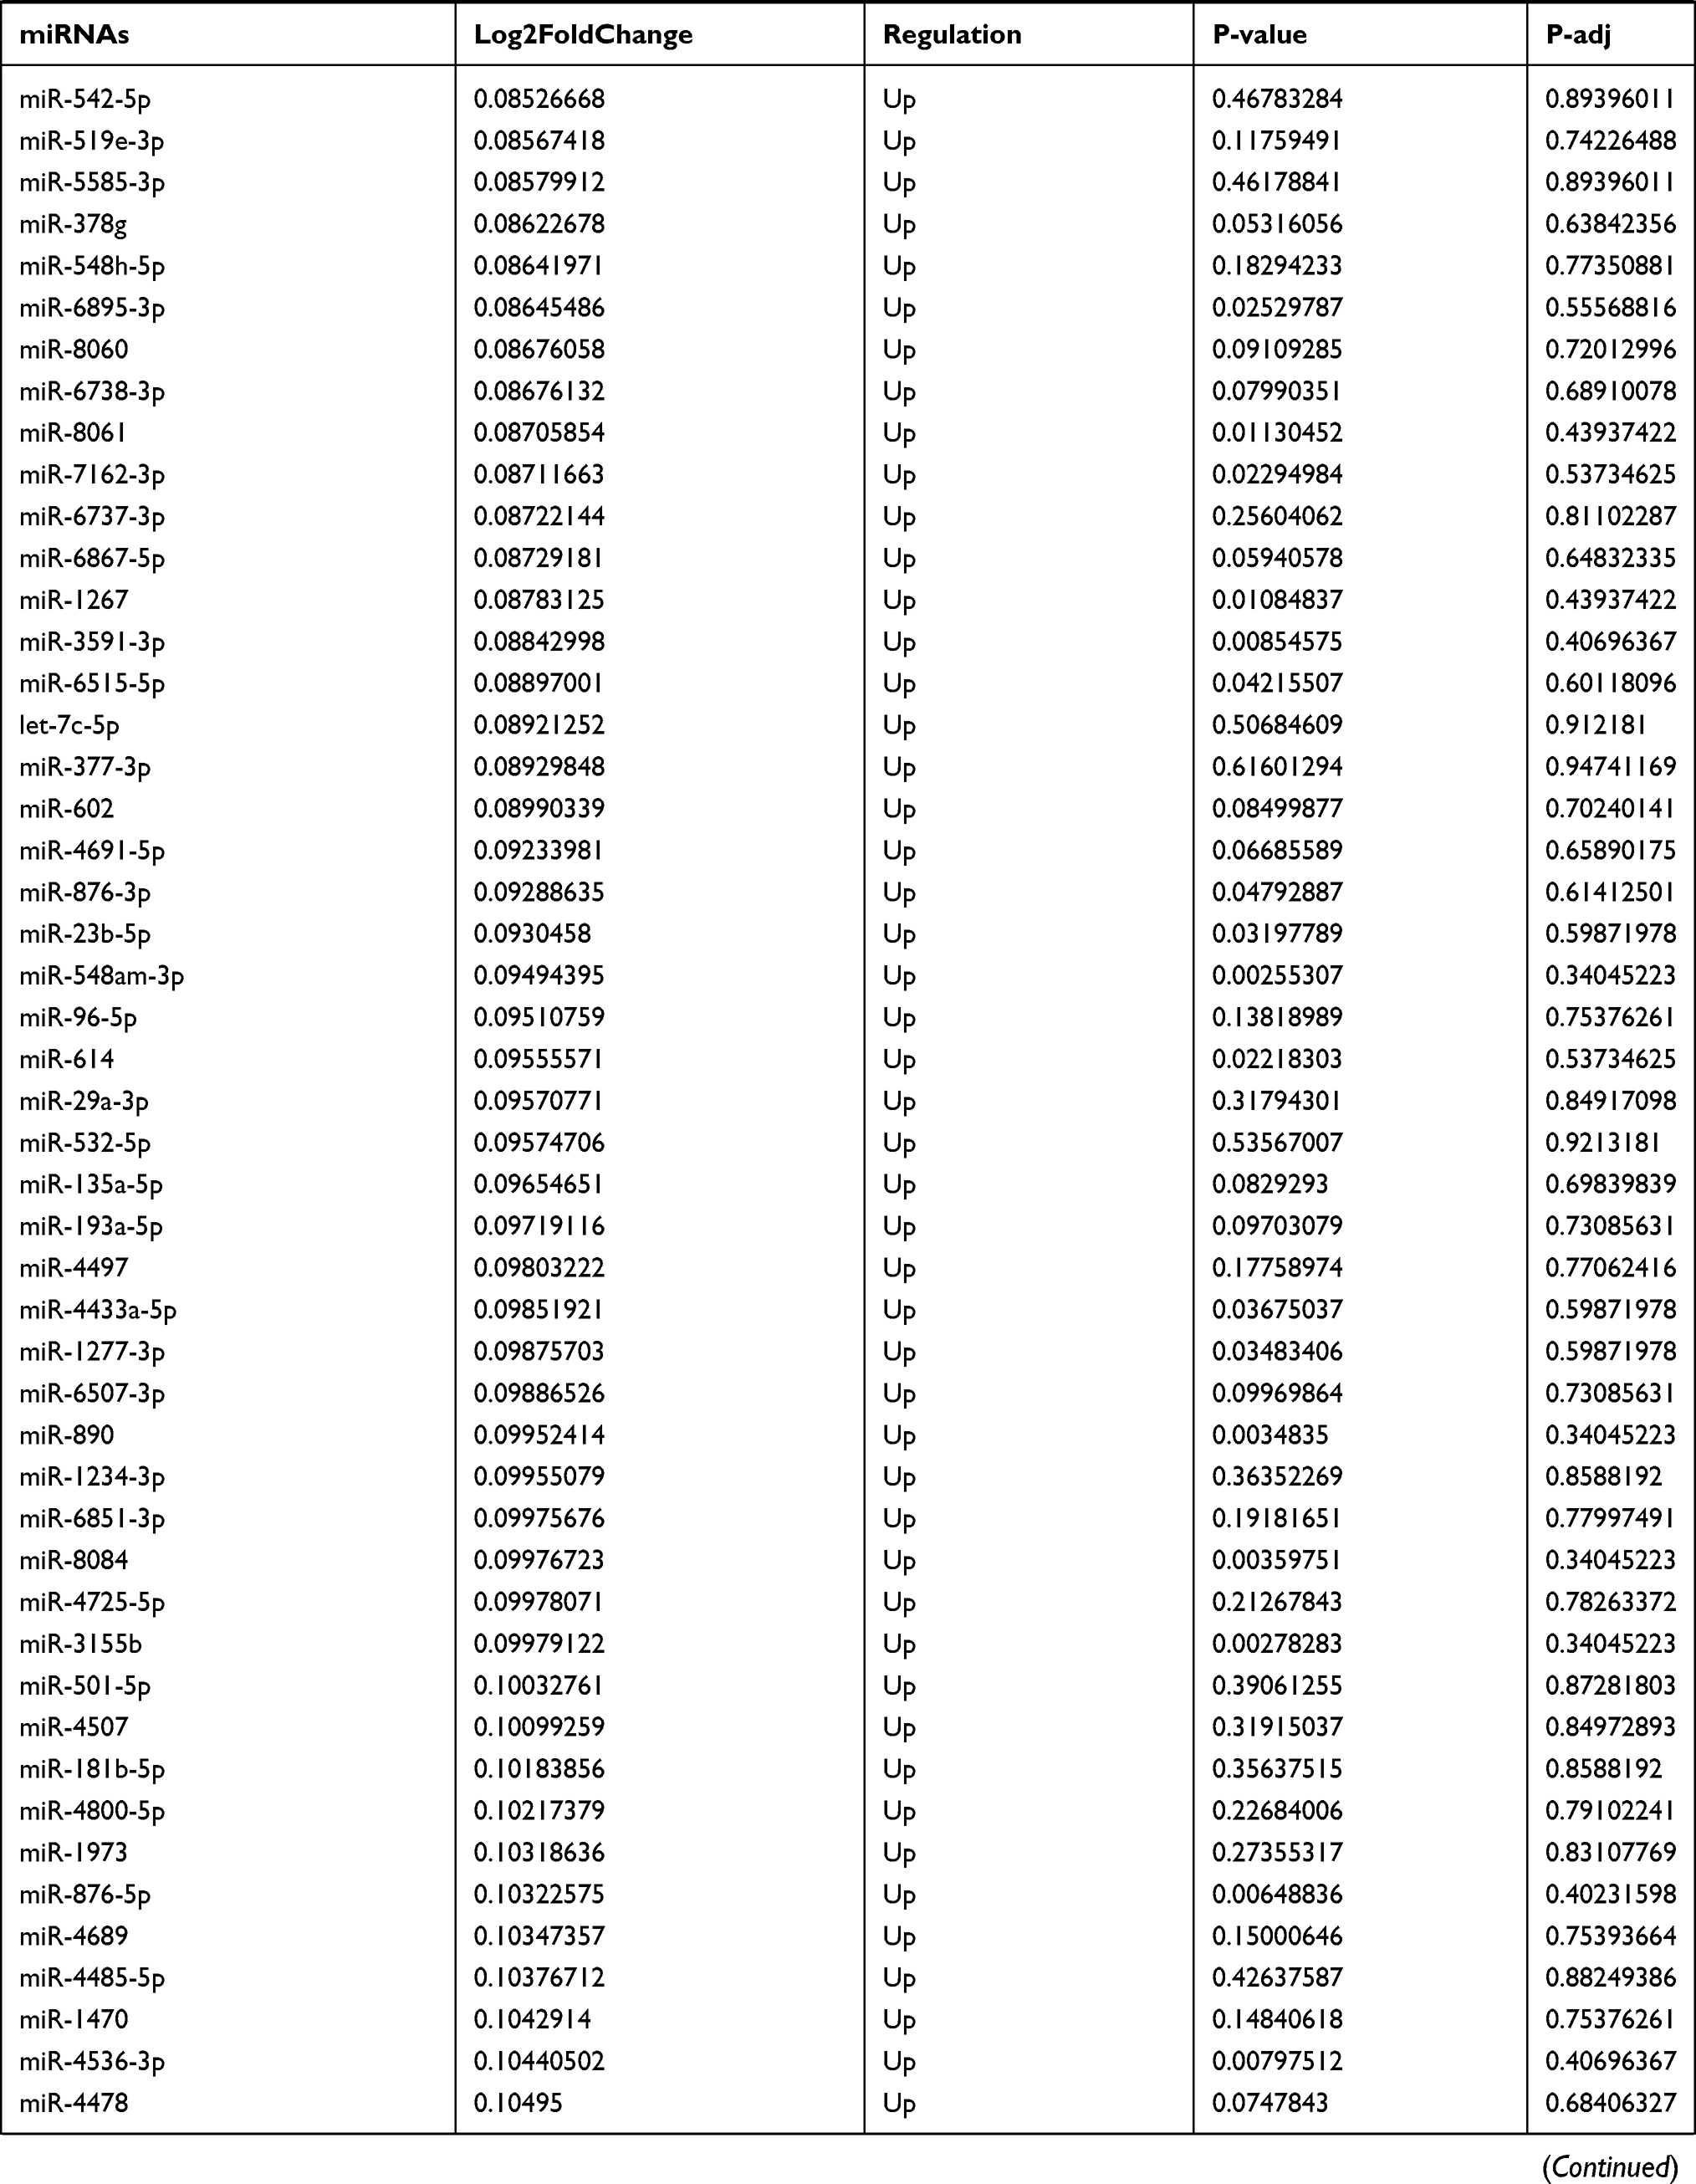 | 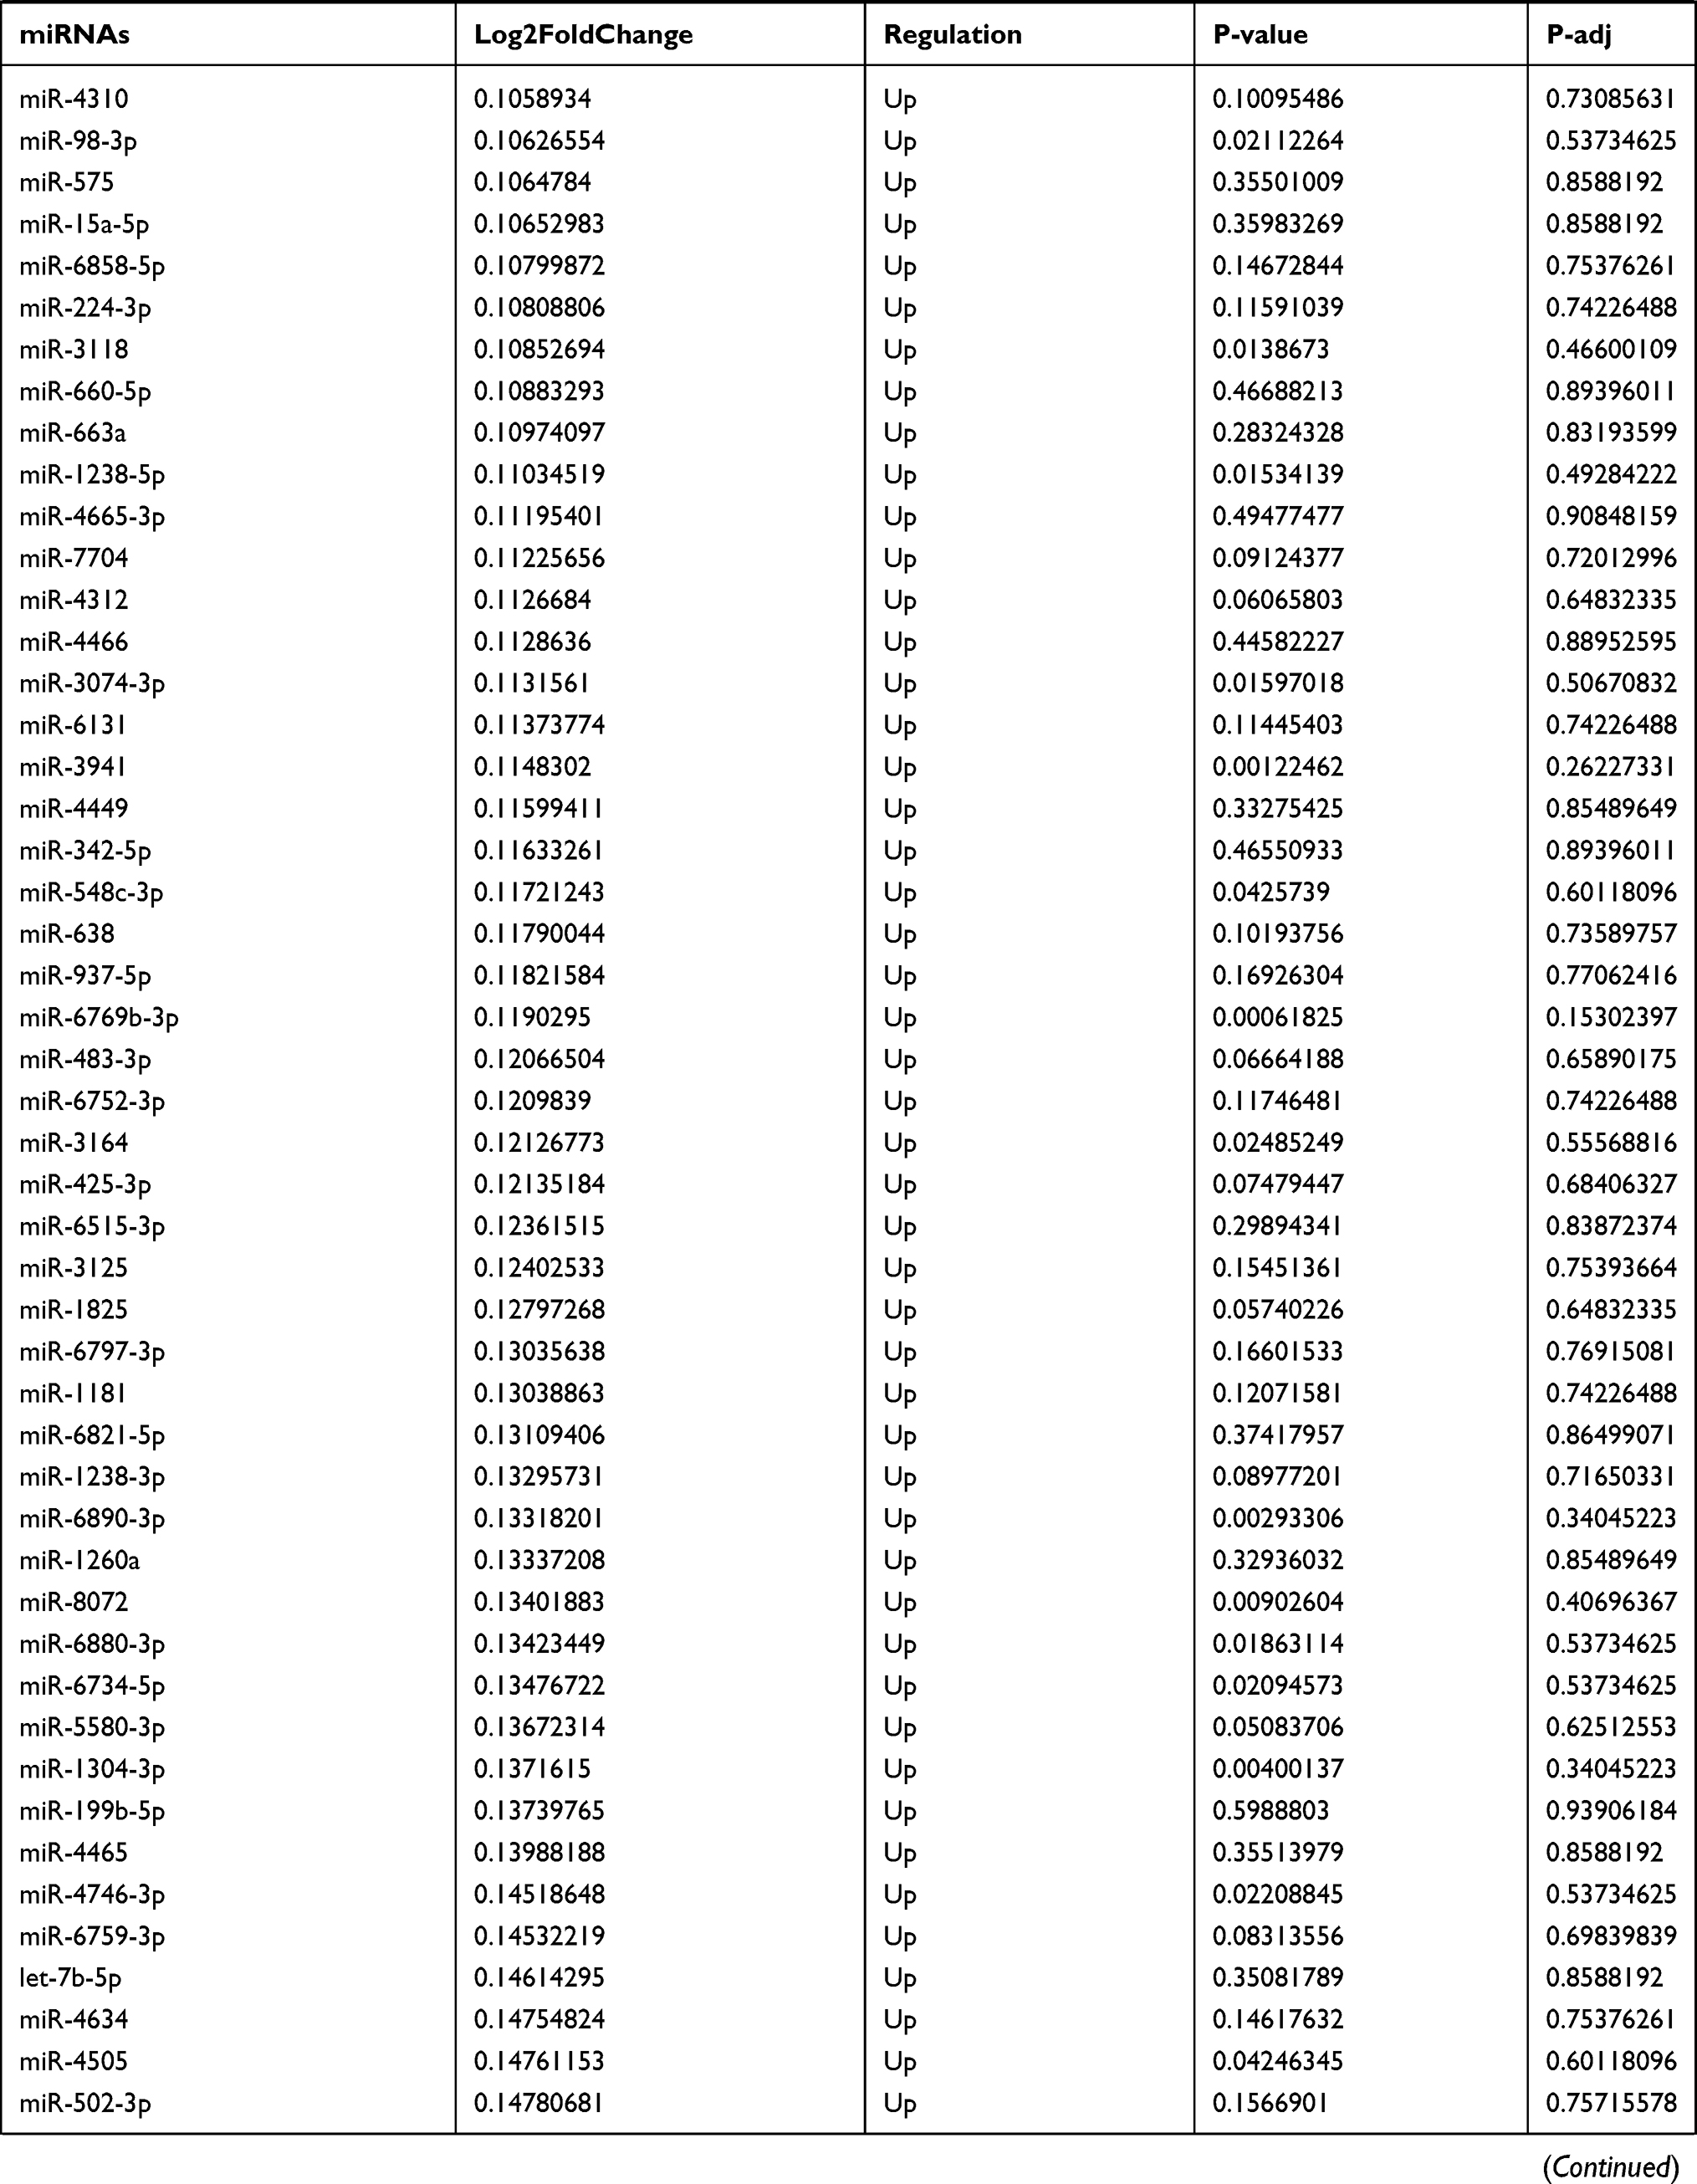 | 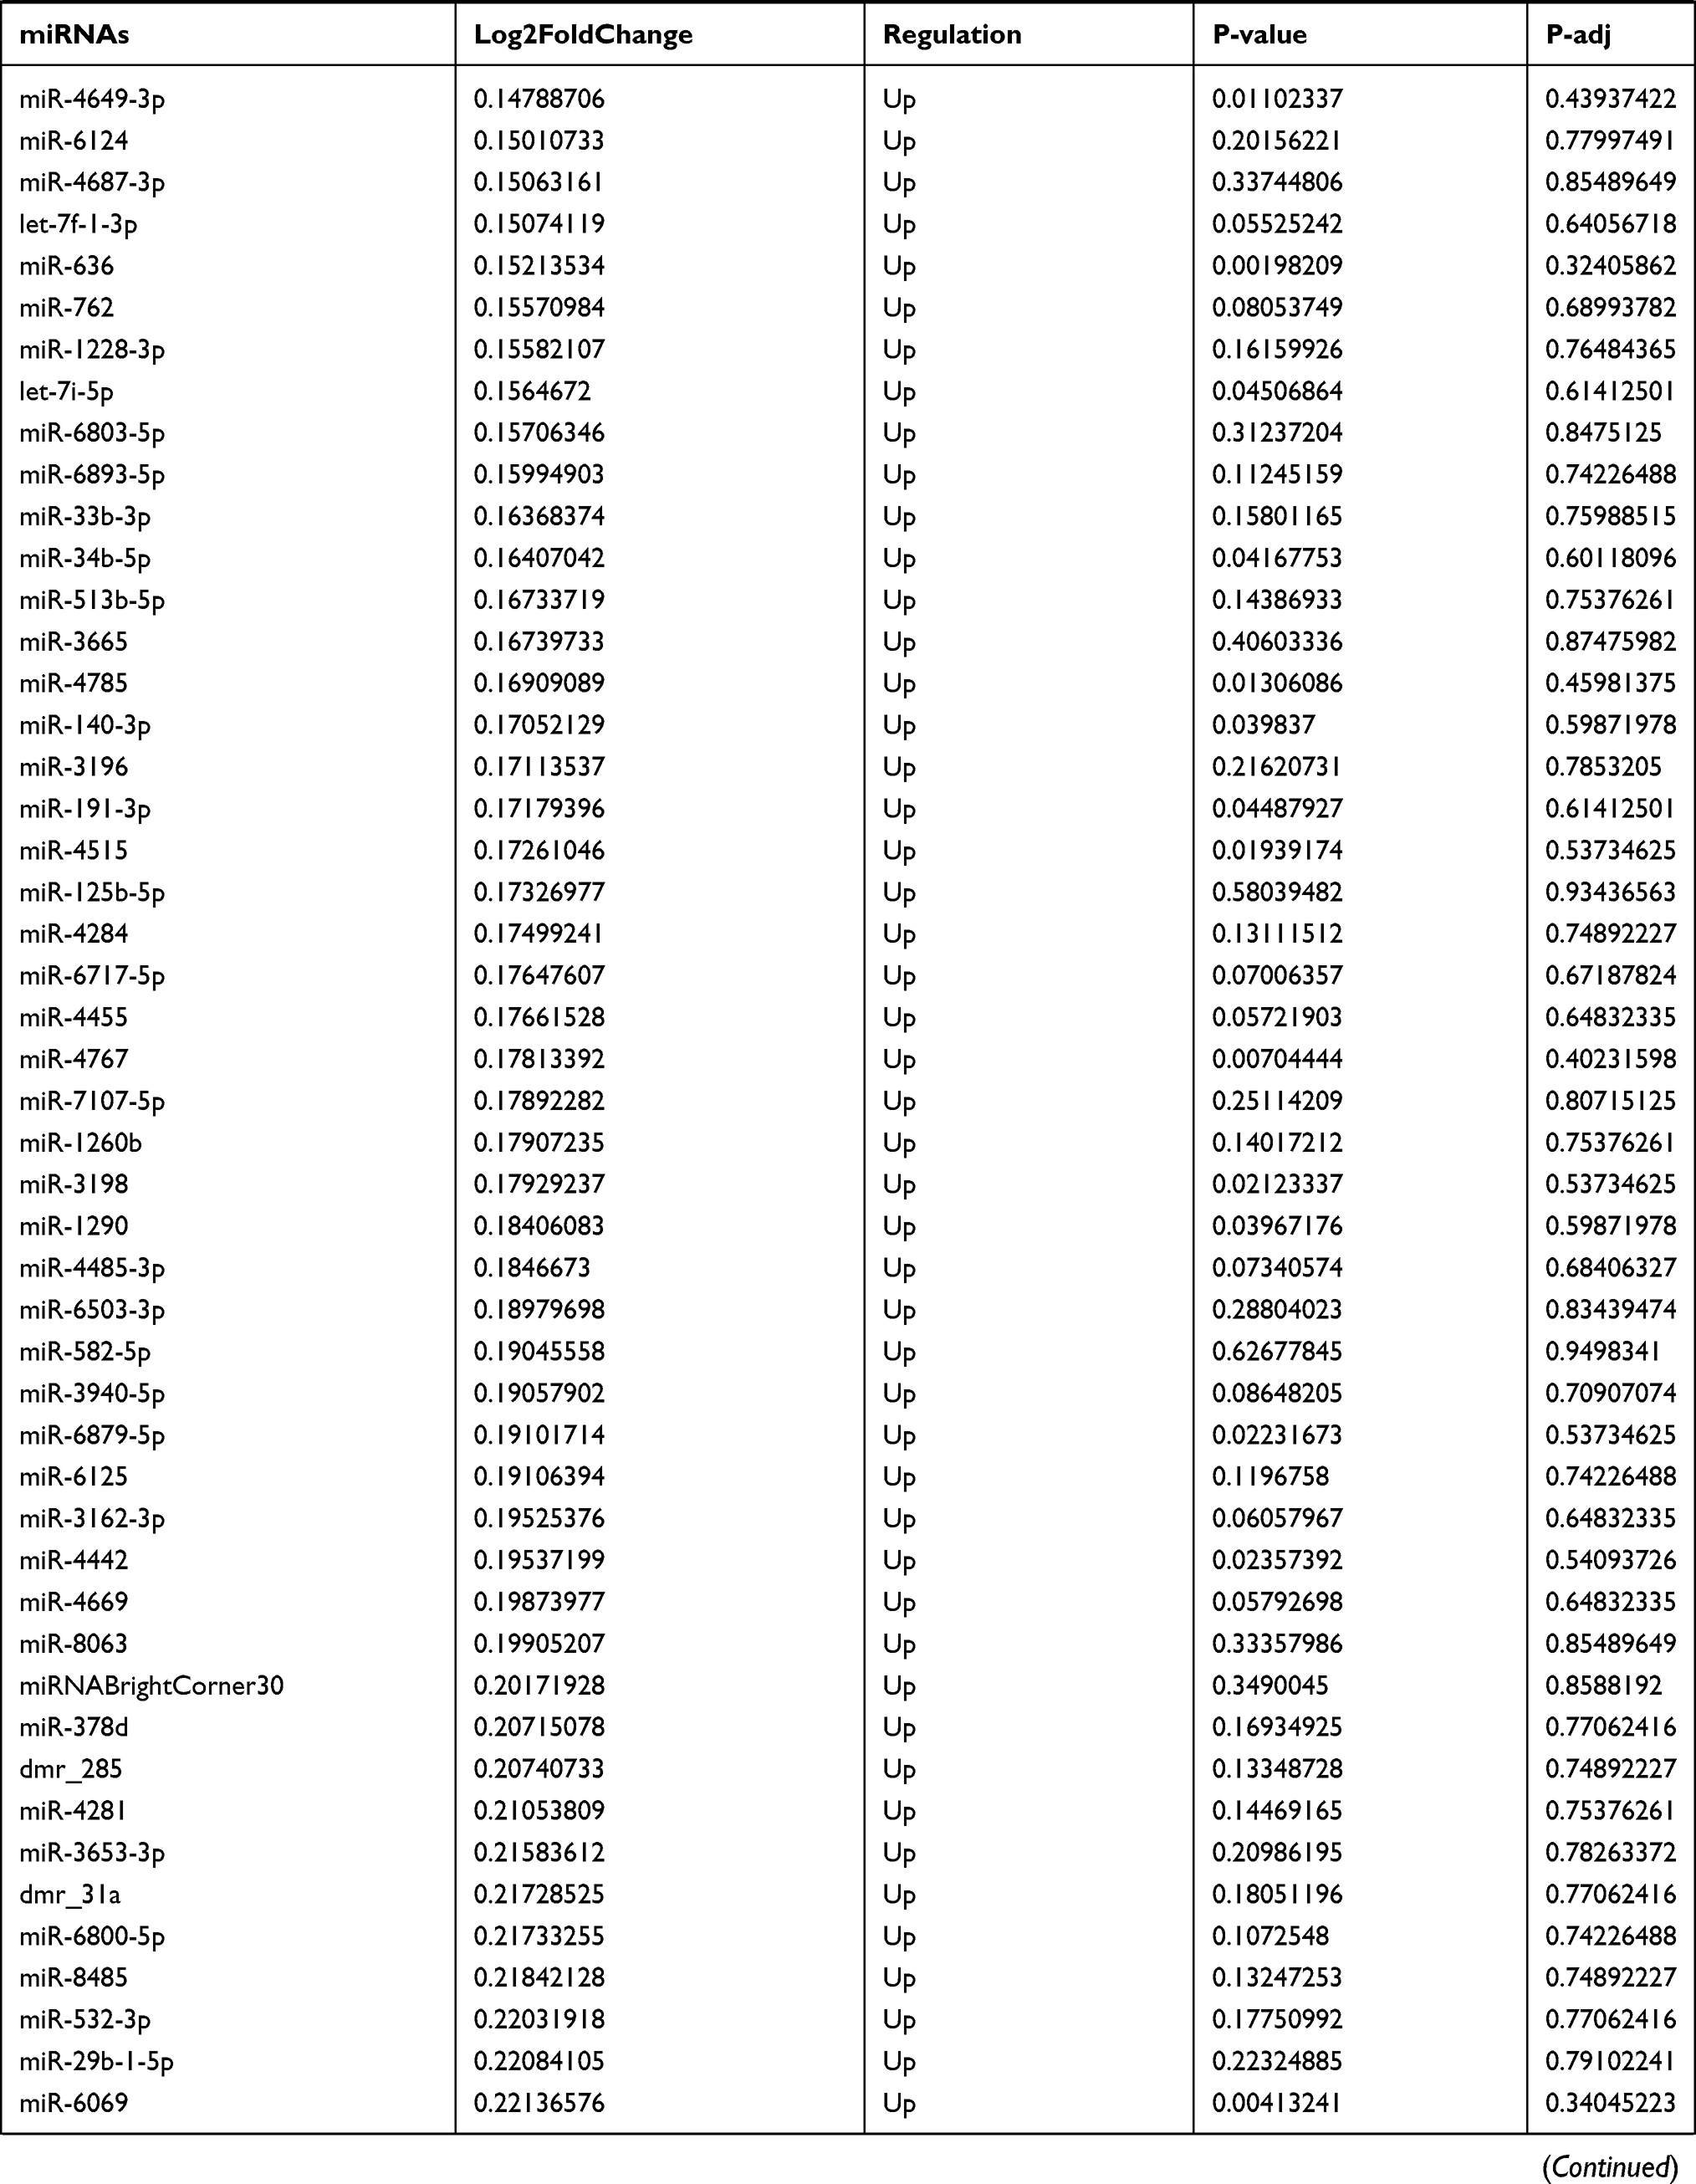 | 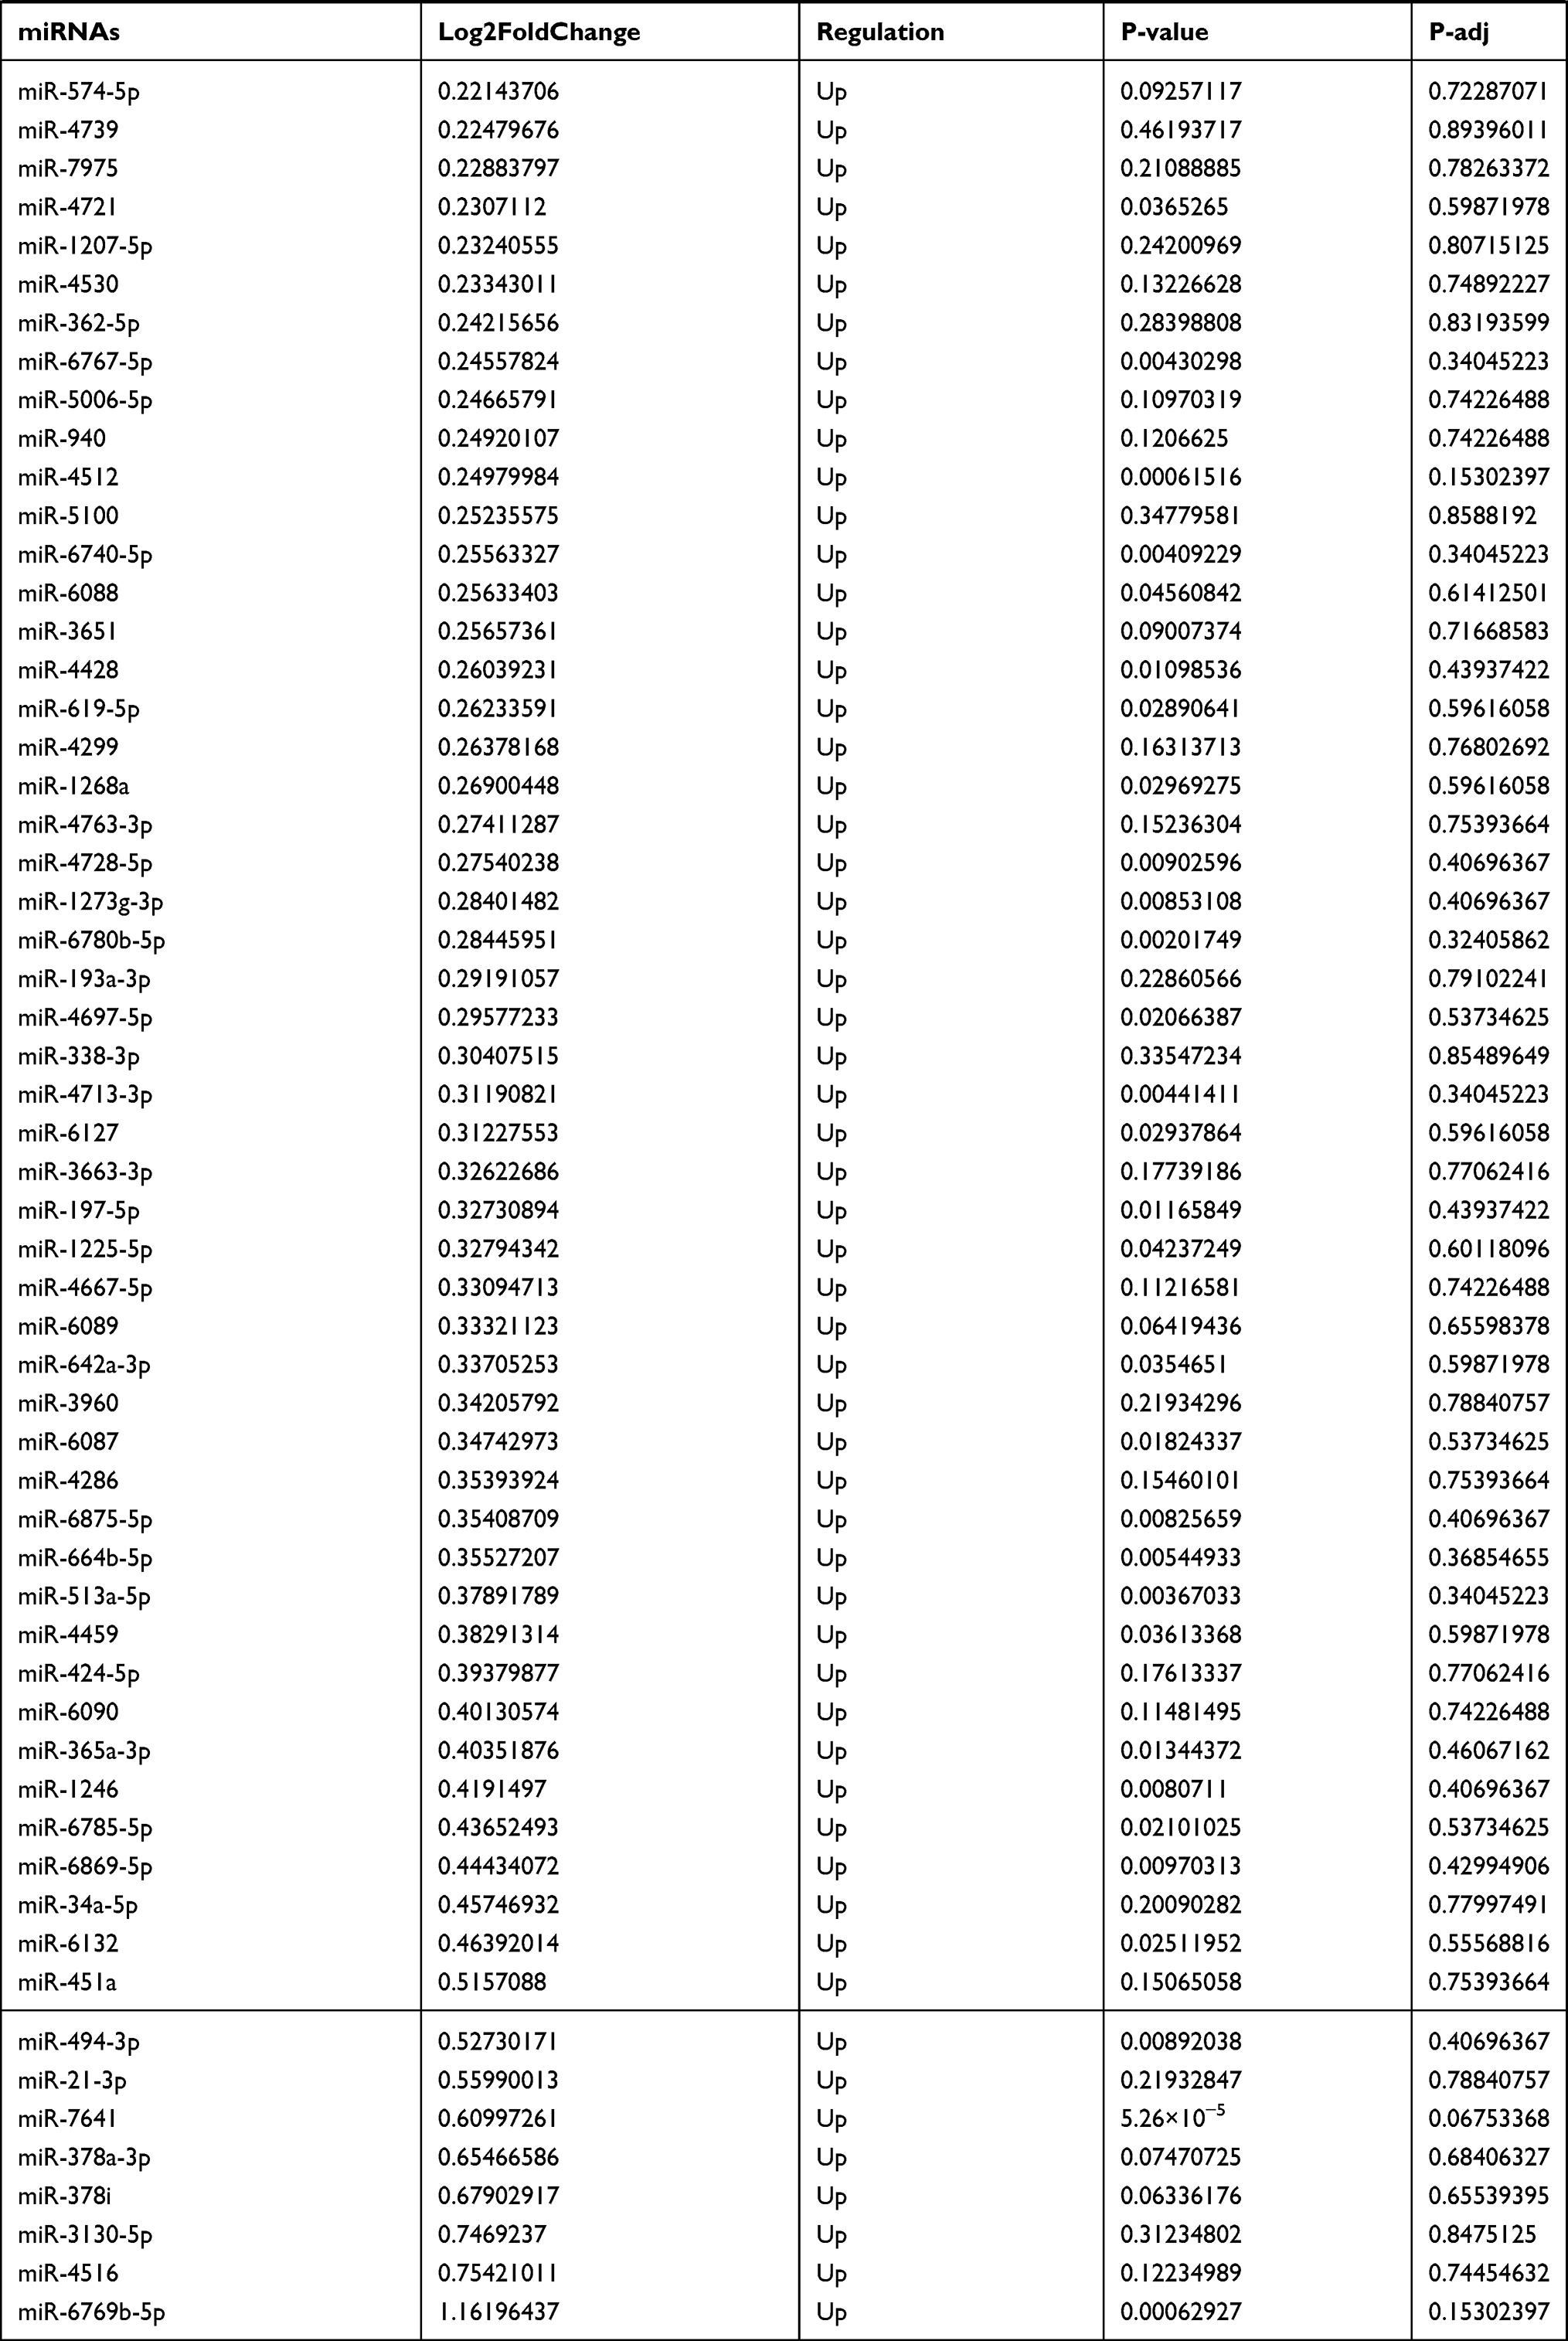 |
Table 9 The Fold Change of All miRNAs Between the Control Group and T1DM Group |
 |
Figure 5 The circRNA-lncRNA-mRNA network. The round nodes represent DEcircRNAs, the rhombic nodes represent DElncRNAs, the v-type nodes represent DEmRNAs. The up or down-regulated genes are represented in red and green, respectively. |
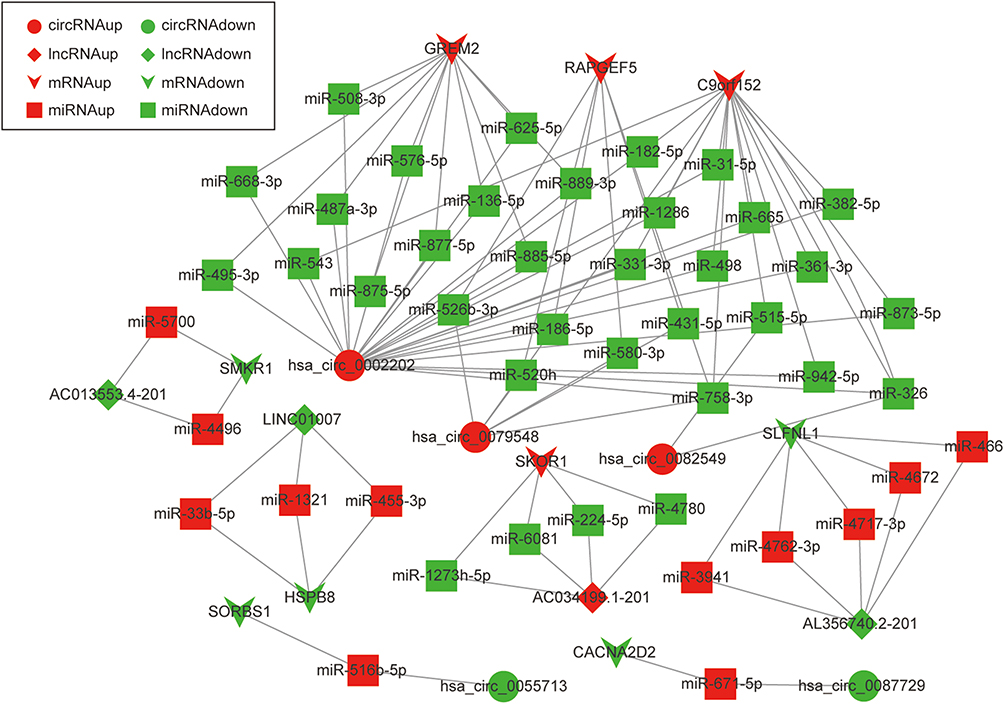 |
Figure 6 The circRNA-lncRNA-miRNA-mRNA network. The round nodes represent DEcircRNAs, the rhombic nodes represent DElncRNAs, the v-type nodes represent DEmRNAs, the square nodes represent DEmiRNAs. The up or down-regulated genes are represented in red and green, respectively. |
Hsa_circ_0002202 Inhibition Suppressed the IFN-I-Induced Inflammation
To confirm our above discovery and conceive future study designs, we chose hsa_circ_0002202 with more miRNA targets for in vitro experiments. We first used the geNorm and normFinder algorithms to select the reference gene for normalization. As shown in Supplementary Figure 1, β-actin was the most stable reference gene. Then, subcellular distribution analysis illustrated that hsa_circ_0002202 is mainly located in the cytoplasm in THP-1-derived macrophages, with the remaining proportion in the nucleus (Figure 7A). Transfection of si-circ significantly decreased hsa_circ_0002202 expression in THP-1-derived macrophages (Figure 7B). Afterward, qRT-PCR results showed that hsa_circ_0002202 knockdown significantly suppressed the expression of IFIT1, IFIH1, CXCL10, and iNOS under IFN-I stimulation, suggesting an inhibitory effect of hsa_circ_0002202 knockdown on IFN-I-induced inflammation (Figure 7C).
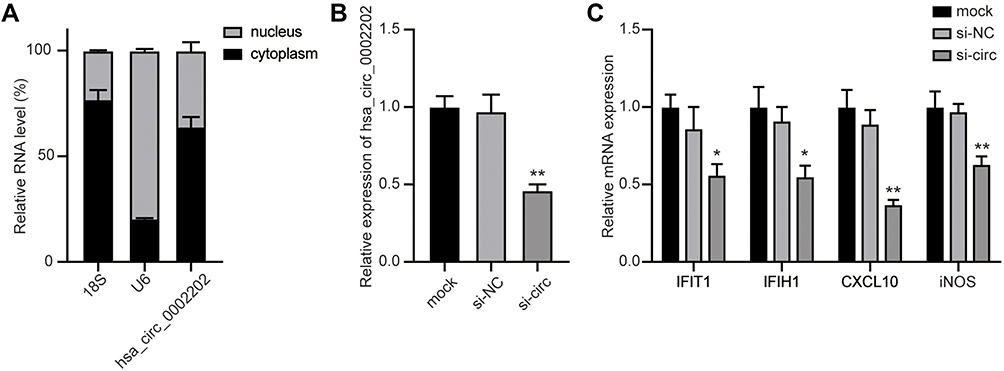 |
Figure 7 Inhibition of hsa_circ_0002202 suppressed IFN-I-induced inflammation. (A) Subcellular distribution of hsa_circ_0002202 in the nucleus and cytoplasm in THP-1-derived macrophages. (B) qRT-PCR detection of hsa_circ_0002202 expression after transfection with si-NC or si-circ. (C) qRT-PCR detection of IFIT1, IFIH1, CXCL10, and iNOS expression under IFN-I stimulation after treatment with hsa_circ_0002202 siRNA. Data are presented as the mean ± SD of three experiments and analyzed using one-way ANOVA with Tukey’s post-test. *P<0.05, **P<0.01, compared with the si-NC group. |
Discussion
Despite great efforts to find treatment strategies, T1DM is still a terrible threat to human health, and its prevalence is still rising worldwide. To better understand the exact mechanisms of T1DM and promote the discovery of new biomarkers, we analyzed the gene expression data from GEO public database. Furthermore, we established a circRNA-lncRNA-miRNA-mRNA ceRNA regulatory network in T1DM, which elucidated the underlying pathogenesis of T1DM.
The post-transcriptional regulation of gene expression mediated by the ceRNA regulatory network during the diseases process has attracted wide attention from researchers. In diabetes and diabetic complications, the ceRNA regulatory network in pathophysiological processes has been widely reported. For example, lncRNA MT1P3 promoted p2y12 expression by sponging miR-126 to promote platelet activation and aggregation in type 2 diabetes.45 lncRNA H2k2/miR-449a/b/Trim11 signaling pathway promotes mesangial cell proliferation in diabetic nephropathy.46 Hsa_circ_010567/miR-141/TGF-β1 axis promotes myocardial fibrosis in diabetic mice.47 The complex interaction network of multiple factors may be more theoretically meaningful for revealing the internal mechanism of T1DM. But few studies focused on the ceRNA regulatory networks in T1DM. Meanwhile, previous studies on T1DM ceRNA regulatory networks only discussed the role of either lncRNA48 or circRNA,33 and did not consider both of them simultaneously. Therefore, this study was systematic and comprehensive for revealing the T1DM mechanism.
In the current study, we identified 178 DEcircRNAs, 404 DElncRNAs, and 73 DEmRNAs from the GSE133225 database. Meanwhile, we analyzed the miRNA chip GSE133217 to construct the interaction network of circRNA, lncRNA, miRNA, and mRNA. This network suggested that circRNA and lncRNA play a central regulatory role in T1DM. One circRNA and lncRNA can be associated with multiple identical miRNAs to regulate more mRNAs synergistically. Among the circRNAs and lncRNAs, circRNA hsa_circ_0002202 and lncRNA AL356740.2–201 (ENST00000601559.1) linked most miRNAs. Here, we selected hsa_circ_0002202 for the in vitro experiment verification. Hsa_circ_0002202 is formed from SMAD4A. A previous study has reported the oncogene role of circSAMD4A in osteosarcoma.49 Liu et al found that circSAMD4A acts as an adipogenesis promoting factor.50 In this study, we found that hsa_circ_0002202 was up-regulated in T1DM PBMCs samples, suggesting that hsa_circ_0002202 may take part in the T1DM procession. As the circRNAs show their sponge function in the cytoplasm,26 we detected the cellular localization of hsa_circ_0002202 in THP-1-derived macrophages. The results showed that hsa_circ_0002202 was mainly localized in the cytoplasm of THP-1-derived macrophage. Furthermore, we found that knockdown of hsa_circ_0002202 suppressed the IFN-I-induced inflammation, which was in line with the previous study.51 These findings suggested that hsa_circ_0002202 play an important role in T1DM, which will be verified by tissue sample experiments, cell lines experiments, and even animal model construction in future studies.
The miRNAs in the T1DM-related ceRNA regulatory network are also important regulators in T1DM. In this study, we found that hsa_circ_0002207 could sponge miR-487a-3p, miR-576-5p, miR-326, miR-186-5p, and many other miRNAs. Among the miRNAs, miR-487a-3p is reported to be up-regulated in the PBMCs of T1DM patients.52 Increased expression of miR-326 was identified in PBMSCs53 and peripheral blood lymphocytes54 of patients with T1DM. Another study showed a decreased expression level of miR-326 in PBMCs of patients with T1DM.55 These same or opposite results may be related to the genetic or environmental factors of T1DM patients. Besides, some other miRNAs in the ceRNA network may be related to other autoimmune disorders, which have strong complications with T1DM. The pro-inflammatory cytokines promote the miR-455-3p expression and then cause the inflammatory β-cell failure.56 miR-31-5p, miR-665, miR-326, miR-224 are associated with inflammatory bowel disease.56–59 We will also conduct verification and analysis in future experimental studies to obtain more in-depth and comprehensive scientific conclusions.
In the present study, the biological function and potential pathways of the DEcircRNAs and DElncRNAs were also analyzed. The enriched GO terms were mainly related to extracellular matrix components (ECM) and macrophage activation. The ECM contributes to islet inflammation and creates a permissive environment for immune cells to infiltrate the pancreatic islets and impair β-cell survival.60 Macrophages participate in interacting, directing, or restricting trafficking of the autoreactive-specific T cells into the islets via the IFN-I signaling during the development of T1DM.61 Thus, our in vitro experiments focused on macrophage inflammation, and the results indicated the anti–inflammatory effect of hsa_circ_0002202 inhibition. In terms of the KEGG pathway, the protein digestion and absorption were enriched, indicating that the activation of these genes was closely related to the T1DM progression.
We also identified some genes associated with T1DM, including GREM2, RAPGEF5, C9orf152, SMKR1, SORBS1, HSPB8, CACNA2D2, SKOR1, and SLFNL1. Among these, SORBS1 and CACNA2D2 are previously reported to be related to diabetes. SORBS1, a human homologue for c-Cbl-associated protein (CAP), is an important adaptor protein in the insulin-signaling pathway, and its genetic polymorphism is related to insulin resistance.62 Meanwhile, another study showed that SORBS1 might be a new susceptibility gene for diabetic nephropathy.63 CACNA2D2 is the voltage-gated calcium channel auxiliary subunit alpha2delta2 gene that encodes a calcium channel protein,64 and Huang et al identified CACNA2D2 as a diabetes-related atherogenesis gene.65 Besides, GREM2 and HSPB8 are closely related to inflammatory response,66,67 suggesting a regulatory role in the T1DM macrophages inflammation. These genes with special functions may be the latest molecular markers of T1DM and need further experimental verification.
Despite the above results, there are still some limitations in the current study. First, the small sample size may affect the number of altered RNAs. Further studies based on a larger sample size should be performed to confirm our conclusions. Second, besides acting as miRNA sponges, circRNAs or lncRNAs can also regulate gene expression by affecting transcription.68,69 At the same time, most of the results are obtained using bioinformatics analysis. Thus, experimental studies are needed to validate our results and further investigate the deeper mechanism. Third, the progress of T1DM is not only related to M1 macrophage activation induced exacerbation of inflammatory responses but also related to the absolute insulin deficiency caused by pancreatic β-cells destruction. This study only studies the former, and the effect of these differentially expressed genes on the latter needs further studies.
Conclusions
In conclusion, we identified differentially expressed circRNAs, lncRNAs, and mRNAs in the PBMCs from T1DM patients and healthy patients and established a T1DM-related circRNA-lncRNA-miRNA-mRNA ceRNA regulatory network for the first time. The construction of the ceRNA network can help to further analyze the interaction between ncRNAs and mRNAs and provide new insights into the molecular mechanisms in T1DM. The new ceRNA network in this study will contribute to the diagnosis and treatment of T1DM. Of course, our research findings are only the first step. In the follow-up experimental verification study, we will rely on multiple levels, including clinical tissue samples, cell line studies, and animal models, to analyze the internal function mechanism.
Abbreviations
BP, biological processes; CAP, c-Cbl-associated protein; CC, cellular components; circRNA, circular RNA; ceRNA, competitive endogenous RNA; DEcircRNAs, differentially expressed circRNAs; DElncRNAs, differentially expressed lncRNAs; DEGs, differentially expressed genes; DEmRNAs, differentially expressed mRNAs; ECM, extracellular matrix components; GEO, Gene Expression Omnibus; GO, Gene Ontology; IFN-I, type I interferon; KEGG, Kyoto Encyclopedia of Genes and Genomes; lncRNA, long non-coding RNA; miRNA, microRNA; MRE, miRNA response element; MF, molecular functions; ncRNA, non-coding RNA; PBMCs, peripheral blood mononuclear cells; PMA, phorbol 12-myristate 13-acetate; qRT-PCR, Quantitative real-time PCR; T1DM, Type 1 diabetes mellitus.
Author Contributions
Both authors made a significant contribution to the work reported, whether that is in the conception, study design, execution, acquisition of data, analysis and interpretation, or in all these areas; took part in drafting, revising or critically reviewing the article; gave final approval of the version to be published; have agreed on the journal to which the article has been submitted; and agree to be accountable for all aspects of the work.
Funding
There is no funding to report.
Disclosure
The authors declare that they have no conflicts of interest for this work.
References
1. Pozzilli P, Maddaloni E, Buzzetti R. Combination immunotherapies for type 1 diabetes mellitus. Nat Rev Endocrinol. 2015;11(5):289–297. doi:10.1038/nrendo.2015.8
2. Ni Q, Pham NB, Meng WS, Zhu G, Chen X. Advances in immunotherapy of type I diabetes. Adv Drug Deliv Rev. 2019;139:83–91. doi:10.1016/j.addr.2018.12.003
3. Cerna M. Epigenetic Regulation in Etiology of Type 1 Diabetes Mellitus. Int J Mol Sci. 2019;21(1):254. doi:10.3390/ijms21010036
4. Gastol J, Kapusta P, Polus A, et al. Epigenetic mechanism in search for the pathomechanism of diabetic neuropathy development in diabetes mellitus type 1 (T1DM). Endocrine. 2020;68(1):235–240. doi:10.1007/s12020-019-02172-9
5. Ilonen J, Lempainen J, Veijola R. The heterogeneous pathogenesis of type 1 diabetes mellitus. Nat Rev Endocrinol. 2019;15(11):635–650. doi:10.1038/s41574-019-0254-y
6. Paschou SA, Papadopoulou-Marketou N, Chrousos GP, Kanaka-Gantenbein C. On type 1 diabetes mellitus pathogenesis. Endocr Connect. 2018;7(1):R38–R46. doi:10.1530/EC-17-0347
7. Diaz-Valencia PA, Bougneres P, Valleron AJ. Global epidemiology of type 1 diabetes in young adults and adults: a systematic review. BMC Public Health. 2015;15:255. doi:10.1186/s12889-015-1591-y
8. Thomas NJ, Jones SE, Weedon MN, Shields BM, Oram RA, Hattersley AT. Frequency and phenotype of type 1 diabetes in the first six decades of life: a cross-sectional, genetically stratified survival analysis from UK Biobank. Lancet Diabetes Endocrinol. 2018;6(2):122–129. doi:10.1016/S2213-8587(17)30362-5
9. Chiang JL, Kirkman MS, Laffel LM, Peters AL. Type 1 Diabetes Sourcebook A. Type 1 diabetes through the life span: a position statement of the American Diabetes Association. Diabetes Care. 2014;37(7):2034–2054. doi:10.2337/dc14-1140
10. Patterson CC, Karuranga S, Salpea P, et al. Worldwide estimates of incidence, prevalence and mortality of type 1 diabetes in children and adolescents: results from the International Diabetes Federation Diabetes Atlas, 9th edition. Diabetes Res Clin Pract. 2019;157:107842. doi:10.1016/j.diabres.2019.107842
11. Liu J, Ren ZH, Qiang H, et al. Trends in the incidence of diabetes mellitus: results from the Global Burden of Disease Study 2017 and implications for diabetes mellitus prevention. BMC Public Health. 2020;20(1):1415. doi:10.1186/s12889-020-09502-x
12. Tao B, Pietropaolo M, Atkinson M, Schatz D, Taylor D. Estimating the cost of type 1 diabetes in the U.S.: a propensity score matching method. PLoS One. 2010;5(7):e11501. doi:10.1371/journal.pone.0011501
13. Lapolla A, Amaro F, Bruttomesso D, et al. Diabetic ketoacidosis: a consensus statement of the Italian Association of Medical Diabetologists (AMD), Italian Society of Diabetology (SID), Italian Society of Endocrinology and Pediatric Diabetoloy (SIEDP). Nutr Metab Cardiovasc Dis. 2020;30(10):1633–1644. doi:10.1016/j.numecd.2020.06.006
14. Williams SM, Eleftheriadou A, Alam U, Cuthbertson DJ, Jph W. Cardiac Autonomic Neuropathy in Obesity, the Metabolic Syndrome and Prediabetes: a Narrative Review. Diabetes Ther. 2019;10(6):1995–2021. doi:10.1007/s13300-019-00693-0
15. Sousa GR, Pober D, Galderisi A, et al. Glycemic Control, Cardiac Autoimmunity, and Long-Term Risk of Cardiovascular Disease in Type 1 Diabetes Mellitus. Circulation. 2019;139(6):730–743. doi:10.1161/CIRCULATIONAHA.118.036068
16. Gillard P, Schnell O, Groop PH. The nephrological perspective on SGLT-2 inhibitors in type 1 diabetes. Diabetes Res Clin Pract. 2020;170:108462. doi:10.1016/j.diabres.2020.108462
17. Skyler JS, Bakris GL, Bonifacio E, et al. Differentiation of Diabetes by Pathophysiology, Natural History, and Prognosis. Diabetes. 2017;66(2):241–255. doi:10.2337/db16-0806
18. Crossen S, Xing G, Hoch JS. Changing costs of type 1 diabetes care among US children and adolescents. Pediatr Diabetes. 2020;21(4):644–648. doi:10.1111/pedi.12996
19. Zou Q, Qu K, Luo Y, Yin D, Ju Y, Tang H. Predicting Diabetes Mellitus With Machine Learning Techniques. Front Genet. 2018;9:515. doi:10.3389/fgene.2018.00515
20. Taheri M, Eghtedarian R, Dinger ME, Ghafouri-Fard S. Emerging roles of non-coding RNAs in the pathogenesis of type 1 diabetes mellitus. Biomed Pharmacother. 2020;129:110509. doi:10.1016/j.biopha.2020.110509
21. Geng G, Zhang Z, Cheng L. Identification of a Multi-Long Noncoding RNA Signature for the Diagnosis of Type 1 Diabetes Mellitus. Front Bioeng Biotechnol. 2020;8:553. doi:10.3389/fbioe.2020.00553
22. Li Y, Zhou Y, Zhao M, et al. Differential Profile of Plasma Circular RNAs in Type 1 Diabetes Mellitus. Diabetes Metab J. 2020;44(6):854–865. doi:10.4093/dmj.2019.0151
23. Gonzalez-Moro I, Olazagoitia-Garmendia A, Colli ML, et al. The T1D-associated lncRNA Lnc13 modulates human pancreatic beta cell inflammation by allele-specific stabilization of STAT1 mRNA. Proc Natl Acad Sci U S A. 2020;117(16):9022–9031. doi:10.1073/pnas.1914353117
24. Ding H, Wang F, Shi X, et al. LncRNA MALAT1 induces the dysfunction of beta cells via reducing the histone acetylation of the PDX-1 promoter in type 1 diabetes. Exp Mol Pathol. 2020;114:104432. doi:10.1016/j.yexmp.2020.104432
25. Zhang C, Han X, Yang L, et al. Circular RNA circPPM1F modulates M1 macrophage activation and pancreatic islet inflammation in type 1 diabetes mellitus. Theranostics. 2020;10(24):10908–10924. doi:10.7150/thno.48264
26. Hansen TB, Jensen TI, Clausen BH, et al. Natural RNA circles function as efficient microRNA sponges. Nature. 2013;495(7441):384–388. doi:10.1038/nature11993
27. Khorkova O, Hsiao J, Wahlestedt C. Basic biology and therapeutic implications of lncRNA. Adv Drug Deliv Rev. 2015;87:15–24. doi:10.1016/j.addr.2015.05.012
28. Salmena L, Poliseno L, Tay Y, Kats L, Pandolfi PP. A ceRNA hypothesis: the Rosetta Stone of a hidden RNA language? Cell. 2011;146(3):353–358. doi:10.1016/j.cell.2011.07.014
29. Yang F, Chen Y, Xue Z, et al. High-Throughput Sequencing and Exploration of the lncRNA-circRNA-miRNA-mRNA Network in Type 2 Diabetes Mellitus. Biomed Res Int. 2020;2020:8162524. doi:10.1155/2020/8162524
30. Hu W, Ding Y, Wang S, Xu L, Yu H. The Construction and Analysis of the Aberrant lncRNA-miRNA-mRNA Network in Adipose Tissue from Type 2 Diabetes Individuals with Obesity. J Diabetes Res. 2020;2020:3980742. doi:10.1155/2020/3980742
31. Lin Z, Li X, Zhan X, et al. Construction of competitive endogenous RNA network reveals regulatory role of long non-coding RNAs in type 2 diabetes mellitus. J Cell Mol Med. 2017;21(12):3204–3213. doi:10.1111/jcmm.13224
32. Kong X, Liu CX, Wang GD, et al. LncRNA LEGLTBC Functions as a ceRNA to Antagonize the Effects of miR-34a on the Downregulation of SIRT1 in Glucolipotoxicity-Induced INS-1 Beta Cell Oxidative Stress and Apoptosis. Oxid Med Cell Longev. 2019;2019:4010764. doi:10.1155/2019/4010764
33. Luo S, Deng M, Xie Z, Li X, Huang G, Zhou Z. Circulating circular RNAs profiles associated with type 1 diabetes. Diabetes Metab Res Rev. 2021;37(3):e3394. doi:10.1002/dmrr.3394
34. Shi Q, Yao H. Signature RNAS and related regulatory roles in type 1 diabetes mellitus based on competing endogenous RNA regulatory network analysis. BMC Med Genomics. 2021;14(1):133. doi:10.1186/s12920-021-00931-0
35. Edgar R, Domrachev M, Lash AE. Gene Expression Omnibus: NCBI gene expression and hybridization array data repository. Nucleic Acids Res. 2002;30(1):207–210. doi:10.1093/nar/30.1.207
36. Yang L, Han X, Zhang C, et al. Hsa_circ_0060450 Negatively Regulates Type I Interferon-Induced Inflammation by Serving as miR-199a-5p Sponge in Type 1 Diabetes Mellitus. Front Immunol. 2020;11:576903. doi:10.3389/fimmu.2020.576903
37. Gautier L, Cope L, Bolstad BM, Irizarry RA. affy–analysis of Affymetrix GeneChip data at the probe level. Bioinformatics. 2004;20(3):307–315. doi:10.1093/bioinformatics/btg405
38. Ritchie ME, Phipson B, Wu D, et al. limma powers differential expression analyses for RNA-sequencing and microarray studies. Nucleic Acids Res. 2015;43(7):e47. doi:10.1093/nar/gkv007
39. Yu G, Wang LG, Han Y, He QY. clusterProfiler: an R package for comparing biological themes among gene clusters. OMICS. 2012;16(5):284–287. doi:10.1089/omi.2011.0118
40. Ashburner M, Ball CA, Blake JA, et al. Gene ontology: tool for the unification of biology. The Gene Ontology Consortium. Nat Genet. 2000;25(1):25–29. doi:10.1038/75556
41. Kanehisa M, Goto S, Furumichi M, Tanabe M, Hirakawa M. KEGG for representation and analysis of molecular networks involving diseases and drugs. Nucleic Acids Res. 2010;38(Database issue):D355–360. doi:10.1093/nar/gkp896
42. Shannon P, Markiel A, Ozier O, et al. Cytoscape: a software environment for integrated models of biomolecular interaction networks. Genome Res. 2003;13(11):2498–2504. doi:10.1101/gr.1239303
43. Vandesompele J, De Preter K, Pattyn F, et al. Accurate normalization of real-time quantitative RT-PCR data by geometric averaging of multiple internal control genes. Genome Biol. 2002;3(7):RESEARCH0034. doi:10.1186/gb-2002-3-7-research0034
44. Andersen CL, Jensen JL, Orntoft TF. Normalization of real-time quantitative reverse transcription-PCR data: a model-based variance estimation approach to identify genes suited for normalization, applied to bladder and colon cancer data sets. Cancer Res. 2004;64(15):5245–5250. doi:10.1158/0008-5472.CAN-04-0496
45. Zhou M, Gao M, Luo Y, Gui R, Ji H. Long non-coding RNA metallothionein 1 pseudogene 3 promotes p2y12 expression by sponging miR-126 to activate platelet in diabetic animal model. Platelets. 2019;30(4):452–459. doi:10.1080/09537104.2018.1457781
46. Chen W, Peng R, Sun Y, et al. The topological key lncRNA H2k2 from the ceRNA network promotes mesangial cell proliferation in diabetic nephropathy via the miR-449a/b/Trim11/Mek signaling pathway. FASEB J. 2019;33(10):11492–11506. doi:10.1096/fj.201900522R
47. Zhou B, Yu JW. A novel identified circular RNA, circRNA_010567, promotes myocardial fibrosis via suppressing miR-141 by targeting TGF-beta1. Biochem Biophys Res Commun. 2017;487(4):769–775. doi:10.1016/j.bbrc.2017.04.044
48. Li C, Wei B, Zhao J. Competing endogenous RNA network analysis explores the key lncRNAs, miRNAs, and mRNAs in type 1 diabetes. BMC Med Genomics. 2021;14(1):35. doi:10.1186/s12920-021-00877-3
49. Xie C, Chen B, Wu B, Guo J, Shi Y, Cao Y. CircSAMD4A regulates cell progression and epithelialmesenchymal transition by sponging miR3423p via the regulation of FZD7 expression in osteosarcoma. Int J Mol Med. 2020;46(1):107–118. doi:10.3892/ijmm.2020.4585
50. Liu Y, Liu H, Li Y, et al. Circular RNA SAMD4A controls adipogenesis in obesity through the miR-138-5p/EZH2 axis. Theranostics. 2020;10(10):4705–4719. doi:10.7150/thno.42417
51. Hu X, Ma R, Cao J, Du X, Cai X, Fan Y. CircSAMD4A aggravates H/R-induced cardiomyocyte apoptosis and inflammatory response by sponging miR-138-5p. J Cell Mol Med. 2020. doi:10.1111/jcmm.16093
52. Zurawek M, Dzikiewicz-Krawczyk A, Izykowska K, et al. miR-487a-3p upregulated in type 1 diabetes targets CTLA4 and FOXO3. Diabetes Res Clin Pract. 2018;142:146–153. doi:10.1016/j.diabres.2018.05.044
53. Azhir Z, Dehghanian F, Hojati Z. Increased expression of microRNAs, miR-20a and miR-326 in PBMCs of patients with type 1 diabetes. Mol Biol Rep. 2018;45(6):1973–1980. doi:10.1007/s11033-018-4352-z
54. Sebastiani G, Grieco FA, Spagnuolo I, Galleri L, Cataldo D, Dotta F. Increased expression of microRNA miR-326 in type 1 diabetic patients with ongoing islet autoimmunity. Diabetes Metab Res Rev. 2011;27(8):862–866. doi:10.1002/dmrr.1262
55. Garcia-Diaz DF, Pizarro C, Camacho-Guillen P, Codner E, Soto N, Perez-Bravo F. Expression of miR-155, miR-146a, and miR-326 in T1D patients from Chile: relationship with autoimmunity and inflammatory markers. Arch Endocrinol Metab. 2018;62(1):34–40. doi:10.20945/2359-3997000000006
56. Wischer JL, Oermann MH, Zadvinskis IM, Kinney KC. Effects of iPad Video Education on Patient Knowledge, Satisfaction, and Cardiac Rehabilitation Attendance. Qual Manag Health Care. 2018;27(4):204–208. doi:10.1097/QMH.0000000000000185
57. Li M, Zhang S, Qiu Y, et al. Upregulation of miR-665 promotes apoptosis and colitis in inflammatory bowel disease by repressing the endoplasmic reticulum stress components XBP1 and ORMDL3. Cell Death Dis. 2017;8(3):e2699. doi:10.1038/cddis.2017.76
58. Wang G, Yuan J, Cai X, et al. HucMSC-exosomes carrying miR-326 inhibit neddylation to relieve inflammatory bowel disease in mice. Clin Transl Med. 2020;10(2):e113. doi:10.1002/ctm2.113
59. Olaru AV, Yamanaka S, Vazquez C, et al. MicroRNA-224 negatively regulates p21 expression during late neoplastic progression in inflammatory bowel disease. Inflamm Bowel Dis. 2013;19(3):471–480. doi:10.1097/MIB.0b013e31827e78eb
60. Bogdani M, Korpos E, Simeonovic CJ, Parish CR, Sorokin L, Wight TN. Extracellular matrix components in the pathogenesis of type 1 diabetes. Curr Diab Rep. 2014;14(12):552. doi:10.1007/s11892-014-0552-7
61. Marro BS, Legrain S, Ware BC, Oldstone MB. Macrophage IFN-I signaling promotes autoreactive T cell infiltration into islets in type 1 diabetes model. JCI Insight. 2019;4(2):24. doi:10.1172/jci.insight.125067
62. Chang TJ, Wang WC, Hsiung CA, et al. Genetic Variation in the Human SORBS1 Gene is Associated With Blood Pressure Regulation and Age at Onset of Hypertension: a SAPPHIRe Cohort Study. Medicine. 2016;95(10):e2970. doi:10.1097/MD.0000000000002970
63. Germain M, Pezzolesi MG, Sandholm N, et al. SORBS1 gene, a new candidate for diabetic nephropathy: results from a multi-stage genome-wide association study in patients with type 1 diabetes. Diabetologia. 2015;58(3):543–548. doi:10.1007/s00125-014-3459-6
64. Fu Y, Zhou N, Bai W, et al. Association of the CACNA2D2 gene with schizophrenia in Chinese Han population. PeerJ. 2020;8:e8521. doi:10.7717/peerj.8521
65. Huang Q, Deng G, Wei R, Wang Q, Zou D, Wei J. Comprehensive Identification of Key Genes Involved in Development of Diabetes Mellitus-Related Atherogenesis Using Weighted Gene Correlation Network Analysis. Front Cardiovasc Med. 2020;7:580573. doi:10.3389/fcvm.2020.580573
66. Sanders LN, Schoenhard JA, Saleh MA, et al. BMP Antagonist Gremlin 2 Limits Inflammation After Myocardial Infarction. Circ Res. 2016;119(3):434–449. doi:10.1161/CIRCRESAHA.116.308700
67. Bruinsma IB, de Jager M, Carrano A, et al. Small heat shock proteins induce a cerebral inflammatory reaction. J Neurosci. 2011;31(33):11992–12000. doi:10.1523/JNEUROSCI.0945-11.2011
68. Chen LL. The biogenesis and emerging roles of circular RNAs. Nat Rev Mol Cell Biol. 2016;17(4):205–211. doi:10.1038/nrm.2015.32
69. Engreitz JM, Haines JE, Perez EM, et al. Local regulation of gene expression by lncRNA promoters, transcription and splicing. Nature. 2016;539(7629):452–455. doi:10.1038/nature20149
 © 2021 The Author(s). This work is published and licensed by Dove Medical Press Limited. The
full terms of this license are available at https://www.dovepress.com/terms
and incorporate the Creative Commons Attribution
- Non Commercial (unported, 3.0) License.
By accessing the work you hereby accept the Terms. Non-commercial uses of the work are permitted
without any further permission from Dove Medical Press Limited, provided the work is properly
attributed. For permission for commercial use of this work, please see paragraphs 4.2 and 5 of our Terms.
© 2021 The Author(s). This work is published and licensed by Dove Medical Press Limited. The
full terms of this license are available at https://www.dovepress.com/terms
and incorporate the Creative Commons Attribution
- Non Commercial (unported, 3.0) License.
By accessing the work you hereby accept the Terms. Non-commercial uses of the work are permitted
without any further permission from Dove Medical Press Limited, provided the work is properly
attributed. For permission for commercial use of this work, please see paragraphs 4.2 and 5 of our Terms.