")
Back to Journals » International Journal of Nanomedicine » Volume 15
Ultrasound Mediated Destruction of LMW-HA-Loaded and Folate-Conjugated Nanobubble for TAM Targeting and Reeducation
Authors Sun X, Guo L, Shang M, Shi D, Liang P, Jing X, Meng D, Liu X, Zhou X , Zhao Y, Li J
Received 14 November 2019
Accepted for publication 24 February 2020
Published 23 March 2020 Volume 2020:15 Pages 1967—1981
DOI https://doi.org/10.2147/IJN.S238587
Checked for plagiarism Yes
Review by Single anonymous peer review
Peer reviewer comments 2
Editor who approved publication: Dr Mian Wang
Xiao Sun,1 Lu Guo,1 Mengmeng Shang,1 Dandan Shi,1 Ping Liang,2 Xuanxuan Jing,1 Dong Meng,1 Xinxin Liu,1 Xiaoying Zhou,1 Yading Zhao,1 Jie Li1
1Department of Ultrasound, Qilu Hospital of Shandong University, Jinan, People’s Republic of China; 2Department of Interventional Ultrasound, Chinese PLA General Hospital, Beijing, People’s Republic of China
Correspondence: Jie Li
Department of Ultrasound, Qilu Hospital of Shandong University, Wenhua Western Road, 107#, Jinan Tel/Fax +86-531-82166101
Email [email protected]
Purpose: To synthesize and evaluate a novel folate-conjugated ultrasonic nanobubble (HA-FOL-NB) loading low-molecular-weight hyaluronic acid (LMW-HA) for specific tumor-associated macrophages (TAMs) targeting and reeducation.
Methods: The characteristics, cytotoxicity, contrast-enhanced ultrasound imaging (CEUS), and targeting ability to TAMs of HA-FOL-NBs were investigated. The TAMs reprogramming function of HA-FOL-NBs combining ultrasound targeted nanobubble destruction was assessed as well.
Results: HA-FOL-NBs (about 342 nm) showed remarkable contrast enhancement images, and higher targeting ability due to the folate to folate receptor interactions. Combined with ultrasound targeted nanobubble destruction, HA-FOL-NBs could specifically deliver LMW-HA into TAMs, thus exhibited stronger reeducation effect compared with free LMW-HA.
Conclusion: These folate-conjugated and LMW-HA-loaded nanobubbles, with targeted CEUS imaging and TAMs reeducation, are expected to be a potential approach for tumor therapy based on TAMs, especially folate receptor-positive ones.
Keywords: ultrasound contrast agent, ultrasonic nanobubble, tumor-associated macrophage, tumor microenvironment, contrast-enhanced ultrasound imaging
Introduction
Tumor-associated macrophages (TAMs) were the major immune components in tumor microenvironment (TME), which play crucial roles in primary tumor genesis, dissemination, seeding and outgrowth at the secondary organ.1 Besides, TAMs density is correlated with tumor progression and prognosis. As for tumor therapy, TAMs responded to treatments distinctively depending on the context, tumor type, and therapeutic strategy. They can be either help or impair therapy success.2 Compared with tumor cells, TAMs are genetically stable, thus less susceptible to classical mechanisms of therapeutic resistance. Moreover, TAMs primarily localized in the peripheral tumor stroma and decreased in number towards the center.1 Based on the importance, TAMs have become an attractive therapeutic target during tumor treatment. Macrophages exhibit a continuum of functional activation states under pathologic conditions.3 The term M1 and M2 nowadays were used to describe these two extremes of the spectrum of macrophage activation and played opposing roles during immune and inflammatory responses. TAMs represent a unique type of M2-polarized macrophages, as they promote angiogenesis, tissue remodeling, and repair.3,4
Considering their physiology functions, strategies to manipulate and reeducate TAMs, rather than to simply target them for depletion were more compelling options. Several molecules, receptors over expressed in the surface of TAM have been identified for the targeting of TAMs, such as IL-4R,5 mannose receptor,6,7 and folate receptor β (FR).8,9 However, IL-4R also presents in other immune cells, T or B cells for example, and mannose receptor presents in subpopulations of endothelial cells.10 FR was more suitable for TAMs targeting.11,12 As its ligand, folic acid has the advantages of high affinity to FR, good stability both in vivo and during storage as vitamin, easy conjugation to diverse therapeutic agents, lack of immunogenicity and compatibility with organic solvents, acids and bases.13
Low-molecular-weight hyaluronic acid (LMW-HA) with therapeutic concentration was reported to be capable of promoting TAMs phenotype to switch from M2- to M1-like macrophages, no matter what activation status they were being in.14 HA is ubiquitous in tissues and fluids in vivo. HA possesses superior characteristics in water solubility, biocompatibility, biodegradation, non-toxicity, and non-immunogenicity.15,16
Several TAM-reprogramming studies using folate acid targeted or HA loaded have been reported, but there are no relative studies focusing on TAM-targeted ultrasonic nanobubble yet. As a drug delivery system (DDS), ultrasonic nanobubble has many benefits in tumor-targeted therapy, such as being ultrasound contrast agent (UCA) for real-time monitoring, releasing drug in specific time and position, as well as enhancing drug absorbance by ultrasound targeted nanobubble destruction (UTND).17,18 UTMD/UTND is the most obvious and efficient advantage of microbubble/nanobubble as a DDS. Microbubble/nanobubbles triggered by special acoustic pressure would vibrate and produce hydrodynamic behaviors, such as shock waves, jetting, shear stress, microstreaming. These behaviors would interact with cells and their environment to generate different cellular responses, Ca2+ increasing, phospholipid fusion, cytoskeleton changes, reactive oxygen species (ROS) releasing, and so on. All these responses assist in increasing cell membrane permeability, therefore improving drug delivery dramatically.19
In view of all that has been mentioned so far, this study was designed to synthesize folate conjugated and LMW-HA-loaded ultrasonic nanobubbles (HA-FOL-NBs) to actively target TAMs and to change their phenotypes from M2 to M1 employing UTND. The murine macrophage cell line RAW264.7 incubated with folate-deficient tumor supernates was used as a folate receptor overexpressed TAM model according to previous study.20,21 The characterization, CEUS imaging, targeting ability, and selectively reeducating effect of this novel ultrasonic nanobubble have been evaluated in the following experiments. We assumed that this newly designed HA-FOL-NBs combining with UTND could specifically target TAMs and enhance reprogramming effect on TAMs by LMW-HA.
Methods and Materials
Chemicals
The perfluoropropane (C3F8) was purchased from Research Institute of Physical and Chemical Engineering of Nuclear Industry (Tianjin, China). The lipid components including 1,2-distearoyl-sn-glycero-3-phosphoethanolamine (DSPE), dipalmitoyl-sn-glycero-3-phosphocholine (DPPC) were purchased from Sigma-Aldrich (MO, USA). The 1,2-distearoyl-sn-glycero-3-phosphoethanolamine-N-[folate(polyethylene glycol)-2000] (ammonium salt) (DSPE-PEG2000-FOL) was from Avanti polar lipids (USA). 1,2-Distearoyl-sn-glycero-3-phosphoethanolamine-N-[FITC (polyethylene glycol)] (DSPE-PEG-FITC) was constructed by ruixi company (Xi’an, China). Propanediol and glycerol were purchased from Sinopharm Chemical Reagent Co., Ltd. (Shanghai, China). Folic acid was purchased from Solarbio Sciences and Technology (Beijing, China). Low-molecular-weight hyaluronic acid (LMW-HA, 3-10 kDa) was fabricated by Bloomage Biotechnology Corporation Limited (Shandong, China).
Cell Lines and Cell Culture
The mouse macrophage cell line RAW264.7 (M0) and Lewis lung carcinoma (LLC) cell line (Qilu College of Medicine, Shandong University, China) were grown in RPMI-1640 with 10% fetal bovine serum (Gibco BRL Life Technologies, Paisley, UK) at 37°C, under 5% CO2 atmosphere.
RAW264.7 cells were cultured in folate-deficient RPMI 1640 (FDRPMI) medium containing 10% fetal bovine serum (FBS) to induce folate receptor (FR) up-regulation.20 The expression fold changes of Folr were identified by qPCR. The use of all cell lines was approved by the Research Ethics Committee of Qilu Hospital of Shandong University.
TAMs were prepared by culturing RAW264.7 cells (M0) in the conditioned medium (CM) according to previous study.21 The CM was the supernatants of LLCs which were harvested and filtered through a 0.22 μm membrane filter (Millipore, NY, USA). To verify the activation of M0 macrophages to TAMs, optical microscopy was used to describe morphological changes, and qPCR was applied to determine the up-regulated expressions of Mrc1, Il0, Nos2, and Tnf. Different concentrations (0, 50%, 100%) of CM were used to culture M0 cells at different time points (0, 24, 48, 72 hrs) to optimize macrophage activation.
Preparation of Nanobubbles
Folate-conjugated nanobubbles (FOL-NBs) were synthesized as previously described.17 The FOL-NBs were prepared through the methods of mechanical oscillation and low-speed centrifugation. Briefly, DSPE-PEG2000-FOL, DPPC, propanediol and glycerol were mixed in an EP tube and dissolved in water bath at 65°C. Then, C3F8 gas was added to replace the air in the EP tube, and then the mixture was oscillated for 90 s in a mechanical oscillator (Ag and Hg mixer, Xi’an, China). Lower suspension was collected and diluted with PBS. After centrifugation at 300 rpm for 5 mins, the upper suspension was collected. The non-targeted nanobubbles (NB) were synthesized with the same procedure using DSPE. DSPE-PEG-FITC was added into mixture to get FITC-FOL-NBs/FITC-NBs. LMW-HA was added into mixture to generate LMW-HA-loaded and folate-conjugated/non-targeted nanobubbles (HA-FOL-NB/HA-NB).
Characterization of Nanobubbles
The particle size, polydispersity index and ζ potential of nanobubbles were analyzed with Delsa Nano C Particle Size and ζ Potential Analyzer (Beckman Coulter, CA, USA). The stability of HA-FOL-NBs in RPMI 1640 with 10% FBS was assessed by measuring size and polydispersity index (PDI) in different time points (2, 4, 6, 8, 10 hrs). The morphology of the nanobubbles was observed under light microscope or fluorescence microscope (OLYMPUS BX41, Olympus Corporation, Tokyo, Japan).
Calculation of Entrapment Efficiency and Loading Efficiency
A standard curve of LMW-HA concentration was prepared at concentrations of 0, 31.25, 62.5, 125, 250, 500 and 1000 μg/mL and measured at 200 nm wavelength using NanoDrop One Microvolume UV–Vis Spectrophotometer (Thermo Fisher Scientific, MA, USA). Subsequently, the entrapment efficiency (EE) and loading efficiency (LE) of HA-FOL-NBs were calculated as follows: EE = (A-B)/A × 100%, LE = (A-B)/(A+C) × 100%, where A is the initial amount of LMW-HA in the solution, B is the amount of free LMW-HA in HA-FOL-NBs suspension and C is the total amount of lipids.
Cytotoxicity Assay
The cytotoxicity of nanobubbles and LMW-HA was measured by a cell counting kit-8 (CCK-8) assay. RAW264.7 cells were seeded in 96-well plates at a density of 1 × 10⁴ cells/well for overnight attachment. To assess the cytotoxicity to TAMs of NBs, FOL-NBs, and LMW-HA, conditioned medium from LLC cells with phospholipids (DSPE/FOL-DSPE+DPPC, 0-40-80-120-160-200-300μg/mL) and LMW-HA solution (10, 50, 100, 200, 500, 1000μg/mL) were added separately. After 48 hrs, the cells were washed with PBS and incubated in 100 μL RPMI-1640 containing 10 μL CCK-8 solution for 1.5 hrs. The absorbance of each well was measured using a microplate reader (UV-2450) at the 450 nm wavelength.
In vitro Ultrasound Imaging
Ultrasound imaging of HA-FOL-NBs was performed in vitro with a clinical ultrasound scanner (LOGIQ E9; GE, USA). A 9L probe was used to obtain ultrasonic contrast images. HA-FOL-NB suspended in degassed deionized (DDI) water at proper concentration was added into one finger which was cut off from a plastic glove and clipped to keep tension. Then, the finger was fixed on the iron platform in water at 37°C. The enhanced ultrasound contrast parameters were as follows: mechanical index of 0.16; center frequency of 9.0 MHz; dynamic range of 60 dB. The ultrasound contrast-enhancement imaging with HA-FOL-NBs lasted 30 mins and the contrast-enhanced videos were recorded at different time points (0, 1, 2, 5, 10, 20, 30 mins). At the thirtieth minute, HA-FOL-NBs were destructed by ultrasound irradiation using “flash” button on the ultrasound scanner.
At each time points, a 10-s video was recorded and analyzed by the “TIC analysis” function in the ultrasound scanner. The contrast-enhancement ability was represented by absolute values of the relative intensity, which was calculated by the acoustic intensity of the region of interest (ROI) minus that of the background in one same image.
TAMs Targeting Ability of FOL-NBs
TAMs were seeded in 6-well plates (1×10⁶ cells/well) overnight for attachment. FITC-FOL-NBs/FITC-NBs suspended in FDRPMI were added in to replace medium, with/without free folic acid solution. After incubation for 20 mins, the cells were gently washed with fresh PBS for three times to remove free uncombined nanobubbles. Fluorescent imaging was acquired with a fluorescence microscope (OLYMPUS BX41, Tokyo, Japan). The intracellular fluorescence intensity of FITC was measured by flow cytometry (FCM) at an excitation wavelength of 488nm and at emission wavelength of 525 nm. All experiments were conducted in triplicate.
Ultrasound Targeted HA-FOL-NBs Destruction (UTND) promotes TAMs Reeducation
TAMs were seeded in 6-well plates and cultured overnight at 37°C in a humidified 5% CO2 incubator. In order to verify whether UTND could promote TAMs reeducation or not, and to assess the roles of ultrasound (US), nanobubbles, and LMW-HA in UTND, all samples were randomly divided into different groups: TAMs with no treatment (Control), TAMs incubated only with LMW-HA (HA), TAMs incubated with HA-FOL-NBs alone (HA-FOL-NB), TAMs incubated with LMW-HA and ultrasound irradiation (US+HA), TAMs firstly incubated with NBs/HA-NBs/FOL-NBs/HA-FOL-NBs and then undergone ultrasound irradiation (US+NB, US+HA-NB, US+FOL-NB, US+HA-FOL-NB). For all groups, incubation time was 30 mins and ultrasound irradiation (WED-100 ultrasonic therapy equipment, Honda Hi-Tech, Shenzhen, China) was applied at 1 MHz, 1 W/cm2 for 30 s. The nanobubbles concentration of all groups except the control, HA and US+HA group was set at 20%.22 Dosage of LMW-HA in HA group and US+HA group was the same, 1μM according to previous study.14 All experiments were performed in triplicate.
Quantitative Polymerase Chain Reaction (qPCR)
At 24 hrs post-treatment, total RNA was isolated from cells using RNAfast200 kit (Fastagen, Shanghai, China) according to the manufacturer’s instructions. Reverse transcription was carried out using a SureScript™ First-Strand cDNA Synthesis kit (GeneCopoeia, Rockville, MD, USA). The qRT-PCR was performed using an All-in-OneTM qPCR Mix (GeneCopoeia, Rockville, USA). A melting curve analysis was performed after each run to confirm product specificity. Transcripts of Gapdh were quantified and used as endogenous control. Relative quantities were estimated by the delta-delta-Ct method. The expression of each gene was normalized to untreated cells as control. The primers were synthesized by Sangon Biotech Co., Ltd. (Shanghai, China) in Table 1.
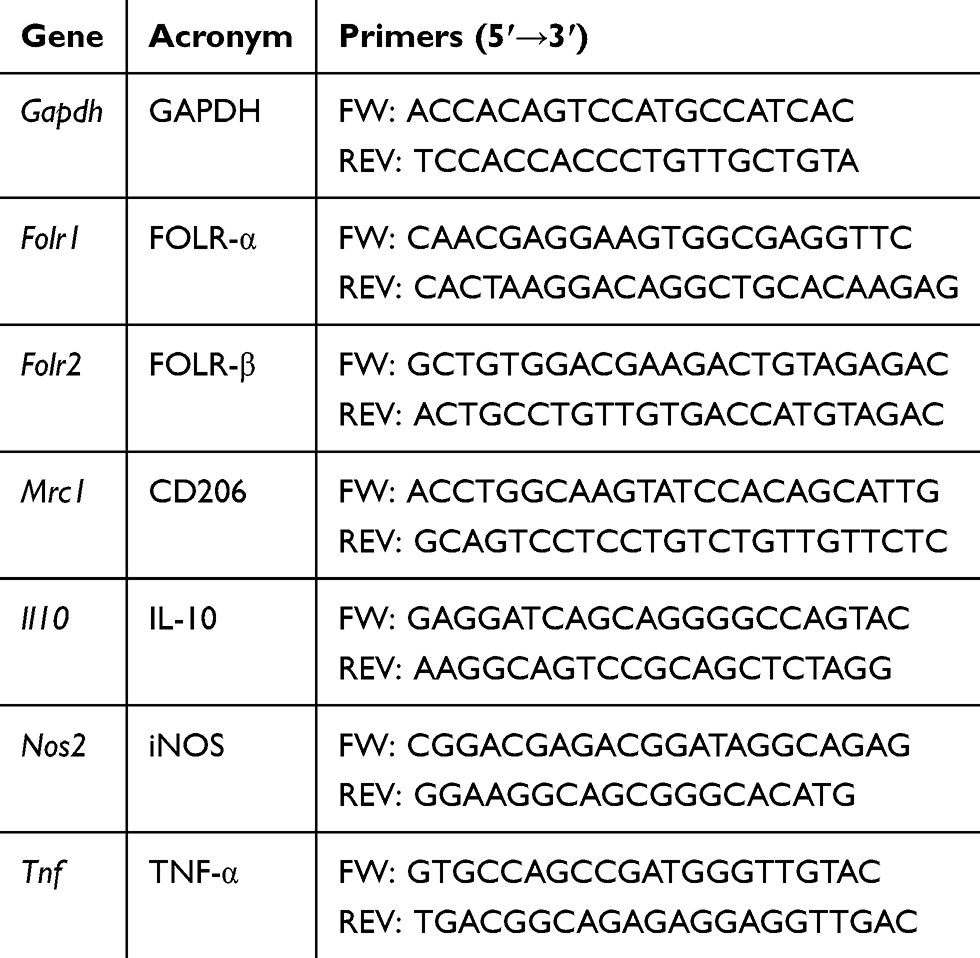 |
Table 1 Primers Used for Real-Time Quantitative PCR |
Flow Cytometry
At 48 hrs post-treatment, cells were scratched from 6-well plates, centrifuged and resuspended. Non-specific labeling was blocked with anti-CD16/32 (Fc Block) (BioLegend, San Diego, CA, USA) before specific labeling. For analysis of CD206 expression, cells were fixed, permeabilized, and incubated with PE anti-mouse CD206 (MMR) (BioLegend, San Diego, CA, USA) following the manufacturer’s protocol. In all cases, appropriate antibody iso-type controls were used. Flow cytometry was performed on a BD FACS Caliber flow cytometer (BD Biosciences, San Jose, CA, USA). FlowJo software was used for acquiring and analyzing the data. Experiments from each group were repeated at least 3 times, and representative data from each group are shown.
Measurement of Cytokine Concentrations
At 48 hrs post-treatment, TNF-a and IL-10 in the supernatants were determined by ELISA kit (R&D Systems, Minneapolis, MN, USA) according to the manufacturer’s instructions. Optical density was measured at 450 nm, and the concentration of cytokines was calculated from a standard curve prepared with the recombinant protein.
Statistical Analysis
Data are reported as mean (SD). The one-way analysis of variance (ANOVA) test was used to evaluate the significance of the difference among groups. Student’s t test was used between two groups. For all statistical tests, the level of significance was set at P = 0.05.
Results
Characterization of Nanobubbles
Under light microscope, HA-FOL-NBs displayed as a circle with a well-defined core-shell structure (Figure 1A). Perfluoropropan (C3F8) was used as the core of nanobubbles, while lipids including DPPC, DSPE-PEG, and the targeting material DSPE-PEG2000-FOL constructed nanobubbles shells. The shell-core structure was confirmed by the fluorescence of FITC-FOL-NBs (Figure 1B). Illustrated in Figure 1C and D, the precise mean diameter of HA-FOL-NB was about 342 nm (PDI: 0.155), and the ζ potential was −10.05 mV. The entrapment efficiency (EE) and loading efficiency (LE) were 81.3% and 13.9% separately.
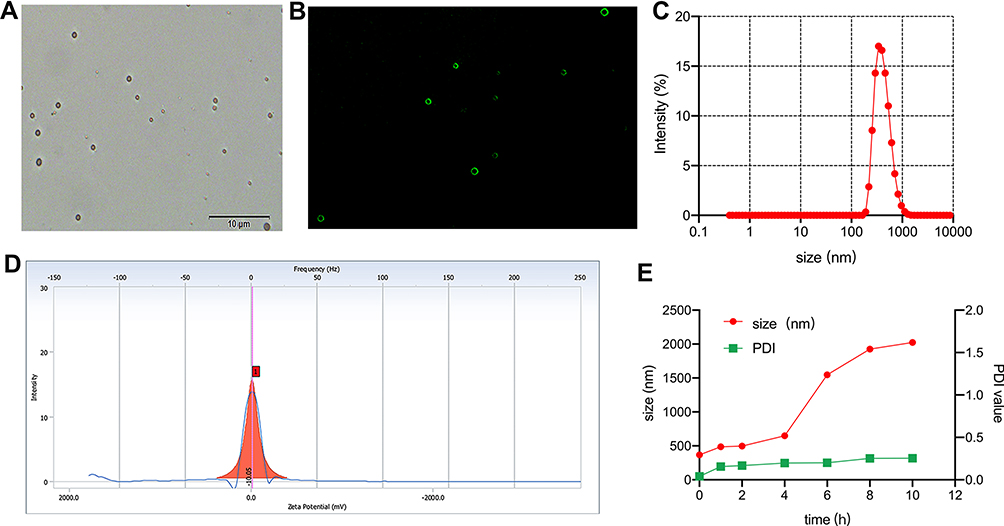 |
Figure 1 Characteristics of nanobubbles. Morphology of HA-FOL-NB by inverted light microscope (A). Morphology of FITC-labeled HA-FOL-NB by inverted fluorescence microscope (B). Size distribution of HA-FOL-NB (C). ζ potential of HA-FOL-NB (D). Stability of HA-FOL-NB (E). |
The stability of HA-FOL-NBs in RPMI 1640 with 10% FBS was assessed by measuring size and PDI at different time points (2, 4, 6, 8, 10 hrs). As shown in Figure 1E, HA-FOL-NBs showed good stability in vitro. The size of HA-FOL-NBs was nanoscale within 4 hrs and was smaller than 500nm in the first 2 hrs. The PDIs were within 0.4, indicating that the size of individual HA-FOL-NB was mostly homogeneous. Based on the stability test, all nanobubbles used during experiments were stored at 4°C within 2 hrs.
Cytotoxicity Assays of Nanobubbles
All materials used in nanobubbles in this study are known to be low cytotoxicity, with phospholipids commonly used in preparation of liposomes or other nanoparticles and HA applied in therapeutic pharmaceutical formulations. Still we performed the cytotoxicity assays to confirm the biological safety of lipids and HA involved in our study. Phospholipids (DSPE/FOL-DSPE+DPPC) dissolved in propanediol and glycerol at series concentrations (0–300μg/mL) were incubated with TAMs for 48 hrs using CCK-8 kit. The reason why incubation time was set at 48 hrs was that ELISA would be performed in 48 hrs post-treatment. The obvious cytotoxicity appeared when the lipid concentration was up to 200μg/mL in our study (p<0.01, compared with other concentrations, Figure 2A). Our phospholipid concentration for the preparation of nanobubbles was around 50μg/mL, at which the cell survival rate was beyond 90%. Besides, LMW-HA concentrations were also harmless for TAMs with survival rates all beyond 80% (Figure 2B). Based on the above cytotoxicity results, nanobubbles prepared in this study were reliable for the following treatments for cells.
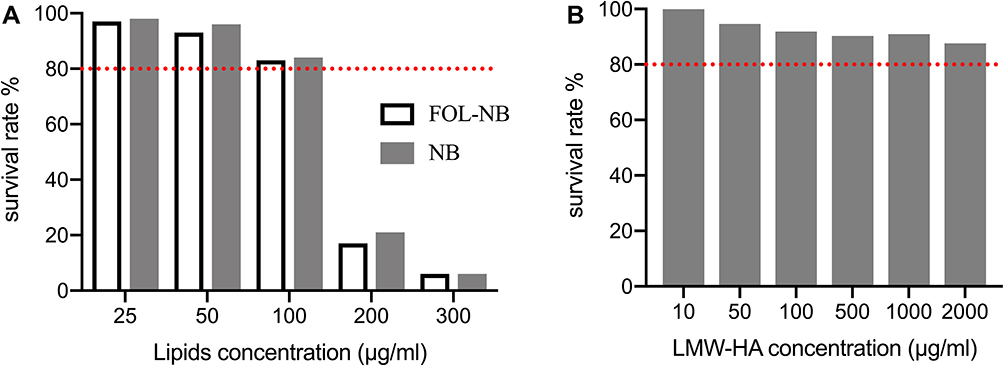 |
Figure 2 In vitro cytotoxicity of phospholipid (A) and LMW-HA (B) using CCK-8 assay. Obvious cytotoxicity of phospholipid appeared when the concentration up to 100 μg/mL (p < 0.05). All LMW-HA concentrations were harmless for RAW264.7 cells with survival rates all beyond 80% (red line). |
In vitro Contrast-Enhanced Ultrasound Imaging
The CEUS imaging ability was one critical function of HA-FOL-NBs, with which physicians would visualize whether HA-FOL-NBs arrived at the tumors or not. To be a potential clinically applied drug delivery system, another essential ability of HA-FOL-NBs was that they would be destructed by ultrasound irradiation in order to release the LMW-HA loaded in specific position. These functions were evaluated by a clinical ultrasound imaging system (GE LOGEQ E9, USA) in vitro in this study.
Figure 3A displays the enhancement intensity changes in different time points while Figure 3B showed the relative intensity changes with time within 20 mins. The HA-FOL-NBs showed excellent ultrasonic contrast-enhanced images with DDI water as the negative control. After 10 mins of CEUS, the enhanced images were a little dimmer compared with before (p<0.0001, Figure 3A and C). At the thirtieth minutes, after pressing the “flash” button on the scanner, the enhanced image became extremely brighter for seconds, and turned to almost dark afterwards, the relative intensity of “after flash” was significantly lower than both the “flashed” ones and the initial CEUS images (p<0.0001, Figure 3C), indicating that most HA-FOL-NBs were destructed by ultrasound.
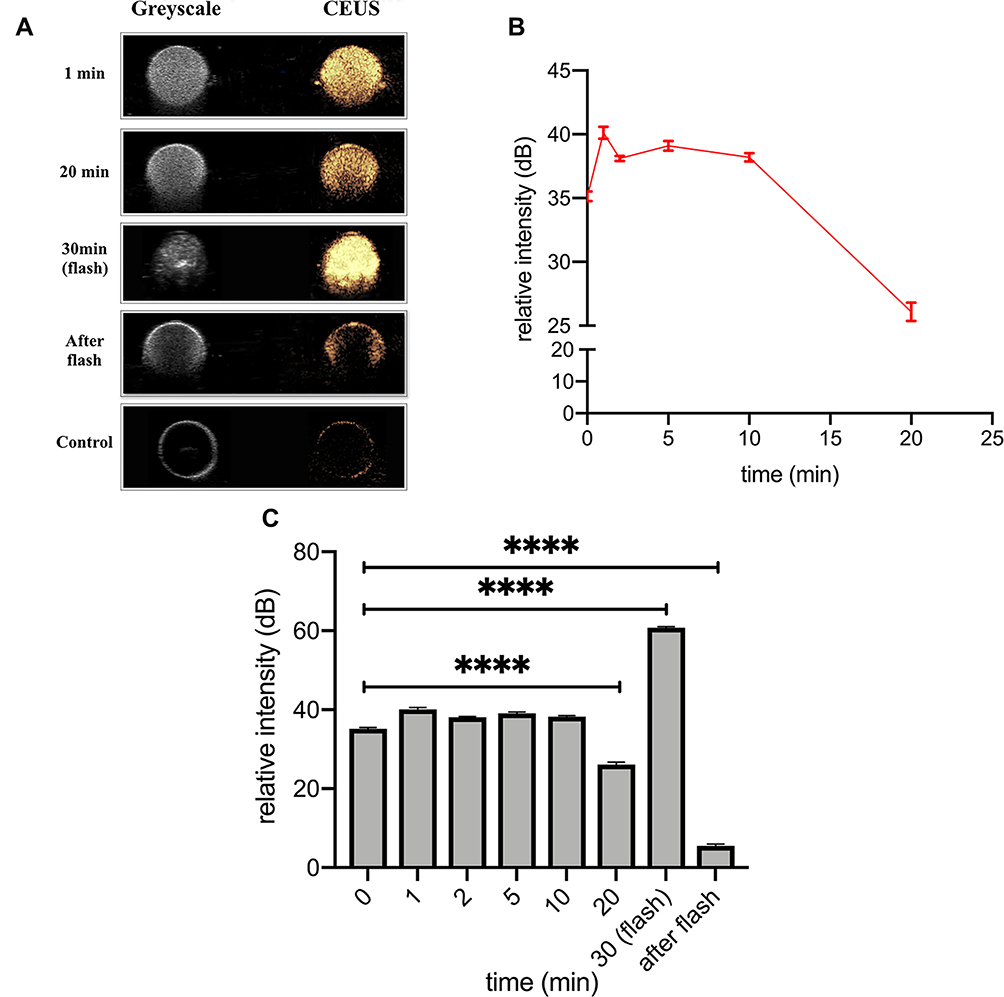 |
Figure 3 In vitro CEUS. (A) displayed the CEUS images of representative time points. (B) Time–intensity curve (TIC) showing CEUS intensity changes with time, in which relative intensity (intensity of ROI minus that of background) was used. (C) Relative intensity of different time points (****p<0.0001). |
Folate-Deficient LLC Supernates Transformed RAW264.7 Cells to TAMs with FR Up-Regulated
Within tumor microenvironment (TME) in vivo, macrophages exhibit mixed populations being characteristics of both M1 and M2-like phenotype.23 It has been reported that the tumor-conditioned medium (CM) could be introduced in culturing RAW264.7 cells to obtain TAM model in vitro, which could mimic the phenotype and functions of TAMs.21,24 As for demonstrating the specificity of our folate-conjugated HA-FOL-NBs to FRs, RAW264.7 cells grew in FA-deficient medium were used according to Lu Y. and Leamon C.P.20
To verify if RAW264.7 cells were successfully polarized to TAMs or not, the up-regulated gene expressions of M2-like macrophage (Mrc1, Il10) and M1-like macrophages (Nos2, Tnf) were confirmed by qPCR. Experiments on both time course and CM concentration were performed to optimize the appropriate macrophages activation conditions. As illustrated in Figure 4A and B, the relative fold changes of all four genes grew bigger as the culture time and CM concentration extended. Considering cell variabilities (data not shown), incubation for 48 hrs with 100% CM was adopted in the following study.
 |
Figure 4 Certification of successful transformation from RAW264.7 to TAMs. (A) Longer the incubation time, the more RAW264.7 cells polarization. (B) Full CM activated more TAMs than half CM plus half normal medium. (C) Optical microscopy image of RAW264.7 (M0) cells were mostly small and roundish with several M0 cells having spindle-looks. (D) Optical microscopy image of TAMs showed multiple pseudopod and larger sizes compared with M0 cells. |
The morphology changes were observed by optical microscopy and displayed in Figure 4C and D. The RAW264.7 cells without stimulation were mostly small and roundish, and several with spindle-looks, whereas the TAMs showed multiple pseudopod and larger sizes compared with RAW264.7 cells.
The FR expression was also quantified by PCR (Figure 5). Since TAMs we obtained by CM were phenotypic continuum of M0, M1 and M2-like macrophages, both Folr-α (mainly expressed on M1-like macrophages) and Folr-β (M2-like TAMs) were checked at the same time. RNA results were consistent with those reported by Lu Y. and Leamon C.P.20
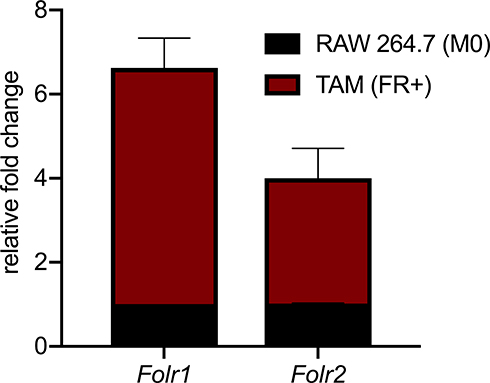 |
Figure 5 Gene expression of folate receptor elevated after culturing M0 cells with folate-deficient RPMI 1640. |
In summary, an in vitro TAM model with FR expressing was successfully constructed by incubating RAW264.7 cells with FA-deficient CM for 48 hrs.
Assessment of HA-FOL-NBs Targeting TAMs Through FA-FR Interaction
Results of the free FA competitive inhibitive study are shown in Figure 6, FITC conjugated FOL-NBs and NBs were green dots inside the cytoplasm on the fluorescence microscopy images, while the nuclei were stained with DAPI in blue. The FITC-FOL-NBs group displayed abundant green dots inside most cells around the nuclei. The green dots became much less when incubation with free FA. There were little green dots inside cytoplasm in NBs group regardless of incubation with or without free FA.
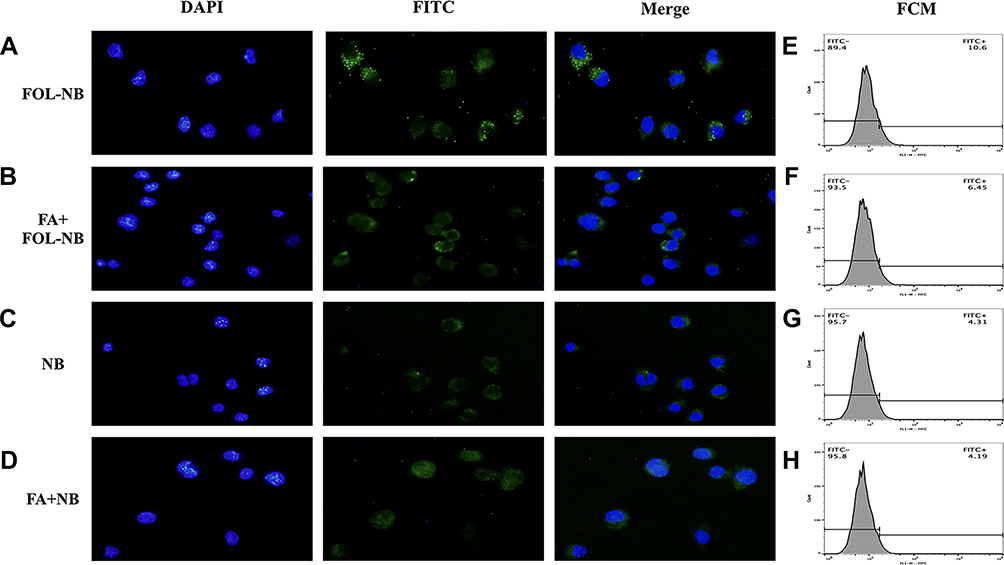 |
Figure 6 Fluorescence microscope and FCM analysis of the targeted ability. Images of fluorescence microscopy displayed lots of green fluorescence dots representative of FITC-FOL-NBs being inside TAMs of FOL-NB group while the number of green dots were less in other three groups, cell nuclei labeled by DAPI stained blue. The fluorescence intensity of the FITC-FOL-NBs was stronger than FITC-NBs, indicating that FOL-NBs could specifically target FR-expression TAMs. This interaction between FA that conjugated in FOL-NBs and FR which expressed on TAMs could be inhibited by free FA (p<0.01). |
The fluorescence intensity was measured by FCM and presented in Figure 6 as well. There were notable differences between FOL-NBs and NBs groups, FOL-NBs and FA+FOL-NBs groups (10.6% vs 4.31%, 10.6% vs 6.45%, p<0.01), indicating that FOL-NBs could specifically target FR-expression TAMs. What’s more, this targeting was accomplished by the cooperation between FA that was conjugated in FOL-NBs and FR which was expressed on TAMs.
It should be noticed that even FITC-NBs incubated with TAMs appeared some fluorescence in cytoplasm and could be collected by FCM compared with the negative control. Since phagocytosis is one major function of macrophages, it was possible that TAMs phagocytosed some FITC-NBs.
Ultrasound Targeted HA-FOL-NBs Destruction (UTND) Promoted the Reeducation of TAMs by LMW-HA
The targeting and contrast-enhancement ability of HA-FOL-NBs as ultrasound contrast agents were verified in the above experiments. The purpose of the following data was to assess the treatment function of ultrasound targeted HA-FOL-NBs destruction (UTND) as a potential drug delivery system.
As illustrated in Figures 7A and 9A, the gene expressions of Nos2 and Tnf were obviously elevated while those of Mrc1 and Il10 were down-regulated in US+HA-FOL-NB group (p<0.001 vs control group). Similar changes were observed in FCM results of CD206. The curve representing US+HA-FOL-NB group moves to the left compared with the control group (Figures 8A and 10A). ELISA data of TNF-α and IL-10 were in the same cases (p<0.01 vs control group, Figures 7B, C and 10B, C). Indicating that US+HA-FOL-NB (UTND) could reprogram TAMs by promoting M2-associated factors down-regulation, in the meantime M1 associated ones up-regulation. Then US+HA-FOL-NB was compared with LMW-HA to see if UTND enhanced the TAMs reprogramming of LMW-HA. The M2-related factors including Mrc1 and Il10 genes and proteins expression levels decreased significantly (p<0.01 vs LMW-HA group) while the Tnf gene and protein expressions increased a little (p>0.05 vs LMW-HA group), and Nos2 gene expression decreased a little (p>0.05 vs LMW-HA group, Figure 7A). In general, UTND is capable of transforming TAMs to M1-like ones, especially in promoting M2 associated factors’ down-regulation.
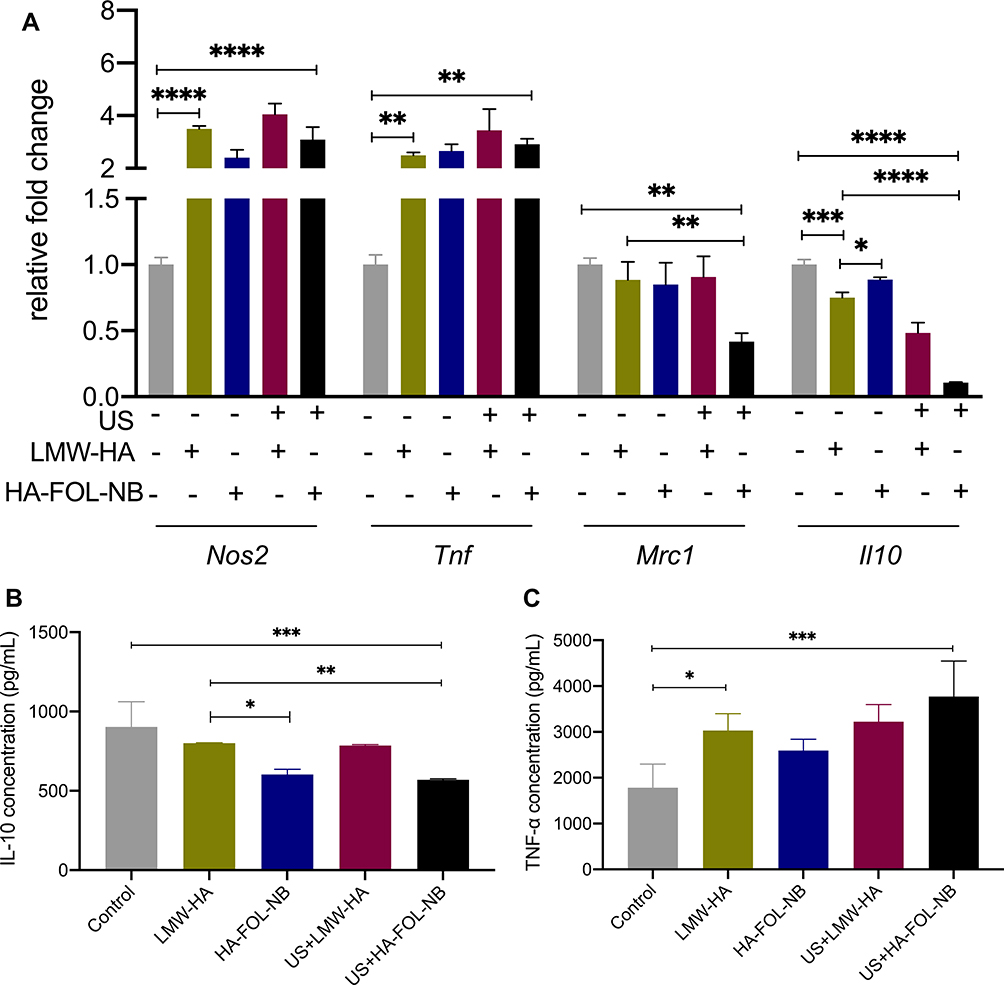 |
Figure 7 Gene expressions and cytokines secretion of different treatment groups. (A) Gene expression changes after different treatment combinations on TAMs. (B)IL-10 secretion decreases after treatment with combined ultrasound and HA-FOL-NBs. (C) Concentration of TNF-α increases after treatment with LMW-HA and with combined ultrasound and HA-FOL-NBs (*p<0.05, **p<0.01, ***p<0.001, ****p<0.0001). |
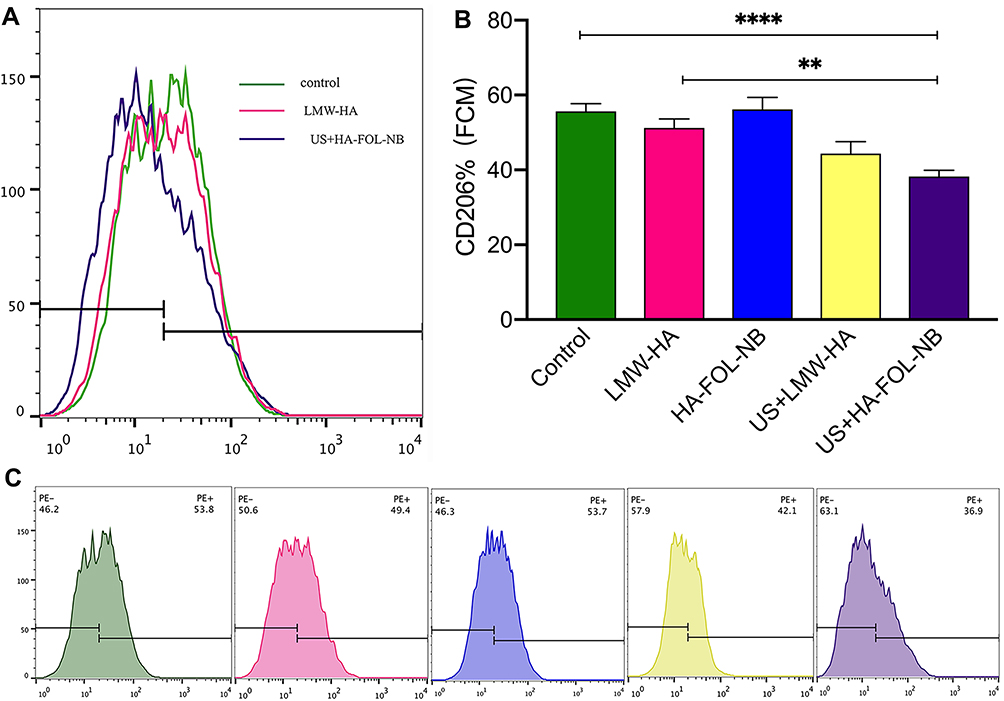 |
Figure 8 CD206 expressions of different treatment groups by flow cytometry. (A) An overview of FCM results of LMW-HA group and UTND with HA-FOL-NB group. (B) The UTND with HA-FOL-NBs down-regulated CD206 expressions more than free LWM-HA. (C) The CD206 expression of each treatment group (**p<0.01, ****p<0.0001). |
Whether US or HA-FOL-NBs solo would strengthen LMW-HA’s effect on TAMs was also evaluated. No significant differences were found on genes and proteins expression between LMW-HA group and US+LMW-HA, LMW-HA group and HA-FOL-NB groups except for Il0 gene, IL-10 secretion and the FCM of CD206. US+LMW-HA encouraged Il0 gene (p<0.01 vs LMW-HA group, Figure 7A) and CD206 expressions down-regulations (p<0.05 vs LMW-HA group, Figure 8) while concentration of cytokine IL-10 of HA-FOL-NB group decreased (p<0.05 vs LMW-HA group, Figure 7B). Overall, US or HA-FOL-NBs solo had little influence on enhancing LMW-HA’s effect on TAMs reeducation.
The enhancement effect of UTND on LMW-HA has been testified above. Then, we evaluated if UTND with nanobubbles without LMW-HA promoted TAMs repolarization or not. Both US+NB and US+FOL-NB were compared with control group separately as displayed in Figures 9 and 10, TAMs stimulated by UTND with FOL-NBs and NBs secreted more IL-10 (M2 cytokine) and the Nos2 genes (M1 factor) expression were elevated as well (p<0.01 vs control, Figure 9A and B). Based on above data, besides the enhancement effect on LMW-HA, the UTND itself may have some effect on TAMs reeducation as well.
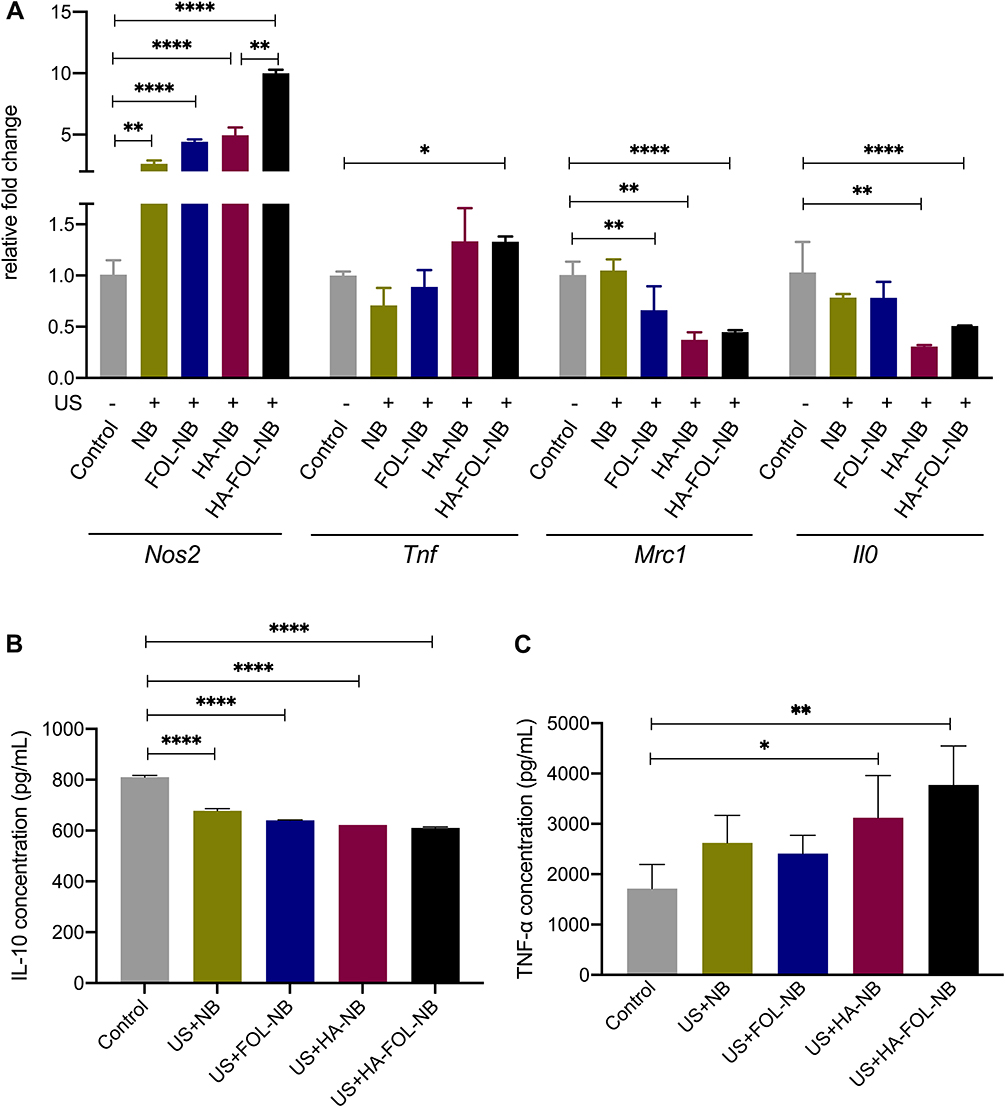 |
Figure 9 Gene expressions and cytokines secretion of different treatment groups. (A) Gene expression changes after different treatment combinations of TAMs. (B) IL-10 secretion of all treatment groups decreases. (C) TNF-α elevation after treatment with combined ultrasound and HA-NBs and with combined ultrasound and HA-FOL-NBs (*p<0.05, **p<0.01, ****p<0.0001). |
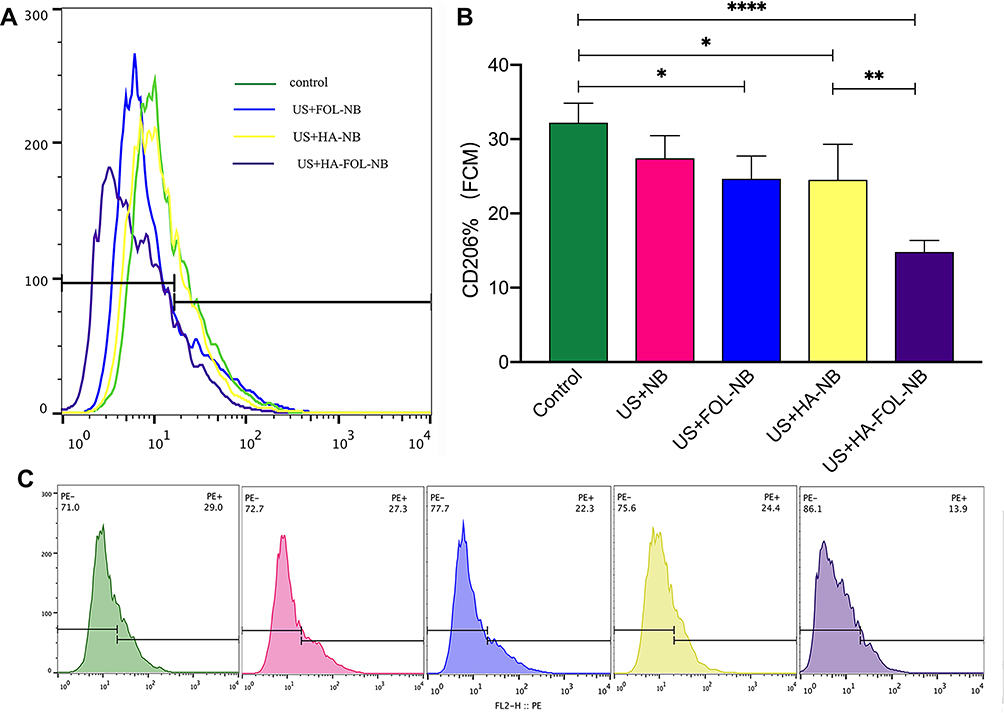 |
Figure 10 CD206 expressions of different treatment groups by flow cytometry. (A) An overview of UTND with FOL-NBs, HA-NBs, and HA-FOL-NBs down-regulating CD206 expression. (B) All UTND groups down-regulated CD206 except UTND with nanobubbles, and UTND with targeted HA-FOL-NBs decreased more than with HA-NBs. (C) The CD206 expression of each treatment group. (*p<0.05, **p<0.01, ****p<0.0001). |
At last, we assessed the genes and proteins expression changes of HA-FOL-NBs and HA-NBs with US irradiation to see if HA-FOL-NBs mediated UTND was more efficient. Both two groups showed excellent reeducation functions on TAMs (p<0.05 vs control, Figures 9 and 10). As for comparing with each other, HA-FOL-NBs with US irradiation was more efficient on CD206 down-regulation and Nos2 up-regulation (p<0.05 vs US+HA-NB group). Based on these, we would like to say actively targeted nanobubbles mediated UTND may be more efficient than passively ones in vitro.
Discussion
Ultrasound targeted destruction of microbubble/nanobubble (UTMD/UTND) has long been proved to be capable of enhancing tumor therapy with drug/gene loaded or shrink tumor by itself.25–28 The underlying mechanisms were not fully understood at present, and one of which was known is cavitation. When bubbles oscillate and disrupt in an ultrasound field, cavitation occurred and induced jet streams, heat and the generation of ROS, that may help promoting cell membrane permeability and cell death around the irradiation areas.29 Low-molecular-weight hyaluronic acid (LMW-HA) was capable of modulating and reprogramming macrophage phenotype from alternative activation state to classic one.14 Prior studies have noted that FRβ is specifically expressed by ex vivo isolated TAMs, which supported folate conjugates as valuable tools to target TAMs in tumor immunotherapy protocols.12 Based on the above literature reviews, a folate-conjugated and LMW-HA-loaded ultrasonic nanobubble (HA-FOL-NB) was synthesized and combined with ultrasound irradiation to actively target TAMs and to change their phenotypes from M2 to M1 in this study.
The diameter of nanobubble in UTND is important because it not only contributes to enhanced permeability and retention (EPR) accumulation and subsequent cell permeability, but also influences CEUS imaging. Large nanobubbles (>500 nm) are unable to penetrate the cell membrane.30 The contrast enhancement of ultrasound contrast agent (UCA) was declined with the diameter decreased.31 The size of HA-FOL-NB is about 342 nm (PDI: 0.155), which is fine with both EPR and CEUS. Since HA-FOL-NB we constructed was a bubble-like structure with gas core, and the gas inside would escape due to high vacuum of electron microscope, leading to bubble destruction. Light and fluorescence microscope were used to observe HA-FOL-NBs morphology instead.
To enhance the targeting ability of nanobubbles, folic acid (FA) was conjugated as actively targeting ligand. Results of the free FA competitive inhibition study indicated that FOL-NBs could specifically target FR-expression TAMs and this combination could be blocked by free FA. Besides, the conjugation of FA improved the targeting ability of FOL-NBs dramatically compared with the non-targeted NBs. It should be mentioned that even FITC-NBs incubated with TAMs appeared some fluorescence in cytoplasm and could be collected by FCM compared with the negative control. Since phagocytosis is one major function of macrophages, it was possible that TAMs phagocytosed some FITC-NBs. A previous study also reported that during FR mediated endocytosis by tumor cells, there is non-specific phagocytosis exists, only clathrin, caveolin, FR, and adenosine-triphosphate (ATP) were more important in the FR mediated endocytosis process than the non-specific phagocytosis.28
The in vitro TAMs models were prepared by culturing RAW264.7 cells (M0) in FA deficient conditioned medium (CM) which was the supernatants of LLCs harvested and filtered through a 0.22 μm membrane filter. Optical microscopy described morphological changing from small roundish cells to multiple pseudopod and larger ones. The up-regulated expressions of Mrc1, Il0, Nos2, and Tnf also confirmed the successful transformation from M0 to a mixed phenotype of both M1 and M2, which is more consistent with in vivo condition.23 The Nos2 and Mrc1 genes are markers of murine M1 and M2 macrophage separately while IL-10 and TNF-α were cytokines secreted by these two.23
Compared with free LMW-HA, ultrasound targeted destruction of HA-FOL-NBs (UTND) was more efficient on reprogramming on TAMs as anticipated, by promoting M2 associated factors (Mrc1, CD206, IL-10) down-regulation, and at the same time M1 associated ones (Nos2, Tnf, TNF-α) up-regulation. We also verified that it was ultrasound irradiation combining HA-FOL-NBs to achieve that improved reeducation effect other than ultrasound irradiation or HA-FOL-NBs by itself. It was somewhat surprising that UTND with NBs promoted TAMs to secrete less IL-10 (M2 cytokine) and expressed elevated Nos2 genes (M1 marker) as well (p<0.01 vs control). A possible explanation for this might be that UTND induced oxidative stress and ameliorated the hypoxia condition in TME. Oxidative stress occurs when the ultrasound-mediated cavitation produces free radicals and elevate intracellular ROS levels.32 The environmental conditions such as tumor hypoxia may mediate macrophages initially switch from tumor-suppressing (M1) to tumor-promoting (M2) at the onset of disease.33 Hence, the UTND with NBs may reeducate TAMs through elevation of oxidative stress. There was a not-very-encouraging result between UTND with HA-FOL-NBs and HA-NBs. UTND with HA-FOL-NBs was only more efficient on CD206 down-regulation and Nos2 up-regulation than UTND with HA-NBs. Although these two were molecular markers of M1 and M2 macrophages, it was not so compelling to draw the conclusion that UTND with actively targeted NBs was more efficient than passively targeted ones, further study would be needed in the following in vivo experiments.
Our experiment offers preliminary evidence of UTND with HA-FOL-NBs promoting TAMs reeducation. However, our study analyzed a limited number of markers on a simplified in vitro model transformed from an immortalized macrophage cell line. Settings in an in vivo tumor microenvironment were extremely complicated and may modify the result we see under controlled conditions. Despite these limitations, our study is the first of its kind to load LMW-HA within an ultrasound contrast agent, which could target TAMs through folate and folate receptor interaction and promote TAMs reprogramming when combined with ultrasound targeted nanobubble destructions. This understanding may help in the use of hyaluronic acid to manipulate macrophage phenotype and to improve targeted drug delivery systems.
Conclusions
The present study was designed to explore whether folate-conjugated and LMW-hyaluronic acid loaded nanobubbles (HA-FOL-NB) combining with ultrasound-mediated nanobubble destruction (UTND) have the potential to switch the phenotype of tumor-associated macrophages (TAMs) from M2 to M1-like ones. The HA-FOL-NB we reported was a remarkable TAM-targeting ultrasound contrast agent. When combining UTND, HA-FOL-NB exhibited superior reprogramming effect on TAMs by down-regulating M2-associated factors and up-regulating M1 associated ones. HA-FOL-NB would be a good candidate for ultrasound molecular imaging, and for tumor therapy when combining UTND.
Acknowledgments
This work was supported by National Natural Science Foundation of China (No.81771843) and Science and Technology Developing Program of Shandong Provincial Government of China (No.2017GSF18107).
Disclosure
The authors report no conflicts of interest in this work.
References
1. Quail DF, Joyce JA. Microenvironmental regulation of tumor progression and metastasis. Nat Med. 2013;19(11):1423–1437. doi:10.1038/nm.3394
2. Belgiovine C, D’Incalci M, Allavena P, Frapolli R. Tumor-associated macrophages and anti-tumor therapies: complex links. Cell Mol Life Sci. 2016;73(13):2411–2424. doi:10.1007/s00018-016-2166-5
3. Mantovani A, Sozzani S, Locati M, Allavena P, Sica A. Macrophage polarization: tumor-associated macrophages as a paradigm for polarized M2 mononuclear phagocytes. Trends Immunol. 2002;23(11):549–555. doi:10.1016/S1471-4906(02)02302-5
4. Biswas SK, Gangi L, Paul S, et al. A distinct and unique transcriptional program expressed by tumor-associated macrophages (defective NF-kappaB and enhanced IRF-3/STAT1 activation). Blood. 2006;107(5):2112–2122. doi:10.1182/blood-2005-01-0428
5. Roth F, De La Fuente AC, Vella JL, Zoso A, Inverardi L, Serafini P. Aptamer-mediated blockade of IL4Rα triggers apoptosis of MDSCs and limits tumor progression. Cancer Res. 2012;72(6):1373. doi:10.1158/0008-5472.CAN-11-2772
6. Song M, Liu T, Shi C, Zhang X, Chen X. Bioconjugated manganese dioxide nanoparticles enhance chemotherapy response by priming tumor-associated macrophages toward M1-like phenotype and attenuating tumor hypoxia. ACS Nano. 2016;10(1):633–647. doi:10.1021/acsnano.5b06779
7. Zhu S, Niu M, O’Mary H, Cui Z. Targeting of tumor-associated macrophages made possible by PEG-sheddable, mannose-modified nanoparticles. Mol Pharm. 2013;10(9):3525–3530. doi:10.1021/mp400216r
8. Turk MJ, Waters DJ, Low PS. Folate-conjugated liposomes preferentially target macrophages associated with ovarian carcinoma. Cancer Lett. 2004;213(2):165–172. doi:10.1016/j.canlet.2003.12.028
9. Hattori Y, Yamashita J, Sakaida C, Kawano K, Yonemochi E. Evaluation of antitumor effect of zoledronic acid entrapped in folate-linked liposome for targeting to tumor-associated macrophages. J Liposome Res. 2015;25(2):131–140. doi:10.3109/08982104.2014.954128
10. Andon FT, Digifico E, Maeda A, et al. Targeting tumor associated macrophages: the new challenge for nanomedicine. Semin Immunol. 2017;34:103–113. doi:10.1016/j.smim.2017.09.004
11. Xia W, Hilgenbrink AR, Matteson EL, Lockwood MB, Cheng JX, Low PS. A functional folate receptor is induced during macrophage activation and can be used to target drugs to activated macrophages. Blood. 2009;113(2):438–446. doi:10.1182/blood-2008-04-150789
12. Puig-Kroger A, Sierra-Filardi E, Dominguez-Soto A, et al. Folate receptor beta is expressed by tumor-associated macrophages and constitutes a marker for M2 anti-inflammatory/regulatory macrophages. Cancer Res. 2009;69(24):9395–9403. doi:10.1158/0008-5472.CAN-09-2050
13. Lu Y, Low PS. Immunotherapy of folate receptor-expressing tumors: review of recent advances and future prospects. J Control Release. 2003;91(1–2):17–29. doi:10.1016/S0168-3659(03)00215-3
14. Rayahin JE, Buhrman JS, Zhang Y, Koh TJ, Gemeinhart RA. High and low molecular weight hyaluronic acid differentially influence macrophage activation. ACS Biomater Sci Eng. 2015;1(7):481–493. doi:10.1021/acsbiomaterials.5b00181
15. Cai J, Fu J, Li R, Zhang F, Ling G, Zhang P. A potential carrier for anti-tumor targeted delivery-hyaluronic acid nanoparticles. Carbohydr Polym. 2019;208:356–364. doi:10.1016/j.carbpol.2018.12.074
16. Lyle DB, Breger JC, Baeva LF, et al. Low molecular weight hyaluronic acid effects on murine macrophage nitric oxide production. J Biomed Mater Res A. 2010;94(3):893–904. doi:10.1002/jbm.a.32760
17. Duan S, Guo L, Shi D, Shang M, Meng D, Li J. Development of a novel folate-modified nanobubbles with improved targeting ability to tumor cells. Ultrason Sonochem. 2017;37:235–243. doi:10.1016/j.ultsonch.2017.01.013
18. Meng D, Guo L, Shi D, et al. Charge-conversion and ultrasound-responsive O-carboxymethyl chitosan nanodroplets for controlled drug delivery. Nanomedicine (Lond). 2019;14(19):2549–2565. doi:10.2217/nnm-2019-0217
19. Kooiman K, Vos HJ, Versluis M, de Jong N. Acoustic behavior of microbubbles and implications for drug delivery. Adv Drug Deliv Rev. 2014;72:28–48. doi:10.1016/j.addr.2014.03.003
20. Lu Y, Leamon CP. Targeting activated macrophages via a functional folate receptor for potential treatment of autoimmune/inflammatory disorders. In: Jackman A, Leamon CP, editors. Targeted Drug Strategies for Cancer and Inflammation. Boston, MA: Springer; 2011.
21. Kono Y, Kawakami S, Higuchi Y, Yamashita F, Hashida M. In vitro evaluation of inhibitory effect of nuclear factor-kappaB activity by small interfering RNA on pro-tumor characteristics of M2-like macrophages. Biol Pharm Bull. 2014;37(1):137–144. doi:10.1248/bpb.b13-00659
22. Shi D, Guo L, Duan S, et al. Influence of tumor cell lines derived from different tissue on sonoporation efficiency under ultrasound microbubble treatment. Ultrason Sonochem. 2017;38:598–603. doi:10.1016/j.ultsonch.2016.08.022
23. Martinez FO, Gordon S. The M1 and M2 paradigm of macrophage activation: time for reassessment. F1000Prime Rep. 2014;6:13. doi:10.12703/P
24. Yao Y, Shi Q, Chen B, et al. Identification of caspase-6 as a new regulator of alternatively activated macrophages. J Biol Chem. 2016;291(33):17450–17466. doi:10.1074/jbc.M116.717868
25. Luo T, Sun J, Zhu S, et al. Ultrasound-mediated destruction of oxygen and paclitaxel loaded dual-targeting microbubbles for intraperitoneal treatment of ovarian cancer xenografts. Cancer Lett. 2017;391:1–11. doi:10.1016/j.canlet.2016.12.032
26. Wu M, Zhao H, Guo L, et al. Ultrasound-mediated nanobubble destruction (UMND) facilitates the delivery of A10-3.2 aptamer targeted and siRNA-loaded cationic nanobubbles for therapy of prostate cancer. Drug Deliv. 2018;25(1):226–240. doi:10.1080/10717544.2017.1422300
27. Suzuki R, Oda Y, Omata D, et al. Tumor growth suppression by the combination of nanobubbles and ultrasound. Cancer Sci. 2016;107(3):217–223. doi:10.1111/cas.12867
28. Shen S, Li Y, Xiao Y, et al. Folate-conjugated nanobubbles selectively target and kill cancer cells via ultrasound-triggered intracellular explosion. Biomaterials. 2018;181:293–306. doi:10.1016/j.biomaterials.2018.07.030
29. FERI. LB
30. Wickens JM, Alsaab HO, Kesharwani P, et al. Recent advances in hyaluronic acid-decorated nanocarriers for targeted cancer therapy. Drug Discov Today. 2017;22(4):665–680. doi:10.1016/j.drudis.2016.12.009
31. Voigt J-U. Ultrasound molecular imaging. Methods. 2009;48(2):92–97. doi:10.1016/j.ymeth.2009.03.011
32. Prieur F, Pialoux V, Mestas JL, Mury P, Skinner S, Lafon C. Evaluation of inertial cavitation activity in tissue through measurement of oxidative stress. Ultrason Sonochem. 2015;26:193–199. doi:10.1016/j.ultsonch.2015.03.011
33. Lewis C, Murdoch C. Macrophage responses to hypoxia: implications for tumor progression and anti-cancer therapies. Am J Pathol. 2005;167(3):627–635. doi:10.1016/S0002-9440(10)62038-X
 © 2020 The Author(s). This work is published and licensed by Dove Medical Press Limited. The
full terms of this license are available at https://www.dovepress.com/terms.php
and incorporate the Creative Commons Attribution
- Non Commercial (unported, v3.0) License.
By accessing the work you hereby accept the Terms. Non-commercial uses of the work are permitted
without any further permission from Dove Medical Press Limited, provided the work is properly
attributed. For permission for commercial use of this work, please see paragraphs 4.2 and 5 of our Terms.
© 2020 The Author(s). This work is published and licensed by Dove Medical Press Limited. The
full terms of this license are available at https://www.dovepress.com/terms.php
and incorporate the Creative Commons Attribution
- Non Commercial (unported, v3.0) License.
By accessing the work you hereby accept the Terms. Non-commercial uses of the work are permitted
without any further permission from Dove Medical Press Limited, provided the work is properly
attributed. For permission for commercial use of this work, please see paragraphs 4.2 and 5 of our Terms.