")
Back to Journals » Clinical Interventions in Aging » Volume 13
Type 2 diabetes mellitus: distribution of genetic markers in Kazakh population
Authors Sikhayeva N , Talzhanov Y, Iskakova A , Dzharmukhanov J, Nugmanova R, Zholdybaeva E, Ramanculov E
Received 4 November 2017
Accepted for publication 28 December 2017
Published 5 March 2018 Volume 2018:13 Pages 377—388
DOI https://doi.org/10.2147/CIA.S156044
Checked for plagiarism Yes
Review by Single anonymous peer review
Peer reviewer comments 2
Editor who approved publication: Dr Richard Walker
Nurgul Sikhayeva,1,2 Yerkebulan Talzhanov,1 Aisha Iskakova,1 Jarkyn Dzharmukhanov,1 Raushan Nugmanova,1 Elena Zholdybaeva,1 Erlan Ramanculov1–3
1National Scientific Laboratory of Biotechnology, National Center for Biotechnology, Astana, Kazakhstan; 2Faculty of Natural Sciences, L.N. Gumilyov Eurasian National University, Astana, Kazakhstan; 3School of Science and Technology, Nazarbayev University, Astana, Kazakhstan
Background: Ethnic differences exist in the frequencies of genetic variations that contribute to the risk of common disease. This study aimed to analyse the distribution of several genes, previously associated with susceptibility to type 2 diabetes and obesity-related phenotypes, in a Kazakh population.
Methods: A total of 966 individuals belonging to the Kazakh ethnicity were recruited from an outpatient clinic. We genotyped 41 common single nucleotide polymorphisms (SNPs) previously associated with type 2 diabetes in other ethnic groups and 31 of these were in Hardy–Weinberg equilibrium. The obtained allele frequencies were further compared to publicly available data from other ethnic populations. Allele frequencies for other (compared) populations were pooled from the haplotype map (HapMap) database. Principal component analysis (PCA), cluster analysis, and multidimensional scaling (MDS) were used for the analysis of genetic relationship between the populations.
Results: Comparative analysis of allele frequencies of the studied SNPs showed significant differentiation among the studied populations. The Kazakh population was grouped with Asian populations according to the cluster analysis and with the Caucasian populations according to PCA. According to MDS, results of the current study show that the Kazakh population holds an intermediate position between Caucasian and Asian populations.
Conclusion: A high percentage of population differentiation was observed between Kazakh and world populations. The Kazakh population was clustered with Caucasian populations, and this result may indicate a significant Caucasian component in the Kazakh gene pool.
Keywords: single-nucleotide polymorphism, Kazakh population, type 2 diabetes, OpenArray
Introduction
Diabetes is a chronic endocrine disease characterized by increased blood sugar as a result of absolute or relative deficiency of insulin, a hormone secreted by the pancreas. The disease leads to many types of metabolic disturbances, vascular disease, nervous system disease, as well as disorders of other organs and systems, with severe complications: blindness, kidney failure, gangrene and leg amputation, infarction, and stroke. Worldwide, diabetes is ranked as the third most common cause of death.1
According to the official medical statistics of 2016, there are 2,135.2 officially registered patients with diabetes per 100,000 people in Kazakhstan.2 According to World Health Organization estimates, the prevalence of diabetes mellitus in Kazakhstan is 11.5%. The number of people with diagnosed diabetes increases by 8%–10% annually; in addition, there is an increase in the frequency of complications and mortality attributed to severe diabetes.1
Genetic variants in combination with environmental factors are thought to contribute to the development of this disease. The greatest progress in the determination of the genetic origins of type 2 diabetes mellitus (T2DM) was achieved using genome-wide association studies (GWAS) on different populations.3 However, positive and negative associations should be evaluated in other ethnic populations because of ethnic differences in the frequencies of genetic variations and differences in the contribution of environmental factors.4–7 Many genes are currently associated with a risk of T2DM development, although the exact molecular mechanism remains largely unknown. Genetic variations in any of these genes may change the features of metabolic disorders and diseases. The first step of such research is the study of allele frequency of different genes involved in T2DM susceptibility in the population. Allele distribution is well studied in Caucasian populations; however, allele distribution in populations of Central Asia is poorly understood. It is worth mentioning that allele frequency may depend on racial and ethnic background as well as geographical area.8 Furthermore, according to Chen et al,9 T2DM showed a significant differentiation of risk allele frequencies among diverse populations and among 12 common diseases.9
In this study, we aimed to analyze the allele frequencies of several genes previously identified, by GWAS and candidate gene studies in other ethnic populations, to be associated with T2DM susceptibility and obesity-related phenotypes in a Kazakh population and to evaluate the differences between the Kazakh population and populations from the haplotype map (HapMap) database.
Materials and methods
Characteristics of the study populations
A total of 966 individuals living in Almaty during 2013–2014 and belonging to the Kazakh ethnicity participated in this study. Subjects were recruited from an annual health checkup conducted at the Asfendiyarov Kazakh National Medical University, and they were unrelated. The study population comprised 268 males and 698 females (age: 35.20±11.58 years; body mass index [BMI]: 23.23±4.59 kg/m2; systolic blood pressure (SBP): 111.64±12.42 mmHg; diastolic blood pressure (DBP): 73.17±8.74 mmHg).
Blood samples were collected according to the study protocol, which was approved by the Ethics Committee of the National Center for Biotechnology of the Republic of Kazakhstan, Astana, Kazakhstan (number 11, 14.02.2010) and the Asfendiyarov Kazakh National Medical University, Almaty, Kazakhstan. Each participant was informed of the purpose and methods of the study, and written informed consent was obtained from all participants. If an individual indicated that he or she had an ancestor who was not a Kazakh, the blood sample from this individual was excluded from the study.
Genotyping
We selected 41 single nucleotide polymorphisms (SNPs) that were previously associated with T2DM and obesity-related phenotypes for investigation in this study (Table S1). DNA was extracted from venous whole blood samples by the salting-out method.10 SNP detection was performed using the TaqMan OpenArray Real-Time PCR Platform (Life Technologies, Foster City, CA, USA). The analyses were conducted according to the manufacturer’s standard protocols, and genotype calls were made by the OpenArray SNP Genotyping Analysis Software, version 1.0.3. Data analyses were performed with the TaqMan Genotyper Software, version 1.3.
Statistical analysis
Statistical analysis was performed using Haploview 4.211 and Arlequin 3.1 software.12 The correspondence of the distributions of genotype frequencies to the Hardy–Weinberg equilibrium (HWE) was assessed using the χ2 criterion (preliminary analysis) and exact tests using a Markov chain. Data from the HapMap database were used for the comparative analysis of the differences in genotype and haplotype frequencies among Kazakh and world populations (HapMap Genome Browser release number 27 [Phases I, II, and III – merged genotypes and frequencies]).13 The exact test of population differentiation (Markov chain) method was used for the analysis.12,14,15 Burn-in steps (dememorizations steps) of 10,000, followed by 100,000 Markov Chain steps, were applied. For block generations, the confidence intervals default algorithm was used (Haploview 4.2; minor allele frequency [MAF] <0.05).
During the analysis of genetic relationship between the populations, several approaches were used: principal component analysis (PCA), cluster analysis, and multidimensional scaling (MDS). The method of choice for genetic distance calculation plays a crucial role in obtaining significant results;16 therefore, we decided to use different methods for confirmation of the obtained results. PCA and MDS are used for the description of small-size data, which makes those methods valuable in the field of genetics.
PCA was carried out based on MAF. We considered 21 SNPs (other SNPs were excluded from the analysis due to absence of data) in the PCA of 12 populations (Table S2). PCA was performed using the “prcomp” function for categorical PCA, implemented in R version 3.1.3. Genetic distance calculation (Nei’s distance, angular distance or Edwards’s distance, coancestrality coefficient of Edwards’s distance, classic Euclidean distance or Rogers’s distance, and absolute genetic distance or Provesti’s distance) and MDS analysis were performed with the “ade4 package” for R statistical software.
Results
Allele and genotype frequencies in the Kazakh population and comparative analysis
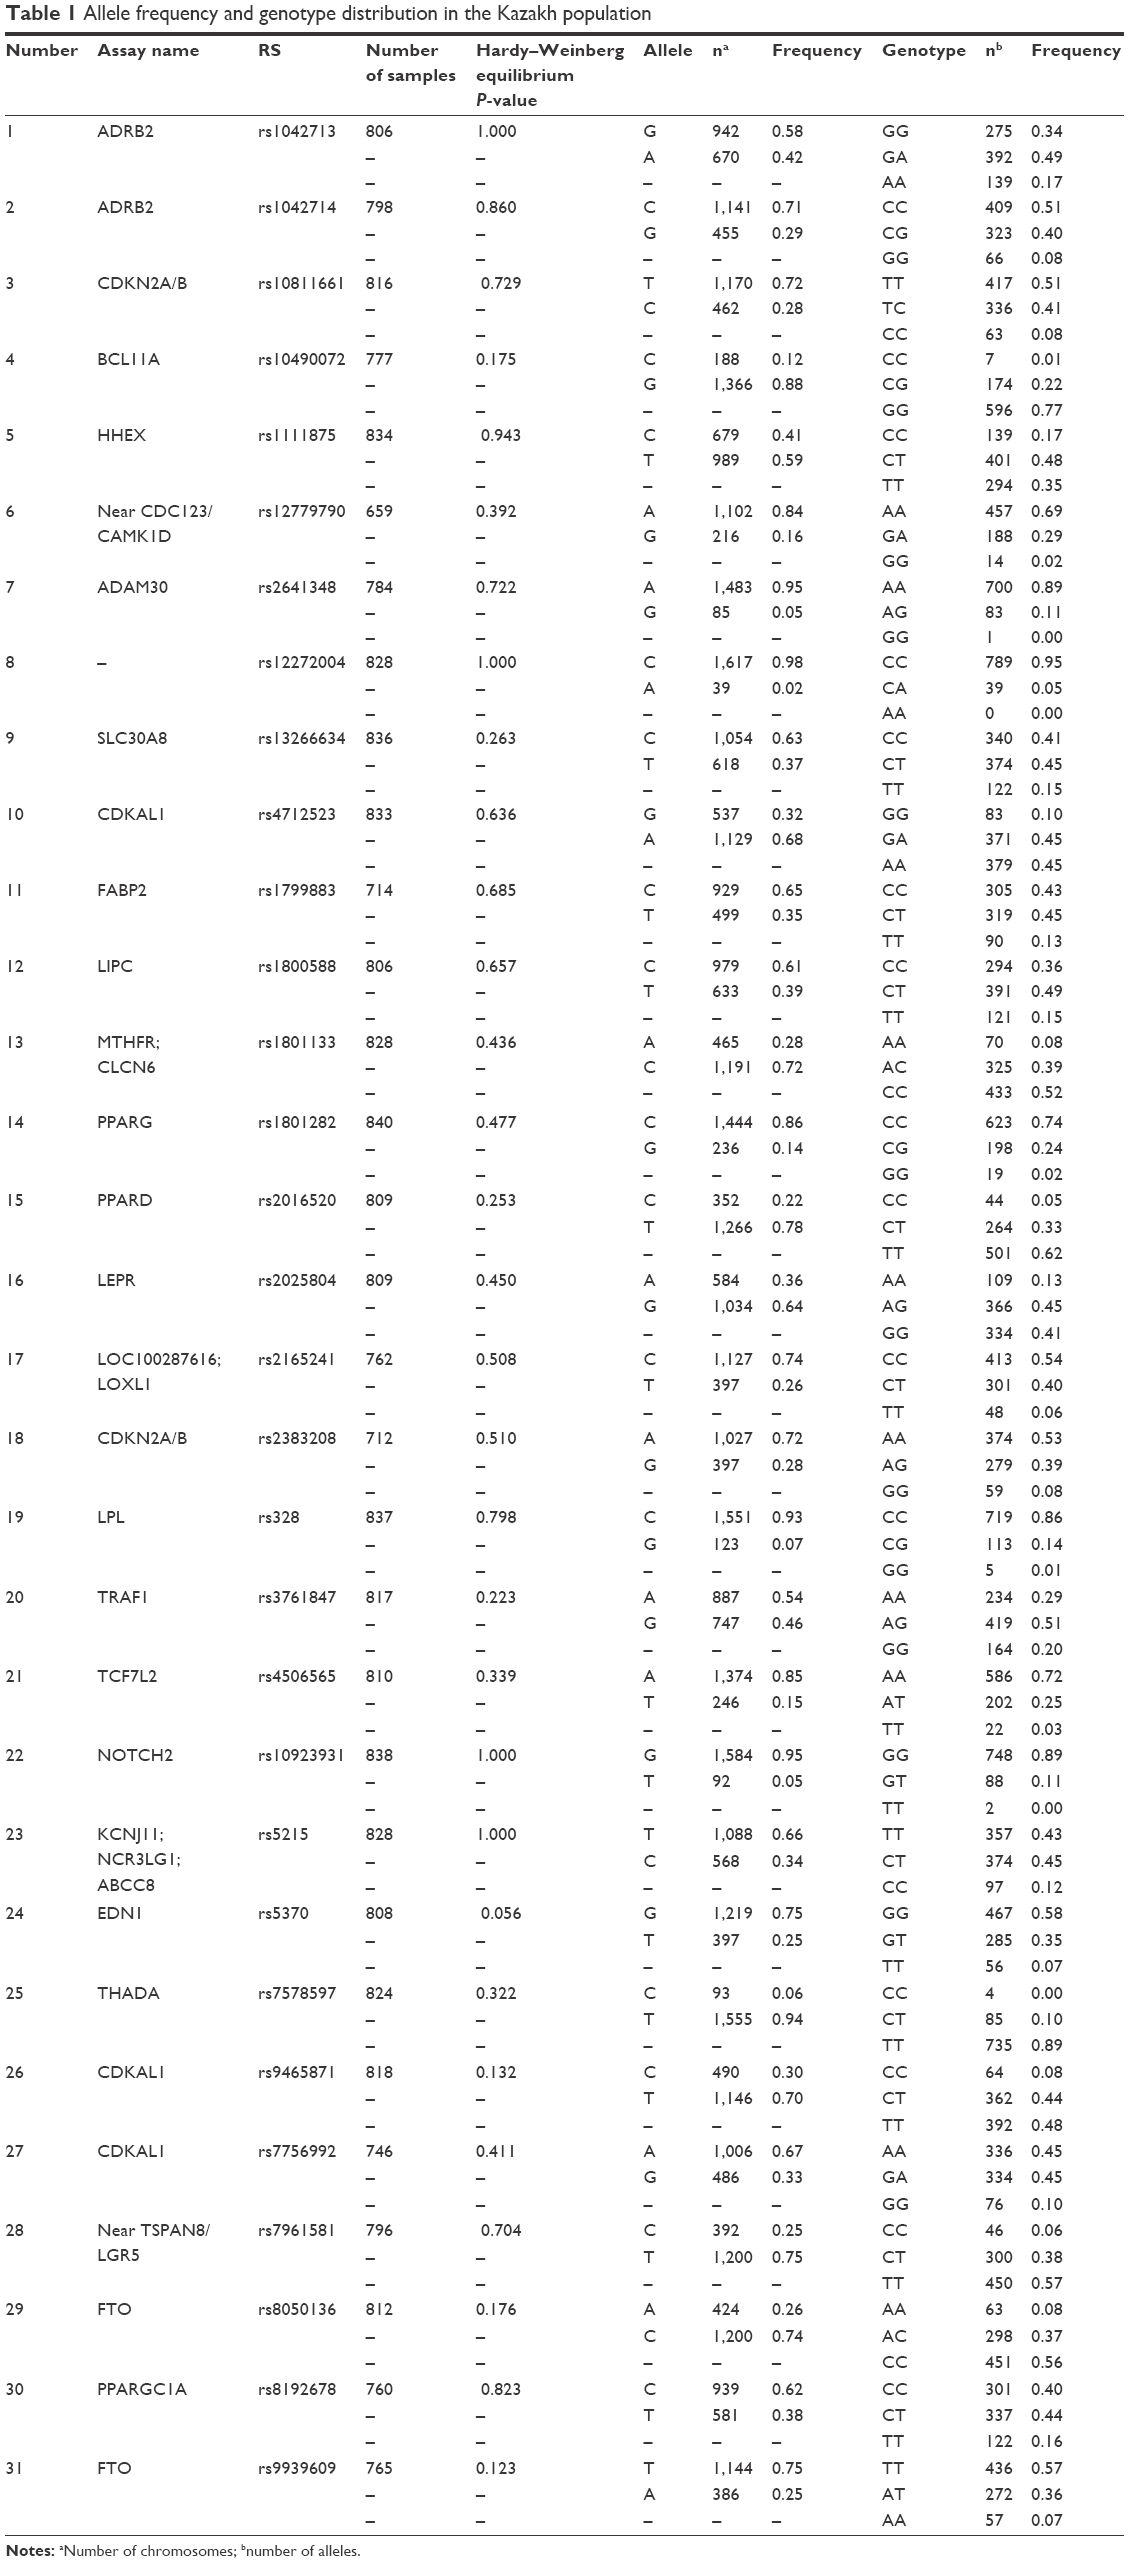
We genotyped 41 common SNPs (representing 25 genes/loci), and 31 of these were in HWE (10 polymorphisms not in HWE were excluded from subsequent analysis). The allele and genotype frequencies of the remaining 31 SNPs are summarized in Table 1.
 | Table 1 Allele frequency and genotype distribution in the Kazakh population |
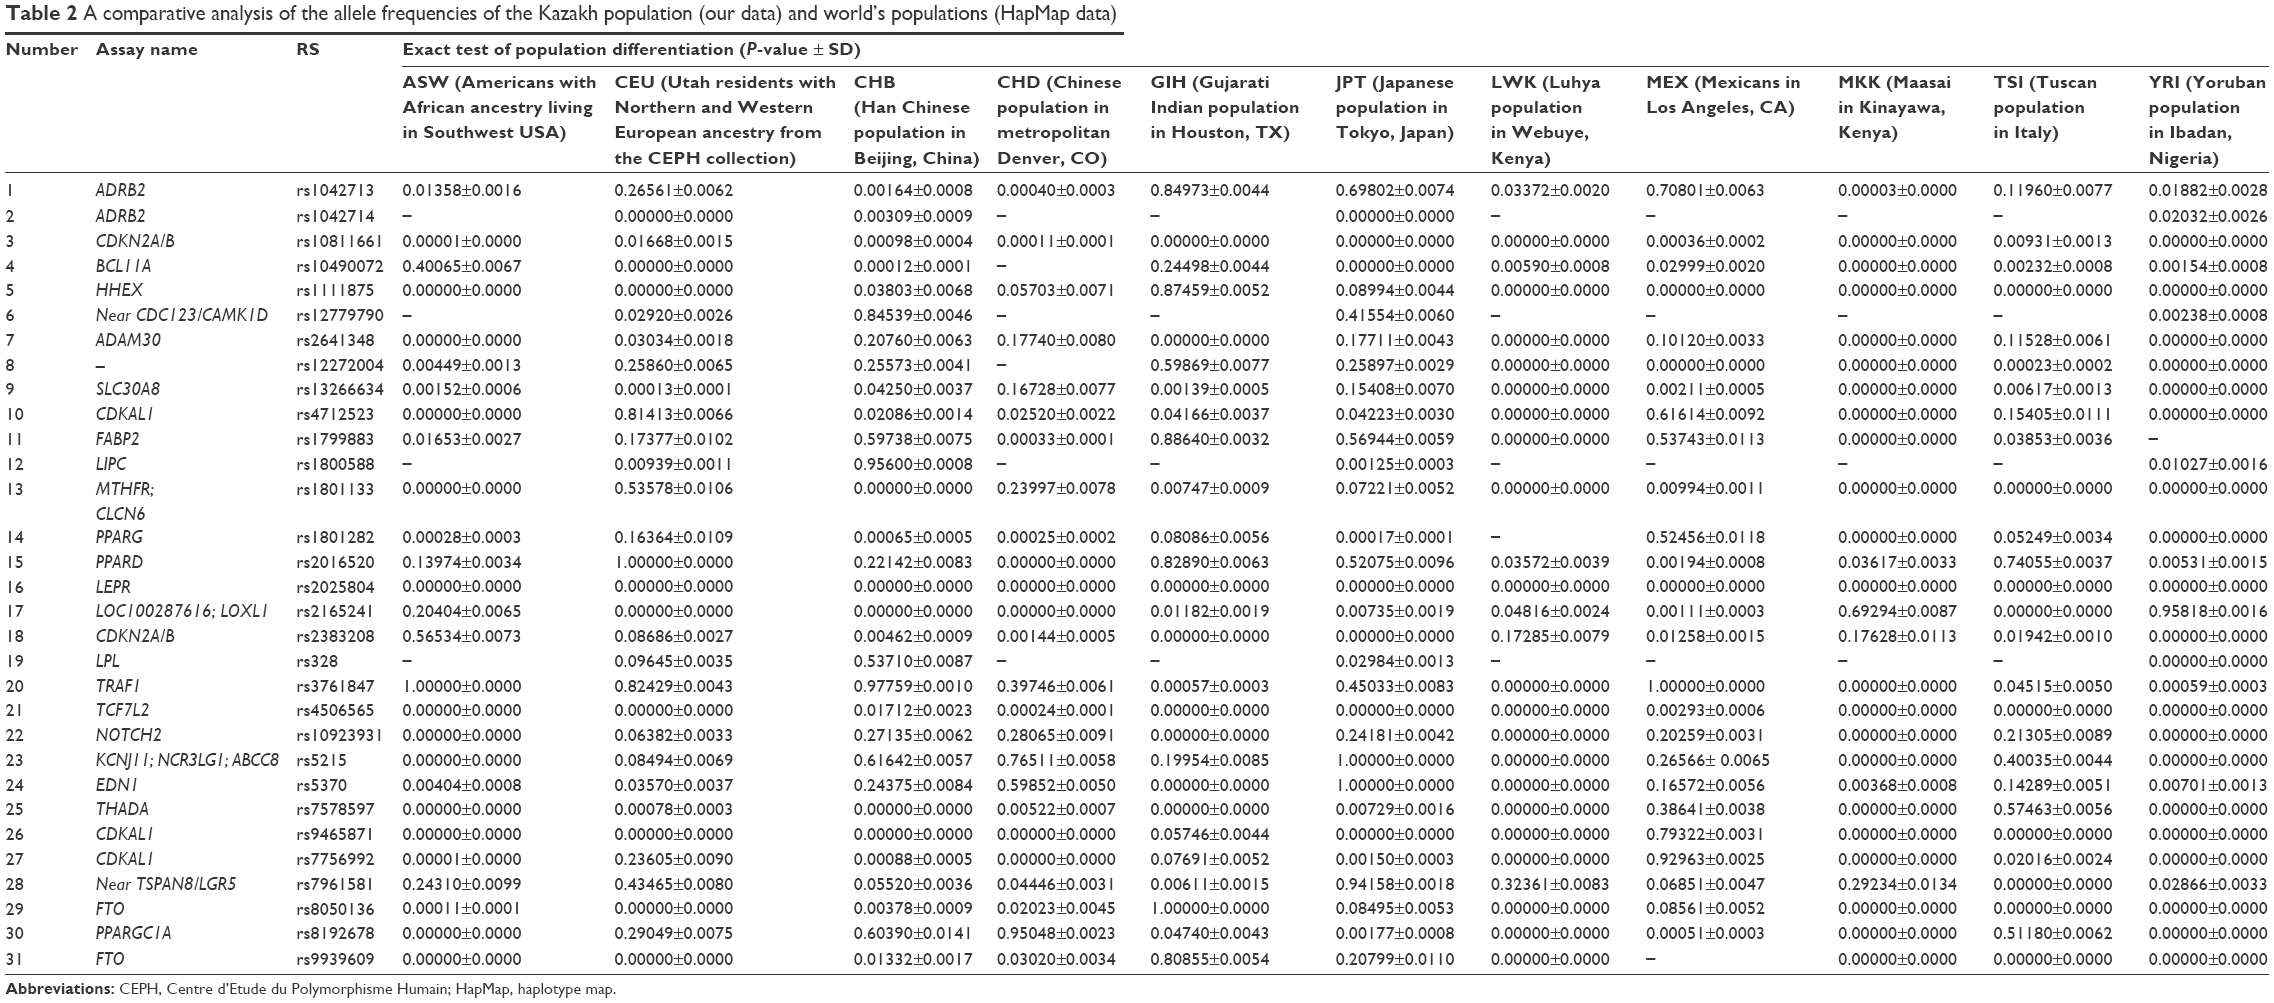
We also performed a comparative analysis of the differences in genotype frequencies between the Kazakh population and the data of populations obtained from the HapMap database: data from Africans (YRI: Yoruban population in Ibadan, Nigeria; LWK: Luhya population in Webuye, Kenya; ASW: Americans of African ancestry living in Southwest USA; MKK: Maasai in Kinayawa, Kenya), Americans (MEX: Mexicans in Los Angeles, CA; GIH: Gujarati Indian population from Houston, TX), Asians (CHB: Han Chinese population in Beijing, China; CHD: Chinese population in metropolitan Denver, CO; JPT: Japanese population in Tokyo, Japan), and Europeans (CEU: Utah residents with Northern and Western European ancestry from the Centre d’Etude du Polymorphisme Humain [CEPH] collection; TSI: Tuscan population in Italy) (Table 2).
 | Table 2 A comparative analysis of the allele frequencies of the Kazakh population (our data) and world’s populations (HapMap data) |
For individuals of the ASW group, genotype data were available for only 27 SNPs of the 31 studied SNPs. Twenty-one of these 27 SNPs showed a significant difference from those in the Kazakh population. For the CEU population, genetic analysis was performed for 31 SNPs. Sixteen of these SNPs were significantly different compared with those of the Kazakh population. For the CHB population, 18 of 31 SNPs showed significant differences compared with those of the Kazakh population. The comparative analysis showed significant differences among the Kazakh population and the CHD population for 25 SNPs. Fifteen SNPs were different between the Kazakh and the GIH populations. According to our results, significant differences were revealed for 15 of 31 SNPs in the JPT, 24 of 26 SNPs in the LWK, 12 of 26 SNPs in the MEX, 24 of 27 SNPs in the MKK, 17 of 27 SNPs in the TSI, and 29 of 30 SNPs in the YRI groups, compared with those of the Kazakh population (Table 2).
According to the results of linkage disequilibrium analysis, one haplotype block consisted of two SNPs, ie, rs1042713 and rs1042714, in the Kazakh population (Table 3). A comparative analysis of the haplotype frequencies was performed for the Kazakh population and data from the HapMap database. Our result showed that only the CEU and YRI populations formed a block in the ADRB2 gene. The frequencies of haplotypes TAC, TGC, and CGG were 0.500, 0.357, and 0.142 in the YRI population, respectively, whereas the frequencies of these haplotypes in the CEU population were 0.358, 0.167, and 0.465, respectively (Table 4).
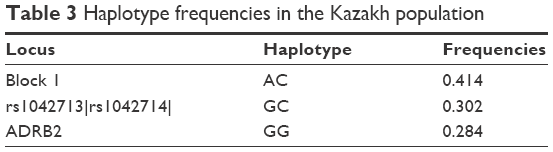 | Table 3 Haplotype frequencies in the Kazakh population |
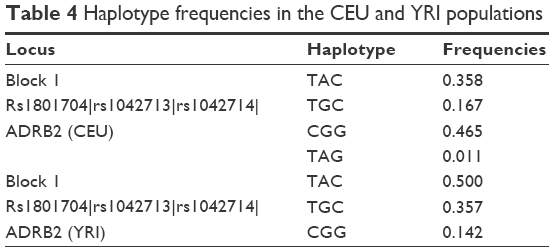 | Table 4 Haplotype frequencies in the CEU and YRI populations |
Analysis of genetic relationship between the populations
The PCA of studied populations was computed based on MAFs (Table S2) and showed the differences between populations, accounting for 80% of the total genetic variation for the first two principal components (PCs). A plot of the first two PCs demonstrates three main clusters. The first cluster contains five populations: KZ, CEU, GIH, MEX, and TSI. The second cluster in space PC1–PC2 combines African populations such as ASW, LWK, MKK, and YRI. The third cluster includes three Asian populations (CHB, CHD, and JPT), which are dispersed along PC1 (Figure 1).
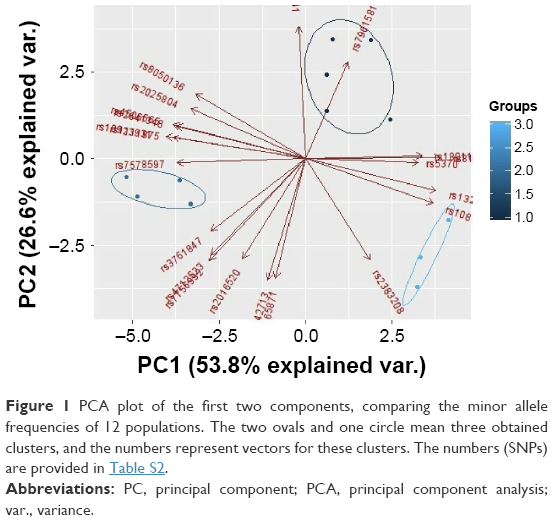 | Figure 1 PCA plot of the first two components, comparing the minor allele frequencies of 12 populations. The two ovals and one circle mean three obtained clusters, and the numbers represent vectors for these clusters. The numbers (SNPs) are provided in Table S2. |
To measure genetic distances, five methods were used: Nei’s distance, angular distance or Edwards’s distance, coancestrality coefficient of Edwards’s distance, classic Euclidean distance or Rogers’s distance, and absolute genetic distance or Provesti’s distance. A matrix of genetic distances based on allele frequencies was obtained by the five methods. Based on the allele frequency data of the studied polymorphisms, matrices of genetic distances obtained by the five different methods were built (Tables 5 and S3). The obtained matrices of genetic distances comprised the source material for the cluster analysis and MDS. Using the matrix of genetic distances, a cluster analysis was performed, and a dendrogram was constructed (Figures 2 and S1).
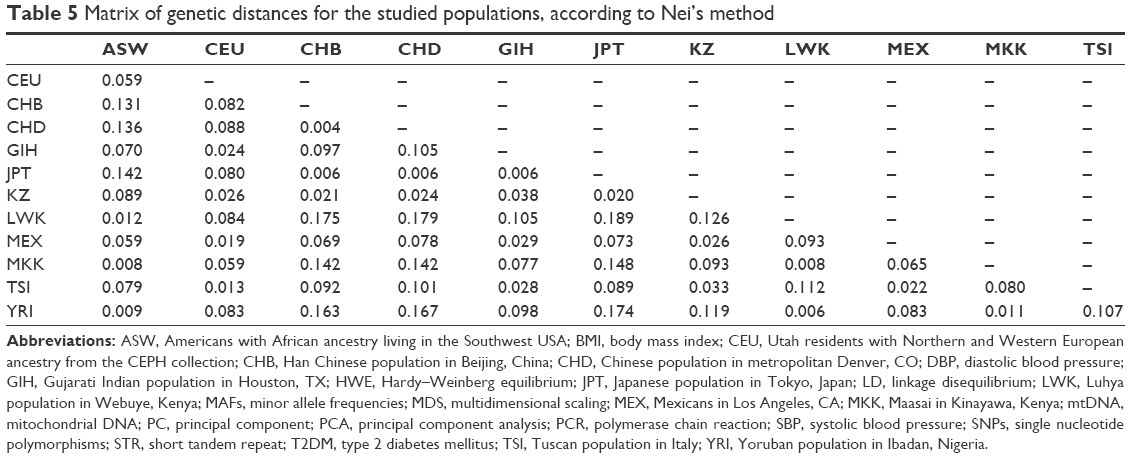 | Table 5 Matrix of genetic distances for the studied populations, according to Nei’s method |
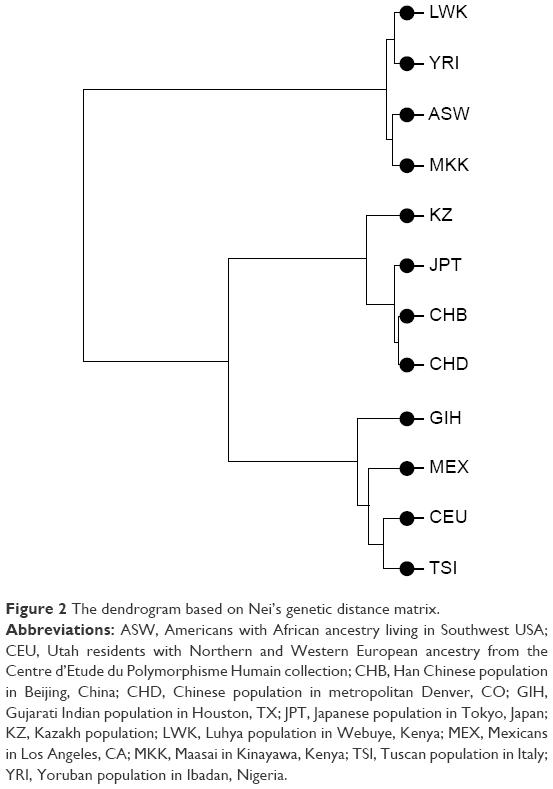 | Figure 2 The dendrogram based on Nei’s genetic distance matrix. |
According to Figure 1, the LWK population is combined with the YRI population into one cluster (d=0.006), and populations ASW and MKK are combined into one cluster (d=0.008). Furthermore, these two clusters are joined. A cluster combining populations CHB and CHD (d=0.004) joins populations JPT (d=0.006) and KZ (d=0.020–0.024). Populations CEU and TSI (d=0.013), MEX (d=0.019–0.22), and GIH (d=0.024–0.029) form a separate cluster. These results were confirmed by other dendrograms obtained through matrices calculated by other methods (Figure S1).
During the MDS of matrices, the graph of mutual arrangement of studied populations in the two-dimensional space was obtained (Figures 3 and S2). As on the dendrogram, three separate clusters can be seen on the graph. However, the Kazakh population is located separately from the Caucasian, Asian, and African clusters.
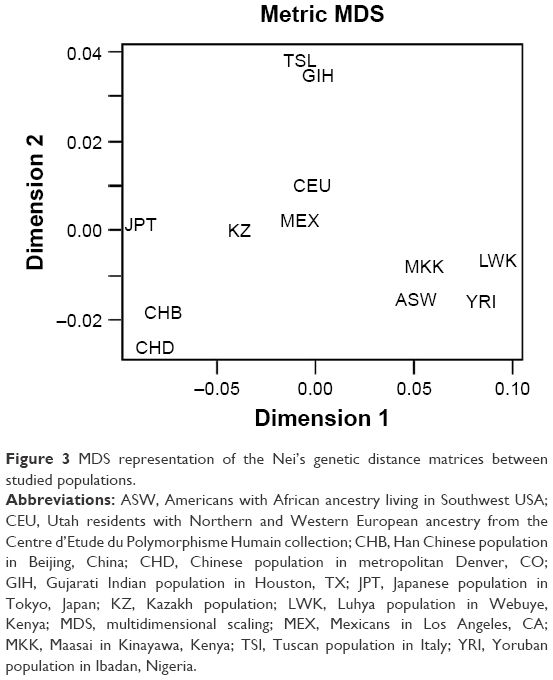 | Figure 3 MDS representation of the Nei’s genetic distance matrices between studied populations. |
Discussion
T2DM is a common, complicated disease that has a strong genetic predisposition. Environmental factors also play a decisive role in the development of T2DM by modulating gene expression through epigenetic mechanisms, including DNA methylation, histone modification, and microRNA regulation. A previous study showed that epigenetic changes are important for the development of T2DM.17 At the moment, there are multiple studies on the genetic basis of T2DM in many populations; therefore, a few dozen loci associated with the risk of diabetes development have been identified. It is important to mention that the frequencies of T2DM genetic markers vary across different geographical regions and ethnic groups. Ethnicity significantly affects the allele frequency of polymorphic markers and thus the common genetic risk of the disease; therefore, more active study of the T2DM heredity basis in different ethnic groups is required. In addition, economic and dietary habits can play important roles in the allelic distribution worldwide.18
In the present study, our objective was to summarize the current knowledge of the frequency distribution of these genetic variants in the population. There are three main directions of population genetic studies, including the study of autosomal markers, the study of mitochondrial DNA (mtDNA), and the study of Y chromosome polymorphism. The profiles of mtDNA and Y chromosome polymorphism in the Kazakh population are well characterized,19,20 whereas data on autosomal markers are lacking. As a result, allele distribution is well studied in Caucasian populations but poorly understood in Central Asian populations. Kazakhs are one of the Turkic-speaking people living in Central Asia. Interest in the study of Central Asian people, in particular, indigenous people of Kazakhstan (Kazakhs), suffers due to the complexity of their ethnogenesis. For example, studies have confirmed that in Kazakhstan, there was a centuries-old stratification of the Mongoloid component in the ancient Kazakhstan anthropological stratum of the proto-European race.21 The Kazakh anthropological type, differentiated by features of Caucasoid and Mongoloid races, occupies an intermediate position and is related to a mixed South Siberian race.22 The large proportion of Caucasoid component in the gene pool of the Kazakh population may explain the features of their ethnogenesis. Thus, according to anthropologists, Caucasoid features of modern Kazakhs have roots in the Bronze Age. Among the local population of that period, the ancient Kazakhstan (Andronov) Caucasoid type was widespread. On this basis, there was further development of the anthropological types in the territory of Kazakhstan. Mongoloid impurities in the anthropological composition of the local population in Kazakhstan were introduced in ancient times by Asian tribes.21
With the gene–candidate approach, it was possible to identify several loci in the genome associated with diabetes predisposition: peroxisome proliferator-activated receptor gamma (PPARG)23 and ATP-sensitive potassium channel (KCNJ11).24 Gouda et al25 showed that the 12Ala allele frequency ranged from 5.9% to 21.6% (median: 12.7%) for the Caucasian population and from 1.7% to 9.3% (median: 4.5%) for East Asian populations such as Chinese or Japanese.25 In our study, the 12Ala allele frequency was 14% in the Kazakh population and 2%, 10%, 5%, 3%, 9%, 3%, 9%, 2%, 7%, and 0% in the ASW, CEU, CHB, CHD, GIH, JPT, MEX, MKK, TSI, and YRI populations, respectively.
The gene KCNJ11 (potassium inwardly rectifying channel, subfamily J, member 11) regulates glucose-dependent insulin secretion. The frequency of allele G in the Kazakh population was 34%. According to the comparative analysis, rs5215 was significantly different between the Kazakh population and the ASW, LWK, MKK, and YRI populations.
Using GWAS on different populations, many T2DM-associated susceptibility genes, including TCF7L2, CDKN2A/2B, CDKAL1, FTO, HHEX/IDE, SLC30A8, and CDK5, were revealed.26–28 The product of the gene TCF7L2 is a high-mobility group box-containing transcription factor previously implicated in blood glucose homeostasis, which plays a significant role in the Wnt signaling pathway. Meta-analyses of the studies performed in East Asian populations showed that the MAF ranged between 28.8% and 37.3% (mean: 32.8%) for rs4506565.29
The rs10811661 polymorphism located upstream of the CDKN2A and CDKN2B genes may confer increased risk for T2DM by affecting β-cell function.30 For rs10811661, the C allele frequency was 28% in our cohort, and the frequencies of this polymorphism were significantly different between the Kazakh population and all 11 studied populations. Additionally, the frequencies of rs2383208 (CDKN2A/B) were significantly different between the Kazakh population and studied populations from HapMap, except the ASW, CEU, LWK, and MKK populations.
SNPs in CDKAL1 and FTO are associated with T2DM and T2DM-related traits.31 The allelic distribution of these genes was also significantly different between the Kazakh population and the ASW, CHB, CHD, LWK, MKK, TSI, and YRI populations for four SNPs (rs9465871, rs7756992, rs8050136, and rs9939609) and the JPT population for SNPs in CDKAL1. In the Kazakh population, the risk allele in rs1111875 (HHEX) was found in 41% of individuals and was significantly different between the Kazakh population and the ASW, CEU, CHB, LWK, MEX, MKK, TSI, and YRI populations.
The product of SLC30A8 gene plays an important role in the regulation of maturation, storage, and secretion of insulin by β-cells.32 In the Kazakh population, the T allele was found in 37% of individuals, and the frequencies of rs13266634 were significantly different between the Kazakh population and the studied populations from HapMap, except the CHD and JPT populations.
Zeggini et al5 identified previously unknown loci associated with T2DM development: rs7961581 of TSPAN8-LGR5 gene, rs12779790 of CDC123-CAMA1D (possibly responsible for control of B-cell number by increased apoptosis) gene, rs7578597 of THADA gene, rs2641348 of ADAM30 gene, and rs10923931 of NOTCH2 (codes for transmembrane receptor required for pancreas development within prenatal period) gene.5 Thus, a significant difference was found between the Kazakh population and the ASW, GIH, LWK, MKK, and YRI populations for rs2641348 and rs10923931 and between the Kazakh population and the studied populations from HapMap, except the MEX and TSI populations, for rs7578597. For rs12779790, the G allele frequency in our study was 16% in Kazakhs; the frequencies of these SNPs were significantly different between the Kazakh population and the CEU and YRI populations. For rs7961581, the C allele frequency was 25% in our cohort; the frequencies of these SNPs were significantly different between the Kazakh population and the CHD, GIH, TSI, and YRI populations.
The product of the ADRB2 gene is a lipolytic receptor in human fat cells, which stimulates lipid mobilization. Polymorphisms in this gene are associated with susceptibility to obesity. The rs1042713 and rs1042714 allele mutations at codons 16 and 27, respectively, appear to alter ADRB2 function by changing its amino acid structure.33 In the Kazakh population, the frequency of allele A of rs1042713 was 42%, whereas it was 56%, 56%, 58%, 52%, 54%, and 50% in the ASW, CHB, CHD, LWK, MKK, and YRI populations, respectively. The frequencies of rs1042714 were available only for the CEU, CHB, JPT, and YRI populations in the HapMap database, and this SNP was significantly different between the Kazakh population and all these populations.
The MTHFR gene encodes the enzyme methylenetetrahydrofolate reductase, which is involved in folate metabolism. Many studies have shown that reduced MTHFR activity is a risk factor for T2DM. The polymorphism rs1801133 can reduce enzyme activity34 and is associated with the risk of T2DM development.35 The T allele of rs1801133 had a frequency of 28% in our cohort and 12%, 31%, 48%, 34%, 17%, 36%, 9%, 42%, 8%, 46%, and 9% in the ASW, CEU, CHB, CHD, GIH, JPT, LWK, MEX, MKK, TSI, and YRI populations, respectively. The frequency of this SNP was significantly different between the Kazakh population and the ASW, CHB, CHD, JPT, MKK, and YRI populations. Several studies also demonstrated that the frequency distributions of the MTHFR polymorphism (rs1801133) vary between different regional and ethnic groups. In addition, Wang et al18 demonstrated that the allele frequency of this polymorphism varies across geographical areas and ethnic groups and suggests that environmental factors may exert selective pressures on genetic mutations.18
Thus, a significant difference was found between the Kazakh population and the ASW, GIH, LWK, MKK, and YRI populations for rs2641348 and rs10923931 and between the Kazakh population and studied populations from HapMap, except the MEX and TSI populations, for rs7578597. For rs12779790, the G allele frequency in our study was 16% in Kazakhs; the frequencies of these SNPs were significantly different between the Kazakh population and the CEU and YRI populations. For rs7961581, the C allele frequency was 25% in our cohort; the frequencies of these SNPs were significantly different between the Kazakh population and the CHD, GIH, TSI, and YRI populations. Importantly, we found differences between all populations and the Kazakh population in the allele frequencies of several genes involving susceptibility to T2DM, including LEPR, TCF7L2, THADA, and CDKN2A/B. Additionally, the greatest differences compared with the Kazakh population were found for the YRI population.
According to the results of haplotype frequencies, only the CEU and YRI populations generated the block containing different numbers of SNPs consisting of rs1801704, rs1042713, and rs1042714 in the ADRB2 gene (Table 4). In the Kazakh population, the block contained only three haplotypes, whereas the CEU block contained four haplotypes. Moreover, their frequencies were different (Table 4). The YRI population block contained three haplotypes, as did the Kazakh population. Additionally, the haplotype frequencies of ADRB2 in the YRI population were relatively closest to those of the Kazakh population.
Comparative analysis of allele frequencies of the studied SNPs showed significant differentiation among the studied populations. This result confirms that different racial and ethnic groups contributed to the Kazakh population. Of note, these results showed differences for only this group of SNPs, which are not representative of the entire genome variation of this population.
Many studies used PCA or MDS for the presentation of population structure results.36–38 Clusters that combine studied populations demonstrate the proximity of their gene pools, which can be attributed to common origin and subsequent mixing of populations. According to various studies, the Kazakh population was formed as a result of mixture of the European and Asian populations.39–41 PCA using allele frequencies (Figure 1) showed that European populations are the most closely related to the Kazakh population. Interestingly, according to the PCA, the studied populations formed three separate clusters, which included populations with similar origin. These data may indicate a significant Caucasian component in the Kazakh gene pool.
In addition, population studies of mtDNA showed high genetic diversity in Central Asia. Gonzalez-Ruiz et al42 hypothesized that genetic diversity in this region may be the result of late mixing between the populations of Western and Eastern Eurasia.42 Our data confirmed this hypothesis. Further, Tarlykov et al19 revealed the high degree of genetic differentiation on the level of mtDNA. The majority of maternal lineages belonged to haplogroups common in Central Asia. In contrast, Y-short tandem repeat (STR) data showed very low genetic diversity.19
The minimum genetic distance of the Kazakh population from the Japanese population is shown in Table 5. Many studies have shown that populations from different continents that are geographically close also share genetic similarities. Recent studies have analyzed the origin and evolutionary relationship of different world populations and attempted to explain the genetic dispersion by geographical and linguistic characteristics with the use of large-scale genetic markers. According to one study, geographical location was considered the main factor; in other words, for geographically close populations, genetic and geographic distances are often highly correlated.43 Studies have shown that the Central Asian populations occupy an intermediate position between the Eastern Asian populations and Western populations.22,40,42 Our results confirmed this finding: the Kazakh population was grouped with East Asian populations according to the cluster analysis the Western populations according to PCA. According to MDS, results of the current study show that the Kazakh population holds an intermediate position between European and Eastern Asian populations.
For thousands of years, Central Asia has been a place of intensive genetic and demographic processes, which can explain the sufficiently high proportion of interpopulation differences for this territorial group. Comparative analysis of allele frequencies of the studied SNPs showed significant differentiation among studied populations. This result confirms that different racial and ethnic groups have contributed to the Kazakh population.
Importantly, the position of the investigated populations on the dendrogram is generally consistent with their major ethnogeographical formations. As for the Kazakhs, despite some mixture of Mongoloid features in their anthropological type, their genetic proximity to the Japanese and their intermediate position between European and Asian populations suggests the contribution of Caucasoid and Mongoloid components in the formation of their gene pool.
There are several limitations of this study. First, this study did not contain a separate validation cohort. Second, a relatively limited sample of Kazakhs was investigated. Ten SNPs out of the 41 tested were filtered out due to deviation from the HWE. All SNPs tested are associated with T2DM and obesity. Based on the literature, diabetes is ranked as the third most common cause of death in the world. In our opinion, this observed phenomenon confirms that selected SNPs have a considerable effect on the predisposition to development of diabetes. Carriers of the homozygous alleles may simply have a higher chance of death, which disrupts normal allele distribution. The Kazakhs, among other ethnic populations, have their own genetic profile, and the hypothesis mentioned here likely has more serious implications for Kazakhs than for others. It should be noted that the number of men and women in the study group is not the same, which may indicate selection bias of participants. T2DM is more frequently diagnosed in men of lower age and BMI; however, the most prominent risk factor, which is obesity, is more common in women. Diversity in biology, culture, lifestyle, environment, and socioeconomic status impacts differences between males and females in predisposition, development, and clinical presentation of T2DM.44 Furthermore, the analyzed SNPs were not randomly chosen. Thus, another possible limitation might be the fact that the frequencies of SNPs not randomly chosen may not represent actual distributions. However, some studies showed that disease-associated SNPs are not significantly different from SNPs chosen at random across populations.33,45,46
Conclusion
Genetic variants that contribute to risk of common disease may differ in frequency across populations. Our results revealed significant variations in the frequencies of studied SNPs between Kazakh and all other populations examined. According to PCA, the Kazakh population was clustered with the Caucasian population, and this result may indicate a significant Caucasian component in the Kazakh gene pool. Additionally, the studied SNPs are not representative of the entire genome variability of the Kazakh population, at least as it pertains to T2DM. Our study may explain the genetic impact of metabolic diseases affecting Kazakhs.
Data sharing statement
Due to the presence of potentially identifying participant information, all relevant data are available to qualified researchers upon request to the corresponding author Nurgul Sikhayeva ([email protected]).
Acknowledgments
The authors thank the people of Almaty for their participation in this study, the Asfendiyarov Kazakh National Medical University, and the many colleagues who assisted in the collection of these data. This work was supported by grants (numbers 0113PK00299 and 0898GF4) from the Ministry of Education and Science of the Republic of Kazakhstan.
Author contributions
All authors contributed toward data analysis, drafting and critically revising the paper and agree to be accountable for all aspects of the work.
Disclosure
The authors report no conflicts of interest in this work.
References
The Kazakhstan Pharmaceutical Herald [webpage on the Internet].Epidemiology of Diabetes. Available from: http://pharmnews.kz/news/v_kazakhstane_na_nachalo_2015_goda_oficialno_zaregistrirovano_261453_bolnykh_sakharnym_diabetom/2015-12-23-9193. Accessed 5 May, 2016. | ||
Medinfo [database on the Internet]. Statistical Data. Available from: http://old.medinfo.kz/dps3.do. Accessed 15 July, 2017. | ||
Fuchsberger C, Flannick J, Teslovich TM, et al. The genetic architecture of type 2 diabetes. Nature. 2016;536(7614):41–47. | ||
Sanghera D, Blackett P. Type 2 diabetes genetics: beyond GWAS. J Diabetes Metab. 2012;3(198):6948. | ||
Zeggini E, Scott L, Saxena R, et al; Wellcome Trust Case Control Consortium. Meta-analysis of genome-wide association data and large-scale replication identifies additional susceptibility loci for type 2 diabetes. Nat Genet. 2008;40(5):638–645. | ||
Wellcome Trust Case Control Consortium. Genome-wide association study of 14,000 cases of seven common diseases and 3,000 shared controls. Nature. 2007;447(7145):661–678. | ||
Wang X, Strizich G, Hu Y, Wang T, Kaplan R, Qi A. Genetic markers of type 2 diabetes: progress in genome-wide association studies and clinical application for risk prediction. J Diabetes. 2016;8(1):24–35. | ||
Ding K, Kullo I. Geographic differences in allele frequencies of susceptibility SNPs for cardiovascular disease. BMC Med Genet. 2011;12:55. | ||
Chen R, Corona E, Sikora M, et al. Type 2 diabetes risk alleles demonstrate extreme directional differentiation among human populations, compared to other diseases. PLoS Genet. 2012;8(4):e1002621. | ||
Miller S, Dykes D, Polesky H. A simple salting out procedure for extracting DNA from human nucleated cells. Nucleic Acids Res. 1988;16(3):1255. | ||
Barrett J, Fry B, Maller J, Daly M. Haploview: analysis and visualization of LD and haplotype maps. Bioinformatics. 2005;21(2):263–265. | ||
Excoffier L, Laval G, Schneider S. Arlequin ver. 3.0: an integrated software package for population genetics data analysis. Evol Bioinform Online. 2005;1:47–50. | ||
Thorisson G, Smith A, Krishnan L, Stein L. The international HapMap project web site. Genome Res. 2005;15(11):1591–1593. | ||
Raymond M, Rousset F. An exact test for population differentiation. Evol Bioinform Online. 1995;49(6):1280–1283. | ||
Guo S, Thompson E. Performing the exact test of Hardy-Weinberg proportion for multiple alleles. Biometrics. 1992;48(2):361–372. | ||
Libiger O, Nievergelt C, Schork N. Comparison of genetic distance measures using human SNP genotype data human biology. Hum Biol. 2009;81(4):389–406. | ||
Kwak S, Park K. Recent progress in genetic and epigenetic research on type 2 diabetes. Exp Mol Med. 2016;48(3):e220. | ||
Wang X, Fu J, Li A, Zeng D. Geographical and ethnic distributions of the MTHFR C677T, A1298C and MTRR A66G gene polymorphisms in Chinese populations: a meta-analysis. PLoS One. 2016;11(4):e0152414. | ||
Tarlykov P, Zholdybayeva E, Akilzhanova A, et al. Mitochondrial and Y-chromosomal profile of the Kazakh population from East Kazakhstan. Croat Med J. 2013;54(1):17–24. | ||
Zhabagin M, Balanovska E, Sabitov Z, et al. The connection of the genetic, cultural and geographic landscapes of Transoxiana. Sci Rep. 2017;7(1):3085. | ||
Berezina GM. Genetic and Demographic Processes in Rural Populations of Kazakhstan and Their Genetic Differentiation by mtDNA [MD Thesis]. Russian State Medical University; 2005. Available from: http://www.dissercat.com/content/genetiko-demograficheskie-protsessy-v-selskikh-populyatsiyakh-kazakhstana-i-ikh-geneticheska. Accessed 17 April, 2016. Russian. | ||
Kuranov A, Vavilov M, Abildinova G, et al. Polymorphisms of HLA-DRB1, -DQA1 and -DQB1 in inhabitants of Astana, the capital city of Kazakhstan. PLoS One. 2014;9(12):e115265. | ||
Shanmuga P, Ramalingam S, Sudha R, Thiagarajan S, Somasundaram L. Genotype phenotype correlation of genetic polymorphism of PPAR gamma gene and therapeutic response to pioglitazone in type 2 diabetes mellitus – a pilot study. J Clin Diagn Res. 2016;10(2):FC11–FC14. | ||
Gloyn A, Siddiqui J, Ellard S. Mutations in the genes encoding the pancreatic beta-cell KATP channel subunits Kir6.2 (KCNJ11) and SUR1 (ABCC8) in diabetes mellitus and hyperinsulinism. Hum Mutat. 2006;27(3):220–231. | ||
Gouda H, Sagoo G, Harding A, Yates J, Sandhu M, Higgins JP. The association between the peroxisome proliferator-activated receptor-g2 (PPARG2) Pro12Ala gene variant and type 2 diabetes mellitus: a HuGE review and meta-analysis. Am J Epidemiol. 2010;171(6):645–655. | ||
Sladek R, Rocheleau G, Rung J, et al. A genome-wide association study identifies novel risk loci for type 2 diabetes. Nature. 2007;445(7130):881–885. | ||
Diabetes Genetics Initiative of Broad Institute of Harvard and MIT, Lund University, and Novartis Institutes of BioMedical Research, Saxena R, Voight B, et al. Genome-wide association analysis identifies loci for type 2 diabetes and triglyceride levels. Science. 2007;316(5829):1331–1336. | ||
Frayling T. Genome-wide association studies provide new insights into type 2 diabetes aetiology. Nat Rev Genet. 2007;8(9):657–662. | ||
Peng S, Zhu Y, Lü B, Xu F, Li X, Lai M. TCF7L2 gene polymorphisms and type 2 diabetes risk: a comprehensive and updated meta-analysis involving 121,174 subjects. Mutagenesis. 2013;28(1):25–37. | ||
Li H, Tang X, Liu Q, Wang Y. Association between type 2 diabetes and rs10811661 polymorphism upstream of CDKN2A/B: a meta-analysis. Acta Diabetol. 2013;50(5):657–662. | ||
Xiao S, Zeng X, Fan Y, et al. Gene polymorphism association with type 2 diabetes and related gene-gene and gene-environment interactions in a Uyghur population. Med Sci Monit. 2016;22:474–487. | ||
Chimienti F, Devergnas S, Favier A, Seve M. Identification and cloning of a beta-cell-specific zinc transporter, ZnT-8, localized into insulin secretory granules. Diabetes. 2004;53(9):2330–2337. | ||
Zhang H, Wu J, Yu L. Association of Gln27Glu and Arg16Gly polymorphisms in Beta2-adrenergic receptor gene with obesity susceptibility: a meta-analysis. PLoS One. 2014;9(6):e100489. | ||
Zhong J, Rodríguez A, Yang N, Li L. Methylenetetrahydrofolate reductase gene polymorphism and risk of type 2 diabetes mellitus. PLoS One. 2013;8(9):e74521. | ||
Raza S, Abbas S, Siddiqi Z, Mahdi F. Association between ACE (rs4646994), FABP2 (rs1799883), MTHFR (rs1801133), FTO (rs9939609) genes polymorphism and type 2 diabetes with dyslipidemia. Int J Mol Cell Med. 2017;6(2):121–130. | ||
Patterson N, Price AL, Reich D. Population structure and eigenanalysis. PLoS Genet. 2006;2(12):e190. | ||
Hodoğlugil U, Mahley R. Turkish population structure and genetic ancestry reveal relatedness among Eurasian populations. Ann Hum Genet. 2012;76(2):128–141. | ||
Jakobsson M, Scholz SW, Scheet P, et al. Genotype, haplotype and copynumber variation in worldwide human populations. Nature. 2008;451(7181):998–1003. | ||
Iskakova A, Romanova A, Aitkulova A, Sikhayeva N, Zholdybayeva E, Ramamculov E. Polymorphisms in genes involved in the absorption, distribution, metabolism, and excretion of drugs in the Kazakhs of Kazakhstan. BMC Genet. 2016;17:23. | ||
Comas D, Calafell F, Mateu E, et al. Trading genes along the silk road: mtDNA sequences and the origin of central Asian populations. Am J Hum Genet. 1998;63(6):1824–1838. | ||
Lalueza-Fox C, Sampietro M, Gilbert M, et al. Unravelling migrations in the steppe: mitochondrial DNA sequences from ancient central Asians. Proc Biol Sci. 2004;271(1542):941–947. | ||
Gonzalez-Ruiz M, Santos C, Jordana X, et al. Tracing the origin of the east-west population admixture in the Altai region (Central Asia). PLoS One. 2004;7(11):e48904. | ||
Zhang Z, Wei S, Gui H, Yuan Z, Li S. The contribution of genetic diversity to subdivide populations living in the silk road of China. PLoS One. 2014;9(5):e97344. | ||
Kautzky-Willer A, Harreiter J, Pacini G. Sex and gender differences in risk, pathophysiology and complications of type 2 diabetes mellitus. Endocr Rev. 2016;37(3):278–316. | ||
Mattei J, Parnell L, Lai C, et al. Disparities in allele frequencies and population differentiation for 101 disease-associated single nucleotide polymorphisms between Puerto Ricans and non-Hispanic whites. BMC Genet. 2009;10:45. | ||
Lohmueller K, Mauney M, Reich D, Braverman J. Variants associated with common disease are not unusually differentiated in frequency across populations. Am J Hum Genet. 2006;78(1):130–136. |
 © 2018 The Author(s). This work is published and licensed by Dove Medical Press Limited. The full terms of this license are available at https://www.dovepress.com/terms.php and incorporate the Creative Commons Attribution - Non Commercial (unported, v3.0) License.
By accessing the work you hereby accept the Terms. Non-commercial uses of the work are permitted without any further permission from Dove Medical Press Limited, provided the work is properly attributed. For permission for commercial use of this work, please see paragraphs 4.2 and 5 of our Terms.
© 2018 The Author(s). This work is published and licensed by Dove Medical Press Limited. The full terms of this license are available at https://www.dovepress.com/terms.php and incorporate the Creative Commons Attribution - Non Commercial (unported, v3.0) License.
By accessing the work you hereby accept the Terms. Non-commercial uses of the work are permitted without any further permission from Dove Medical Press Limited, provided the work is properly attributed. For permission for commercial use of this work, please see paragraphs 4.2 and 5 of our Terms.