Back to Journals » Clinical Interventions in Aging » Volume 13
Twenty-four-hour ambulatory blood-pressure variability is associated with total magnetic resonance-imaging burden in cerebral small-vessel disease
Authors Yang S, Yuan J ![]() , Qin W, Yang L, Fan H, Li Y, Hu W
, Qin W, Yang L, Fan H, Li Y, Hu W ![]()
Received 16 April 2018
Accepted for publication 1 June 2018
Published 10 August 2018 Volume 2018:13 Pages 1419—1427
DOI https://doi.org/10.2147/CIA.S171261
Checked for plagiarism Yes
Review by Single anonymous peer review
Peer reviewer comments 2
Editor who approved publication: Dr Zhi-Ying Wu
Shuna Yang,* Junliang Yuan,* Wei Qin, Lei Yang, Huimin Fan, Yue Li, Wenli Hu
Department of Neurology, Beijing Chaoyang Hospital, Capital Medical University, Beijing, China
*These authors contributed equally to this work
Background: Lacunae, brain atrophy, white matter hyperintensity, enlarged perivascular space and microbleed are magnetic resonance imaging (MRI) markers of cerebral small-vessel disease (cSVD). Studies have reported that higher blood pressure variability (BPV) predicted cardiovascular risk in hypertensive patients; however, the association between BPV and the total MRI burden of cSVD has not been investigated. In this study, we aimed to explore this relationship between BPV and cSVD MRI burden.
Methods: We prospectively recruited patients who attended our hospital for annual physical examination. Twenty-four-hour ambulatory BP monitoring was performed using an automated system. BPV was quantified by SD, weighted SD, and coefficient of variation. One point was awarded for the presence of each marker, producing a score between 0 and 5. Spearman correlation and ordinal logistic regression analyses were used to test the relationship between BPV and total cSVD MRI burden.
Results: A total of 251 subjects with an average age of 68 years were enrolled in this study, and 52.6% were male; 163 (64.94%) had one or more markers of cSVD. Correlation analysis indicated that higher systolic BP (SBP) levels and BPV metrics of SBP were positively related to higher cSVD burden. Ordinal logistic regression analyses demonstrated that higher SBP levels and SBP variability were independent risk factors for cSVD. There were no significant differences in 24-hour, day and night diastolic BP levels or BPV metrics of diastolic BP among the five subgroups.
Conclusion: Twenty-four-hour, day and night SBP levels and SBP variability were positively related to cSVD burden. Higher SBP levels and SBP variability were independent risk factors for cSVD.
Keywords: cerebral small-vessel diseases, blood pressure variability, ambulatory blood pressure monitoring, magnetic resonance-imaging burden
Introduction
Cerebral small-vessel disease (cSVD) is caused by a group of pathological processes involving the perforating cerebral arterioles, capillaries, and venules of the brain.1 Lacunae (small subcortical cerebral spinal fluid-containing cavities, typically >3 mm and <15 mm in diameter), brain atrophy (lower brain volume not related to a specific macroscopic focal injury, such as trauma), white-matter hyperintensity (WMH; hyperintense areas on T2-weighted sequences and fluid-attenuated inversion recovery [FLAIR], isointense or hypointense areas on T1-weighted sequences with respect to normal brain), enlarged perivascular space (EPVS; perivascular compartments following the courses of small penetrating cerebral vessels, similar signal to cerebral spinal fluid), and microbleed (small punctate areas of hypointense on T2*- or susceptibility-weighted imaging [SWI] that are up to 10 mm in diameter) are considered magnetic resonance imaging (MRI) markers of cSVD.2,3 cSVD is a common vascular factor in dementia, a major contributor to mixed dementia, and the cause of about a fifth of all strokes worldwide.2 However, the pathogenesis of cSVD is not completely understood. Hypertension is a well-known major risk factor for cSVD.4,5 Twenty-four-hour ambulatory blood pressure monitoring (ABPM) has been proven to be a more useful and scientific method for predicting BP-related brain damage than single office BP measurement,6,7 and 24-hour ABP variability (ABPV) can be documented by 24-hour ABPM.
Previous studies have shown that increased 24-hour ABPV is associated with increased target-organ damage, including cardiovascular and cerebrovascular events.8–10 Recent studies have demonstrated that higher 24-hour ABPV is associated with WMH, lacunar infarction, cSVD progression, and cognitive decline.11,12 In addition, some studies have found that higher 24-hour ABP levels are related to WMH, EPVS, and new cerebral microbleeds.13–15 However, these studies mostly focused separately on different MRI markers of cSVD. A “total cSVD score” was introduced to combine all single MRI markers of cSVD into one measure, which aimed to evaluate the total brain damage from cSVD.16,17 Age, hypertension, higher ABP levels, and other risk factors for cSVD have been found to be associated with total cSVD score.16,17 The previous “total cSVD score” did not take brain atrophy into consideration. Imaging studies have reported that the presence and severity of cSVD are associated with brain atrophy.18,19 Additionally, brain atrophy has been considered an important imaging measure in several studies that aimed to assess vascular damage to the brain, and it is thought to mediate, at least partially, the effects of vascular lesions on cognition.2,20,21 A scientific statement for cSVD from the American Heart Association/American Stroke Association also included brain atrophy as an MRI marker of cSVD.3 Therefore, in our opinion, brain atrophy should be included in the total cSVD score. To the best of our knowledge, no study has explored the relationship between 24-hour ABPV and total MRI burden of cSVD, including lacunae, brain atrophy, WMH, EPVS, and microbleeds. Therefore, in this study, we aimed to investigate the association between 24-hour ABPV and total MRI cSVD burden.
Methods
Subjects
We conducted this as a cross-sectional study. Inpatients for physical examinations in the Neurology Department of Beijing Chaoyang Hospital, affiliated with Capital Medical University, were prospectively identified from June 15, 2016, to June 31, 2017. They were screened according to our inclusion and exclusion criteria. Inclusion criteria were that the patient underwent both brain MRI scans and 24-hour ABPM within 1 month, agreed to participate in our study, and provided signed informed consent. To reduce the influence of confounding factors, such as inaccurate assessments on cSVD, patients were excluded on the basis of severe traumatic, toxic, or infectious brain injury or brain tumor; history of dementia, severe ischemic stroke (largest diameter of infarct >20 mm on diffusion-weighted imaging and FLAIR), or hemorrhagic stroke, because of difficult and inaccurate assessments on MRI markers of cSVD; possible cardioembolic risk factors (most commonly atrial fibrillation or valvular prosthesis) or large-vessel cerebrovascular diseases, defined as internal carotid, middle cerebral, or basilar intracranial artery stenosis >50%; invalid 24-hour ABPM data (24-hour ABPM data considered invalid if measurement <70%, less than one measurement per hour during daytime and fewer than six measurements in total during nighttime); and recent myocardial infarction or angina pectoris disorders, other severe heart diseases, severe infections, severe nephrosis or liver diseases, thrombotic diseases, or tumors. The study was approved by the ethics committee of Beijing Chaoyang Hospital and performed in accordance with the Declaration of Helsinki. All subjects provided written informed consent.
MRI protocol and assessments
MRI was performed using a 3.0 T scanner (Siemens, Berlin, Germany) in the Radiology Department of our hospital. Sequences included diffusion-weighted, T1-weighted, and T2-weighted imaging; FLAIR; and SWI. Imaging markers and burden of cSVD are defined in the following paragraphs.
Lacunae, brain atrophy, WMH, EPVS, and microbleed were defined as described previously.2 We distinguished lacunae from EPVS by their size (>3 mm), spheroid shape, location, and surrounding hyperintensity on FLAIR and T2-weighted imaging.3 Brain atrophy was evaluated according to the visual rating scale of Pasquier et al.22 In mild brain atrophy, there is a peripheral sulcal opening, moderate atrophy is characterized by widening along the length of the sulci, and severe atrophy is defined by gyral thinning. WMH was rated using the Fazekas scale on FLAIR images.23 The number of EPVSs at the basal ganglia was rated on T2-weighted images: grade 1, <5; grade 2, 5–10; grade 3, >10 but still countable; grade 4, innumerable.24,25 We counted only EPVSs at the basal ganglia, because those at the basal ganglia are considered a marker of cSVD.24,26
The definition and rating method of total cSVD score have been described previously.16,17 However, we added brain atrophy as an item, because it is considered an MRI marker of cSVD. An ordinal score of 0–5 was constructed to reflect the total cSVD burden. One point was awarded for each of moderate–extensive brain atrophy; one or more lacunae; periventricular WMH Fazekas score of 3 or deep WMH Fazekas score of 2 or 3; one or more deep or infratentorial microbleeds (deep or infratentorial microbleeds are related to cSVD, whereas lobar microbleeds are related to cerebral amyloid angiopathy);27,28 and moderate–extensive (more than ten) EPVSs in the basal ganglia.
MRI assessments were performed by two experienced neurologists who were blinded to the clinical information. Intrarater agreement for cSVD rating was assessed with a random sample of 50 individuals with a month-long interval between the first and second readings. Random scans of 50 individuals were independently examined by two experienced neurologists who were blinded to each other’s readings. The k-values of intrarater and interrater agreement were ≥0.7, which indicated good reliability. Disagreements were resolved by discussion with coauthors.
24-Hour ABPM and definitions of 24-hour ABPV
Twenty-four-hour ABPM was performed using an automated system (TM-2430; A&D, Tokyo, Japan), which has been validated according to the protocols of the British Hypertension Society.29 The automated system recorded BP using the oscillometric method. ABPM recordings were carried out during participants’ hospital stay, and they were asked to conduct their usual activities as much as possible, but to refrain from physical exercise and avoid excessive movement of their nondominant arm during measurements. BP was measured every 30 minutes during the day (8 am to 11 pm) and every 60 minutes during the night (11 pm to 8 am). The definition of daytime and nighttime adopted the standard time windows according to the automated system. We excluded a 2-hour transition period (first and last hours of the standard time) to ensure that actual waking and sleep periods were within this standard period. Mean systolic BP (SBP), diastolic BP (DBP), coefficient of variation (CV), and SD of SBP and DBP were collected over 24 hours. CV values were defined as the ratio between the SD and mean SBP or DBP at the same period. Weighted SD values of SBP and DBP were defined as means of day and night SD values corrected for the number of hours included in each of these periods.11,30 SD, weighted SD, and CV were considered metrics of 24-hour ABPV in this study. Patients continued their previous medications, and we noted the use of antihypertensive drugs.
Statistical analysis
Continuous variables are presented as mean ± SD for normally distributed variables and medians (interquartile range) for abnormally distributed variables. Analysis of variance was used for comparison of continuous variables with both normal distribution and homogeneity of variance; otherwise, the Kruskal–Wallis test was used. Categorical variables are presented as absolute numbers and percentages, and χ2-tests were used for comparison of categorical variables. Spearman correlation analysis was used to test the correlation of 24-hour ABPV with total burden of cSVD. The proportional odds assumption was met; therefore, ordinal logistic regression analysis was performed to determine whether indices of 24-hour ABPV were independent risk factors for cSVD after adjusting for demographic confounders, including age, sex, current smoking, current alcohol, diabetes mellitus, hyperlipidemia, body-mass index, use of antihypertensive drugs, and mean SBP during the same period. Results are based on valid data. Analyses were performed with SPSS version 21.0 and statistical significance set at P<0.05.
Results
Participant characteristics
A total of 274 patients met the inclusion criteria in the Neurology Department of our hospital from June 15, 2016, to March 31, 2017. Nine patients were excluded because of their history of severe or hemorrhagic stroke, five excluded because of a history of tumors, and nine excluded because of invalid ABPM data, leaving 251 patients enrolled in the present study. The mean age was 68 years, and 52.6% of patients were male. Table 1 shows the characteristics of all enrolled subjects.
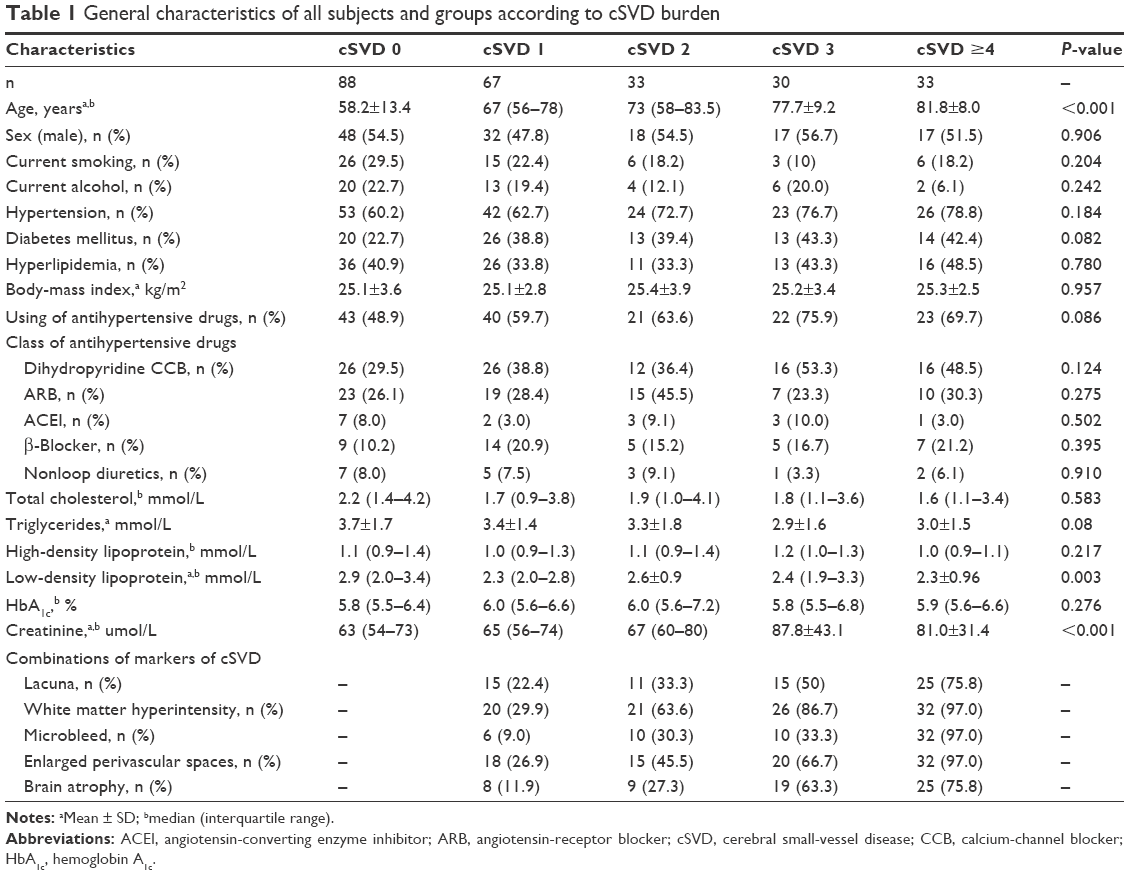 | Table 1 General characteristics of all subjects and groups according to cSVD burden |
With regard to cSVD burden, 88 (35.06%) patients had no markers of cSVD, 67 (26.69%) had one marker, 33 (13.15%) had two markers, 30 (11.95%) had three markers, 29 (11.55%) had four markers, and four (1.59%) had all the markers. Figure 1 shows the composition of the different cSVD categories. We combined four markers and five markers into one group for statistical analysis, because there were only four patients with all five markers. As such, we classified all subjects into five groups based on MRI markers of cSVD. Table 1 presents the characteristics of the patients in the five groups.
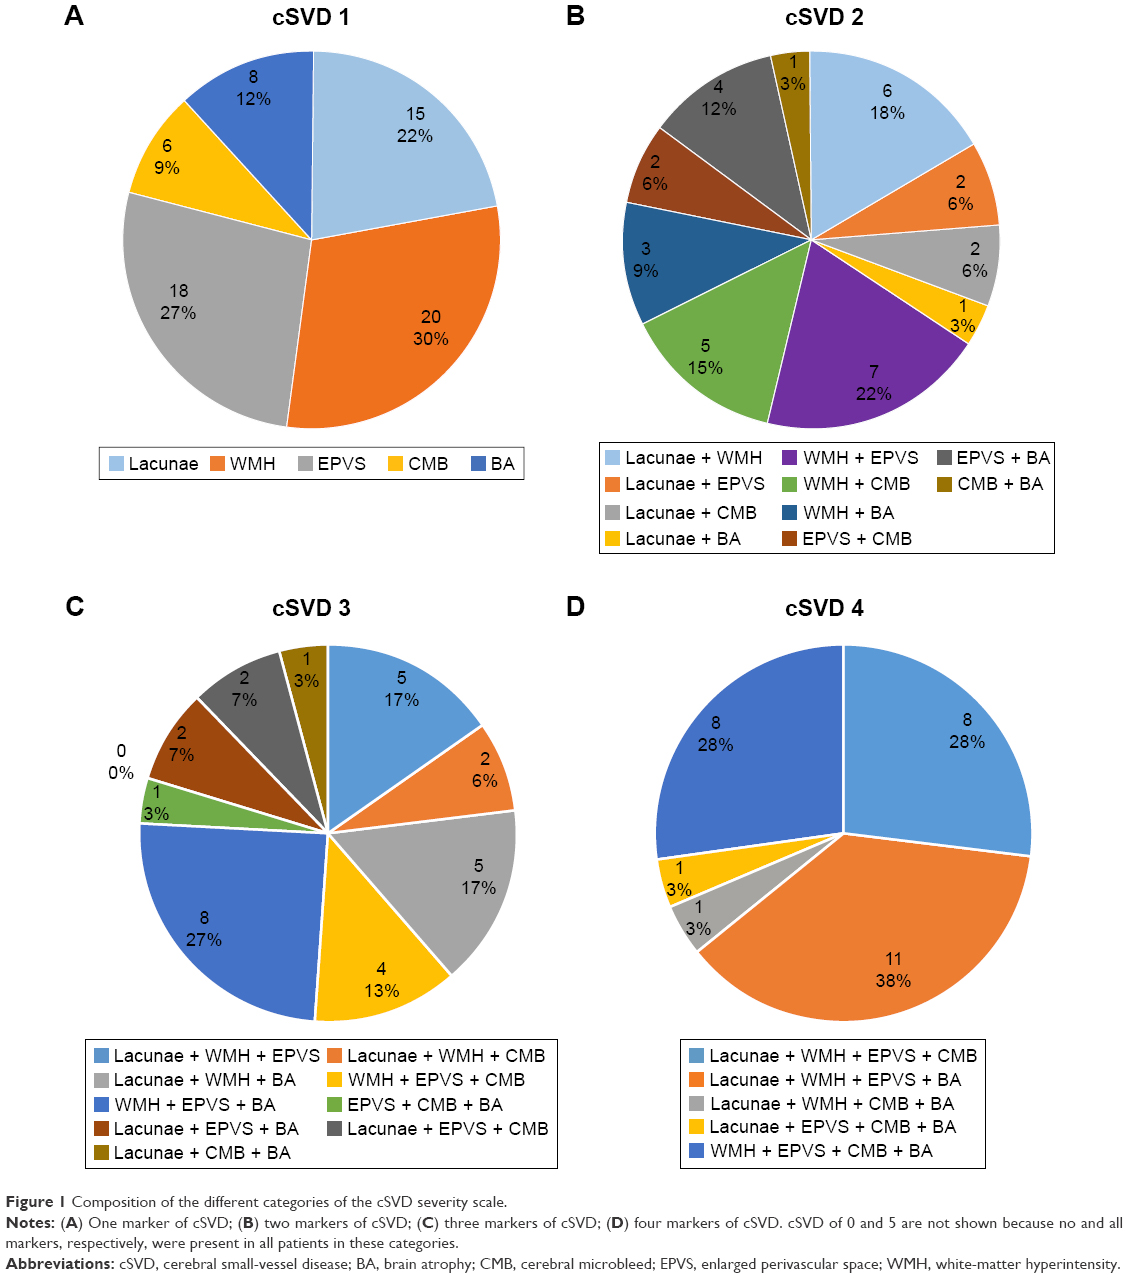 | Figure 1 Composition of the different categories of the cSVD severity scale. |
Among the five groups, age differed significantly, with higher ages in groups with greater numbers of markers (58.2±13.4 years, 67.0±12.4 years, 71.6±13.2 years, 77.7±9.2 years, and 81.8±8.0 years, respectively, ρ=0.575; P<0.001). The ordinal logistic regression analysis demonstrated that age was a determining factor for developing cSVD (OR 1.09, 95% CI 1.07–1.12; P<0.001). There were statistical differences in low-density lipoprotein (LDL) and creatinine levels among the five groups (P<0.05). LDL level was negatively correlated with cSVD burden (ρ=−0.195, P=0.002) and creatinine level positively correlated with cSVD burden (ρ=0.290, P<0.001). The ordinal logistic regression analysis showed that LDL and creatinine levels were not an independent risk factor for cSVD after adjusting for age and hypertension (P>0.05). Sex, smoking, alcohol, use of antihypertensive drugs, and type of antihypertensive drugs did not differ significantly among the groups (P>0.05). Notably, the proportion of patients with hypertension and diabetes mellitus increased with an increasing cSVD burden; however, the differences were not statistically significant (P>0.05). There were no significant differences in body mass index or levels of total cholesterol, triglycerides, high-density lipoprotein, and HbA1c among the groups.
Association between 24-hour ABP levels and total burden of cSVD
Table 2 presents 24-hour ABP levels of the five subgroups stratified by total cSVD burden. SBP levels increased with increasing cSVD burden (P<0.01) over 24 hours, daytime, and nighttime. Spearman correlation analysis indicated that higher SBP levels were positively correlated with higher cSVD burden (24-hour SBP, ρ=0.251, P<0.001; day SBP, ρ=0.217, P=0.001; night SBP, ρ=0.331, P=0.001). These correlations were unchanged after controlling for age. Ordinal logistic regression analysis demonstrated that higher SBP was an independent risk factor for cSVD after controlling for age and other confounders (Table 3). There were no significant differences in DBP levels among the five subgroups for 24 hours, daytime, or nighttime. Spearman correlation analysis indicated that DBP levels were not significantly related to the burden of cSVD in this study (24-hour DBP: ρ=−0.027, P=0.666; day DBP: ρ=−0.070, P=0.271; night DBP: ρ=0.066, P=0.301).
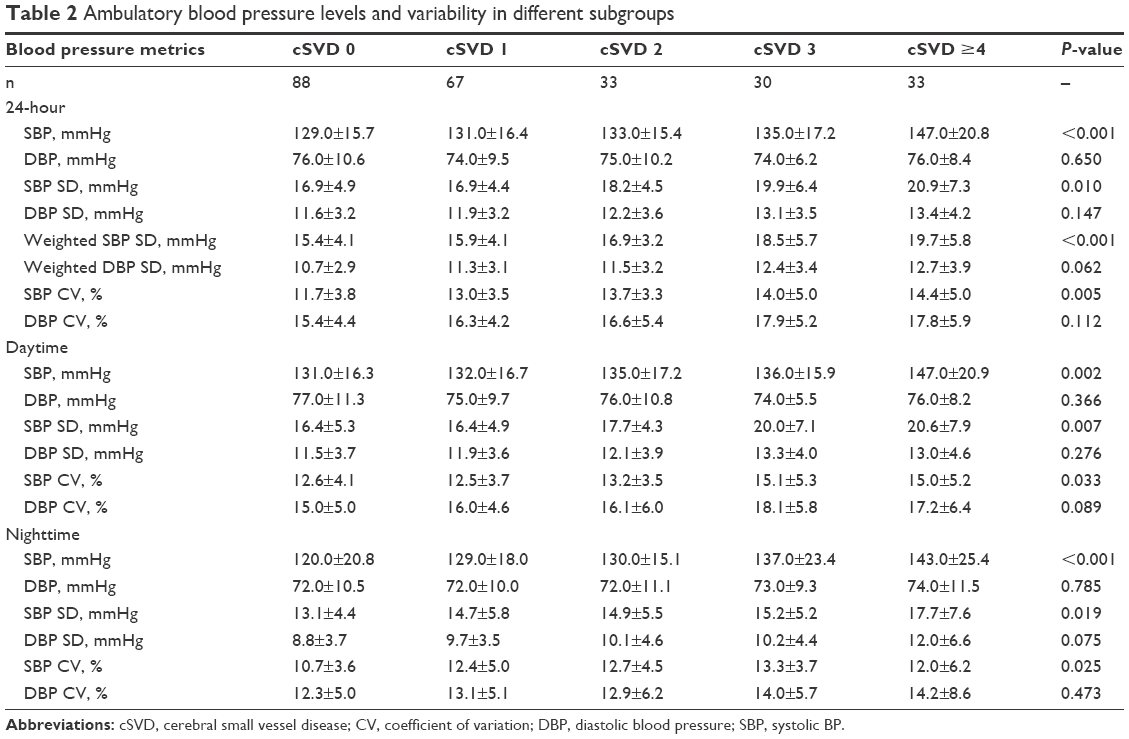 | Table 2 Ambulatory blood pressure levels and variability in different subgroups |
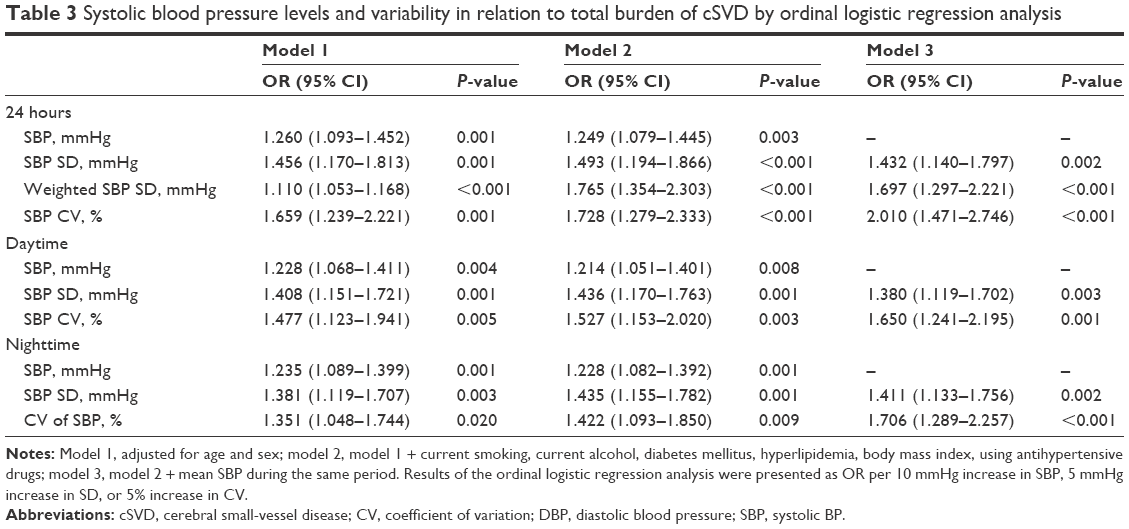 | Table 3 Systolic blood pressure levels and variability in relation to total burden of cSVD by ordinal logistic regression analysis |
Association between 24-hour ABPV and total burden of cSVD
The 24-hour ABPV metrics, including SD, weighted SD, and CV, of the five groups divided by total cSVD burden are presented in Table 2. We found that there were statistical differences in variability metrics of SBP among the five groups during all periods, which increased as the burden of cSVD increased. There were no statistical differences in variability metrics of DBP among the five groups. Spearman correlation analysis also indicated that higher variability metrics of SBP were positively correlated with higher cSVD burden (ρ>0, P<0.05). Ordinal logistic regression analysis demonstrated that higher SBPV was a risk factor for cSVD after adjusting for age and other confounding factors (Table 3).
Discussion
In this study, we explored associations among 24-hour ABP levels, 24-hour ABPV, and total cSVD MRI burden in patients who underwent physical examinations in our hospital. We found that SBP levels and 24-hour SBPV increased with the MRI burden of cSVD in 24 hours and during daytime and nighttime. The results of ordinal logistic regression analysis showed that SBP levels and 24-hour SBPV were independent risk factors for cSVD after controlling for confounders. There was no significant association between DBP levels and 24-hour DBPV or MRI burden of cSVD. To the best of our knowledge, this is the first study to demonstrate that 24-hour SBPV is associated with the MRI burden of cSVD in a population of patients receiving physical examinations.
Several studies have investigated the relationship between individual cSVD markers and ABP levels or 24-hour ABPV by 24-hour ABPM.6,7,13–15 However, the results were not exactly the same. In our opinion, it is necessary to investigate the relationship between the combined effect of cSVD and ABP levels, as well as 24-hour ABPV, because cSVD markers may occur simultaneously in a patient and share common pathogeneses. Klarenbeek et al investigated the association between ABP levels and total cSVD MRI burden in patients who had had their first lacunar stroke.16 However, they did not include brain atrophy in their total cSVD-burden score. They found that higher SBP and DBP over 24 hours and during day and night were all significantly associated with increased cSVD MRI burden, which is different from our results. The different results may partially be attributed to the different study populations and different scoring methods. Previous studies have not investigated the association of 24-hour ABPV and total cSVD MRI burden. In this study, we found that 24-hour SBPV increased with increasing cSVD MRI burden, which expands upon the findings of previous studies.
Brain atrophy is considered a marker of cSVD and thought to mediate the effects of vascular lesions on cognition.2,20,21 Several studies have demonstrated that hypertension is an independent risk factor for brain atrophy.31–33 Therefore, our scale included brain atrophy in the total cSVD burden. There are several different rating scales for brain atrophy assessment, including medial temporal lobe atrophy,34 posterior atrophy,35 and global cortical atrophy.22 We used global cortical atrophy assessment in this study, because hypertension affects the whole brain, rather than only part of the brain.
The composition of the groups stratified by cSVD burden in our study was different from that in previous studies. In Yang et al36 and Klarenbeek et al,16 28.6% and 14.6% of patients, respectively, did not exhibit MRI markers of cSVD. In our study, 35.06% of patients had no markers of cSVD, which was higher than results from previous studies. In our opinion, this discrepancy might have been caused by differences in the study populations. The subjects of previous studies were all patients who had had lacunar stroke. Lacunar stroke usually occurs simultaneously with other markers of cSVD in patients. Our study subjects were patients who underwent physical examinations. In addition, different MRI scanners and parameters may influence the SVD score and comparability with other studies. We used SWI to rate microbleeds. The increased signal contrast and higher spatial resolution of SWI increased the confidence of raters that the hypointensity in question and faint nonlinear hypointensity on gradient-recalled echo T2*-weighted imaging indeed represented a true cerebral microbleed. SWI is more sensitive and reliable than gradient-echo T2*-weighted imaging.
The potential pathophysiological mechanisms underlying the association between BP levels and cSVD burden are complex and still not completely understood. Increased permeability of the small-vessel walls and blood–brain barrier has been demonstrated to contribute to the development of cSVD and has been reported to be associated with microvascular endothelial-cell and tight-junction damage.1,37 Higher BP levels and ABPV would lead to more mechanical stress on the vessel wall, which leads to endothelial injury and arterial stiffness.38,39 Therefore, it is reasonable to assume that higher BP and ABPV contribute to the development of cSVD via endothelial-cell damage. In addition, ischemic hypoperfusion is thought to be involved in the pathogenesis of cSVD.1 Higher ABPV with a sudden decrease in BP might result in cerebral hypoperfusion and the development of cSVD. Meanwhile, cSVD could be a cause of higher 24-hour ABPV. Kario et al reported that silent cerebral infarcts were significantly associated with exaggerated morning BP surges in elderly hypertensive patients.40 The adrenergic vasoconstrictor response of small resistance vessels contributes to the degree of morning BP surge, which may be closely related to small-vessel remodeling. Our results showed that SBP and SBP variability, but not DBP or of DBP variability, were associated with cSVD burden; however, the present study could not explain the phenomenon. This might be caused by the greater impact of SBP than DBP on vascular diseases.41
The associations between vascular risk factors and cSVD are still not completely understood. Studies have found that smoking, diabetes mellitus, and obesity are associated with increased arterial stiffness, which is known to predict future cardiovascular and cerebrovascular events and previously found associated with cSVD.42–44 In our study, although there were no statistical differences in the presence of current smoking, diabetes mellitus, or body mass index among the groups, the proportion of patients with diabetes mellitus and high body mass index increased with increasing cSVD burden. Our results were also in accordance with those of previous studies.
There are some limitations in our study. First, our study population was based on hospital patients who underwent physical examinations in a single center, and there might have been selection bias associated with the exclusion of patients with large vessel disease, as well as other variables. Therefore, the cohort may not represent the general population. Second, this was a cross-sectional study, and causal relationships between 24-hour ABPV and cSVD could not be established. Third, all participants underwent ABPM in a hospital that could not vouch for their usual activities. In addition, this is the first attempt to provide an overall score for total cSVD burden, including brain atrophy as an aspecific sign of cSVD. However, additional studies are required to test and modify the scale. Finally, the results in this study should be interpreted with caution, because the subjects enrolled were part of a heterogeneous population that underwent physical examinations in a hospital. Despite these limitations, to the best of our knowledge, our study is the first to demonstrate that 24-hour SBPV is associated with cSVD MRI burden, and the results may provide some information to clinicians about the clinical value of 24-hour ABPV.
Conclusion
We found that SBP levels and 24-hour SBPV over 24 hours and during daytime and nighttime were positively associated with cSVD burden. Moreover, increased SBP levels and SBPV were independent risk factors for cSVD. Further longitudinal studies are required to confirm the causal relationship between 24-hour ABPV and cSVD, and the clinical value of 24-hour ABPV should be assessed in depth with a larger sample in future studies.
Acknowledgments
The authors thank all the study participants. This work was supported by Capital Clinical Features (Z171100001017073, WH) and the Beijing Municipal Administration of Hospitals’ Youth Programme (QML20150303, JY).
Author contributions
WH and SY designed the work. SY, JY, WQ, LY, HF, and YL collected the clinical data, discussed the results, and contributed to the final version of the manuscript. All authors read and approved the final manuscript; contributed toward data analysis, drafting and revising the paper and agree to be accountable for all aspects of the work.
Disclosure
The authors report no conflicts of interest in this work.
References
Pantoni L. Cerebral small vessel disease: from pathogenesis and clinical characteristics to therapeutic challenges. Lancet Neurol. 2010;9(7):689–701. | ||
Wardlaw JM, Smith EE, Biessels GJ, et al. Neuroimaging standards for research into small vessel disease and its contribution to ageing and neurodegeneration. Lancet Neurol. 2013;12(8):822–838. | ||
Smith EE, Saposnik G, Biessels GJ, et al. Prevention of stroke in patients with silent cerebrovascular disease: a scientific statement for healthcare professionals from the American Heart Association/American Stroke Association. Stroke. 2017;48(2):e44–e71. | ||
Veglio F, Paglieri C, Rabbia F, Bisbocci D, Bergui M, Cerrato P. Hypertension and cerebrovascular damage. Atherosclerosis. 2009;205(2):331–341. | ||
Meissner A. Hypertension and the brain: a risk factor for more than heart disease. Cerebrovasc Dis. 2016;42(3–4):255–262. | ||
Ohkubo T, Hozawa A, Nagai K, et al. Prediction of stroke by ambulatory blood pressure monitoring versus screening blood pressure measurements in a general population: the Ohasama study. J Hypertens. 2000;18(7):847–854. | ||
Shimada K, Kawamoto A, Matsubayashi K, Ozawa T. Silent cerebrovascular disease in the elderly: correlation with ambulatory pressure. Hypertension. 1990;16(6):692–699. | ||
Parati G, Pomidossi G, Albini F, Malaspina D, Mancia G. Relationship of 24-hour blood pressure mean and variability to severity of target-organ damage in hypertension. J Hypertens. 1987;5(1):93–98. | ||
Hansen TW, Thijs L, Li Y, et al. Prognostic value of reading-to-reading blood pressure variability over 24 hours in 8938 subjects from 11 populations. Hypertension. 2010;55(4):1049–1057. | ||
Rothwell PM. Does blood pressure variability modulate cardiovascular risk? Curr Hypertens Rep. 2011;13(3):177–186. | ||
Filomena J, Riba-Llena I, Vinyoles E, et al. Short-term blood pressure variability relates to the presence of subclinical brain small vessel disease in primary hypertension. Hypertension. 2015;66(3):634–640. | ||
Yamaguchi Y, Wada M, Sato H, et al. Impact of ambulatory blood pressure variability on cerebral small vessel disease progression and cognitive decline in community-based elderly Japanese. Am J Hypertens. 2014;27(10):1257–1267. | ||
Henskens LH, Kroon AA, van Oostenbrugge RJ, et al. Associations of ambulatory blood pressure levels with white matter hyperintensity volumes in hypertensive patients. J Hypertens. 2009;27(7):1446–1452. | ||
Klarenbeek P, van Oostenbrugge RJ, Lodder J, Rouhl RP, Knottnerus IL, Staals J. Higher ambulatory blood pressure relates to enlarged Virchow-Robin spaces in first-ever lacunar stroke patients. J Neurol. 2013;260(1):115–121. | ||
Klarenbeek P, van Oostenbrugge RJ, Rouhl RP, Knottnerus IL, Staals J. Higher ambulatory blood pressure relates to new cerebral microbleeds: 2-year follow-up study in lacunar stroke patients. Stroke. 2013;44(4):978–983. | ||
Klarenbeek P, van Oostenbrugge RJ, Rouhl RP, Knottnerus IL, Staals J. Ambulatory blood pressure in patients with lacunar stroke: association with total MRI burden of cerebral small vessel disease. Stroke. 2013;44(11):2995–2999. | ||
Staals J, Makin SD, Doubal FN, Dennis MS, Wardlaw JM. Stroke subtype, vascular risk factors, and total MRI brain small-vessel disease burden. Neurology. 2014;83(14):1228–1234. | ||
Appelman AP, Exalto LG, van der Graaf Y, Biessels GJ, Mali WP, Geerlings MI. White matter lesions and brain atrophy: more than shared risk factors? A systematic review. Cerebrovasc Dis. 2009;28(3):227–242. | ||
Aribisala BS, Hernández MC, Royle NA, et al. Brain atrophy associations with white matter lesions in the ageing brain: the Lothian Birth Cohort 1936. Eur Radiol. 2013;23(4):1084–1109. | ||
Levy-Cooperman N, Ramirez J, Lobaugh NJ, Black SE. Misclassified tissue volumes in Alzheimer disease patients with white matter hyperintensities: importance of lesion segmentation procedures for volumetric analysis. Stroke. 2008;39(4):1134–1141. | ||
Carmichael O, Schwarz C, Drucker D, et al. Longitudinal changes in white matter disease and cognition in the first year of the Alzheimer Disease Neuroimaging Initiative. Arch Neurol. 2010;67(11):1370–1378. | ||
Pasquier F, Leys D, Weerts JG, Mounier-Vehier F, Barkhof F, Scheltens P. Inter- and intraobserver reproducibility of cerebral atrophy assessment on MRI scans with hemispheric infarcts. Eur Neurol. 1996;36(5):268–272. | ||
Fazekas F, Chawluk JB, Alavi A, Hurtig HI, Zimmerman RA. MR signal abnormalities at 1.5 T in Alzheimer’s dementia and normal aging. AJR Am J Roentgenol. 1987;149(2):351–356. | ||
Zhu YC, Tzourio C, Soumaré A, Mazoyer B, Dufouil C, Chabriat H. Severity of dilated Virchow-Robin spaces is associated with age, blood pressure, and MRI markers of small vessel disease: a population-based study. Stroke. 2010;41(11):2483–2490. | ||
Zhang C, Chen Q, Wang Y, et al. Risk factors of dilated Virchow-Robin spaces are different in various brain regions. PLoS One. 2014;9(8):e105505. | ||
Doubal FN, Maclullich AM, Ferguson KJ, Dennis MS, Wardlaw JM. Enlarged perivascular spaces on MRI are a feature of cerebral small vessel disease. Stroke. 2010;41(3):450–454. | ||
Staals J, van Oostenbrugge RJ, Knottnerus IL, Rouhl RP, Henskens LH, Lodder J. Brain microbleeds relate to higher ambulatory blood pressure levels in first-ever lacunar stroke patients. Stroke. 2009;40(10):3264–3268. | ||
Vernooij MW, van der Lugt A, Ikram MA, et al. Prevalence and risk factors of cerebral microbleeds: the Rotterdam Scan Study. Neurology. 2008;70(14):1208–1214. | ||
Palatini P, Frigo G, Bertolo O, et al. Validation of the A&D TM-2430 device for ambulatory blood pressure monitoring and evaluation of performance according to subjects’ characteristics. Blood Press Monit. 1998;3(4):255–260. | ||
Bilo G, Giglio A, Styczkiewicz K, et al. A new method for assessing 24-h blood pressure variability after excluding the contribution of nocturnal blood pressure fall. J Hypertens. 2007;25(10):2058–2066. | ||
Nunes PV, Suemoto CK, Leite RE, et al. Factors associated with brain volume in major depression in older adults without dementia: results from a large autopsy study. Int J Geriatr Psychiatry. 2018;33(1):14–20. | ||
Gonzalez CE, Pacheco J, Beason-Held LL, Resnick SM. Longitudinal changes in cortical thinning associated with hypertension. J Hypertens. 2015;33(6):1242–1248. | ||
Tchistiakova E, Anderson ND, Greenwood CE, Macintosh BJ. Combined effects of type 2 diabetes and hypertension associated with cortical thinning and impaired cerebrovascular reactivity relative to hypertension alone in older adults. Neuroimage Clin. 2014;5:36–41. | ||
Scheltens P, Leys D, Barkhof F, et al. Atrophy of medial temporal lobes on MRI in “probable” Alzheimer’s disease and normal ageing: diagnostic value and neuropsychological correlates. J Neurol Neurosurg Psychiatry. 1992;55(10):967–972. | ||
Koedam EL, Lehmann M, van der Flier WM, et al. Visual assessment of posterior atrophy development of a MRI rating scale. Eur Radiol. 2011;21(12):2618–2625. | ||
Yang S, Cai J, Lu R, Wu J, Zhang M, Zhou X. Association between serum cystatin C level and total magnetic resonance imaging burden of cerebral small vessel disease in patients with acute lacunar stroke. J Stroke Cerebrovasc Dis. 2017;26(1):186–191. | ||
Wardlaw JM, Smith C, Dichgans M. Mechanisms of sporadic cerebral small vessel disease: insights from neuroimaging. Lancet Neurol. 2013;12(5):483–497. | ||
Diaz KM, Veerabhadrappa P, Kashem MA, et al. Visit-to-visit and 24-h blood pressure variability: association with endothelial and smooth muscle function in African Americans. J Hum Hypertens. 2013;27(11):671–677. | ||
Schillaci G, Bilo G, Pucci G, et al. Relationship between short-term blood pressure variability and large-artery stiffness in human hypertension: findings from 2 large databases. Hypertension. 2012;60(2):369–377. | ||
Kario K, Pickering TG, Hoshide S, et al. Morning blood pressure surge and hypertensive cerebrovascular disease: role of the alpha adrenergic sympathetic nervous system. Am J Hypertens. 2004;17(8):668–675. | ||
Liao D, Cooper L, Cai J, et al. The prevalence and severity of white matter lesions, their relationship with age, ethnicity, gender, and cardiovascular disease risk factors: the ARIC Study. Neuroepidemiology. 1997;16(3):149–162. | ||
Saji N, Toba K, Sakurai T. Cerebral small vessel disease and arterial stiffness: tsunami effect in the brain? Pulse (Basel). 2016;3(3–4):182–189. | ||
Poels MM, Zaccai K, Verwoert GC, et al. Arterial stiffness and cerebral small vessel disease: the Rotterdam Scan Study. Stroke. 2012;43(10):2637–2642. | ||
Mattace-Raso FU, van der Cammen TJ, Hofman A, et al. Arterial stiffness and risk of coronary heart disease and stroke: the Rotterdam Study. Circulation. 2006;113(5):657–663. |
 © 2018 The Author(s). This work is published and licensed by Dove Medical Press Limited. The
full terms of this license are available at https://www.dovepress.com/terms
and incorporate the Creative Commons Attribution
- Non Commercial (unported, 3.0) License.
By accessing the work you hereby accept the Terms. Non-commercial uses of the work are permitted
without any further permission from Dove Medical Press Limited, provided the work is properly
attributed. For permission for commercial use of this work, please see paragraphs 4.2 and 5 of our Terms.
© 2018 The Author(s). This work is published and licensed by Dove Medical Press Limited. The
full terms of this license are available at https://www.dovepress.com/terms
and incorporate the Creative Commons Attribution
- Non Commercial (unported, 3.0) License.
By accessing the work you hereby accept the Terms. Non-commercial uses of the work are permitted
without any further permission from Dove Medical Press Limited, provided the work is properly
attributed. For permission for commercial use of this work, please see paragraphs 4.2 and 5 of our Terms.