")
Back to Journals » Clinical Ophthalmology » Volume 17
Trends in the National Ophthalmological Healthcare Focusing on Cataract, Retina, and Glaucoma Over 15 Years in Japan
Authors Chihara E
Received 11 August 2023
Accepted for publication 10 October 2023
Published 20 October 2023 Volume 2023:17 Pages 3131—3148
DOI https://doi.org/10.2147/OPTH.S431060
Checked for plagiarism Yes
Review by Single anonymous peer review
Peer reviewer comments 4
Editor who approved publication: Dr Scott Fraser
Etsuo Chihara1– 3
1Sensho-kai Eye Institute, Kyoto, 611-0043, Japan; 2Kyoto Ophthalmologist Association, Kyoto Prefectural Medical Hall, Kyoto, 604-8585, Japan; 3Department of Ophthalmology, Shimane University, Faculty of Medicine, Izumo, Shimane, 693-8501, Japan
Correspondence: Etsuo Chihara, Sensho-kai Eye Institute, Minamiyama 50-1, Iseda. Uji, Kyoto, 611-0043, Japan, Tel +81-774-45-2060, Fax +81-774-45-4565, Email [email protected]
Abstract: To assess the trends in ophthalmic healthcare, especially those of cataract, vitreo-retinal diseases, and glaucoma, the national data from the Japanese Ministry of Health, Labour and Welfare, which recorded medical practices for 126.1 million citizens, were studied for 15 years. The volume and expenses of cataract surgeries increased during this period; however, non-surgical expenses decreased. As a result, the total national cataract healthcare expenses decreased over the 15-year period. The volume of vitrectomies increased from 2007 to 2013. After introduction of anti-vascular endothelial growth factor (VEGF) injections, the number of injections increased 8.4 times from 2010 to 2021, while the volume of vitrectomy and retinal photocoagulation declined after 2019 and 2017, respectively. Minimally invasive glaucoma and long-tube shunt surgeries began to increase in 2015 and 2014, respectively. This trend contrasts with the decrease in trabeculectomies after 2019. The coronavirus disease-19 pandemic caused a 30.9% decrease in ophthalmological surgery expenses in 2020. The decreases in volume and expense were greater for cataract surgeries than for other surgeries. The pandemic had a stronger impact on ophthalmological healthcare than that on general medical healthcare. Advancements in technology and methodology have led to cost savings in national cataract healthcare, vitrectomy, and retinal photocoagulation while caused increase in the volume and expenditure of glaucoma surgeries and anti-VEGF injections over a span of 15 years in Japan.
Keywords: medical cost, Japan, cataract, retina, glaucoma, vascular endothelial growth factor, minimally invasive glaucoma surgery
Introduction
From a socio-economic perspective, an analysis of social needs and the volume of medical services supplied to maintain people’s health is important. The national need for healthcare changes over time, and advancements in medical techniques can also impact the quality and quantity of healthcare services. Examining the trends in national healthcare may offer valuable insights into social needs. However, the national medical system is complex, and only a few reports made comprehensive nationwide investigations into medical healthcare trends.1 Unusual event such as the coronavirus disease-19 (COVID-19) dissemination may occur sporadically and restrict regular medical activities.
This study analyzed big data provided by the Ministry of Health, Labour and Welfare (MHLW) to explore the long-term trends in ophthalmological healthcare, with a particular emphasis on cataracts, vitreo-retinal diseases, and glaucoma in Japan over a 15-year period.
Materials and Methods
Japan is a unique country where a single medical insurance system covers all essential medical care for its citizens, with over 98% of its citizens covered by the national public insurance scheme, and is appropriate to study general trends in the medical healthcare.
As a general rule, all citizens are required to enroll in a specific nationwide insurance system and pay premiums. The MHLW records the volume and cost of nationwide medical practices and citizens have free access to government-constructed big data on medical practices. Therefore, I can examine the nationwide volume and expenses for specific medical healthcare.
Data on the Statistics of Medical Care Activities in Public Health Insurance (MCAPHI) and Estimate of National Medical Care Expenditure (ENMCE), maintained by Japan’s MHLW, were retrieved from the eStat section on the MHLW website for analysis. Medical expenses related to national medical and ophthalmological healthcare (H00-59) were examined for June of each year. This study placed special emphasis on examining the volume and expenditure for cataract, vitreo-retinal, and glaucoma surgeries.
Concerning cataract healthcare, separate analyses were conducted on both surgical and cumulative non-surgical expenses, which encompassed examinations, prescription costs, non-surgical ocular treatments, and hospitalization fees.
In this study, the expenses for “general” medical healthcare covered the expenses for the healthcare services provided under the national health insurance system. However, they did not cover expenditures for advanced medical healthcare, elective medical healthcare (such as multifocal intraocular lenses [IOL]), prosthetics, medical healthcare not covered by the national insurance system (such as laser in situ keratomileusis, cosmetic surgeries, orthokeratology, purchasing costs for contact lenses and glasses, normal delivery, and so on), vaccination, dental treatments, home-visit nursing services, cost of meals during admission, medications (expenses for drugs), or recuperation (including prosthetics, massage, acupuncture, and others).
In principle, citizens have free access to any institutes they want to attend. When citizens receive medical care, they are required to pay 30% of their medical expenses at the counter. However, the burden is reduced to 20% for individuals aged 70 years and older, as well as children under 6 years old. For elderly individuals over 75 years old, the burden is further reduced to 10%. In addition, people with disabilities and low-income are exempt from the burden of medical expenses. In cases in which the medical expense burden becomes significant, a high-expenditure medical healthcare benefit system can be used to alleviate the financial burden on patients.
Results
System of National Medical Insurance in Japan
According to the ENMCE statistics for Japan, national medical expenses in 2020 amounted to JPY 43.0 trillion. In the same year, Japan’s population was 126.1 million, and its Gross Domestic Product (GDP) was 535.5 trillion JPY. Therefore, the medical expenses per capita were 340,600 JPY, and healthcare expenditures amounted for 8.02% of the GDP.2 Specifically, “general” medical expenses comprised 30.8 trillion JPY annually, representing 71.6% of the total national medical expenditures. Breaking down the general medical expenses, hospitalized medical healthcare expenses amounted to 16.3 trillion JPY (38.0%), while outpatient medical healthcare expenses accounted for 14.4 trillion JPY (33.6%). Apart from general medical expenses, dental healthcare expenses total 3.0 trillion JPY (7.0%), pharmacy dispensing expenses amounted to 7.6 trillion JPY (17.8%), expenses for hospital meals reached 749.4 billion JPY (1.7%), visiting nursing fees stand at 325.4 billion JPY (0.8%), and expenses for recuperation amounted to 460.2 billion JPY (1.1%). In terms of ophthalmological medical expenses, the annual expenditure was 1.0968 trillion JPY (comprising 226.5 billion JPY for hospitalized medical healthcare expenses and 870.3 billion JPY for outpatient medical healthcare expenses). The medical expenses for cataract care amounted to 238.8 billion JPY with hospitalized medical healthcare expenses accounting for 101.6 billion JPY and outpatient medical healthcare expenses totaling 137.2 billion JPY.
Regarding the expenses borne by the payer, state subsidies, which include provisions from the Public Assistance Law, Disability Support Act, Tuberculosis Prevention Act, Mental Health Act, Atomic Bomb Relief Act, and others amounted to 3.1 trillion JPY. Medical insurance covered 19.4 trillion JPY. The breakdown included Association-Managed Health Insurance (Kyokai-Kenpo) covering 5.7 trillion JPY, Union-Managed Health Insurance (Kumiai-Kenpo) covering 3.5 trillion JPY, Seafarer’s Insurance covered 18.4 billion JPY, while the National Public Servants Mutual Aid Association covered 231.5 billion JPY. Additionally, the Mutual Aid Association for Local Public Servant covered 683.9 billion JPY, and the Private School Teachers Mutual Aid Association covered 129.6 billion JPY. National Health Insurance accounted for 8.8 trillion JPY with non-senior citizens contributing 5.4 trillion JPY and senior citizens contributing 3.4 trillion JPY. Other insurance, such as Industry Accident Insurance, and others covered 256.6 billion JPY. The patient’s payment at the counter amounted to 5.3 trillion JPY.3
In 2014, total medical expenses amounted to 40.8 trillion JPY. Out of this total, 11.7% was contributed by patient counter payments, 13.0% by local governments, 25.8% by state subsidies, 28.3% by personal insurance premiums, and 20.5% by employer insurance premiums (Figure 1).
 |
Figure 1 Distribution of payment sources for national medical expenses in Japan in 2014. In 2014, total medical expenses amounted to JPY 40.8071 trillion, with the burden of payment distributed as follows: 11.7% borne by patient counter payment, 13.0% covered by the local government, 25.8% supported by the state subsidy, 28.3% borne by the personal insurance premium, and 20.5% funded by the employer insurance premium. |
The social insurance premium for the citizens amounted to 9.96% of their standard monthly remuneration, which equates to an annual range of 69 to 139 thousand JPY per person. Premium payment completion rates for Kyokai-Kenpo and Kumai-Kenpo were high, reaching 98% while the National Health Insurance slightly trailed at 91.5%.3 In principle, employers and employees split the insurance fees equally.
National Ophthalmic Medical Expenditures in June in Japan
According to the MCAPHI,3 the average general medical expenses in Japan in June 2007–2009 were 1699.5 billion JPY. The value in 2021 was 2306.8 billion JPY, indicating a 35.7% increase (Table 1).
 |
Table 1 Breakdown of Medical Expenses in Four Categories of Ophthalmic Healthcare in June of Each Year (Unit JPY) |
In terms of ophthalmological medical expenses, they averaged 65.4 billion JPY in 2007–2009 and experienced a growth of 46.9% to reach 96.0 billion JPY in 2021 (Table 1). This growth rate was slightly higher than that observed for general medical expenditure.
When ophthalmic medical expenses were categorized into three categories: examinations, non-surgical treatments (such as epilation, washing, injections, etc.), and surgeries, the expenses for examinations in 2021 increased by 32% compared with the average from 2007–2009. On the other hand, expenses for non-surgical treatments decreased by 35% compared to the average from 2008–2009, while those for surgeries recorded the highest increase of 48.0% compared to the average from 2007–2009 (Table 2).
 |
Table 2 Medical Expenses (Unit JPY) for Three Ophthalmological Categories, Cataract Healthcare and Number of Cataract Surgeries in June of Each Year |
Table 1 presents the changes in medical expenses for four major categories of ophthalmological healthcare (conjunctivitis and anterior segment eye diseases, cataract, refractive error-related diseases, and other diseases) over 15 years.
Notably, there was a unilateral decline in the medical expenses for cataract healthcare, whereas expenses for other ophthalmological areas increased. In 2020, the COVID-19 pandemic impacted general medical expenses across the country. The impact of COVID-19 on expenditures on ophthalmological healthcare was more severe than that on expenditures on general medical healthcare (Table 1).
Volume and Expenses of Ophthalmological Surgeries in June
The pie charts in Figures 2a, b, 3a and b, along with Table 3, display the volume and expenses of surgeries, including incisional surgeries and laser surgeries, for June 2007 and 2021. Figures 2c and 3c show the trends in the percentage share (items with a share of less than 1% were omitted).
 |
Table 3 Breakdown in the Number of Surgeries in Each Subspeciality Area (Cf. Figure 2a and b) |
 |
Figure 2 (a) Distribution of national ophthalmological surgeries in Japan in June 2007 (cf. Table 3). In 2007, cataract surgery accounted for 31.7% of all ophthalmological surgeries in Japan, making it the most common procedure. Outer ocular adnexa surgeries followed closely at 28.7%, corneo-scleral surgeries constituted 12.0% of the total, and retinal coagulation comprised 10.9%. (b) Distribution of national ophthalmological surgeries in Japan in June 2021 (cf. Table 3). In 2021, the proportion of cataract surgeries increased even further compared to 2007, accounting for 44.6% of all ophthalmological surgeries performed in Japan. Other surgeries, such as outer ocular adnexa surgeries, decreased to 23.0%, corneo-scleral surgeries decreased to 7.0%, and retinal coagulation decreased to 6.6%, and ranked second, fourth, and fifth, respectively. The proportion of YAG capsulotomies decreased from 10.1% to 9.5%, however it rose to the third most common procedure as the percentage of other surgeries decreased. (c) Trends in the share of surgical volume across the each subspeciality areas. Cataract gained its top share. Conversely, the volume of the ocular adnexa surgery displayed a declining trend throughout the study period, positioning it at second rank. |
 |
Figure 3 (a) Distribution of expenses for national ophthalmological surgeries in Japan in June 2007 (cf. Table 4). In 2007, expenses for cataract surgery dominated, accounting for 53.0% of the total ocular surgical expenses. Retinal coagulation procedures followed at 21.9%, and incisional vitreoretinal surgery make up 12.7% of the total expenses. Despite the substantial number of ocular adnexa surgeries performed, their lower unit price resulted in mere 5.0% share of the overall surgical expenses, ranking it fourth.(b) Distribution of expenses for national ocular surgeries in Japan in June 2021 (cf. Table 4). In 2021, the proportion of cataract surgeries within the breakdown of ocular surgical expenses in Japan further increased to 58.3%. The expenses for retinal coagulation significantly decreased from 21.9% to 8.8%, falling in the third position. Meanwhile, the rank of incisional vitreo-retinal surgeries rose to second place, accounting for 17.1% of the total expenses. Notably, Incisional glaucoma surgeries also increased from 1.5% to 5.5%, securing the fourth rank position. (c) Trends in the share of medical expenses across each subspeciality areas. Cataract consistently maintained the top share throughout the study period. Retinal photocoagulation dropped from its previous 2nd position to the 3rd position. Vitreo-retinal surgery and incisional glaucoma surgery grew and elevated their rank up to 2nd and 4th positions, respectively. |
The total volume of ocular surgeries performed nationwide in Japan during the month of June increased by only 5.8% from 235,434 in 2007 to 249,176 in 2021.
As depicted in Figure 2a, cataract surgeries (lensectomy and reconstruction of IOL were the most common surgeries, representing 31.7% of the all ocular surgeries in 2007). These were followed by ocular adnexa surgeries at 28.7%, corneo-scleral surgeries at 12.0% (notably, 74.0% of 28,190 corneo-scleral surgeries were the removal of corneal foreign bodies), and retinal photocoagulation at 10.9%. In 2021, the proportion of cataract surgeries experienced further increase, accounting for 44.6% of the all ocular surgeries. Conversely, ocular adnexa surgeries, corneal surgeries, and retinal photocoagulation declined in their respective proportions (Figure 2b).
As shown in Figure 3a–c, cataract surgeries had an overwhelming presence in terms of surgical expenses, accounting for 53.0% and 58.3% of total ophthalmological surgical expenses in 2007 and 2021, respectively (Figure 3a–c; Table 4).
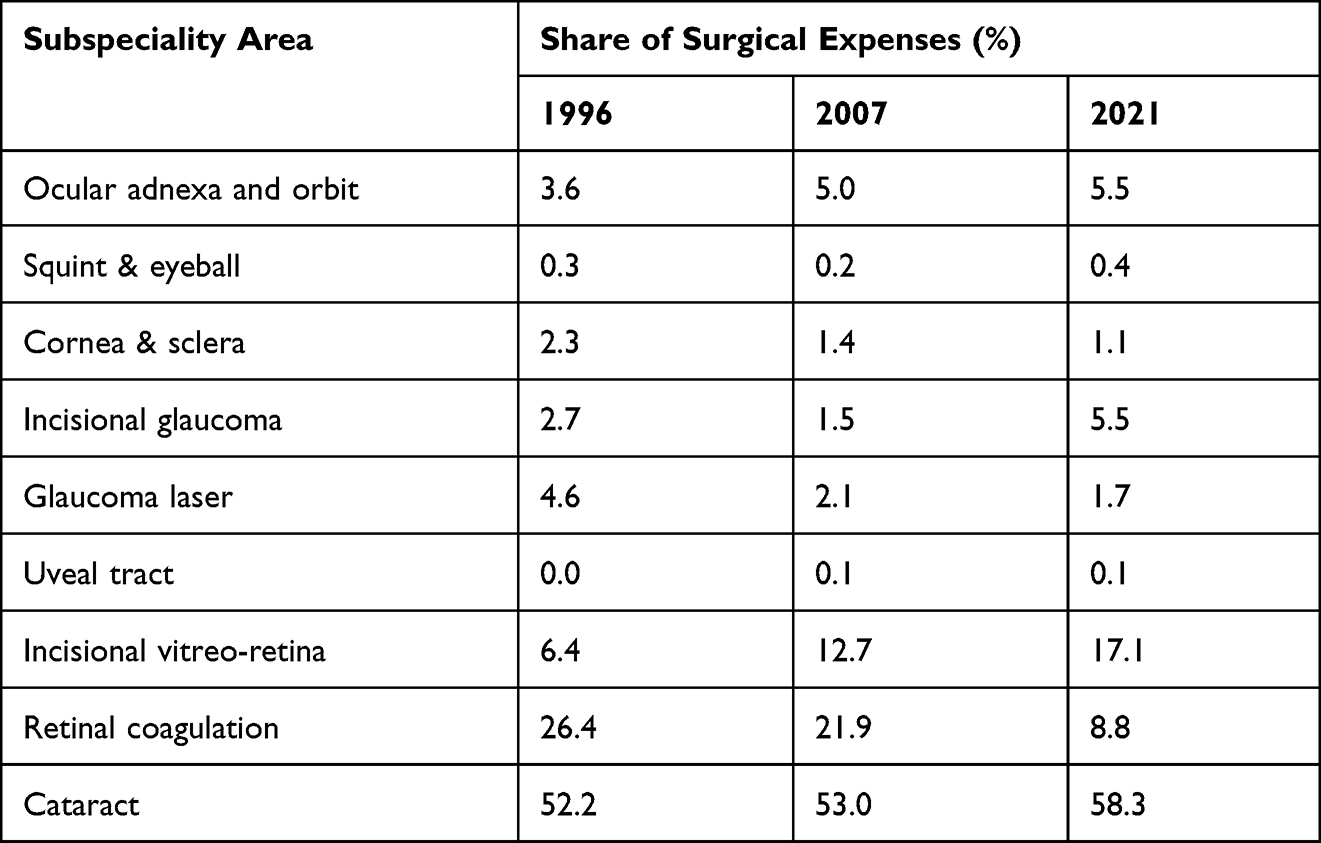 |
Table 4 Breakdown in the Expenses of Surgeries in Each Subspeciality Area (Cf. Figure 3a and b) |
The overall volume of ocular adnexa surgeries decreased in 2021; however, there were notable variations in the volume of the subcategories within adnexa surgeries. For example, incision of the hordeolum, chalazionectomy, meibomian infarcectomy, removal of concretion, and removal of corneal foreign bodies decreased from 9349, 6164, 14,780, 15,662, and 20,857, respectively, in 2007 to 5104, 3344, 7325, 10,756, and 14,206, respectively, in 2021. The volume of surgeries to address congenital nasolacrimal duct occlusion has decreased from 3376 in 2007 to 234 in 2021. However, tubing of the nasolacrimal duct increased from 455 in 2007 to 1529 in 2021. Tests conducted to assess lacrimation function and passage of the naso-lacrimal duct declined from 141,500 in 2007 to 105,239 in 2021. Conversely, the number of ptosis surgeries, which are associated with cosmetics in nature, has increased from 3,819 to 7,371.
The Peculiarities of Cataract Medicine
Japan is one of the world’s leading aging societies, with 36.21 million elderly individuals aged 65 years and over, and 18.67 million individuals aged 75 years and over as of October 1, 2021. These figures account for 28.9% and 14.9%, respectively, of the total population of 125.5 million.4 The significant aging of the population resulted in a large number of cataract patients.
Technological advances have enhanced the safety profile and patient satisfaction with cataract surgery, making it the most frequently performed surgery in Japan. In 2019, cataract surgeries accounted for 7.1% of all surgeries conducted in the country, surpassing endoscopic colonic polypectomy at 5.4% and tympanotomy at 1.8%.1
Cataract healthcare had a large presence in ophthalmic healthcare, representing 43.1% of total ophthalmic medical expenses in 1996.1 On the other hand, it is an impressive phenomenon that overall expenses for cataract healthcare are decreasing despite the increase in the number of cataract surgeries. In 2007, medical expenses for cataract healthcare amounted to 23.6 billion JPY, constituting 34.3% of total ophthalmic medical expenses. By 2021, these expenses decreased to 19.0 billion JPY, down to 19.8% of total (Table 1).
Over a span of 15 years, the volume and expenses of cataract surgeries in June, excluding YAG capsulotomy, have increased by 60.7% and 61.1%, respectively, when compared to the average recorded during 2007–2009 (Table 2, Figure 4a–c). The expenses of overall cataract surgeries including YAG capsulotomy rose from 9.4 billion JPY (accounting for 39.8% of total expenses for cataract healthcare) in 2007 to 14.2 billion JPY (representing 74.8% of total expenses for cataract healthcare) in 2021. In contrast, the expenses for non-surgical cataract healthcare, which accounted for 14.2 billion JPY (60.2% of total expenses for cataract healthcare) in 2007 declined sharply to 4.8 billion JPY in 2021 (25.2% of total expenses for cataract healthcare). As a result, the total medical expenses for cataract healthcare decreased from 23.6 billion JPY in 2007 to 19.0 billion JPY in 2021 (Table 2, Figure 4b).
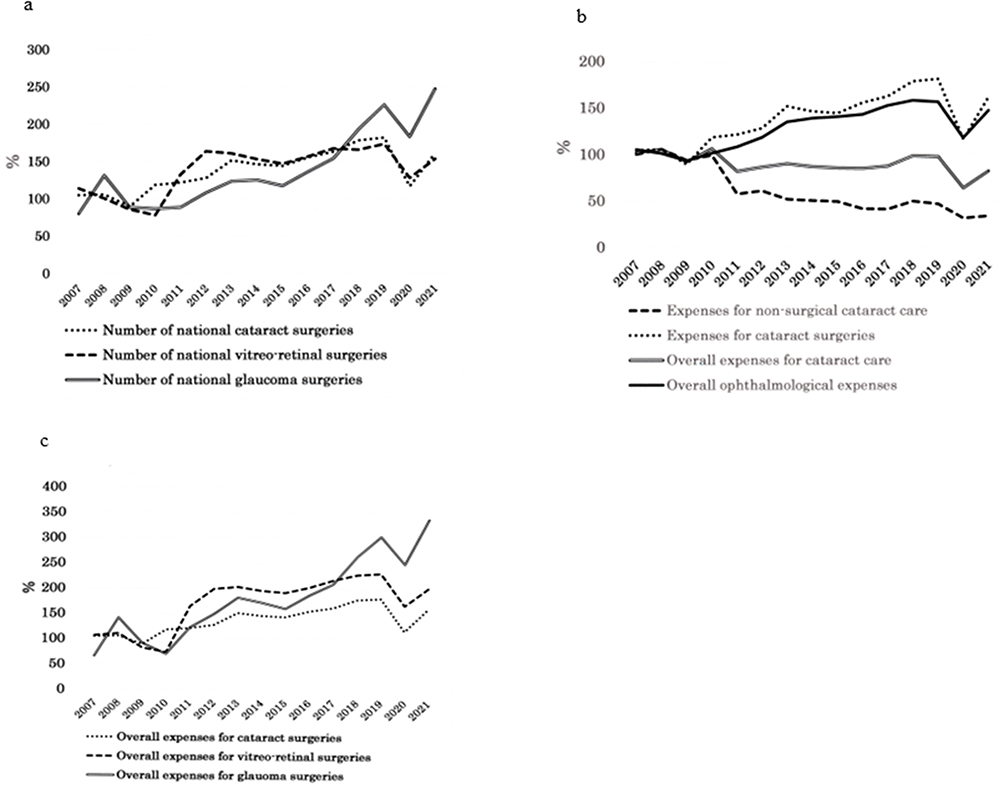 |
Figure 4 (a) Trends in the number of national ocular surgeries in June; expressed as a percentage of 2007–2009 average. The number of vitreo-retinal surgeries increased until 2012, after which it stabilized without any further significant increase. In contrast, the number of glaucoma surgeries has grown rapidly since 2018. The number of cataract surgeries performed steadily increased over time, with the exception of a downturn during the COVID-19 pandemic. (b) Trends in expenses of cataract healthcare in June; expressed as a percentage of 2007–2009 average. The expenses for cataract surgery increased, while those for non-surgical expenses decreased. Consequently, the total expenses for cataract healthcare decreased. (c) Trends in expenses of ocular surgeries in June; expressed as a percentage of 2007–2009 average. In general, national expenses for ocular surgeries tend to correspond to the overall number of surgeries. Throughout the 15-year study period, surgical fees remained stable, with the exception of a single occurrence in 2012 when the government raised the fee for vitreoretinal surgery. Consequently, the notable increase in expenses for vitreoretinal surgery in 2012 can be attributed to the corresponding increase in the surgical fees associated with vitrectomy procedures. |
The numbers of lensectomies and IOL re-constructions have steadily increased. However, the number of YAG capsulotomy cases showed slower growth, with a slight increase of 12.3% (24,505 cases) in 2021 compared to an average of 21,824 cases during 2007–2009 (Table 2).
Features of Vitreo-Retinal Surgeries in Japan
The volume of vitreo-retinal surgeries, including procedures such as scleral buckling, sub-foveal surgery, intra-vitreal tamponade, pars plana vitrectomy, and surgery for proliferative vitreo-retinopathy, during the month of June was 7,348 in 2007–2009 average. Its volume increased by 63.4%, reach 12,010 in 2012. Subsequently, the rate of increase slowed down, with a peak of 12,720 cases (73.1% increase) observed in 2019. Thereafter, the volume decreased to 11,242 cases in 2021 (Figure 4a, Table 5). This decline suggests a shift from an increasing to a decreasing trend in the number of vitreo-retinal surgeries. The increases in vitreo-retinal surgeries in 2019 and 2021 from 2007 to 2009 average was lower than the increase in glaucoma surgeries during the same years (105.1% and 124.3% increase, respectively) (Figure 4a, Table 6).
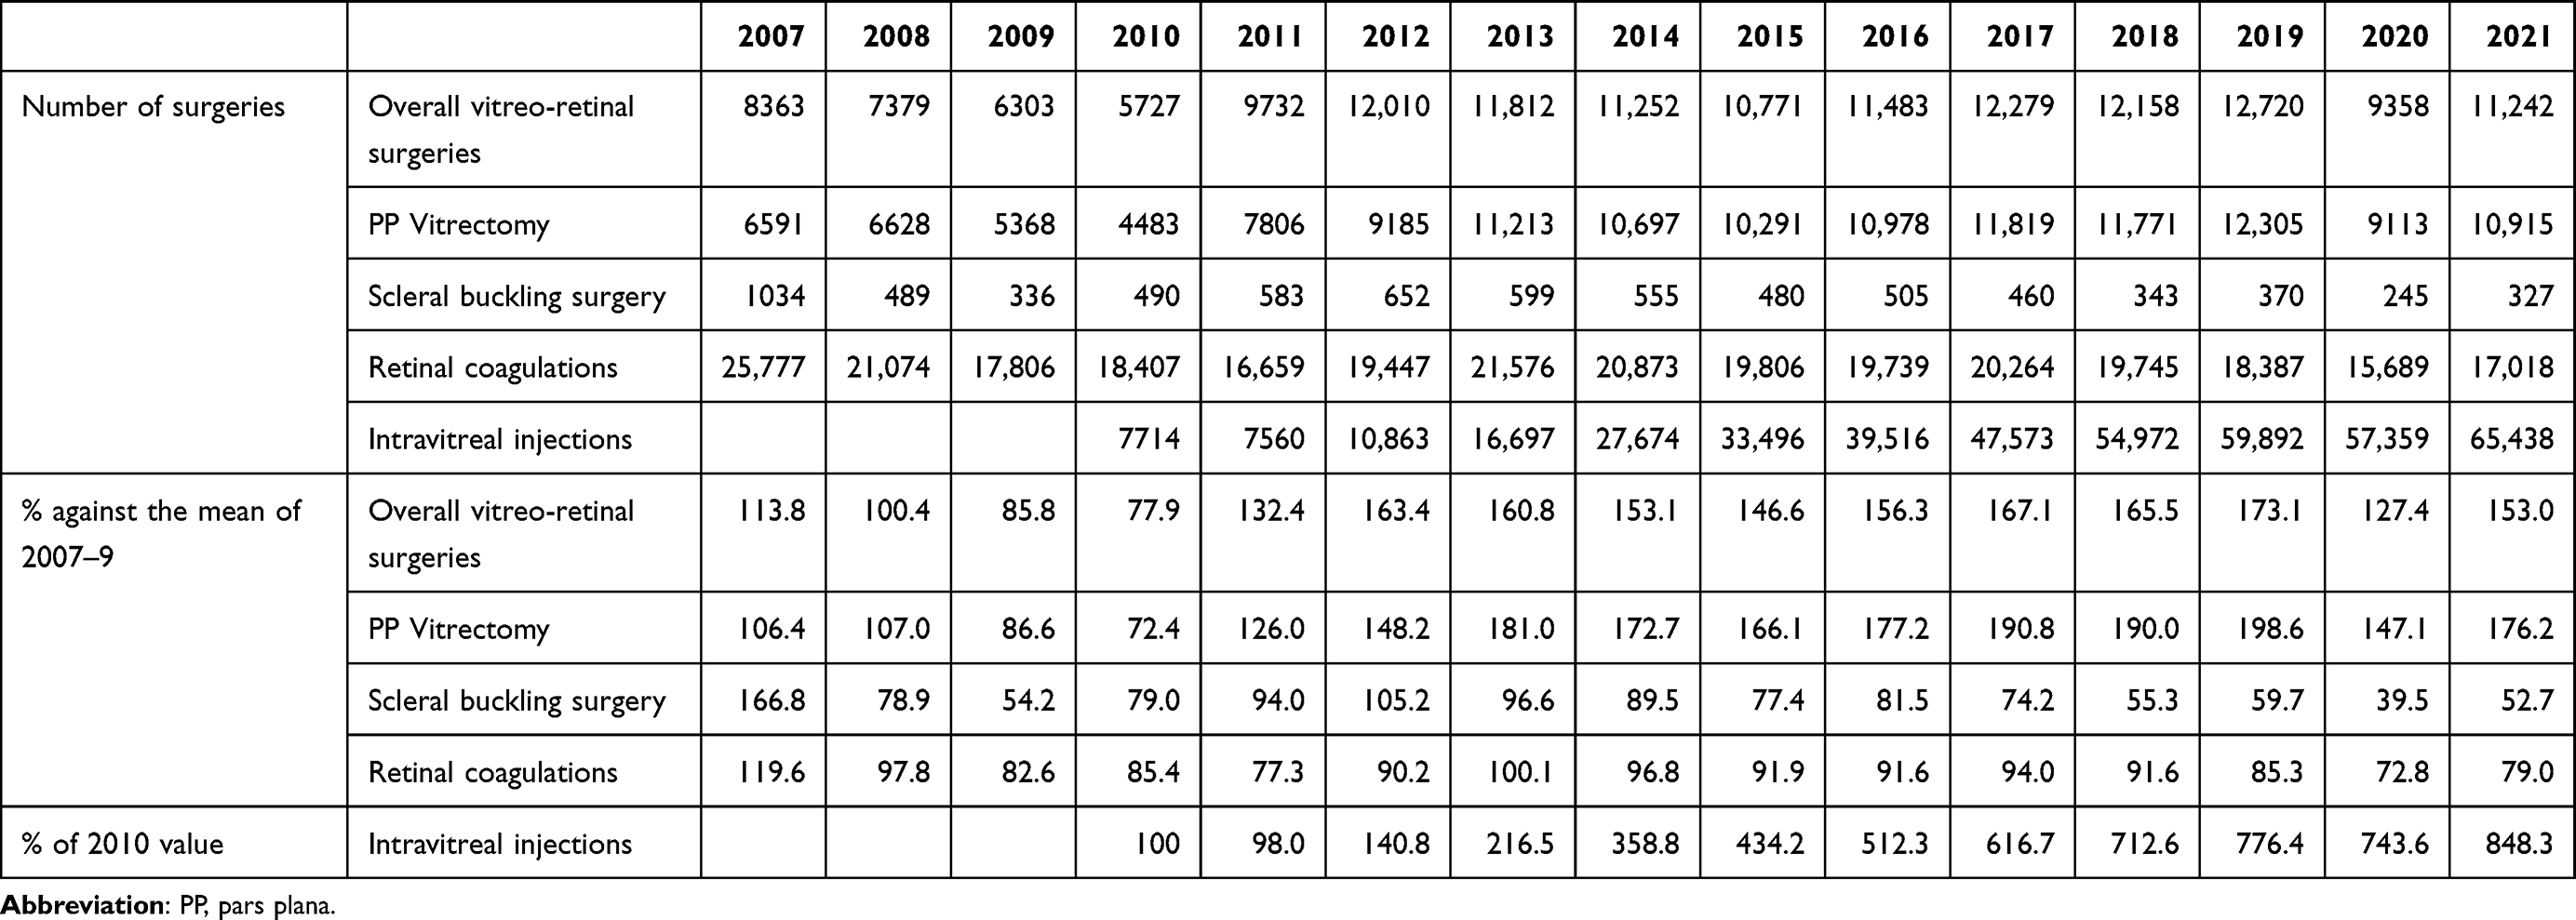 |
Table 5 Trends in Number of Vitreo-Retinal Surgeries and Intravitreal Injections in June Over 15 Years |
 |
Table 6 Trends in the Number of Glaucoma Surgeries in June of Each Year |
Focusing on pars plana vitrectomies, the volume of vitrectomies increases from 6195.7 cases during the 2007–2009 average to 11,213 cases in 2013 (81.0% increase). However, the rate of increase slowed down thereafter. In 2019, the volume of vitrectomies reached 12,305 (198.6% up of the 2007–9 average) and declined to 10,915 cases in 2021. The number of scleral buckling surgeries performed has been constantly declining. The volume of these surgeries decreased from 620 in 2007–2009 average to 327 in 2021, indicating a downward trend (Table 5).
In 2007, the volume of retinal photocoagulation accounted for 10.9% of all ophthalmological surgeries, which was nearly three times the percentage of incisional vitreo-retinal surgeries at 3.6%. Expenses of retinal photocoagulation in 2007 ranked second and occupied 21.9% of the total ophthalmological surgical expenses. However, since 2013, both the number and expense of retinal photocoagulation procedures have shown declining trends. In 2021, the volume and expense of retinal photocoagulation decreased to 6.6% and 8.8% of the total, respectively (Table 3 and Table 4).
In contrast to the stagnation observed in the number of retinal coagulations and vitrectomies since 2013, there has been a rapid increase in intravitreal injections of anti-vascular endothelial growth factor (VEGF) agents. Although data on intravitreal injections became available only after 2010, the number of vitreous injections surged 8.48 times, rising from 7714 in 2010 to 65,438 in 2021 (Table 5, Figure 5).
 |
Figure 5 Trends in vitreo-retinal surgeries and injections. There has been a rapid growth in the use of anti-VEGF agents, a contrasting decline in retinal photocoagulation procedures after 2013, and a decrease in the volume of vitrectomies after 2019. |
Features of Glaucoma Surgeries in Japan
In Japan, prior to 2010, there were two primary types of incisional glaucoma surgery: trabeculotomy ab externo (Lot-ae) and trabeculectomy. Lot-ae is a type of canal surgery that opens Schlemm’s canal using a metal probe, whereas trabeculectomy is a filtering surgery. In 2008, the number and proportion of Lot-ae were 1124, accounting for 37.7% of the total, while trabeculectomies accounted for 1857 cases, representing 62.3% (Figure 6a). However, there has been a dramatic nationwide shift in the types of glaucoma surgeries performed. New surgeries, such as Trabectome (2010), Ex-PRESS (2011), long tube shunts (2012), iStent and Kahook dual blade (2016), Tanito microhook (2017), and Preserflo and T-hook (2021), have been approved by the insurance system. The efficacy and safety of new surgeries have been studied and are progressively replacing traditional Lot-ae or trabeculectomies. In 2018, the ratio of trabeculectomies to canal surgeries was reversed, and minimally invasive glaucoma surgeries (MIGS) became the majority. As a result, the number of glaucoma surgeries itself increased to 224.3%, compared to the average of 2497 in 2008–2009 (Figures 4a and 6b).
 |
Figure 6 (a) Distribution of incisional glaucoma surgery types in 2008. In 2008, the proportions of trabeculectomy and trabeculotomy ab externo in incisional glaucoma surgeries were 62.3% and 37.7%, respectively. (Ex-PRESS and MIGS were not approved by the medical insurance system in 2008, and were not included). (b) Distribution of incisional glaucoma surgery types in 2021. In 2021, the number of trabeculectomies decreased, representing 27.5% of all incisional glaucoma surgeries. Surgeries relying on limbal filtering bleb occupied 32.8% of all procedures, while the number of canal surgeries (Trabectome, Kahook dual blade, Tanito microhook, and iStent) more than tripled since 2008, comprising 62.1% of all procedures. Although the number of long tube shunt surgeries remains small (5.0% of all), it has increased more than six-fold since its introduction in 2012. |
In 2021, the number of canal surgeries without trabecular shunt (Trabectome, Tanito micro hook, Kahook dual blade and Lot-ae), canal surgery with iStent, trabeculectomy, Ex-PRESS, and long tube shunt were 2707 (49.0%), 728 (13.2%), 1524 (27.6%), 292 (5.3%) and 279 (5.0%), respectively. The total number of canal surgeries amounting to 3435 (62.1%), surpassed the number of filtering surgeries, which was 2095 (37.9%) in 2021 (Figure 6b). In the United States, iStent was reported to make up the majority of MIGS.5 It is true that the number of iStent surgeries is increasing in Japan; however, the most popular canal surgery in Japan is the Tanito microhook, which incises the trabecular meshwork from the inside of the eye without using a shunt. These surgeries account for a substantial proportion of the overall increase in the number of glaucoma surgeries. Trabeculectomy was partially replaced with mini-tube and long-tube shunts. Although the number of long tube shunts was relatively small, there was a remarkable 6.6-fold increase between 2014 and 2021 (Table 6).
Laser iridotomy decreased from 3703 in 2007 to 2446 in 2021, whereas cyclo-photocoagulation and gonio-photocoagulation increased from 85 and 755 to 290 and 1757 cases, respectively, in June. Overall, laser surgeries for glaucoma account for 2.0% of all ophthalmological surgeries in 2021, which is consistent with the 1.9% level observed in 2007 (Table 3).
Impact of COVID-19 Pandemic Infection on Medical Healthcare
The highest expenses for general medicine in June until 2021 were 2360.2 billion JPY (138.9% of the 2007–2009 average) in 2019, as shown in Table 1. Owing to the impact of the COVID-19 pandemic that began in February 2020, general medical expenses in June 2020 and June 2021 decreased to 2033.4 billion JPY and 2306.9 billion JPY, respectively. This reduction corresponds to a decrease of 13.8% and 2.3%, respectively, compared with the expenses in 2019. On the other hand, the expenses for ophthalmic medical healthcare in 2020 and 2021 decreased by 24.7% and 6.0%, respectively, compared to 2019. Therefore, the impact of the COVID-19 pandemic has been greater in ophthalmology than in general medicine.
Furthermore, when examining the details of ophthalmological expenses, the total expenditures for ocular surgeries decreased by 30.9% and 9.1% in 2020 and 2021, respectively. Similarly, the number of cataract surgeries decreased by 36.1% and 11.5% with corresponding decreases in expenses of 35.7% and 11% during the same period. This highlights the greater impact of the COVID-19 pandemic on cataract surgeries than on overall ophthalmological surgeries.
When comparing the number of medical consultations (visits to clinics) in 2020 with that in 2019, it was evident that refractive error consultations experienced the most significant impact, with a decrease of 36%. Cataract consultations were also notably affected, with a decrease of 25.3% (Table 7).
 |
Table 7 Impact of COVID-19 Pandemic Dissemination on National Consultation Behavior of Patients in June of Each Year |
Discussion
Two types of databases for analyzing medical expenses, namely “ENMCE” and “MCAPHI”, were released by the MHLW. The former estimates medical expenses based on the aggregated amount paid by the medical expense insurer and cannot provide detailed information about specific medical fields. However, it is valuable and accurate for determining total expenses.
On the other hand, the latter database, known as “MCAPHI”, is a collection of receipt data issued by medical institutions, providing comprehensive details about medical practices. MCAPHI data are useful for examining detailed trends within each medical field. However, aggregating large volumes of nationwide medical data on a monthly basis requires substantial effort and expense. The current workforce of 33,517 staffs at the MHLW is insufficient for acquiring and analyzing all medical practice data on a monthly basis throughout Japan. Consequently, the Japanese government has decided to collect data for only the month of June, potentially resulting in discrepancies with the “ENMCE” database.
According to the MCAPHI, expenses for general medical and ophthalmological healthcare in June 2020 amounted to JPY 2033.4 billion JPY and 76.9 billion JPY, respectively. When multiplied by 12, the estimated annual general and ophthalmological medical expenses were 24,401.3 billion JPY and 922.8 billion JPY, respectively. The estimated general medical and ophthalmological expenses utilizing the MCAPHI were lower than the annual general medical and ophthalmological expenditures of 30,781.3 billion JPY and 1096.8 billion JPY, respectively utilizing ENMCE data.
It is speculated that this discrepancy is partially due to fewer colds and influenza cases in June, which are more common in winter.
Anterior Segment Surgeries
During the 15-year follow-up period, the number of anterior segment surgeries related to infection and trauma decreased, whereas the number of extraocular surgeries in the cosmetic field increased. This trend may indicate improvements in public hygiene and the increasing importance of beauty and aesthetics.
The decrease in corneal iron foreign body removal may be attributed to multiple factors such as the widespread adoption of protective glasses during metal processing, advancements in automation technology, a heightened focus on workplace safety, and a decrease in the number of ironworks in Japan.
Cataract Healthcare
Cataract surgery have a large presence in the surgical area of Japan, constituting 7.1% of all surgeries in the country. Furthermore, they account for 44.6% of the volume of ophthalmological surgeries and 58.3% of surgical expenditures in the field of ophthalmology in 2021. This may reflect the high demand for cataract treatment in Japan, which has a rapidly aging population. Despite the increasing number of cataract surgeries, the overall national expenditure on cataract healthcare has decreased. The fee for phaco-lensectomy, which is determined by the government, underwent a reduction from 162,000 JPY to 121,000 JPY in 2006, representing a decrease of 25.3%. However, the government-determined fee remained unchanged for the subsequent 15 years and did not affect the expenses of cataract surgery from 2007 to 2021.
The reduction in medical expenditure for cataract healthcare was accomplished through reduced hospital visits, examination expenditures, drug prescription expenditures, and complete surgical healing of the disease. Additionally, the popularization of day surgery has contributed to decreased hospitalization and inpatient meal expenditure.6 This is a good example of how advancements in medical healthcare have resulted in a reduction in overall medical costs.
In comparison to the substantial 60.7% increase in cataract surgeries from 2007–2009 to 2021, the increase in YAG capsulotomies was modest, at 12.3%. This difference in growth rates may be attributed to the introduction of sharp-edge IOLs around 2002, which decreased the occurrence of after cataract.7,8
Vitreo-Retinal Diseases
Over the span of 21 years, from 1996 to 2016, vitrectomy experienced remarkable increase, surpassing ten-fold at 1089%.1 This notable growth can be attributed to various technological advancements. These include the introduction of chandelier lighting, wide-viewing systems, intraocular photocoagulation, fluid-air exchange, the use of triamcinolone acetonide and trypan blue, improvements in membrane peeling techniques, and the evolution of intraocular tamponade materials. These advancements have expanded the range of indications for vitreous surgery, allowing for the treatment of macular hole, epiretinal membrane, rhegmatogenous retinal detachment, and vitreous hemorrhage and have supported an increase in the number of vitreous surgeries performed. During the same period, the number of scleral buckling surgeries decreased. This suggests a shift in the surgical approach for patients with retinal detachment, with a preference for vitrectomy over scleral buckling procedures.9–11
In contrast to the rapid increase in the number of vitrectomies between 1996 and 2016, the growth rate of vitrectomies slowed after 2013. The Introduction of anti-VEGF injections may have influenced the trend in vitrectomy growth.
Anti-VEGF agents effectively inhibit angiogenesis, fibrovascular proliferation, and intra-vitreal bleeding. Several studies have reported the superiority of intra-vitreal injection of anti-VEGF agents over pan-retinal photocoagulation in reducing macular edema and visual field loss.12 This concept is widely accepted and might have altered the preferred practice pattern among Japanese doctors. Consequently, the increase in anti-VEGF injections may have contributed to a decline in the number of vitrectomies performed for proliferative retinopathy and retinal photocoagulation despite an increase in the number of diabetic patients13 (Table 5, Figures 2a, b, and 5).
Another factor contributing to the stagnation in the number of vitrectomies may be advancements in the medical treatment of diabetes mellitus. The introduction of new medications such as Dipeptidyl Peptidase-4 inhibitors, alpha-glucosidase inhibitors, sodium-glucose cotransporter 2 inhibitors, and glucagon-like peptide 1 agonists has facilitated better control of diabetes and might have contributed to a decrease in the occurrence and progression of diabetic retinopathy.
According to the Hisayama Study,14 the prevalence of diabetic retinopathy has significantly declined despite an increase in the number of patients diagnosed with diabetes.
Over 15 years, the fees for vitreous surgery, which were determined by the government, were revised only once in 2012. The surgical fees for pars plana vitrectomy and proliferative vitreo-retinopathy surgery were revised from 367,500 JPY and 518,500 JPY to 399,700 JPY (8.8% increase) and 548,600 JPY (5.8% increase), respectively, in 2012. This event seems to have contributed to the disparity between the national expenses for vitreo-retinal surgery and the volume of surgeries in 2012 (Figure 4a and c).
Glaucoma Surgeries
In 2007, glaucoma replaced diabetic retinopathy as the leading cause of blindness in Japan. Subsequently, glaucoma was the leading cause of blindness until 2019.15 Around 2008, trabeculectomy accounted for 62.3% of glaucoma surgeries in Japan. However, it became apparent that trabeculectomy was associated with a high number of complications16 and the number of trabeculectomies was declining; similar to the trends observed in other countries.5 Before 2010, the Lot-ae, that is one of canal surgeries, occupied 37.7% of total glaucoma surgery in Japan. However, the introduction of innovative and simpler surgical procedures known as MIGS17–21 around 2010 and the subsequent confirmation of their safety and efficacy22 appear to have altered the preferred practice patterns of Japanese glaucoma specialists and boosted the number of glaucoma surgeries.
The decrease in the number of laser iridotomies (LI) in narrow-angle eyes may have been influenced by reports on the effectiveness of lensectomy for angle closure glaucoma.23 Another concern for LI in narrow-angle eyes is the risk of corneal endothelial loss.24 The preference for the lensectomy over LI might have contributed to the decline in LI procedures.
On the other hand, the increase in the number of angular photocoagulations may indicate a shift from argon laser trabeculoplasty to selective laser trabeculoplasty during this period.25 Additionally, the introduction of pulsed laser photocoagulation in the limbal area may have contributed to the increased number of cyclo-photocoagulations.
The Impact of COVID-19
The coronavirus pandemic dissemination has significantly impacted healthcare in Japan. The outbreak of infection in Japan began in February 2020. As of January 13, 2023, 31,055,159 infections have been confirmed and 61,839 people have died.
The government has increased the number of respiratory admissions and restricted hospitalizations and surgeries in other departments. Ophthalmologists were instructed to avoid unnecessary and non-urgent surgeries, and the number of cataract surgeries, in particular, decreased. Mild declines in vitreo-retinal and glaucoma surgeries compared to cataract surgeries suggest that these diseases are more urgent.
The impact of COVID-19 dissemination affected not only ophthalmological surgeries but also patient consultation behavior and the decrease in medical expenses in the non-surgical department, as shown in Table 1 and Table 7, indicating that outpatient visits were suppressed.
Limitation of This Study
This study used government-collected data for the analysis. Although the author had access to and analyzed big data, the accuracy of the findings relied on the accuracy of the survey conducted by the government.
The state has the authority to determine which medical procedures are eligible for insurance coverage, how licensed medical practices are categorized, and the corresponding payment amounts.
Although there are medical officers at the MHLW, their familiarity with advanced ophthalmic technologies may not be guaranteed. The state holds the authority to oversee all medical practices; however, there is a possibility of clerical errors occurring during their classification.
The precise count of vitreous injections before 2010 remains unknown because it was not recognized as an official medical healthcare procedure during that period.
The government’s primary focus lies on managing national healthcare costs and payments. Medical expenses play a crucial role in determining the national budget, which is the reason why data on medical expenses are considered accurate. However, discrepancies may arise in the classifications of individual medical practices. Despite this concern, government data are largely reliable. For example, there is only minimal divergence in the number of IOL between the national database (MCAPHI) and the number of IOL sales by medical device sales companies in 2020, which stood at 1,628,405.26
Conclusion
The overall volume of extraocular surgeries has decreased, whereas the number of ptosis surgeries has increased.
Over the 15-year period, both the volume and expenses of cataract surgeries and YAG capsulotomies increased. However, a marked decrease in non-surgical medical expenses has led to an overall decline in expenses for cataract healthcare.
Regarding retinal surgeries, there has been a shift from retinal photocoagulation to the intra-vitreal injection of anti-VEGF agents. The use of anti-VEGF agents increased by 8.4 times between 2014 and 2021, whereas the volume of vitrectomies peaked in 2019 and subsequently decreased. Another observed shift was the move away from scleral buckling surgeries to vitrectomies for the treatment of rhegmatogenous retinal detachment.
In terms of glaucoma surgeries, there has been a notable shift from trabeculotomy ab externo to MIGS, as well as a shift from trabeculectomy to mini-tube and long-tube shunt surgeries. The increase in MIGS procedures contributed to an increase in the number of glaucoma surgeries after 2018.
Acknowledgments
This research did not receive any external funding. I am grateful for the support and encouragement provided by the Japan Ophthalmologist Association, headed by Dr. Shirane.
The internal review board did not require ethical approval for this study because the data were public and permission to use information from a database was not required.
Disclosure
The author reports no conflicts of interest in this work.
References
1. Chihara E. Trends in ophthalmic healthcare in the last 21 years in Japan. Nippon Ganka Gakkai Zasshi. 2019;123(7):745–763.
2. Estimate of national medical Care expenditures. Available from: https://www.mhlw.go.jp/toukei/saikin/hw/k-iryohi/20/dl/toukei.pdf.
3. Statistics of medical care activities in public health insurance. Available from: https://www.e-stat.go.jp/stat-search/files?page=1&toukei=00450048&tstat=000001029602.
4. Annual report on the Aging Society. Available from: https://www8.cao.go.jp/kourei/whitepaper/index-w.html.
5. Boland MV, Corcoran KJ, Lee AY. Changes in performance of glaucoma surgeries 1994 through 2017 based on claims and payment data for United States Medicare beneficiaries. Ophthalmol Glaucoma. 2021;4(5):463–471. doi:10.1016/j.ogla.2021.01.004
6. Ministry of Health, Labour and Welfare. Average length of stay at medical institutes. Available from: https://www.mhlw.go.jp/toukei/saikin/hw/kanja/20/dl/heikin.pdf.
7. Nishi O, Nishi K, Akura J. Speed of capsular Bend formation at the optic edge of acrylic, silicone, and poly methyl methacrylate lenses. J Cataract Refract Surg. 2002;28(3):431–437. doi:10.1016/s0886-3350(01)01094-x
8. Nishi O, Nishi K, Akura J, Nagata T. Effect of round-edged acrylic intraocular lenses on preventing posterior capsule opacification. J Cataract Refract Surg. 2001;27(4):608–613. doi:10.1016/s0886-3350(00)00644-1
9. Hida T, Tano Y, Okinami S, Ogino N, Inoue M. Multicenter retrospective study of retinal detachment associated with atopic dermatitis. Jpn J Ophthalmol. 2000;44(4):407–418. doi:10.1016/s0021-5155(00)00174-x
10. Wong CW, Wong WL, Yeo IY, et al. Trends and factors related to outcomes for primary rhegmatogenous retinal detachment surgery in a large Asian tertiary eye center. Retina. 2014;34(4):684–692. doi:10.1097/IAE.0b013e3182a48900
11. McLaughlin MD, Hwang JC. Trends in vitreoretinal procedures for Medicare beneficiaries, 2000 to 2014. Ophthalmology. 2017;124(5):667–673. doi:10.1016/j.ophtha.2017.01.001
12. Gross JG, Glassman AR, Liu D, et al. Five-year outcomes of panretinal photocoagulation vs intravitreous Ranibizumab for proliferative diabetic retinopathy: a randomized clinical trial. JAMA Ophthalmol. 2018;136(10):1138–1148. doi:10.1001/jamaophthalmol.2018.3255
13. Hertzberg SNW, Jørstad ØK, Petrovski BÉ, et al. Transition from laser to intravitreal injections for diabetic retinopathy: hospital utilization and costs from an extended healthcare perspective. Int J Environ Res Public Health. 2022;19(19):12603. doi:10.3390/ijerph191912603
14. Hashimoto S, Yasuda M, Fujiwara K, et al. Secular trends in the prevalence, incidence, and progression of diabetic retinopathy: the Hisayama study. Graefes Arch Clin Exp Ophthalmol. 2023;261(3):641–649. doi:10.1007/s00417-022-05839-8
15. Matoba R, Morimoto N, Kawasaki R, et al. A nationwide survey of newly certified visually impaired individuals in Japan for the fiscal year 2019: impact of the revision of criteria for visual impairment certification. Jpn J Ophthalmol. 2023;67(3):346–352. doi:10.1007/s10384-023-00986-9
16. Kashiwagi K, Kogure S, Mabuchi F, et al. Change in visual acuity and associated risk factors after trabeculectomy with adjunctive Mitomycin C. Acta Ophthalmol. 2016;94(7):e561–e570. doi:10.1111/aos.13058
17. Seibold LK, Soohoo JR, Ammar DA, Kahook MY. Preclinical investigation of ab interno trabeculectomy using a novel dual-blade device. Am J Ophthalmol. 2013;155(3):524–529.e2. doi:10.1016/j.ajo.2012.09.023
18. Grover DS, Godfrey DG, Smith O, Feuer WJ, Montes de Oca I, Fellman RL. Gonioscopy-assisted transluminal trabeculotomy, ab interno trabeculotomy: technique report and preliminary results. Ophthalmology. 2014;121(4):855–861. doi:10.1016/j.ophtha.2013.11.001
19. Chin S, Nitta T, Shinmei Y, et al. Reduction of intraocular pressure using a modified 360-degree suture trabeculotomy technique in primary and secondary open-angle glaucoma: a pilot study. J Glaucoma. 2012;21(6):401–407. doi:10.1097/IJG.0b013e318218240c
20. Tanito M, Sano I, Ikeda Y, Fujihara E. Microhook ab interno trabeculotomy, a novel minimally invasive glaucoma surgery, in eyes with open-angle glaucoma with scleral thinning. Acta Ophthalmol. 2016;94(5):e371–e372. doi:10.1111/aos.12888
21. Chihara E, Chihara T. Development and application of a new T-shaped internal trabeculotomy hook (T-hook). Clin Ophthalmol. 2022;16:3919–3926. doi:10.2147/OPTH.S392021
22. Fellman RL, Mattox C, Singh K, et al. American Glaucoma Society position paper: microinvasive glaucoma surgery. Ophthalmol Glaucoma. 2020;3(1):1–6. doi:10.1016/j.ogla.2019.12.003
23. Nonaka A, Kondo T, Kikuchi M, et al. Cataract surgery for residual angle closure after peripheral laser iridotomy. Ophthalmology. 2005;112(6):974–979. doi:10.1016/j.ophtha.2004.12.042
24. Wang PX, Koh VTC, Loon SC. Laser iridotomy and the corneal endothelium: a systemic review. Acta Ophthalmol. 2014;92(7):604–616. doi:10.1111/aos.12367
25. Gazzard G, Konstantakopoulou E, Garway-Heath D, et al. Laser in glaucoma and ocular hypertension (LiGHT) Trial: six-year results of primary selective laser trabeculoplasty versus eye drops for the treatment of glaucoma and ocular hypertension. Ophthalmology. 2023;130(2):139–151. doi:10.1016/j.ophtha.2022.09.009
26. Japan Ophthalmic Instruments Association. Annual report of Japan Ophthalmic Instruments Association. Available from: https://www.joia.or.jp/annual_report/annual-report-2021/p9/.
 © 2023 The Author(s). This work is published and licensed by Dove Medical Press Limited. The full terms of this license are available at https://www.dovepress.com/terms.php and incorporate the Creative Commons Attribution - Non Commercial (unported, v3.0) License.
By accessing the work you hereby accept the Terms. Non-commercial uses of the work are permitted without any further permission from Dove Medical Press Limited, provided the work is properly attributed. For permission for commercial use of this work, please see paragraphs 4.2 and 5 of our Terms.
© 2023 The Author(s). This work is published and licensed by Dove Medical Press Limited. The full terms of this license are available at https://www.dovepress.com/terms.php and incorporate the Creative Commons Attribution - Non Commercial (unported, v3.0) License.
By accessing the work you hereby accept the Terms. Non-commercial uses of the work are permitted without any further permission from Dove Medical Press Limited, provided the work is properly attributed. For permission for commercial use of this work, please see paragraphs 4.2 and 5 of our Terms.