Back to Journals » Clinical Epidemiology » Volume 12
Trend Dynamics of Severe Acute Respiratory Syndrome Coronavirus 2 (SARS-CoV-2) Transmission in 16 Cities of Hubei Province, China
Authors Fawad M ![]() , Mubarik S
, Mubarik S ![]() , Malik SS
, Malik SS ![]() , Hao Y, Yu C
, Hao Y, Yu C ![]() , Ren J
, Ren J ![]()
Received 20 March 2020
Accepted for publication 11 June 2020
Published 2 July 2020 Volume 2020:12 Pages 699—709
DOI https://doi.org/10.2147/CLEP.S254806
Checked for plagiarism Yes
Review by Single anonymous peer review
Peer reviewer comments 4
Editor who approved publication: Professor Henrik Toft Sørensen
Muhammad Fawad,1,2 Sumaira Mubarik,3 Saima Shakil Malik,4 Yangyang Hao,2 Chuanhua Yu,3 Jingli Ren1
1Henan Academy of Big Data, Zhengzhou University, Zhengzhou 450052, People’s Republic of China; 2School of Mathematics and Statistics, Zhengzhou University, Zhengzhou 450001, People’s Republic of China; 3Department of Epidemiology and Biostatistics, School of Health Sciences, Wuhan University, Wuhan, Hubei 430071, People’s Republic of China; 4Department of Zoology, University of Gujrat, Gujrat 50700, Pakistan
Correspondence: Jingli Ren
Henan Academy of Big Data, Zhengzhou University, Zhengzhou 450052, People’s Republic of China
Tel +86-13653827917
Email [email protected]
Objective: A severe acute respiratory syndrome coronavirus 2 (SARS-CoV-2) was detected by researchers from a patient in Wuhan, Hubei province, China, in December 2019, and broke out in January 2020. Then, the pandemic was detected in countries around the world. Therefore, precise estimates of its current and future trends are highly required for future policy implications.
Methods: We retrieved data from the Health Commission of Hubei, China. Logistic-S curve model was used to estimate the current and future trends of SARS-CoV-2-infected cases among 16 cities of Hubei, China from Jan-11 to Feb-24, 2020.
Results: Out of 64,287 confirmed cases of SARS-CoV-2 infection in Hubei, higher percentage of cases were in Wuhan and Xiaogan. The highest death percentage was found in Wuhan and Qianjiang. A significant percentage of cures were found in Enshi Prefecture and Huanggang, while Wuhan showed the lowest percentage of cures. Rising trends in infected cases were observed throughout the study period, particularly in Wuhan, and a higher trend was observed after 12-Feb. Gradual decline trend of SARS-CoV-2 cases was observed during Feb-25 to Mar-15 in Hubei Province. Future forecast showed that the average number of SARS-CoV-2-infected cases might be decreased or stable in Hubei in the coming 20 days.
Conclusion: The public must take precautionary measures in order to control and prevent disease spread and avoid extra travelling.
Keywords: SARS-CoV-2, death, trends, cities, Wuhan, China
Introduction
In the last two decades, coronavirus has produced two large-scale pandemics, including Severe acute respiratory syndrome (SARS) and the Middle East respiratory syndrome (MERS).1,2 Since the outbreak of SARS some eighteen years ago, various severe acute respiratory syndrome-related Coronaviruses (SARS-CoV) have been revealed in bats being their natural host reservoir1,3-6 and have potential to cause future disease outbreaks.7,8 Literature has shown that some of these Coronaviruses are capable of infecting humans and can lead to severe health conditions. In December 2019, a series of pneumonia cases of unknown cause appeared in Wuhan, Hubei, China, with viral pneumonia relating clinical presentation. Sequencing of samples from the lower respiratory tract of infected patients confirmed the emergence of a novel virus named as Severe Acute Respiratory Syndrome Coronavirus 2 (SARS-CoV-2).9 As of 2nd June 2020, 84,597, cases and 4645 deaths were reported only in China.10 Due to inadequate quarantine, cases have been reported in many other countries including Nepal, Thailand, South Korea, Japan, Taiwan, Singapore, Nepal, United States, Vietnam, Iran and Pakistan.11–19 Clinicians and WHO (World Health Organization) have reported human to human transmission leading to a much wider spread of the disease. The genome of SARS-CoV-2 encoded endonuclease; therefore, the rate or chances of mutation are much lower than other viruses making this zoonotic pathogen more virulent by effective person to person transmission.7
Unfortunately, no vaccine or drug has been approved yet to treat human coronaviruses completely.20 Numerous options can be envisioned like vaccines, oligonucleotide-based therapies, monoclonal antibodies, small molecule-based drugs, interferon therapies and peptides either to prevent or control the emerging (SARS-CoV-2).8,20-22 However, new interventions needed more extended periods to develop spanning over months to years. Therefore, due to urgency of the novel SARS-CoV-2 outbreak, scientists and clinicians are focusing in using the potential of existing antiviral agents (approved or in the process of approval) based on their therapeutic experiences with SARS and MERS.23,24 The most commonly used anti-viral agents all over the world include chloroquine, lopinavir/ritonavir, hydroxychloroquine, remdesivir and favipiravir.25–27 Two other drugs named ivermectin and nitazoxanide have recently been reported to show an activity against SARS-CoV-2 in vitro and are approved/licensed for the treatment of some other human infections.28,29
Recently, various articles have been published reporting individual cases, hazardous health effects, poor quarantine, and risk of pandemics, genetic make-up, clinical interventions and disease manifestations. Here, we will accurately report the incidence of SARS-CoV-2 in 16 different cities of Hubei, China, with particular emphasis on the incidence of infected cases in different cities of Hubei province with respect to time (Jan-11 to Feb-24, 2020). In addition, we plan to estimate the current and future trends of SARS-CoV-2-infected cases with logistic S-curve model among 16 different cities of Hubei province, China to present the exact situation of this disease.
Materials and Methods
Data Source
The data of cases diagnosed with SARS-CoV-2 were retrieved from the Official website of the National Health Commission of the People’s Republic of China, and the Health Commission of each Province, which publish daily epidemic data. (http://wjw.hubei.gov.cn/bmdt/ztzl/fkxxgzbdgrfyyq/xxfb/202002/t20200224_2146325.shtml).
We have included confirmed cases (64,287), cured cases (16,738) and death (2495) cases, recorded from 11 Jan 2020 to 24 Feb 2020. The total number of cases varied from 194 to 46,607 among 16 different cities of Hubei province.
Analytical Analysis
Descriptive analysis included frequencies and percentages of collected cases for each parameter of interest. Summary trends were analyzed by time for 16 cities separately. Further, the logistic S-curve model was used to estimate the trends of SARS-CoV-2 cases among 16 cities of Hubei province China. Mean Absolute Percentage Error (MAPE), Mean Absolute Deviation (MAD) and Mean Squared Deviation (MSD) were used to evaluate the predicted models. Logistic S-curve has many applications in different fields; for example, biologists have used it to illustrate the growth of a specie under competition. Similarly, it has been used in medicine to show the spread of epidemic diseases.30,31 The fascinating part of the logistic S-curve fitting is the ability to forecast from early sizes the last maximum, a reality that frequently stuns and occasionally vexes individuals, with its intrinsic component of predetermines.
The logistic S-curve was initially proposed by Pierre-François,32 in the context of population growth. It is a type of curve that displays the growth of the understudy variable in terms of another variable, often expressed as a unit of time. Common characteristics of Logistic S-curve, at first, are that the growth is approximately exponential (geometric), then slows down to linear (arithmetic), followed by rapid growth and followed by slow growth again to an asymptotic maximum. The three parameters L, β and (1) describing a logistic S-curve form:
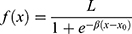
where L is the maximum value of the curve, e is the natural logarithm base, β is the logistic growth rate, and (2) (3) (4) is the
  -value of the sigmoid’s midpoint. The change in values of β and
  in the above equation (1) affects the exact shape of the logistic S-curve. β affects how steeply the function rises as it passes through its midpoint; however, the
  is computed at which time the midpoint occurs. Accuracy of the forecast are measure by using, Mean Absolute Percentage Error (MAPE), Mean Absolute Deviation (MAD), Mean Squared Deviation (MSD) and expressed as:
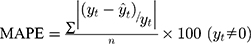
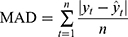
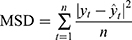
In the above equations (from 2 to 4),  is the actual value (variable understudy) at time t,
  denotes the fitted value, and n is the number of observations. MAPE, MAD and MSD measure the accuracy of fitted time series values. MAPE expresses accuracy as a percentage, where MAD measures accuracy in the same units as data, which helps in conceptualizing the amount of error. On the other hand, MSD is always calculated using the same denominator, n, and it is a more sensitive measure of an unusually large forecast error than MAD.
Results
Descriptive Analysis
A summary of infected cases of SARS-CoV-2 in 16 different cities located in the Hubei province is presented in Table 1. Wuhan has the highest death percentage (4.26%), while Qianjiang (4.12%) and Jingmen (4.02%). Similarly, the lowest death percentage is reported in Shiyan (0.30%), Xianning (1.31%), and Enshi Prefecture (1.59%). Substantially higher percentage of cures is observed among Enshi Prefecture (58.17%), Huanggang (57.13%), Xianning (53.23%), and Tianmen (52.23%). However, Wuhan has the lowest cure percentage (19.19%).
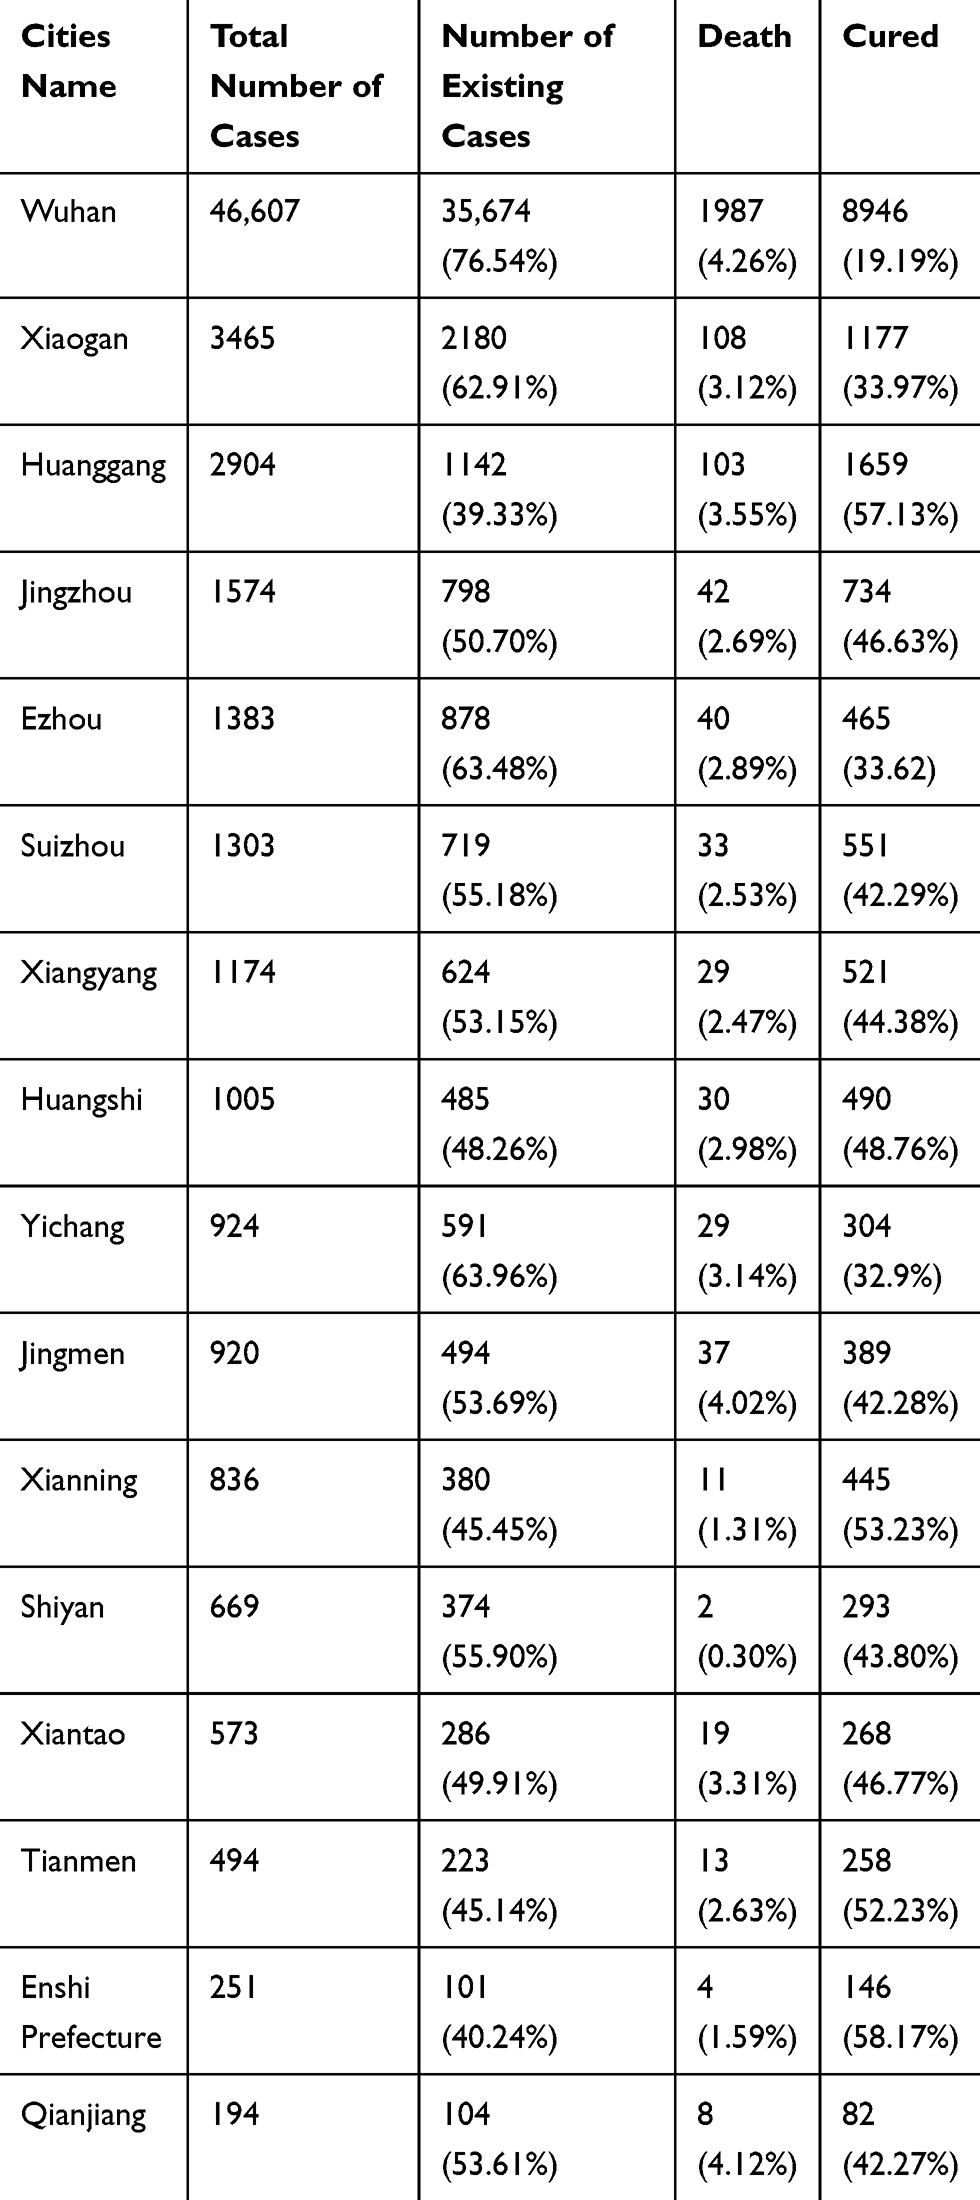 |
Table 1 Summary of SARS-CoV-2-Infected Cases in 16 Cities of Hubei Province |
Current Trends of SARS-CoV-2-Infected Cases with Time
Figure 1 shows the trend of the total, existing, deceased and cured number of SARS-CoV-2-infected cases in the Hubei province of China from 11-Jan to 24-Feb 2020. The rapid increase in SARS-CoV-2-infected cases was observed from 27-Jan and onwards, and the two-fold increase was reported after 12-Feb 2020. Recovery of patients was slightly improved after 14-Feb, and the respective trend of remaining or existing patients started to decline slowly with forwarding days. Overall, the trend of deceased cases in Hubei province was slightly higher after 16-Feb, but this number was lower than that of cured cases.
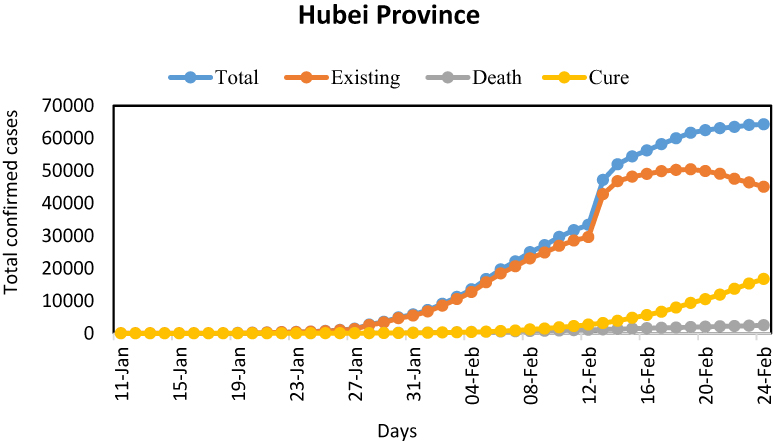 |
Figure 1 Actual trend of SARS-CoV-2-infected cases for Hubei province. |
To explore differences in the incidence of infected cases from SARS-CoV-2 among different cities, we have plotted the same trends as described above for Hubei province for each city separately. Figure 2 depicts the trends in total, existing, deceased, and cured SARS-CoV-2-infected cases. A higher rate/incidence of all parameters was observed in Wuhan, while Xiaogan was ranked second, taking into account the total number of SARS-CoV-2 cases. On the other hand, the lowest rates were observed in Qianjiang and Enshi Prefecture, respectively. A significant increase in the trend of SARS-CoV-2-infected cases in Wuhan was identified on and after 29-Jan. In other cities, the total number of infected cases were also increased in the same duration, but in Wuhan and Xiaogan, the trend was increased significantly over the period compared to other cities (Figure 2).
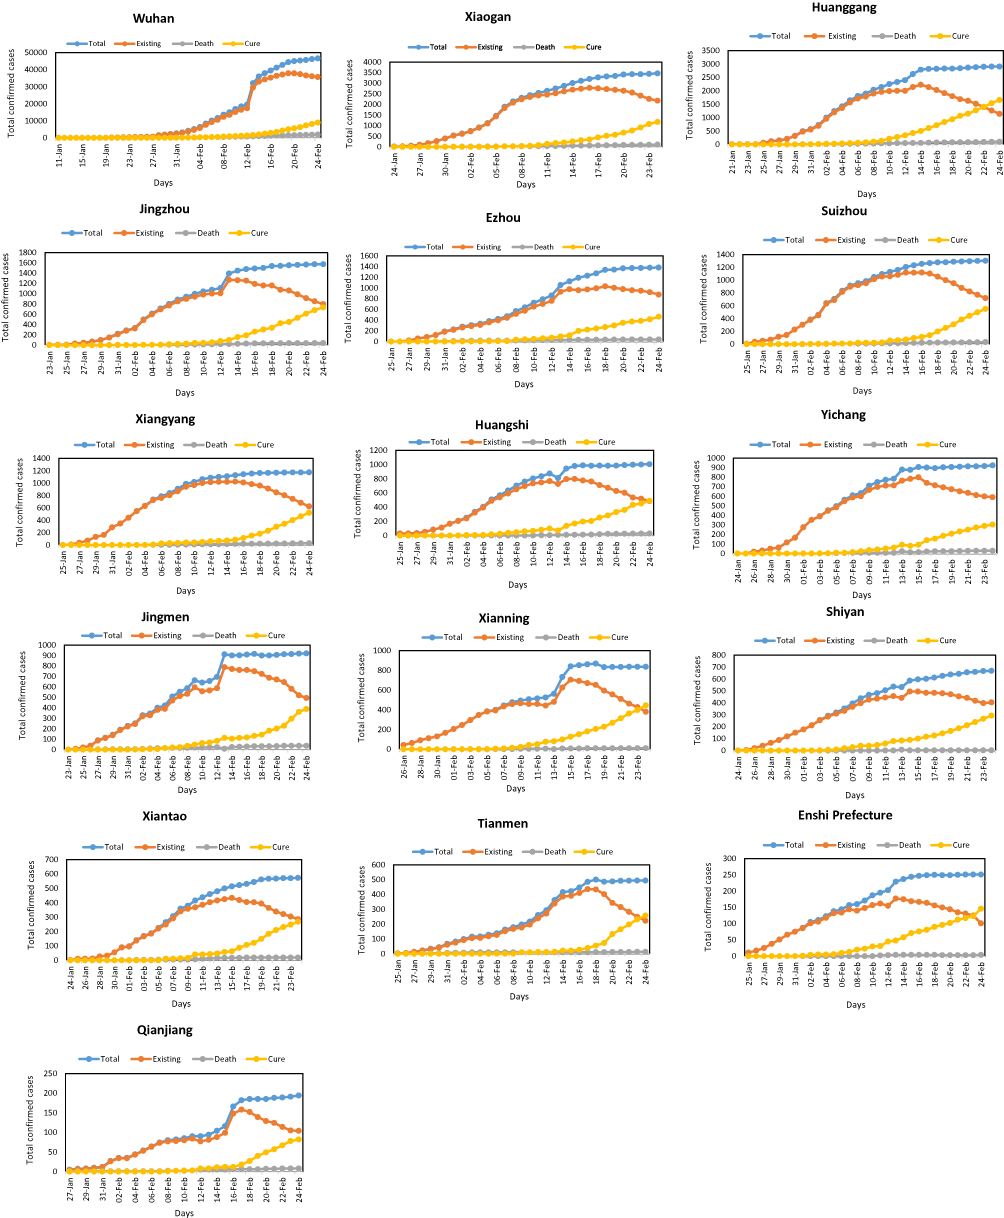 |
Figure 2 Actual trend of SARS-CoV-2-infected cases among 16 different cities of Hubei province. |
Estimation and Forecasting of SARS-CoV-2 Cases in 16 Cities of Hubei Province
Estimated present and future forecasted trends in the number of SARS-CoV-2-infected cases are shown in Figure 3. We noted that during the observed time, the growth of SARS-CoV-2 case has increased (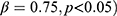 in Hubei province. Besides, the forecast trend indicated that in the next 20 days, the trend of SARS-CoV-2 cases might start to decline slightly or remain consistent from 25-Feb to 15-Mar (Figure 3).
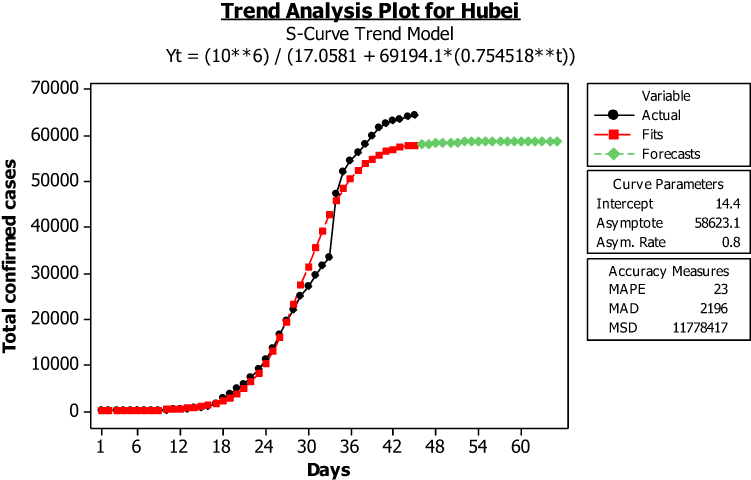 |
Figure 3 Estimated and forecasted trend of SARS-CoV-2-infected cases for Hubei province. |
Figure 4 depicted the detailed city-wise trend in the number of SARS-CoV-2-infected cases across 16 different cities of Hubei province. We observed from Figure 4, that almost for all cities, the fitted trend closely follows the actual data, indicating that the logistic S-curve model fits the data well. The estimated number of SARS-CoV-2-infected cases in Wuhan was higher than in all other cities. We observed that the growth of cases increased smoothly over the entire period and was higher in Wuhan, Xianning, Qianjiang, and Enshi Prefecture. The forecast for these cities also indicated a slightly declining stable trend of cases from 25-Feb to onward, while the future trend of other cities showed almost declined stable trend during the forecast period (Figure 4).
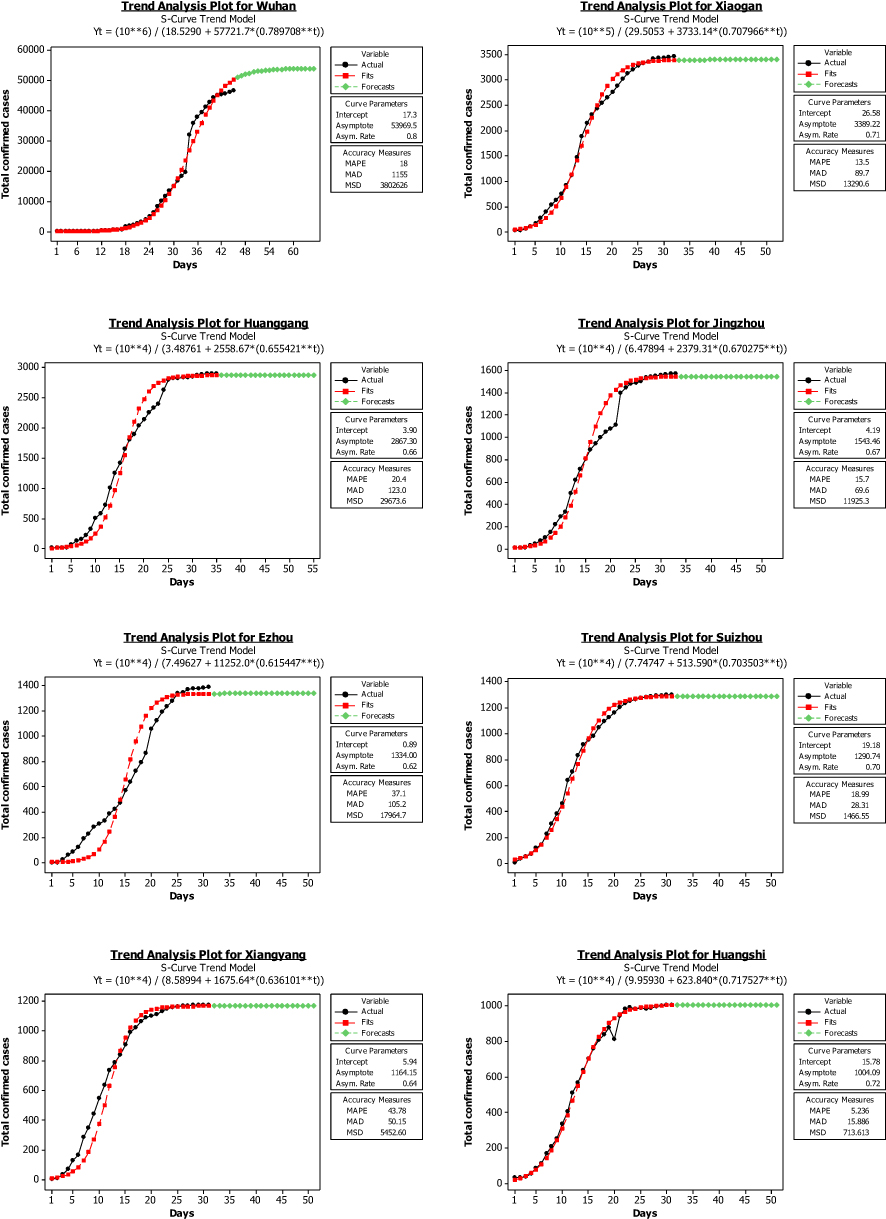 |
Figure 4 Continued. |
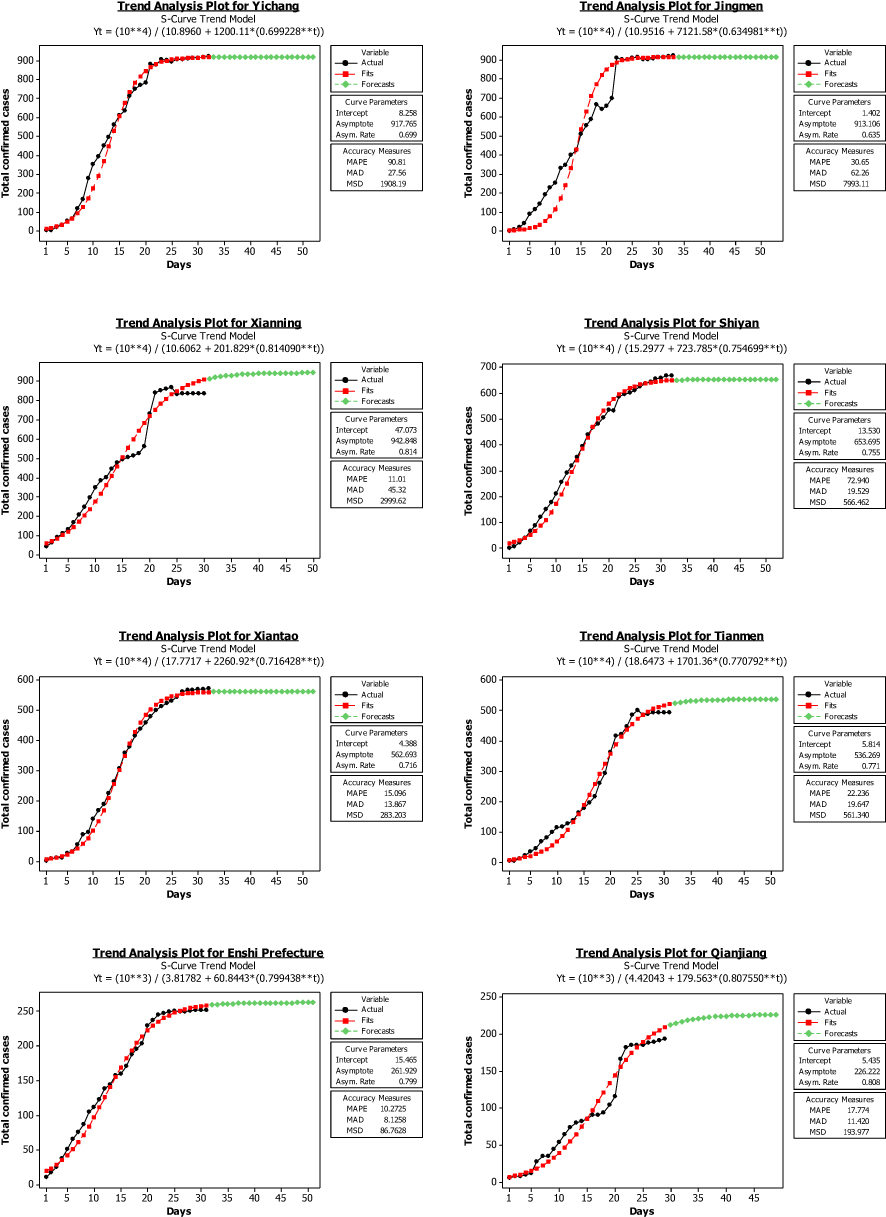 |
Figure 4 Estimated and forecasted trend of SARS-CoV-2-infected cases among16 cities of Hubei province. |
Moreover, we compared the average number of SARS-CoV-2-infected cases before and after 25-Feb; and found that during the specified period average forecast number of cases steadily declined from 25-Feb to 15-Mar for both Hubei province and Wuhan city. In order to check the precision of our forecast, we also reported the actual number of SARS-CoV-2-infected cases per day from 25-Feb to 29-Feb by the Health Commission of Hubei Province, China, which verified our findings of a decrease in the future number of virus-infected cases in Hubei province and Wuhan city (Table 2).
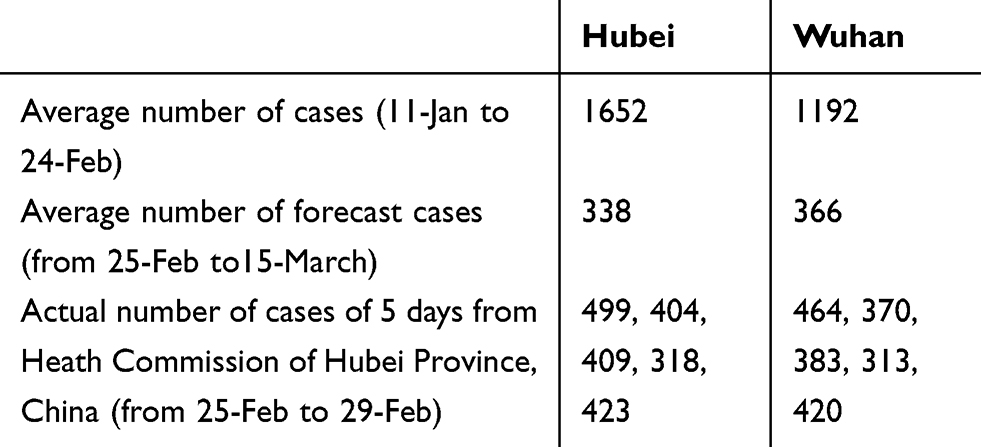 |
Table 2 Comparison of Past and Future Predicted Number of Cases for Hubei Province and Wuhan |
Discussion
This is an extensive study reporting the exact number of existing, deceased and cured SARS-CoV-2 cases in 16 different cities of Hubei, China, from 11-Jan to 24-Feb 2020. In addition, estimation and forecasting representing trend and incidence of SARS-CoV-2-infected cases were presented to get an idea about the disease spread and the success of treatment strategies. It illustrates the latest status of SARS-CoV-2 infection in China and adds details about its spread with respect to time.
Coronavirus is one of the leading pathogens of respiratory infection. SARS-CoV and MERS-CoV are two extremely pathogenic viruses that cause a severe respiratory syndrome in humans. SARS-CoV outbreaks in 2002–2003 have infected 8422 cases in 29 different countries across the globe4,33 whereas, in 2012, MERS-CoV has emerged in Middle Eastern countries but has been imported to China due to inadequate quarantine by the Middle East.34–36 The emerging SARS-CoV-2 also caused severe lower respiratory tract infections and was declared as a global emergency by the WHO.33,37 High through-put sequencing has confirmed that SARS-CoV-2 is quite different from the already reported six Coronavirus sub-types. Both MERS-CoV and SARS-CoV originated in bats and are capable of transmitting directly to human beings from dromedary camels and civets, respectively,38,39 but the origin of SARS-CoV-2 still needs in-depth investigations. The transmission rates of SARS-CoV-2 are unknown yet, but there strong evidence of human–to–human transmission does exist.33
The present study has shown the occurrence of SARS-CoV-2-infected cases of 16 different cities located in Hubei province. It was observed that Wuhan has the highest death percentage with this viral infection, followed by Qianjiang and Jingmen. Whereas some of the cities in Hubei have very low death rates, including Shiyan, Xianning, and Enshi Prefecture as compared to Wuhan. These findings are in accordance with the latest reports highlighting the spread of SARS-CoV-2 in China, specifically in Wuhan.7,33 If we consider the rate of cured cases from this viral outbreak, it was observed that Enshi Prefecture, Huanggang, Xianning, and Tianmen have a significantly higher cure percentage compared to Wuhan.
Furthermore, we have shown the trend of existing, deceased, and cured numbers of SARS-CoV-2 cases in the Hubei province of China from 11-Jan to 24-Feb 2020. Results from the present study showed a rapid increase in SARS-CoV-2-infected cases from 27-Jan and onwards with a two-fold increase after 12-Feb 2020. It was observed that patients start getting better after 14-Feb, and the respective trend of remaining or existing patients started to decline slowly with forwarding days. Overall, the trend of deceased cases was mildly higher after 16-Feb, but this number was found to be lower than that of cured cases in Hubei. Differences in the incidence of SARS-CoV-2-infected cases among different cities were analyzed by plotting the results individually for all the cities. Again, the trend remains the same, and a higher rate of disease prevalence was observed in Wuhan. In contrast, Xiaogan was ranked in the second position, and the lowest rate was found in Qianjiang and Enshi Prefecture. A significantly increasing trend of SARS-CoV-2 cases in Wuhan was identified on 29-Jan and onwards. We have explored that number of SARS-CoV-2-infected cases also increase among other studies in the same duration but increasing trend in Wuhan and Xiaogan was much higher throughout the study period.
Our findings were supported by the reports of the National Health Commission, which states the quick increase of this viral infection from 20 to 25 Jan 2020.40 It is conceivably that the reporting and detection of the SARS-CoV-2 infection have gained greater importance since it was reported countrywide. Spring Festival travel rush would be another reason for this rapid spread, as thousands of people from different cities and countries visit Wuhan.41
The number of SARS-CoV-2-infected cases during the specified time was estimated using the logistic S curve model. After applying and evaluating the accuracy measurement of different time series models, the logistic S-curve trend model was found to be a suitable fit for measuring the trends in the number of SARS-CoV-2 cases. The present study showed that during the observed time growth of infected cases had significantly increased in Hubei province. In addition to this forecast trend over the next 20 days, it has been noted that the trend of infected cases may begin to decline slowly or remain consistent from 25-Feb to 15-Mar. We observed that almost all cities, fitted trends closely follow the actual data, which confirms the suitability of the logistic S-curve model to the data. The estimated number of SARS-CoV-2 cases in Wuhan was higher than in all other cities. The growth of infected cases increased smoothly during the entire period and was higher in Wuhan, Xianning, Qianjiang, and Enshi Prefecture. The forecast for these cities also indicated the slightly decreasing stable trend of cases from 25-Feb to onward, while the future trend of other cities has shown almost declined stable trend during the forecast period giving a hope that the situation will be better in the coming future. Also, a comparison of infected cases before and after 25-Feb showed that during the specified period average forecast number of cases steadily declined from 25-Feb to 15-Mar for both Hubei province and Wuhan city. The accuracy of our forecast was assessed by the actual number of SARS-CoV-2-infected cases per day from 25-Feb to 29-Feb collected by the Health Commission of Hubei province, China, which confirmed our results of a reduction in the future number of cases in Hubei province, and specifically in Wuhan city, which is facing a significant challenge in the fight against this pandemic. But this reduction can only be observed after taking accurate preventive measures and establishing fully equipped quarantines for infected cases. Otherwise, it would become difficult to deal with this global challenge.
There is currently no definitive treatment available for this viral infection; therefore, precautions measures must be taken to prevent ourselves. Clinicians are using several anti-viral drugs that are already licensed for other viral diseases, although various clinical trials are in progress to prepare vaccines as a definitive treatment. The United States Center for Disease Control and Prevention has released an updated guideline42 along with a patient under investigation (PUI) form for suspected cases.43 So, anyone who has a previous history of traveling to Wuhan or has met someone from a visitor to China must follow these guidelines and visit clinicians if they have any symptoms related to the disease, such as cough or difficulty breathing. China has very well managed to cope up with disease spread by implementing a strict lockdown in the Province Hubei, and specifically, more attention is given to the Wuhan as having the highest number of confirmed cases. China has imposed travel restrictions to control the transmission of disease, followed later by many other countries around the globe. Regular checking of temperature and maintenance of social distancing has helped China to recover from this pandemic. China has announced new measures to avoid a second wave of infection as it progressively reopens its economy and releases citizens from coronavirus lockdowns. New measures include social distancing, personal hygiene, and, more precisely, civilized behavior. Globally, nations are much more unified than ever because emerging pathogens do not care about geopolitical boundaries. Proactive investment in medical and public health infrastructure is mandatory to respond effectively to the current coronavirus pandemic. It is important not only to sustain and enhance international collaboration, surveillance, communication, and cooperation on this major SARS-CoV-2 outbreak but also to be well prepared for future public health threats.44
Conclusion
The SARS-CoV-2 infection is transmitting very quickly with an increasing number of infected cases around the globe as well. The future development regarding its spread and definitive treatment is not clear yet; therefore, the public should take precautionary measures in dealing with the virus, since it may become very contagious and take their lives at risk of death. A higher prevalence of disease was reported in Wuhan as compared to other cities of China, so, if someone has the previous history of traveling to Wuhan or meet any infected person and experience lower respiratory problems, must go for screening at earliest. The death rate is declining in different cities of Hubei, but still, it is prevailing and spreading globally, so anyone must be careful when travelling and attending gatherings because it could cause disease to spread. Moreover, China has warned the world in good time and has fought very well against the disease. Therefore, hoping that the world will learn a lesson from China, and that this pandemic will over soon.
Acknowledgments
The authors would like to thank the funding foundations for their support.
Disclosure
The authors report no conflicts of interest in this work.
References
1. Shen Z, Ning F, Zhou W, et al. Superspreading sars events, Beijing, 2003. Emerg Infect Dis. 2004;10(2):256. doi:10.3201/eid1002.030732
2. Drosten C, Günther S, Preiser W, et al. Identification of a novel coronavirus in patients with severe acute respiratory syndrome. New England j Med. 2003;348(20):1967–1976. doi:10.1056/NEJMoa030747
3. Zaki AM, Van Boheemen S, Bestebroer TM, Osterhaus AD, Fouchier RA. Isolation of a novel coronavirus from a man with pneumonia in Saudi Arabia. New England J Med. 2012;367(19):1814–1820. doi:10.1056/NEJMoa1211721
4. Hu B, Zeng L-P, Yang X-L, et al. Discovery of a rich gene pool of bat SARS-related coronaviruses provides new insights into the origin of SARS coronavirus. PLoS Pathog. 2017;13:11. doi:10.1371/journal.ppat.1006698
5. Lau SK, Feng Y, Chen H, et al. Severe acute respiratory syndrome (SARS) coronavirus ORF8 protein is acquired from SARS-related coronavirus from greater horseshoe bats through recombination. J Virol. 2015;89(20):10532–10547. doi:10.1128/JVI.01048-15
6. Lu G, Liu D. SARS-like virus in the Middle East: a truly bat-related coronavirus causing human diseases. Protein Cell. 2012;3(11):803. doi:10.1007/s13238-012-2811-1
7. Wang C, Horby PW, Hayden FG, Gao GF. A novel coronavirus outbreak of global health concern. Lancet. 2020;395(10223):470–473. doi:10.1016/S0140-6736(20)30185-9
8. Zhou P, Yang X-L, Wang X-G, et al. A pneumonia outbreak associated with a new coronavirus of probable bat origin. Nature. 2020;579:270–273. doi:10.1038/s41586-020-2012-7
9. Huang C, Wang Y, Li X, et al. Clinical features of patients infected with 2019 novel coronavirus in Wuhan, China. Lancet. 2020;395:497–506. doi:10.1016/S0140-6736(20)30183-5
10. COVID-19 Global pandemic real-time report, 2020. Available from: http://ncov.dxy.cn/ncovh5/view/en_pneumonia?from=dxy&source=dxysjia&link=&share=.
11. Munster VJ, Koopmans M, van Doremalen N, van Riel D, de Wit E. A novel coronavirus emerging in China key questions for impact assessment. New England J Med. 2020;382(8):692–694. doi:10.1056/NEJMp2000929
12. Holshue ML, DeBolt C, Lindquist S, et al. First case of 2019 novel coronavirus in the United States. New England J Med. 2020;382:929–936. doi:10.1056/NEJMoa2001191
13. Haynes B, Messonnier NE, Cetron MS. CDC confirms additional cases of 2019 novel coronavirus in United States: media statement for immediate release: sunday. January. 2020;26:2020.
14. Patel A, Jernigan DB. Initial public health response and interim clinical guidance for the 2019 novel coronavirus outbreak United States, December 31, 2019 February 4, 2020. Morbidity Mortality Weekly Rep. 2020;69(5):140. doi:10.15585/mmwr.mm6905e1
15. Sookaromdee P, Wiwanitkit V. Imported cases of 2019-novel coronavirus (2019-nCoV) infections in Thailand: mathematical modelling of the outbreak. Asian Pac J Trop Med. 2020;13:3. doi:10.4103/1995-7645.277516
16. Yasri S, Wiwanitkit V. Exported wuhan novel coronavirus infection: an expected rate with reference to main destination of Chinese tourist, Thailand. Int J Prev Med. 2020;11(1):28. doi:10.4103/ijpvm.IJPVM_39_20
17. Li J-PO, Lam DSC, Chen Y, Ting DSW. Novel Coronavirus disease 2019 (COVID-19): the importance of recognising possible early ocular manifestation and using protective eyewear. BMJ Publishing Group Ltd. 2020.
18. Ryu S, Ali ST, Lim J-S, Chun BC. The estimate of infected individuals of the 2019-Novel Coronavirus in South Korea by incoming international students from the countries of risk of 2019-Novel Coronavirus: a simulation study. medRxiv. 2020.
19. Matsuda T, Suzuki H, Ogata N. Phylogenetic analyses of the severe acute respiratory syndrome coronavirus 2 reflected the several routes of invasion in Taiwan, the United States, and Japan. arXiv Preprint arXiv. 2020;200208802.
20. Paules CI, Marston HD, Fauci AS. Coronavirus infections more than just the common cold. JAMA. 2020;323:707. doi:10.1001/jama.2020.0757
21. Hui DS, Azhar E I, Madani TA, et al. The continuing 2019-nCoV epidemic threat of novel coronaviruses to global health. The latest 2019 novel coronavirus outbreak in Wuhan, China. Int J Infect Dis. 2020;91:264–266. doi:10.1016/j.ijid.2020.01.009
22. Momattin H, Al-Ali AY, Al-Tawfiq JA, Systematic A. Review of therapeutic agents for the treatment of the Middle East Respiratory Syndrome Coronavirus (MERS-CoV). Travel Med Infect Dis. 2019;30:9–18. doi:10.1016/j.tmaid.2019.06.012
23. De Clercq E, Li G. Approved antiviral drugs over the past 50 years. Clin Microbiol Rev. 2016;29(3):695–747. doi:10.1128/CMR.00102-15
24. Li G, De Clercq E. Therapeutic options for the 2019 novel coronavirus (2019-nCoV). Nature Publishing Group. 2020.
25. YAVUZ S, Ünal S. Antiviral treatment of COVID-19. Turkish J Med Sci. 2020;50(SI1):611–619. doi:10.3906/sag-2004-145
26. Stebbing J, Phelan A, Griffin I, et al. COVID-19: combining antiviral and anti-inflammatory treatments. Lancet Infect Dis. 2020;20(4):400–402. doi:10.1016/S1473-3099(20)30132-8
27. Dong L, Hu S, Gao J. Discovering drugs to treat coronavirus disease 2019 (COVID-19). Drug Discov Ther. 2020;14(1):58–60. doi:10.5582/ddt.2020.01012
28. Mirza MU, Froeyen M. Structural elucidation of SARS-CoV-2 vital proteins: computational methods reveal potential drug candidates against main protease, Nsp12 polymerase and Nsp13 helicase. J Pharm Analysis. 2020. doi:10.1016/j.jpha.2020.04.008
29. Arshad U, Pertinez H, Box H, et al. Prioritisation of potential anti-SARS-CoV-2 drug repurposing opportunities based on ability to achieve adequate target site concentrations derived from their established human pharmacokinetics. medRxiv. 2020.
30. Debecker A, Modis T. Determination of the uncertainties in S-curve logistic fits. Technol Forecast Soc Change. 1994;46(2):153–173. doi:10.1016/0040-1625(94)90023-X
31. Kucharavy D, De Guio R. Application of S-Shaped Curves. TRIZ-Future conference 2007. Current Scientific Industrial Reality Frankfurt;. 2007.
32. Kyurkchiev N. A family of recurrence generated sigmoidal functions based on the Verhulst logistic function. Some approximation and modelling aspects. Biomath Communications. 2016;3:2. doi:10.11145/bmc.2016.12.171
33. Chen N, Zhou M, Dong X, et al. Epidemiological and clinical characteristics of 99 cases of 2019 novel coronavirus pneumonia in Wuhan, China: a descriptive study. Lancet. 2020;395(10223):507–513. doi:10.1016/S0140-6736(20)30211-7
34. Haagmans BL, Al Dhahiry SH, Reusken CB, et al. Middle East respiratory syndrome coronavirus in dromedary camels: an outbreak investigation. Lancet Infect Dis. 2014;14(2):140–145. doi:10.1016/S1473-3099(13)70690-X
35. Azhar EI, El-Kafrawy SA, Farraj SA, et al. Evidence for camel-to-human transmission of MERS coronavirus. New England J Med. 2014;370(26):2499–2505. doi:10.1056/NEJMoa1401505
36. Brooks SK, Webster RK, Smith LE, et al. The psychological impact of quarantine and how to reduce it: rapid review of the evidence. Lancet. 2020;395:912–920. doi:10.1016/S0140-6736(20)30460-8
37. Zhu N, Zhang D, Wang W, et al. A novel coronavirus from patients with pneumonia in China, 2019. New England J Med. 2020;382:727–733. doi:10.1056/NEJMoa2001017
38. Tao Y, Shi M, Chommanard C, et al. Surveillance of bat coronaviruses in Kenya identifies relatives of human coronaviruses NL63 and 229E and their recombination history. J Virol. 2017;91(5):e01953–01916. doi:10.1128/JVI.01953-16
39. Cui J, Li F, Shi Z-L. Origin and evolution of pathogenic coronaviruses. Nat Rev Microbiol. 2019;17(3):181–192. doi:10.1038/s41579-018-0118-9
40. Millet JK, Whittaker GR. Physiological and molecular triggers for SARS-CoV membrane fusion and entry into host cells. Virology. 2018;517:3–8. doi:10.1016/j.virol.2017.12.015
41. Wang W, Tang J, Wei F. Updated understanding of the outbreak of 2019 novel coronavirus (2019‐nCoV) in Wuhan, China. J Med Virol. 2020.
42. Wirblich C, Coleman CM, Kurup D, et al. One-health: a safe, efficient, dual-use vaccine for humans and animals against Middle East respiratory syndrome coronavirus and rabies virus. J Virol. 2017;91(2):e02040–02016. doi:10.1128/JVI.02040-16
43. Zhou P, Yang X-L, Wang X-G, et al. A pneumonia outbreak associated with a new coronavirus of probable bat origin. Nature. 2020;1–4.
44. Wu Z, McGoogan JM. Characteristics of and important lessons from the coronavirus disease 2019 (COVID-19) outbreak in China: summary of a report of 72 314 cases from the Chinese Center for Disease Control and Prevention. JAMA. 2020;323(13):1239–1242. doi:10.1001/jama.2020.2648
 © 2020 The Author(s). This work is published and licensed by Dove Medical Press Limited. The
full terms of this license are available at https://www.dovepress.com/terms
and incorporate the Creative Commons Attribution
- Non Commercial (unported, 3.0) License.
By accessing the work you hereby accept the Terms. Non-commercial uses of the work are permitted
without any further permission from Dove Medical Press Limited, provided the work is properly
attributed. For permission for commercial use of this work, please see paragraphs 4.2 and 5 of our Terms.
© 2020 The Author(s). This work is published and licensed by Dove Medical Press Limited. The
full terms of this license are available at https://www.dovepress.com/terms
and incorporate the Creative Commons Attribution
- Non Commercial (unported, 3.0) License.
By accessing the work you hereby accept the Terms. Non-commercial uses of the work are permitted
without any further permission from Dove Medical Press Limited, provided the work is properly
attributed. For permission for commercial use of this work, please see paragraphs 4.2 and 5 of our Terms.