Back to Journals » Diabetes, Metabolic Syndrome and Obesity » Volume 14
Transition Patterns of Weight Status and Their Predictive Lipid Markers Among Chinese Adults: A Longitudinal Cohort Study Using the Multistate Markov Model
Authors Tang X ![]() , Zhang H, Zhao Y, Lei F, Liu Q, Hu D, Li G, Song G
, Zhang H, Zhao Y, Lei F, Liu Q, Hu D, Li G, Song G
Received 1 March 2021
Accepted for publication 21 May 2021
Published 14 June 2021 Volume 2021:14 Pages 2661—2671
DOI https://doi.org/10.2147/DMSO.S308913
Checked for plagiarism Yes
Review by Single anonymous peer review
Peer reviewer comments 2
Editor who approved publication: Professor Ming-Hui Zou
Xiao Tang,1 Hongya Zhang,1 Yanxiang Zhao,2 Fang Lei,1 Qigui Liu,1 Dongmei Hu,1 Guorong Li,1 Guirong Song1
1Department of Health Statistics, School of Public Health, Dalian Medical University, Dalian City, Liaoning Province, 116044, People’s Republic of China; 2Department of Mathematics, George Washington University, Washington, DC, USA
Correspondence: Guirong Song
Department of Health Statistics, School of Public Health, Dalian Medical University, No. 9 South Road, Lvshun District, Dalian City, Liaoning Province, 116044, People’s Republic of China
Tel +86-411-86110328
Email [email protected]
Background: Obesity is well recognized as a risk factor for cardiometabolic diseases. The development of obesity is a dynamic process that can be described as a multistate process with an emphasis on transitions between weight states. However, it is still unclear what convenient biomarkers predict transitions between weight states. The aim of this study was to show the dynamic nature of weight status in adults stratified by age and sex and to explore blood markers of metabolic syndrome (MetS) that predict transitions between weight states.
Methods: This study involved 9795 individuals aged 18 to 56 at study entry who underwent at least two health check-ups in the eight-year period of study in the health check-up centre of our institution. Weight, height and biochemical indices were measured at each check-up. The participants were divided into four groups based on age and sex (young male, middle-aged male, young female and middle-aged female groups). A multistate Markov model containing 3 states (healthy weight, overweight and obesity) was adopted to study the longitudinal weight data.
Results: Young people were more likely to transit between weight states than middle-aged people, and middle-aged people were more resistant to recover from worse states. The mean sojourn time in obesity was greatest in the middle-aged male group (6.23 years), and the predicted rate of obesity beginning with healthy weight was greatest in the young male group (13.7%). In multivariate models, age group and triglyceride (TG) and high-density lipoprotein cholesterol (HDL) levels were significant for specific transitions in females, whereas age group and HDL levels were significant in males. In females, if HDL levels increased 1 mmol/L, the probability of progression from healthy weight to overweight decreased by 37.0% (HR= 0.63), and the probabilities of recovery (overweight to healthy weight and obesity to overweight) increased by 62.0% (HR= 1.62) and 1.23-fold (HR= 2.23), respectively. In males, if TG levels increased 1 mmol/L, the risk of progression from healthy weight to overweight increased by 24.0% (HR= 1.24). Each unit increase in HDL levels was associated with a 0.99-fold (HR= 1.99) increase in the chance of recovery from overweight to healthy weight and with a 0.37-fold (HR= 0.63) decrease in the risk of progression from healthy weight to overweight.
Conclusion: The weight status of young people was less stable than that of middle-aged people. Males were more likely to become overweight and more resistant to recover from worse states than females. Young males with healthy weight were more likely to develop obesity than other healthy weight groups. Blood lipid levels, especially HDL, were predictors of weight transitions in adults. Prevention and intervention measures should be applied early.
Keywords: obesity, multistate Markov model, triglyceride, high-density lipoprotein cholesterol, low density lipoprotein cholesterol
Introduction
Overweight and obesity have been worldwide public health concerns. Obesity is responsible for many diseases, such as cardiovascular diseases (CVDs), stroke, and cancer.1–4 Obesity and obesity-related diseases have brought heavy social and economic burdens worldwide.5–8 With the rapid economic growth in China, Chinese people’s lifestyle has changed in many aspects, including diet, forms of transportation, physical activity and education, which have been accompanied by a rapid increase in the prevalence of overweight/obesity over the past two decades, especially in urban areas.9
Many previous studies have focused on the prevalence of overweight/obesity at a certain time or described trends in prevalence over a period.9–13 However, weight change is a dynamic process in which individuals may experience successive weight states over a period, involving healthy weight, overweight and obesity. Therefore, the progression of obesity should be defined as a multistate process with a focus on transitions between weight states, which cannot be reflected by the prevalence of overweight/obesity alone. The flow rate of a population from one weight state to another and the mean sojourn time of individuals at each weight state are essential to understand the nature of the progression of overweight/obesity. Moreover, previous studies have shown that males and females have different metabolic characteristics, and the incidence rates of metabolic diseases associated with obesity differ across different age and sex groups.14–16 Therefore, it is important to explore the features of transitions between weight states by age and sex to develop targeted prevention and intervention strategies. To the best of our knowledge, there have not been many studies on dynamic weight changes in Chinese adults.
Lipid indices such as total cholesterol (TC), triglyceride (TG), high-density lipoprotein cholesterol (HDL) and low-density lipoprotein cholesterol (LDL) are biomarkers that can predict CVD and metabolic syndrome (MetS). In addition, the relationships between these biomarkers and weight have also been shown in many cross-sectional and cohort studies.17–19 However, most prospective studies have focused on the effects of weight gain on these biochemical indices,20–22 but whether changes in blood lipids predict weight gain remains unclear. In a limited number of studies, the role of blood lipids in predicting overweight/obesity has been inconsistent due to differences in subject characteristics and follow-up period. Lower HDL levels were found to be the only blood predictor of the development of metabolically healthy obesity in nonobese healthy adults in Iran after a mean follow-up period of 13 years.20 TC levels predicted a change in body mass index (BMI) over 12 months in Australian pre-pubertal children, while TG, HDL and insulin levels did not.21 It is well known that blood lipids are closely related to lifestyle, such as physical activities and dietary habits, so it is beneficial to seek convenient blood lipids to predict weight changes and, in turn, develop prevention lifestyle strategies. Therefore, it is urgent to explore easily measured blood lipids to predict overweight/obesity. Moreover, because weight change is a dynamic process that may include different weight states, it is necessary to identify convenient blood lipid biomarkers that affect transitions between weight states.
While an individual’s weight status changes continuously, only a specific state can be observed at a certain time. Therefore, the exact time of the change in weight state is often unclear. Furthermore, the time interval between two observations may vary by individual. To overcome such issues, the multistate Markov model has been adopted, which is a useful tool to describe a process in which an individual goes through a series of states.23 First, the transition intensity, which reflects the flow rate of transitions between any two states, can be obtained from the model. Second, classic logistic and Cox regression models only include a single outcome, but the multistate Markov model can analyse multiple outcomes in one system. Third, the multistate Markov model does not require equal lengths for the time intervals between two consecutive observations for different individuals, and therefore, this model makes full use of longitudinal data. Fourth, in the multistate Markov model, the covariate values at the preceding visit are used to predict the outcome state at the subsequent visit; thus, this model can powerfully determine predictors for transitions.
Previous studies have shown that the prevalence of obesity/overweight in China was higher in the North than in the South and in urban areas than in rural areas.24–26 Dalian is a modern and developed city in Northeast China. The aim of the current study was to build a multistate Markov model to describe the dynamic nature of weight status in adults by age and sex and to show how demographics and blood lipids affect transitions between weight states. We focused on young and middle-aged people for the early detection and prevention of obesity. To the best of our knowledge, this is the first longitudinal study to analyse weight change and their predictive lipid markers in Chinese adults by the multistate Markov model.
Materials and Methods
Patients and Data
This was a retrospective cohort study. The data were collected from health check-ups acquired from January 2010 to December 2017 at the Second Hospital Affiliated with Dalian Medical University. This study was approved by the ethics committee of Dalian Medical University (Ethics Approval No. 2020 006). The eligibility criteria for the study were age between 18 and 56 at the first check-up, two or more health check-ups in the eight-year study period, and no history of diabetes mellitus or CVD at the first check-up. The data for the first check-up were regarded as baseline data. Participants with a body mass index (BMI) <18.5 at baseline or whose measurement of any blood markers (Glu, TC, TG, HDL and LDL) were outside of the  at baseline were excluded from the cohort. Finally, data from a total of 9795 participants were collected in this study. The participants were divided into four groups based on age and sex. The young group included individuals with baseline ages between 18 and 36, and the middle-aged group included individuals with baseline ages between 36 and 56.14,16 The maximum ages of the young and middle-aged groups were no more than 42 and 62 years, respectively, during the follow-up.
At each check-up, the subjects were asked for information on their personal medical history, especially a history of metabolic diseases such as diabetes, hyperlipidaemia, and hypertension, and their medication situation. Their weight with light clothing and barefoot height were measured. BMI was calculated as the body mass divided by the square of the body height, in units of kg/m2. Venous blood was taken after 12 hours of overnight fasting. Biochemical measures included serum glucose (Glu), TG, TC, HDL and LDL, which were measured on a Siemens ADVIA 2400 automatic biochemical analyser. Glu levels were determined by the hexokinase method. TG levels were determined by the phosphoglyceride oxidase-peroxidase method. TC levels were determined by the visible absorption spectrophotometry method. HDL levels were measured by using the enzyme selective protection method. LDL levels were measured by the visible absorption spectrophotometry method.
Based on the criteria of the Working Group on Obesity in China,27 the subjects were classified into three weight status categories at each assessment: healthy weight, overweight or obesity. Healthy weight, overweight and obesity were defined as a BMI of  2, a BMI of
  2 and a BMI
  2, respectively.
Markov Model
The Concept of Multistate Models
The development of a disease usually includes several stages. A subject may be followed up at an arbitrary time for different reasons. A multistate model has the advantage of investigating the evolution of a disease by considering continuous status changes.23
 denotes an individual’s state at time t. The transition intensity
  is the instantaneous risk of transitioning from state r to state s at time t:

All possible intensities form the transition matrix  . The diagonal entries are defined by
  . All entries can be estimated by entering data into the Markov model. The covariate vector
  for transition intensity
  can be investigated by the following equation:
where  is the coefficient vector representing the effects of covariates on the transition from state r to state s and can be interpreted similarly to those in the ordinary Cox regression model in terms of hazard ratios.
 is used to determine the transition probability matrix
  which includes all transition probabilities
  , where
 and
and  are the initial and ending points of the interval between two consecutive observations, respectively
 Time-dependent covariates are assumed to be piecewise constant in the model, that is, the value of the covariate at initial point
  is used to predict the state at the end point t.
Three-State Markov Model
In this study, the Markov model included three states: healthy weight, overweight and obesity. These three states were mutually exclusive, and there was no absorbing state because the mortality rate among healthy people was very low. Note that the weight status of an individual changes continuously, so the individual may advance to or recover from the adjacent states in the continuous-time multistate model. Transitions were permitted from healthy weight to overweight, overweight to obesity, overweight to healthy weight and obesity to overweight. A model schematic is presented in Figure 1. Because of different characteristics in metabolism between males and females, Markov models were constructed by sex. Age group, Glu, TC, TG, HDL and LDL were exploratory variables to determine significant factors for weight transitions.
 |
Figure 1 A 3-state Markov model to describe the progression of obesity. |
Statistical Analysis
Data were recorded and analysed with Excel 2016. Means and standard deviations were used to express continuous variables with a normal distribution, and medians and quartile were used to present variables with a non-normal distribution. Percentages were used to describe discrete variables. The MSM package R 3.2 was used to build the continuous multistate Markov model. Transition intensities between states and mean sojourn time in each state were estimated by age and sex. The covariates in the Markov models included age group (middle-aged group vs young group) and Glu, TC, TG, HDL, and LDL levels. The effects of covariates on weight transitions were assessed by sex. First, univariate models were used to determine the effect of each factor. Second, significant factors in the univariate models were entered into the multivariate model. Excel 2016 was used to make a line graph with predicted rates of obesity in individuals beginning with healthy weight over 7.5 years.
Results
A total of 9795 individuals aged 20–56 years, 46.3% male and 53.7% female, were included in our study. A summary of the information of individuals at baseline is presented in Table 1. General information on weight states at baseline and for each follow-up year is presented in Table 2. The average length of the follow-up time was 3.83 years. The prevalence of overweight and obesity was much higher in males than in females. The prevalence of overweight and obesity increased with the length of follow-up in females, whereas it steadily fluctuated in males.
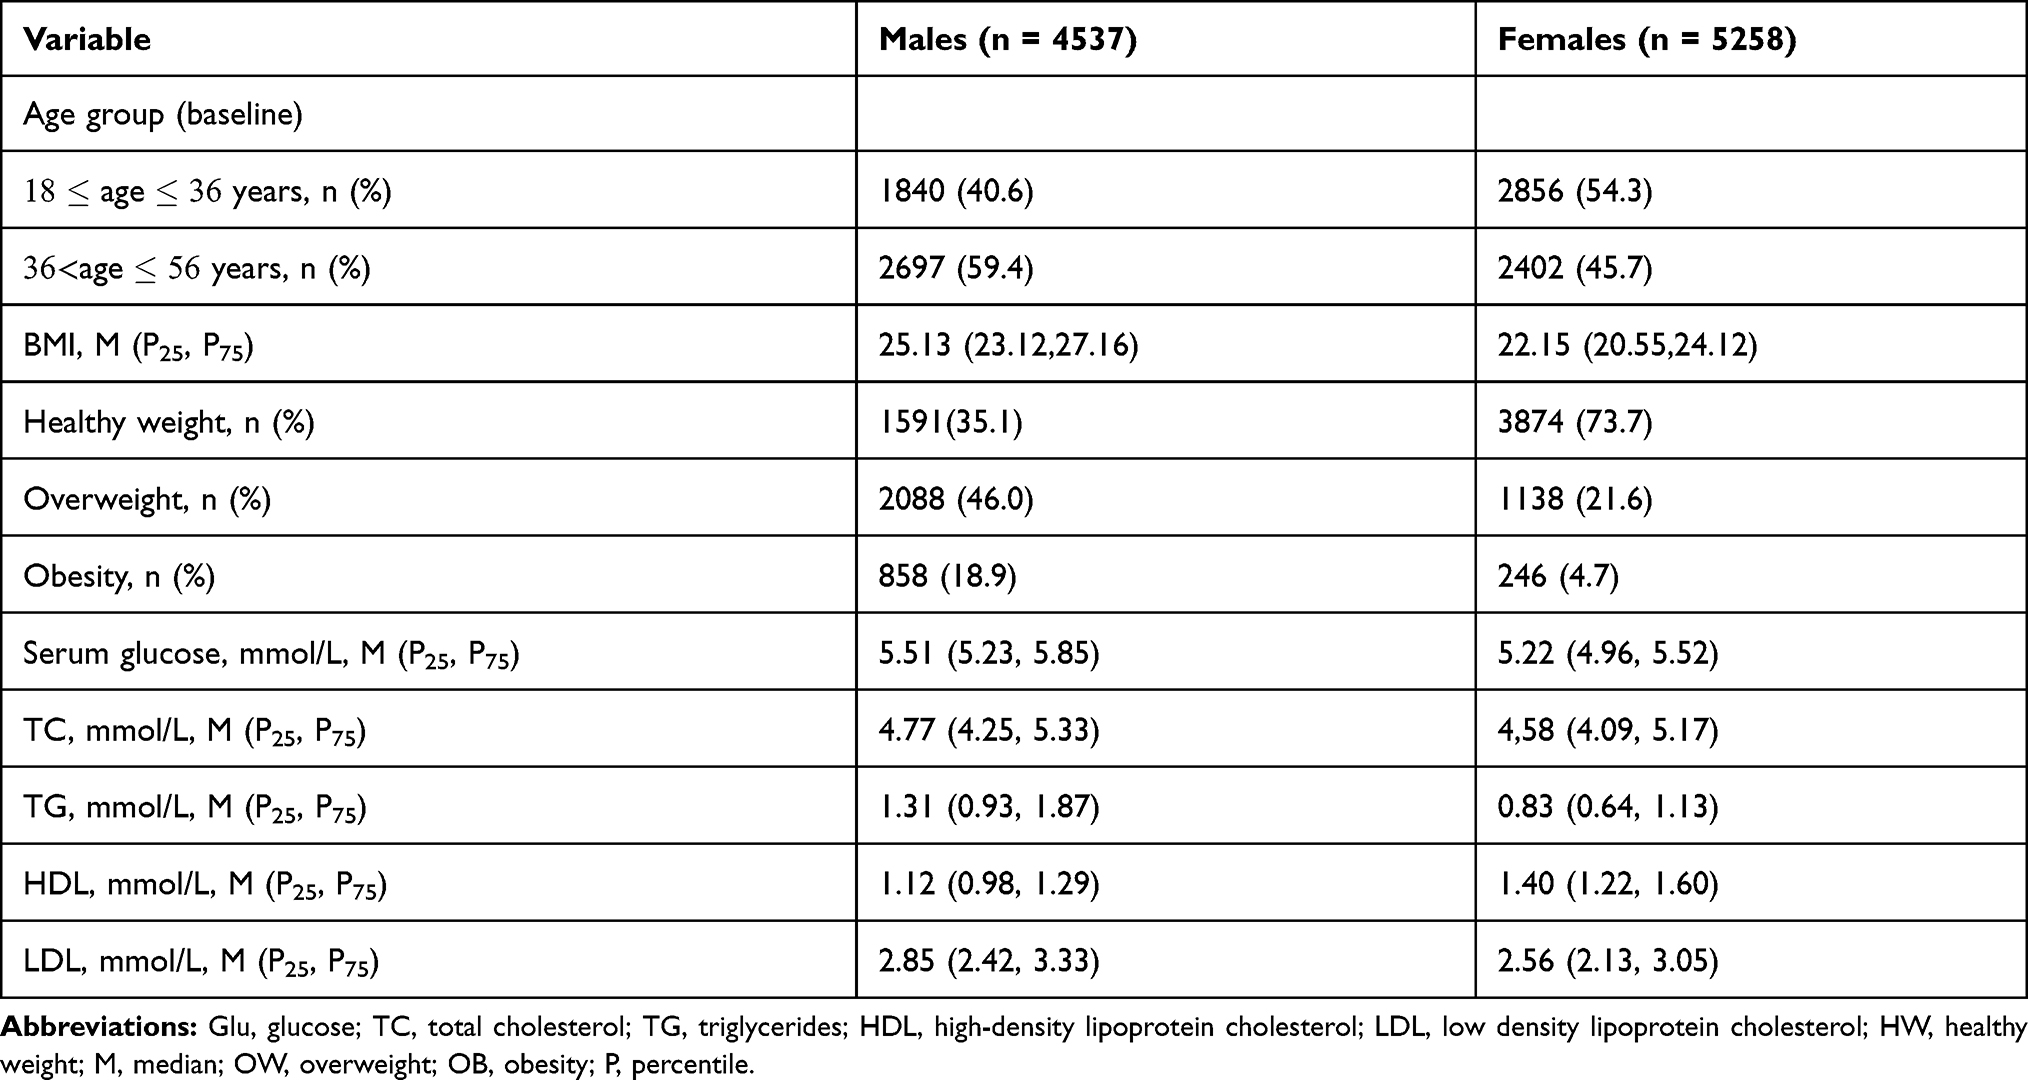 |
Table 1 Main Characteristics of Subjects at Baseline |
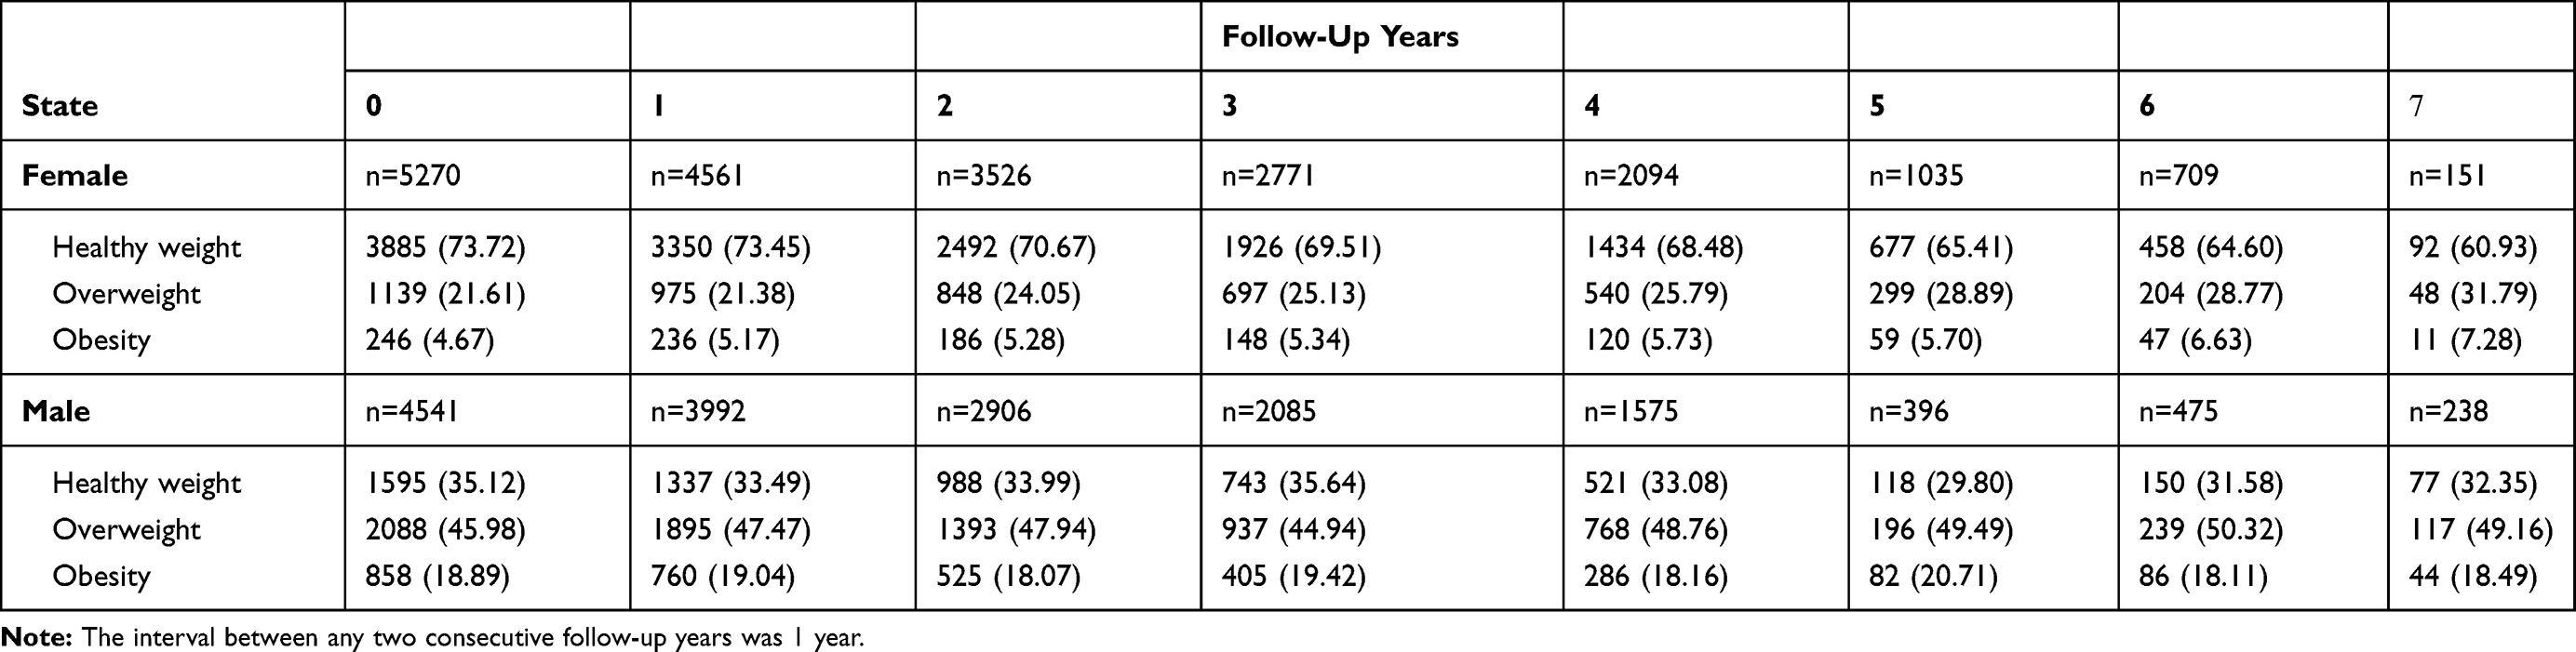 |
Table 2 Prevalence of Overweight and Obesity and Various Lengths of Follow-Up [n(%)] |
The estimated transition intensities are given in Table 3. In both age groups, males were more likely to progress from healthy weight to overweight than females and were more resistant to recover from obesity. Young females were more likely to move to other states than middle-aged females (transition intensity from healthy weight to overweight: 0.11 vs 0.09; overweight to healthy weight: 0.37 vs 0.18; overweight to obesity: 0.12 vs 0.06; obesity to overweight: 0.42 vs 0.27). Young males and middle-aged males had similar intensities of transitions between states, while only the probability of progressing from overweight to obesity seemed higher in young males than in middle-aged males (0.10 vs 0.06). Table 4 shows the mean sojourn time in each state specified by sex and age. In both age groups, the mean sojourn times in overweight and obesity were greater in males than in females. In both males and females, middle-aged individuals had greater sojourn times in the same state than young individuals. The greatest sojourn time in overweight and obesity appeared in the middle-aged male group (5.90 and 5.38 years, respectively).
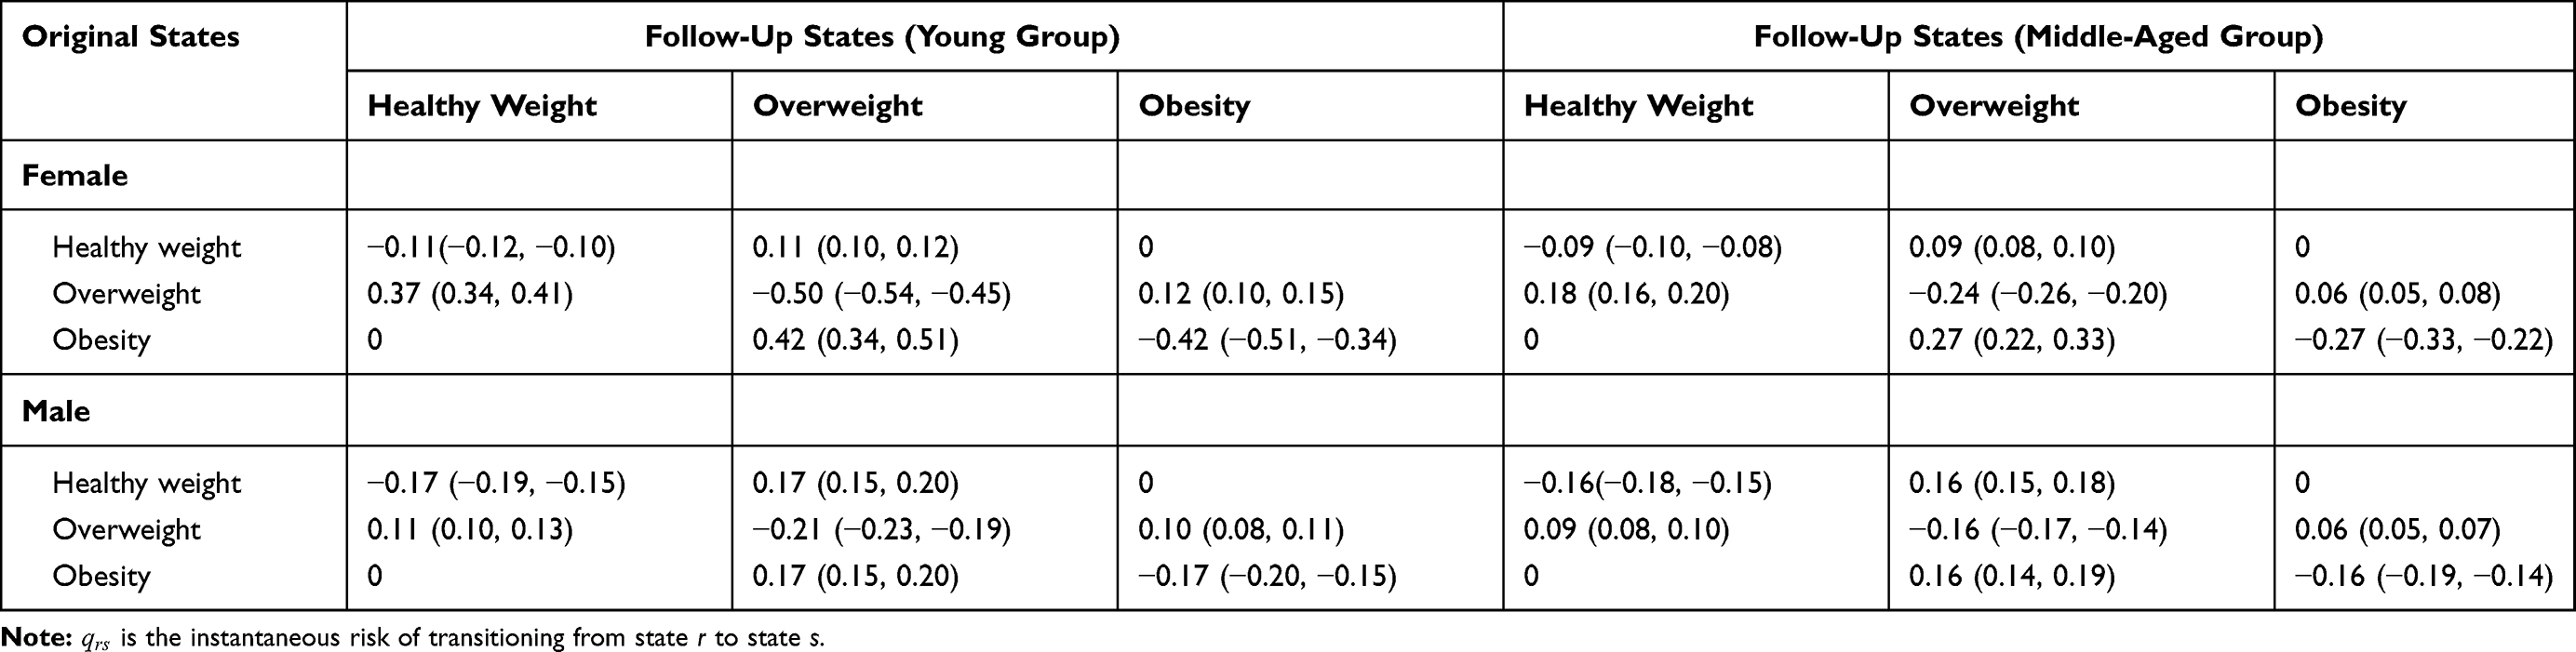 |
Table 3 Transition Intensities Estimated by the Multistate Model [ |

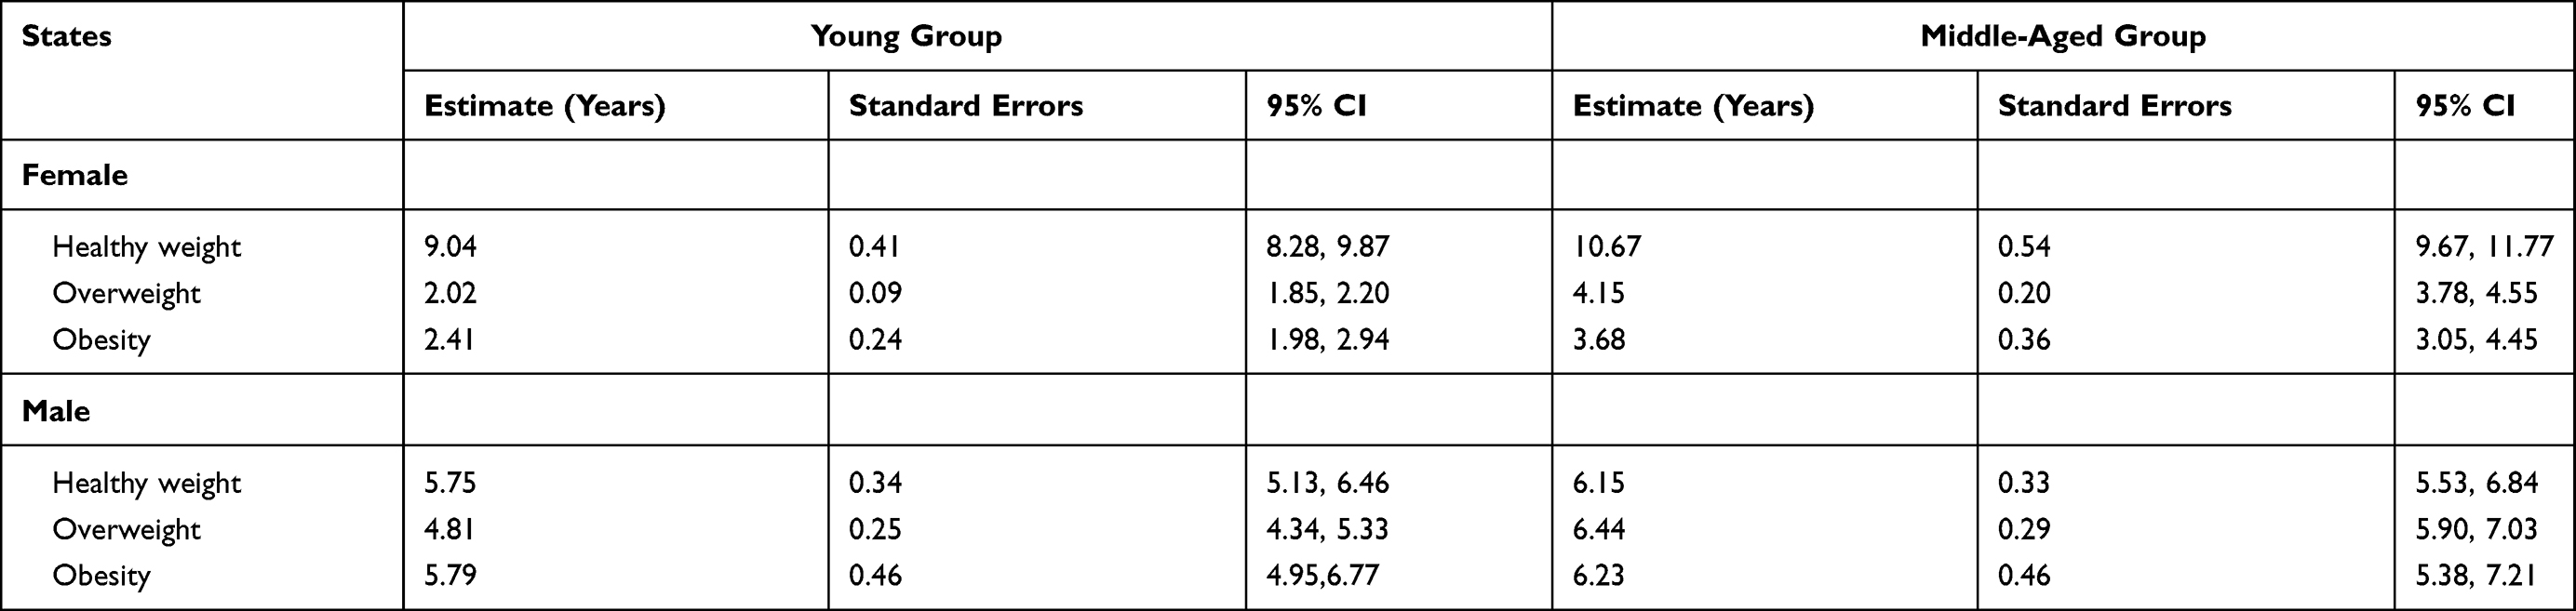 |
Table 4 Estimated Mean Sojourn Time in Each State |
The results regarding the progression from healthy weight to obesity in each group are presented in Figure 2. The rate of obesity in individuals beginning with healthy weight increased with time. Young groups were more likely to develop obesity than middle-aged groups, and males were more likely to develop obesity than females. The predicted rates of obesity varied greatly between groups. After 7.5 years, obesity developed in an estimated 13.7% of young males and 4.5% of middle-aged females.
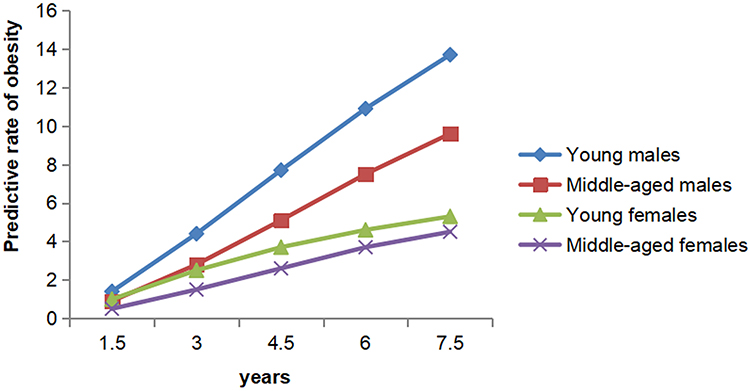 |
Figure 2 Predicted development of obesity starting with healthy weight. |
Table 5 displays the effects of covariates on each transition in females. The 95% confidence interval (CI) indicated that age group and Glu, TC, TG, HDL and LDL levels were significant factors for some particular transitions in the univariate models. Compared with young females, middle-aged females tended to maintain their preceding weight state. Increases in TC, TG and LDL levels predicted the transition from healthy weight to overweight, and increases in Glu and LDL levels also made females less likely to recover from obesity. Females with higher HDL levels were more likely to recover from overweight or obesity and less likely to progress from healthy weight to overweight. However, only age group and HDL levels were significant for some particular transitions in the multivariate model. If HDL levels increased 1 mmol/L, the probability of progression from healthy weight to overweight decreased by 37.0% (HR= 0.63), and the probabilities of recovery (overweight to healthy weight and obesity to overweight) increased by 62.0% (HR= 1.62) and 1.23-fold (HR= 2.23), respectively.
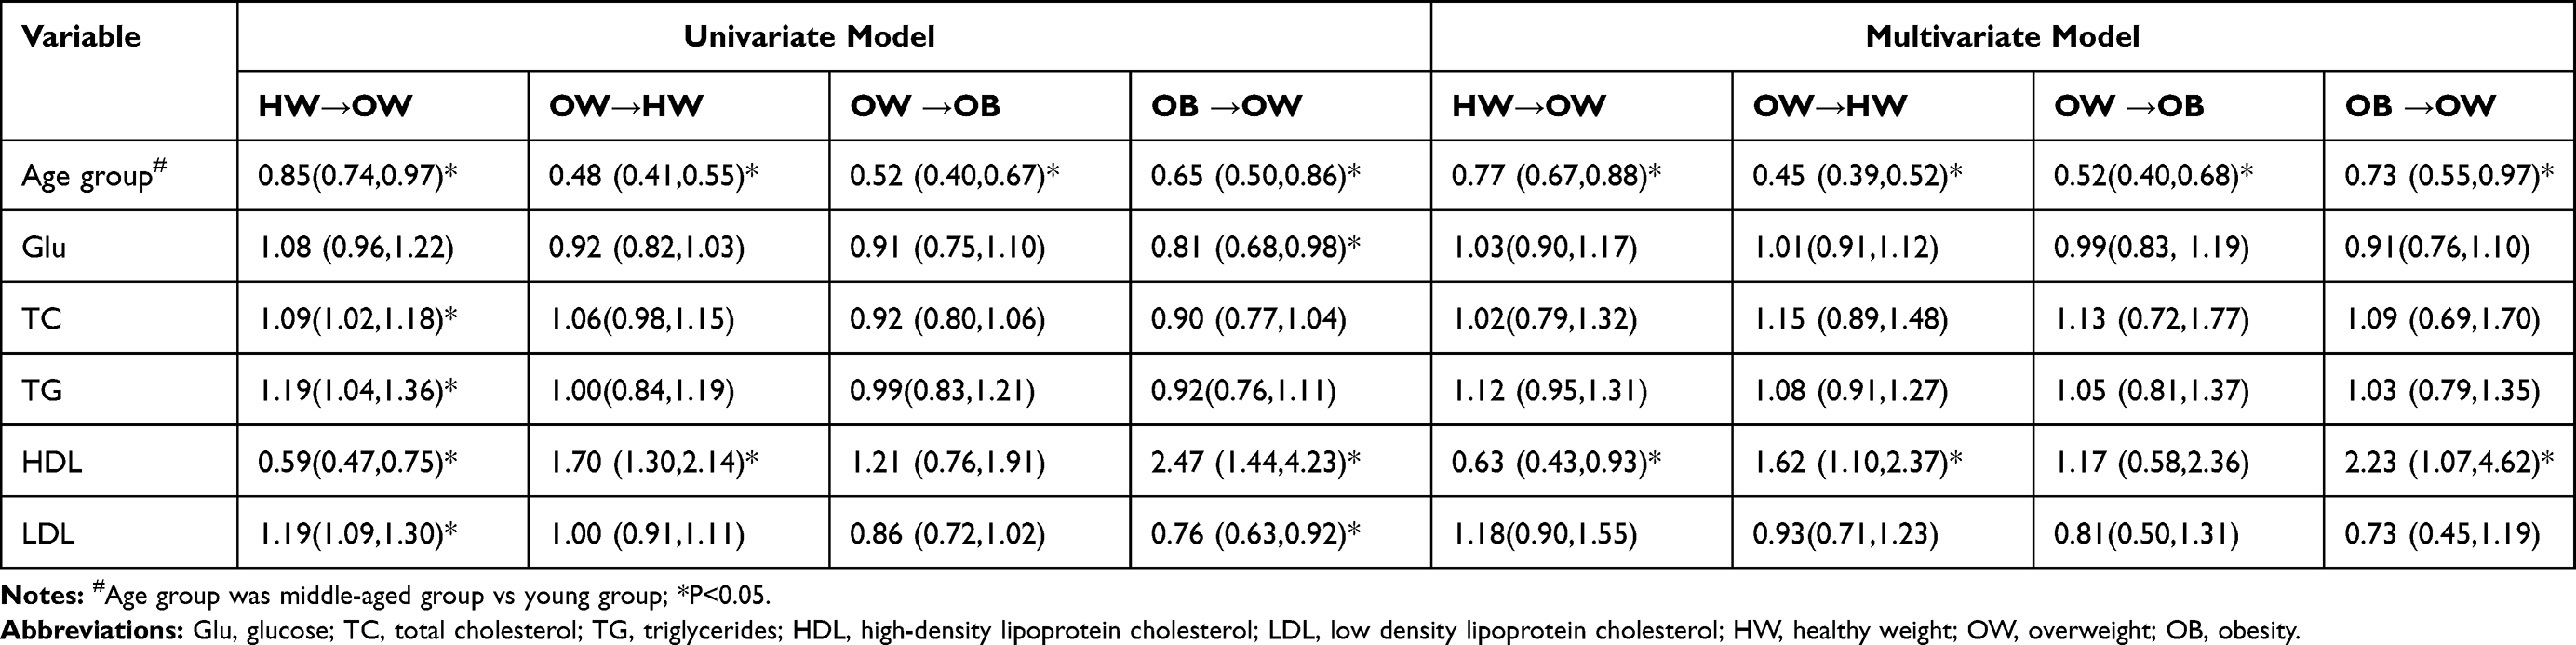 |
Table 5 Effects of Different Covariates on Weight Transitions in Females [Hazard Ratios (95% CIs)] |
The effects of covariates on transitions in males are shown in Table 6. Age group and TG and HDL levels were significant factors for some transitions in the univariate and multivariate models. Middle-aged males were less likely to change their weight state than young males. Males with higher TG or lower HDL levels had a greater risk of progressing from healthy weight to overweight, while higher HDL levels predicted recovery from overweight. If TG levels increased 1 mmol/L, the risk of progression from healthy weight to overweight increased by 24.0% (HR= 1.24). Each unit increase in HDL levels was associated with a 0.99-fold (HR= 1.99) increase in the chance of recovery from overweight to healthy weight and with a 0.37-fold (HR= 0.63) decrease in the risk of progression from healthy weight to overweight.
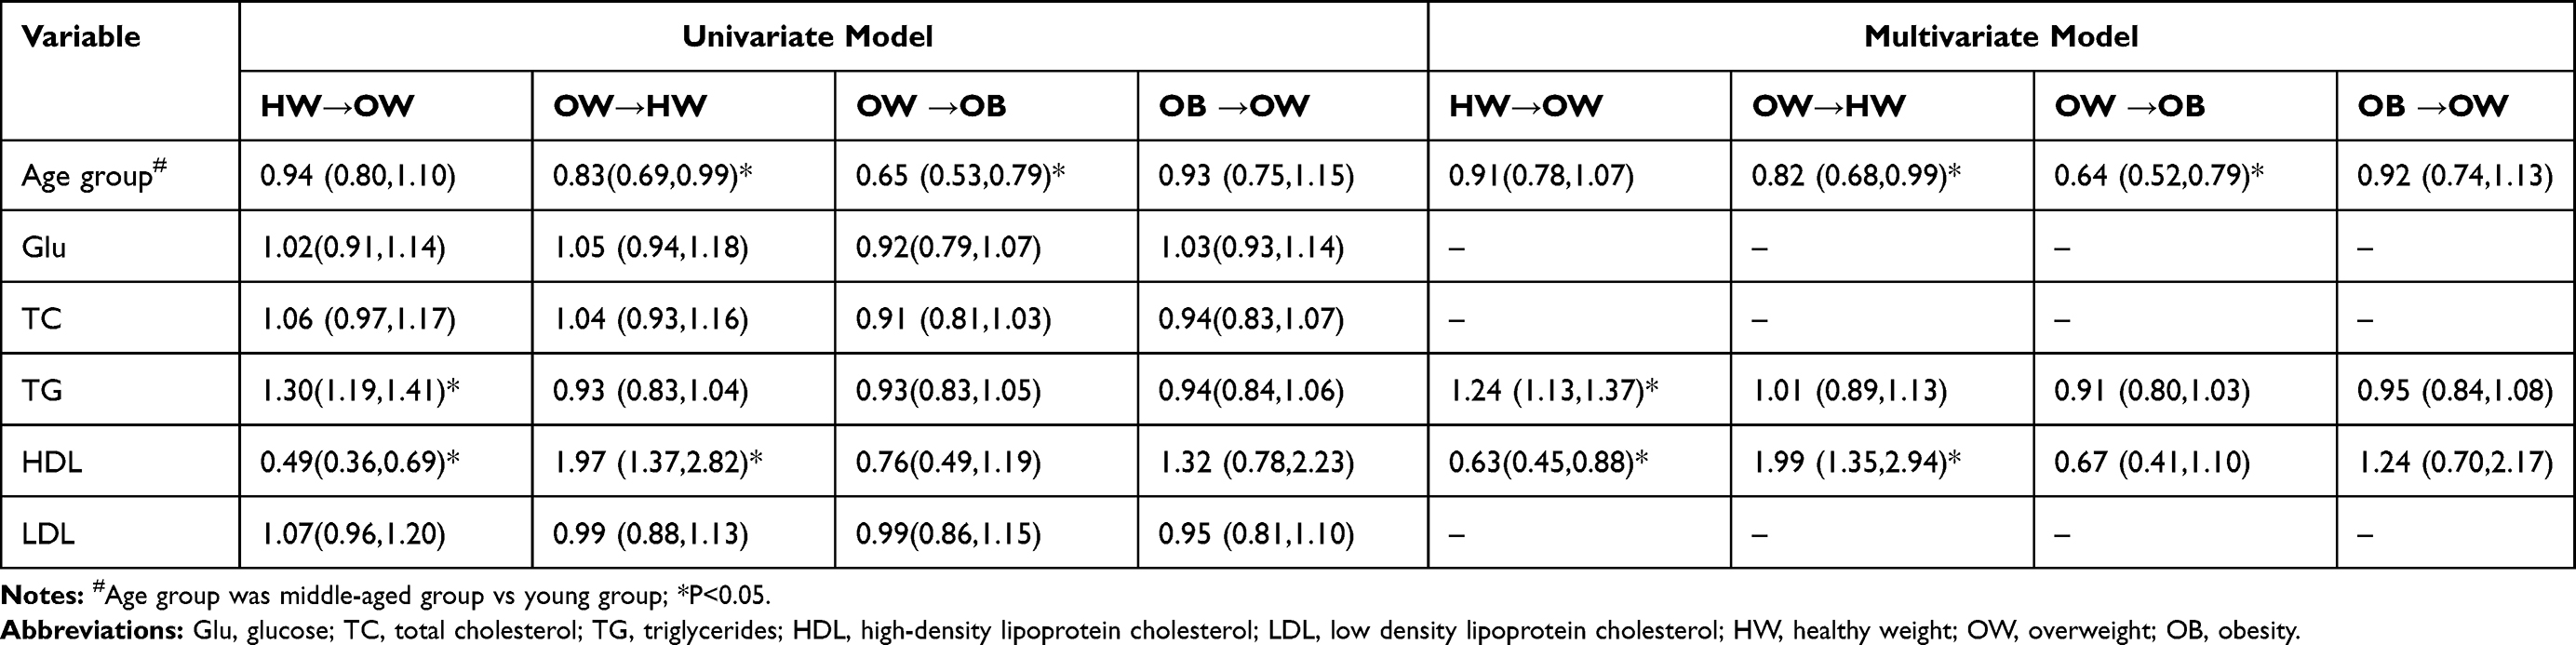 |
Table 6 Effects of Different Covariates on Weight Transitions in Males [Hazard Ratios (95% CIs)] |
Discussion
The current study describes the dynamic evolution of obesity by sex and age and explores the blood lipids that can predict weight transitions based on a large longitudinal dataset.
Our results indicated that males were more likely to transit from healthy weight to overweight and more resistant to recover from worse states than females. Moreover, males had a higher prevalence and more sojourn time in overweight and obesity than females. This might be due to differences in lifestyles, genetics or behaviour between males and females. The wheat staple pattern and the rice staple pattern are two traditional dietary patterns in China. A recent study in Shanghai showed that males with these two dietary patterns had a greater risk of obesity than females.28 Moreover, traditional Chinese cultures favour females with slender body shapes,29 so females may be more sensitive to their weight and more active in weight control than males. In the current study, the predicted rates of obesity with time were greater in males than in females beginning at healthy weight. In a study based on a large population in Northeast China, males had a higher prevalence of overweight or obesity than females.30 Some studies in other countries also obtained similar results, with a higher prevalence of obesity in males.12,31 These results on differences in prevalence between males and females were partly similar to those we found. However, the prevalence of obesity was greater in females than in males in some populations.32 These opposite results may be due to differences in the geographical and cultural background of the population.
Many studies have reported that the prevalence of obesity increases with age until 60 years in both males and females.10,12,33 In our study, age was also responsible for the weight transitions. Young people were more likely to transit from one weight state to another, regardless of progression or recovery. Middle-aged people with overweight or obesity tended to maintain their preceding weight state. These results were partly consistent with one of our previous studies, in which the numbers of transitions from obesity to healthy weight were greater in young people than in middle-aged people.14 One reason may be a decline in metabolic capability in middle-aged people, which makes it difficult for those who have been obese to lose weight. There is evidence that weight gain is associated with metabolic disorders in menopausal females.34 Middle-aged people with healthy weight might be likely to have had a healthy lifestyle from a young age, which helped to maintain their healthy weight. Our results suggested that prevention and intervention should be implemented early for young people due to their weight instability and easier recovery.
In the current study, TC, TG and LDL levels were found to positively predict the onset of overweight in males and females, whereas they were not significant predictors for transiting from overweight to obesity. Moreover, HDL levels were a sensitive predictor of weight transitions in both males and females. Few cohort studies have investigated the probability of lipid indices predicting weight gain. A cohort study in Sydney showed that TC levels at baseline had a positive association with changes in BMI over 12 months in pre-pubertal children,21 which demonstrated that TC levels were a predictor of weight gain. The Tehran Lipid and Glucose Study identified lower HDL levels as a predictor of the development of metabolically healthy obesity in nonobese healthy adults.20 The findings in these studies were partly consistent with ours. However, a cohort study in Finnish adults showed that higher TC, higher Glu and lower HDL levels at baseline predicted weight loss over 6.5 years.22 This result was contrary to previous results and our results. In that study, the time between the baseline and the end point was relatively long, and fluctuations in the indicator before the end point could not be measured, which may have made the association between baseline biomarkers and outcome events slightly weak. Our study was based on longitudinal data with multiple repeated measurements, and the interval between any two consecutive follow-up years was approximately one year.
In the current study, HDL level was the strongest biomarker in both males and females. HDL is well recognized as a potent atheroprotective biomarker due to the role of HDL in the reverse cholesterol transport pathway. Cholesterol can be combined with HDL and transported from peripheral tissues to the liver and then excreted in the faeces.35 This process might be helpful to control weight by maintaining the balance of cholesterol in the body.
From the perspective of prevention, our findings showed that increases in HDL levels benefit transitions from worse weight states to better states or staying at better weights, which provided the direction for prevention and control of obesity. Several studies have reported that physical activities and dietary habits can significantly influence cholesterol. A study based on a large sample of Taiwanese adults showed that aerobic exercise and regular badminton were associated with higher levels of HDL.36 Another large-sample study in Taiwan found that even after adjusting for smoking and BMI, weekly exercise durations of < 2.5 and  hours both significantly increased HDL levels compared to exercise durations of 0 hours.37 Similar results were obtained in other studies.38–40 On the other hand, dietary habits also have a strong influence on HDL levels. A Mediterranean diet, which is characterized by high consumption of vegetables, fruits, legumes, wheat-based cereals, nuts, fish, and especially olive oil and low consumption of red and processed meat, is recognized as a dietary pattern that helps to increase HDL levels.41 However, a low-fat, plant-based eating pattern was linked to a decrease in HDL levels.42 Although there was a lack of individual information on physical activities and dietary habits in the current study, the association of HDL levels with lifestyle may partly explain our results. The principle of the Markov model in our study indicates that the transitions between weight states were influenced by HDL levels, which is changeable with lifestyle. Lifestyle factors such as dietary habits and physical activities may affect changes in blood lipids, leading to changes in body weight. In addition, finding convenient blood lipids that can predict weight changes benefits the development of corresponding lifestyle prevention strategies. For example, certain types of physical activity can be taken to increase or decrease the HDL concentration. The right food choices can lower HDL level.36,41,42
This study has some limitations. First, behavioural factors, such as dietary habits, physical activity and sleep time, were not included in the analysis. However, lifestyle may be an underlying factor affecting blood indicators. After identifying blood biomarkers that can predict weight state transitions, a corresponding lifestyle change would also be advocated to reduce the risk of obesity and cardiovascular disease. Future research will aim to investigate more variables to explore the important factors for the progression and regression of weight states. Second, the “natural” transition probability might not be completely natural because some individuals might have received interventions through health services.
Conclusion
The weight status of young people was less stable than that of middle-aged people. Males were more likely to progress to overweight from healthy weight and more resistant to recover from worse states than females. Young males with healthy weight were more likely to develop obesity than other healthy weight groups. Blood lipid levels, especially HDL, were the strongest predictors of weight transitions. Prevention and intervention measures should be adopted early due to the instability of weight states for the group of young people.
Abbreviations
Glu, serum glucose; TC, total cholesterol; TG, triglyceride; HDL, high-density lipoprotein cholesterol; LDL, low-density lipoprotein cholesterol; MetS, metabolic syndrome; BMI, body mass index.
Data Sharing Statement
The datasets used and analysed in the present study are available from the corresponding author upon reasonable request.
Ethics Approval and Consent to Participate
All participants involved in the study were informed about the purpose of the study, and all research procedures were conducted in accordance with the 1964 Declaration of Helsinki. This study was approved by the ethics committee of Dalian Medical University (Ethics Approval No. 2020 006). Since we excluded all identifiable personal information, the ethics committee agreed to waive the requirement for informed consent of the study.
Acknowledgments
The authors thank all the study participants and the health workers who participated in the health check-ups at the physical examination centre of the Second Affiliated Hospital of Dalian Medical University.
Author Contributions
XT is the first author. GS is the corresponding author. XT and GS designed the study. HZ, YZ, FL, QL, DH and GL screened and extracted the data. All authors contributed to data analysis, drafting or revising the article, have agreed on the journal to which the article will be submitted, gave final approval of the version to be published, and agree to be accountable for all aspects of the work.
Funding
This study was funded by National Key R&D Program of China (2018YFC1311600).
Disclosure
The authors declare that they have no competing interests.
References
1. Sironi AM, Petz R, De Marchi D, et al. Impact of increased visceral and cardiac fat on cardiometabolic risk and disease. Diabet Med. 2012;29(5):622–627. doi:10.1111/j.1464-5491.2011.03503.x
2. Ferrara D, Montecucco F, Dallegri F, Carbone F. Impact of different ectopic fat depots on cardiovascular and metabolic diseases. J Cell Physiol. 2019;234(12):21630–21641. doi:10.1002/jcp.28821
3. Karczewski J, Begier-Krasinska B, Staszewski R, Poplawska E, Gulczynska-Elhadi K, Dobrowolska A. Obesity and the risk of gastrointestinal cancers. Dig Dis Sci. 2019;64(10):2740–2749. doi:10.1007/s10620-019-05603-9
4. Ecker BL, Lee JY, Sterner CJ, et al. Impact of obesity on breast cancer recurrence and minimal residual disease. Breast Cancer Res. 2019;21(1):41. doi:10.1186/s13058-018-1087-7
5. Lee JE, Nam CM, Lee SG, Park S, Kim TH, Park EC. The economic burden of cancer attributable to obesity in Korea: a population-based cohort study. Eur J Cancer Care (Engl). 2019;28(5):e13084. doi:10.1111/ecc.13084
6. Kharlamov AN. Cardiovascular burden and percutaneous interventions in Russian Federation: systematic epidemiological update. Cardiovasc Diagn Ther. 2017;7(1):60–84. doi:10.21037/cdt.2016.08.10
7. Tremmel M, Gerdtham UG, Nilsson PM, Saha S. Economic burden of obesity: a systematic literature review. Int J Environ Res Public Health. 2017;14(4):435. doi:10.3390/ijerph14040435
8. Xi B, Liang Y, He T, et al. Secular trends in the prevalence of general and abdominal obesity among Chinese adults, 1993–2009. Obes Rev. 2012;13(3):287–296. doi:10.1111/j.1467-789X.2011.00944.x
9. Jian-Gao F, Seung-Up K, Vincent Wai-Sun W. New trends on obesity and NAFLD in Asia. J Hepatol. 2017;67(4):862–873. doi:10.1016/j.jhep.2017.06.003
10. Tian H, Xie H, Song G, Zhang H, Hu G. Prevalence of overweight and obesity among 2.6 million rural Chinese adults. Prev Med. 2009;48(1):59–63. doi:10.1016/j.ypmed.2008.10.020
11. Kontsevaya A, Shalnova S, Deev A, et al. Overweight and obesity in the russian population: prevalence in adults and association with socioeconomic parameters and cardiovascular risk factors. Obes Facts. 2019;12(1):103–114. doi:10.1159/000493885
12. Chamieh MC, Moore HJ, Summerbell C, Tamim H, Sibai AM, Hwalla N. Diet, physical activity and socio-economic disparities of obesity in Lebanese adults: findings from a national study. BMC Public Health. 2015;15:279. doi:10.1186/s12889-015-1605-9
13. Dongfen G, Reynolds K, Xigui W, et al. Prevalence of the metabolic syndrome and overweight among adults in China. Lancet. 2005;365:1398–1405. doi:10.1016/S0140-6736(05)66375-1
14. Xiao T, Qigui L, Li J, Jiang D, Xiao T-G, Zeng J-H. Prediction of the development of metabolic syndrome by the Markov model based on a longitudinal study in Dalian City. BMC Public Health. 2018;18. doi:10.1186/s12889-018-6207-x
15. Ying L, Yongjun F, Kehua L, et al. Sex-specific association of serum uric acid dynamics with the incidence of metabolic syndrome in a health check-up Chinese population: a prospective cohort study. BMJ Open. 2020;10(7).
16. Appleton SL, Seaborn CJ, Visvanthan R, et al. Diabetes and cardiovascular disease outcomes in the metabolically healthy obese phenotype: a cohort study. Diabetes Care. 2013;36(8):2388–2394. doi:10.2337/dc12-1971
17. Orces CH, Montalvan M, Tettamanti D. Prevalence of abdominal obesity and its association with cardio metabolic risk factors among older adults in Ecuador. Diabetes Metab Syndr. 2017;11(Suppl 2):S727–S733. doi:10.1016/j.dsx.2017.05.006
18. Dansinger M, Williams PT, Superko HR, Asztalos BF, Schaefer EJ. Effects of weight change on HDL-cholesterol and its subfractions in over 28,000 men and women. J Clin Lipidol. 2019;13(2):308–316. doi:10.1016/j.jacl.2018.12.001
19. Barbalho SM, Tofano RJ, de Oliveira MB, et al. HDL-C and non-HDL-C levels are associated with anthropometric and biochemical parameters. J Vasc Bras. 2019;18:e20180109. doi:10.1590/1677-5449.180109
20. Eftekharzadeh A, Asghari G, Serahati S, et al. Predictors of incident obesity phenotype in nonobese healthy adults. Eur J Clin Invest. 2017;47(5):357–365. doi:10.1111/eci.12743
21. Byrnes SE, Bau LA, Bermingham M, Brock K, Steinbeck K. Leptin and total cholesterol are predictors of weight gain in pre-pubertal children. Int J Obes. 1999;23:146–150. doi:10.1038/sj.ijo.0800783
22. Mantyselka P, Kautiainen H, Saltevo J, et al. Weight change and lipoprotein particle concentration and particle size: a cohort study with 6.5-year follow-up. Atherosclerosis. 2012;223(1):239–243. doi:10.1016/j.atherosclerosis.2012.05.005
23. Jackson CH. Multi-state models for panel data: the msm package for R. J Stat Softw. 2011;38(8):1–28. doi:10.18637/jss.v038.i08
24. Qi Y, Yu Y, Li K, Chen Z, Liu Y, Zhang H. Prevalence of obesity among primary students between 2009 to 2014 in China: a meta-analysis. Nutr Hosp. 2014;31(1):185–190. doi:10.3305/nh.2015.31.1.7967
25. Shen J, Goyal A, Sperling L. The emerging epidemic of obesity, diabetes, and the metabolic syndrome in china. Cardiol Res Pract. 2011;2012. doi:10.1155/2012/178675.
26. Zhao D, Zheng L, Li Y, Yu K, Zhang X. Area-level socioeconomic disparities impact adult overweight and obesity risks of han ethnicity in China. Am J Human Biol. 2015;27(1):129–132. doi:10.1002/ajhb.22596
27. Chen CM. Guidelines for the Prevention and Control of Overweight and Obesity in Chinese Adults. Beijing: People’s Medical Publishing House; 2006.
28. Yuan YQ, Li F, Meng P, et al. Gender difference on the association between dietary patterns and obesity in Chinese middle-aged and elderly populations. Nutrients. 2016;8(8):448. doi:10.3390/nu8080448
29. Shi Z, Lien N, Nirmal Kumar B, Holmboe-Ottesen G. Perceptions of weight and associated factors of adolescents in Jiangsu Province, China. Public Health Nutr. 2007;10(3):298–305. doi:10.1017/S1368980007352488
30. Wang H, Wang J, Liu MM, et al. Epidemiology of general obesity, abdominal obesity and related risk factors in urban adults from 33 communities of Northeast China: the CHPSNE study. BMC Public Health. 2012;12:967. doi:10.1186/1471-2458-12-967
31. Melinda C, Katarna V, Martin G, et al. Gender-associated differences in the prevalence of central obesity using waist circumference and waist-to-height ratio, and that of general obesity, in Slovak adults. Cent Eur J Public Health. 2018;26(3):228–233. doi:10.21101/cejph.a4719
32. Garawi F, Devries K, Thorogood N, Uauy R. Global differences between women and men in the prevalence of obesity: is there an association with gender inequality? Eur J Clin Nutr. 2014;68(10):1101–1106. doi:10.1038/ejcn.2014.86
33. Du P, Wang HJ, Zhang B, et al. Prevalence of abdominal obesity among Chinese adults in 2011. J Epidemiol. 2017;27(6):282–286. doi:10.1016/j.je.2017.03.001
34. Stachowiak G, Pertynski T, Pertynska-Marczewska M. Metabolic disorders in menopause. Prz Menopauzalny. 2015;14(1):59–64. doi:10.5114/pm.2015.50000
35. Franssen R, Monajemi H, Stroes ES, Kastelein JJ. Obesity and dyslipidemia. Med Clin North Am. 2011;95(5):893–902. doi:10.1016/j.mcna.2011.06.003
36. Yasser N, Kuan-Jung L, Oswald NN, Disline MT, Ming-Chih C. The impact of aerobic exercise and badminton on HDL cholesterol levels in Taiwanese adults. Nutrents. 2020;12(5). doi:10.3390/nu12051204
37. Cheng-Feng J, Hui-Chin C, Disline MT, Pei-Hsin C, WenHsiu L, Jing-Yang H. Duration-response association between exercise and HDL in both male and female Taiwanese adults aged 40 years and above. Oncotarget. 2018;9(2):2120–2127. doi:10.18632/oncotarget.23251
38. Burns RD, Brusseau TA, Hannon JC. Effect of comprehensive school physical activity programming on cardiometabolic health markers in children from low-income schools. J Phys Act Health. 2017;14(9):671–676. doi:10.1123/jpah.2016-0691
39. Knaeps S, Bourgois JG, Charlier R, Mertens E, Lefevre J, Katrien W. Ten-year change in sedentary behaviour, moderateto-vigorous physical activity, cardiorespiratory fitness and cardiometabolic risk: independent associations and mediation analysis. Br J Sports Med. 2018;52:1063–1068. doi:10.1136/bjsports-2016-096083
40. Izabela ZG, Jana P, Dorota G, et al. Does physical activity lower the risk for metabolic syndrome: a longitudinal study of physically active older women. BMC Geriatr. 2021;21:11. doi:10.1186/s12877-020-01952-7
41. Bardagjy AS, Steinberg M. Relationship between HDL functional characteristics and cardiovascular health and potential impact of dietary patterns: a narrative review. Nutrients. 2019;11(6):1231. doi:10.3390/nu11061231
42. Kent L, Grant R, Watts G, Morton D, Rankin P, Ward EJ. HDL subfraction changes with a low-fat, plant-based Complete Health Improvement Program (CHIP). Asia Pac J Clin Nutr. 2018;27(5):1002–1009. doi:10.6133/apjcn.052018.05
 © 2021 The Author(s). This work is published and licensed by Dove Medical Press Limited. The
full terms of this license are available at https://www.dovepress.com/terms
and incorporate the Creative Commons Attribution
- Non Commercial (unported, 3.0) License.
By accessing the work you hereby accept the Terms. Non-commercial uses of the work are permitted
without any further permission from Dove Medical Press Limited, provided the work is properly
attributed. For permission for commercial use of this work, please see paragraphs 4.2 and 5 of our Terms.
© 2021 The Author(s). This work is published and licensed by Dove Medical Press Limited. The
full terms of this license are available at https://www.dovepress.com/terms
and incorporate the Creative Commons Attribution
- Non Commercial (unported, 3.0) License.
By accessing the work you hereby accept the Terms. Non-commercial uses of the work are permitted
without any further permission from Dove Medical Press Limited, provided the work is properly
attributed. For permission for commercial use of this work, please see paragraphs 4.2 and 5 of our Terms.