Back to Journals » Medical Devices: Evidence and Research » Volume 12
Transcutaneous CO2 versus end-tidal CO2 in neonates and infants undergoing surgery: a prospective study
Authors Chandrakantan A, Jasiewicz R, Reinsel RA ![]() , Khmara K, Mintzer J, DeCristofaro JD, Jacob Z, Seidman P
, Khmara K, Mintzer J, DeCristofaro JD, Jacob Z, Seidman P
Received 18 December 2018
Accepted for publication 22 March 2019
Published 6 May 2019 Volume 2019:12 Pages 165—172
DOI https://doi.org/10.2147/MDER.S198707
Checked for plagiarism Yes
Review by Single anonymous peer review
Peer reviewer comments 2
Editor who approved publication: Dr Scott Fraser
Arvind Chandrakantan,1 Ronald Jasiewicz,2 Ruth A Reinsel,3 Kseniya Khmara,2 Jonathan Mintzer,4 Joseph D DeCristofaro,4 Zvi Jacob,2 Peggy Seidman5
1Department of Anesthesiology & Pediatrics, Texas Children’s Hospital, Houston, TX, USA; 2Department of Anesthesiology, Stony Brook University Hospital, Stony Brook, NY, USA; 3Department of Neurology, Stony Brook University Hospital, Stony Brook, NY, USA; 4Department of Neonatology & Pediatrics, Stony Brook University Hospital, Stony Brook, NY, USA; 5Department of Anesthesiology & Pediatrics, UH Rainbow Babies and Children’s Hospital, Cleveland, OH, USA
Aim: End-tidal CO2 (EtCO2) is the standard in operative care along with pulse oximetry for ventilation assessment. It is known to be less accurate in the infant population than in adults. Many neonatal intensive care units (NICU) have converted to utilizing transcutaneous CO2 (tcPCO2) monitoring. This study aimed to compare perioperative EtCO2 to tcPCO2 in the pediatric perioperative population specifically below 10 kg, which encompasses neonates and some infants.
Methods: After IRB approval and parental written informed consent, we enrolled neonates and infants weighing less than 10 kg, who were scheduled for elective surgery with endotracheal tube under general anesthesia. PCO2 was monitored with EtCO2 and with tcPCO2. Venous blood gas (PvCO2) samples were drawn at the end of the anesthetic. We calculated a mean difference of EtCO2 minus PvCO2 (Delta EtCO2), and tcPCO2 minus PvCO2 (Delta tcPCO2) from end-of-case measurements. The mean differences in the NICU and non-NICU patients were compared by t-tests and Bland–Altman analysis.
Results: Median age was 10.9 weeks, and median weight was 4.4 kg. NICU (n=6) and non-NICU (n=14) patients did not differ in PvCO2. Relative to the PvCO2, the Delta EtCO2 was much greater in the NICU compared to the non-NICU patients (−28.1 versus −9.8, t=3.912, 18 df, P=0.001). Delta tcPCO2 was close to zero in both groups. Although both measures obtained simultaneously in the same patients agreed moderately with each other (r =0.444, 18 df, P=0.05), Bland–Altman plots indicated that the mean difference (bias) in EtCO2 measurements differed significantly from zero (P<0.05).
Conclusions: EtCO2 underestimates PvCO2 values in neonates and infants under general anesthesia. TcPCO2 closely approximates venous blood gas values, in both the NICU and non-NICU samples. We, therefore, conclude that tcPCO2 is a more accurate measure of operative PvCO2 in infants, especially in NICU patients.
Keywords: infant, newborn, end-tidal CO2, blood gas monitoring-transcutaneous, intensive care monitoring- neonatal, ASA monitoring standards
Introduction
Transcutaneous CO2 monitoring (tcPCO2) is a well-described non-invasive method to trend ventilation in neonates and is validated as accurate through all age groups. Recent literature has evaluated the relative efficacy of transcutaneous CO2 (tcPCO2) compared to end-tidal CO2 (EtCO2) monitoring as a reflection of arterial CO2 (PaCO2). Publications relating to use in infants and children with respiratory failure,1 congenital heart disease,2 and one lung ventilation3 have demonstrated improved correlation between PaCO2 with tcPCO2 as compared to correlation of PaCO2 with EtCO2; however, controversy exists. Two recent reviews suggest that tcPCO2 should be used as an adjunct to end-tidal CO2.4,5 One study which showed close correlation of EtCO2 with PaCO2 recommends EtCO2 usage for longitudinal monitoring in the neonatal intensive care unit (NICU);6 data from a more heterogeneous intraoperative cohort suggest that tcPCO2 may be more accurate.7 This non-invasive infant study uses PvCO2 as the surrogate for PaCO2.
The standard of care for monitoring respiratory status during anesthesia has been end-tidal CO2 (EtCO2) and pulse oximetry. While this methodology is well established in operative care, EtCO2 is known to be less accurate in the neonatal population. The sampling flow rate on the EtCO2 in relation to the tidal volume and total flow used to ventilate extremely low birth weight infants provides ambiguous data. In addition, EtCO2 is not feasible in high-frequency oscillators or jet ventilators as the volume of each breath is less than dead space. Many neonatal intensive care units and pediatric intensive care units (PICU) utilize tcPCO2 as a primary means of PaCO2 monitoring. Adequate direct comparisons of the two monitors are not available. Based on preliminary data in neonates, our null hypothesis was that there would be no difference between venous CO2 as measured by end-tidal and transcutaneous methods.
Methods
IRB approval and informed consent
This study was approved by the Stony Brook University Committee on Research Involving Human Patients. Parents were approached in person or by telephone by a physician or the study coordinator at least one day in advance of scheduled operative procedures. All study procedures were further explained and written informed consent was obtained on the day of surgery.
Research site
This study was conducted in the main operating room of an academic tertiary care university hospital with a level 3 NICU (Regional Perinatal Center) between April 2015 and October 2016.
Sample size requirements
The estimated sample size is based on a correlational analysis. We assume a relationship of at least moderate magnitude between the two techniques for estimation of pCO2. Estimation of the required sample size is complicated by the range of values seen in our preliminary observations. Pearson correlations between TCO2 and EtCO2 ranged from +0.59 to −0.74. Disregarding the direction of the relationship (direct or inverse), the absolute values of 0.6 to 0.7 suggest a “large” effect size. We can thus estimate sample sizes under the assumption of a large effect size, rho =0.5. For 80% power at alpha level = 0.05 using a 2-tailed analysis, 26 subjects would be required.
Study sample
Infants up to 12 months of age and under 10 kg in weight who required an elective surgery with general anesthesia were eligible for the study. Patients were excluded if they required emergency surgery, if they were receiving anesthesia without an endotracheal tube (ETT) or if the parents were unable to read or understand the consent form in either English or Spanish.
Equipment
End-tidal CO2 (EtCO2) was measured via the sidestream (diverting) sampling device (Medline 3m 0.06 ID) on the anesthesia machine (GE Aisys Datex-Ohmeda). Transcutaneous CO2 (tcPCO2) was measured using the SenTec Digital Monitoring System (SDMS) manufactured by SenTec AG (Therwil, Switzerland;
Procedures
In the OR, the tcPCO2 V-SignTM Sensor 2 with Multi-Site Attachment Ring was applied along with standard ASA monitors which are 3 lead electrocardiogram (EKG), non-invasive blood pressure cuff (NIBP), pulse oximetry, and temperature probe. In most cases, the sensor was placed on the forehead. If that site was not available, it was placed as close to the core of the body as the surgical site and surgical preparation allowed in concordance with manufacturer recommendations. To ensure optimal recording of tcPCO2, every effort was made to follow manufacturer recommendations for sensor placement (see Figure 1).
 | Figure 1 Manufacturer recommendations for sensor placement in infants, numbered in order of preference (1= high, 3= low). Source: SenTec AG, Therwil, Switzerland ( |
After baseline vital signs, the patients were anesthetized using either standard mask induction with sevoflurane and an IV was placed if one was not already in place or the patient was induced with the IV and then ETT placed after IV induction unless the child arrived intubated. Vital signs (cardiac rhythm, heart rate, respiratory rate, blood pressure, pulse oximetry, temperature) were recorded every 5 mins as per standard of care. Operative events were noted on the data sheet including: induction, intubation, neuraxial block, positioning for surgery, incision, closure, and extubation.
TcPCO2 was monitored concurrently with EtCO2, with respiratory mode noted (spontaneous vs controlled). The anesthesiologist delivering anesthesia was blinded to the readings of the tcPCO2 monitor and provided intraoperative care using standard monitors including EtCO2 to guide operative management. A separate data sheet was utilized to document the TCOM readings and note significant events and was blinded to the anesthesiology team caring for the patient.
Blood samples
Prior to extubation, a venous blood sample was obtained or a capillary blood gas was obtained from a heel or thumb stick and analyzed for PvCO2. Blood gas parameters including pH, partial pressure of oxygen (pvO2), bicarbonate concentration (HCO3-), and base excess (BE) were recorded.
Data analysis
For each patient, we calculated a mean difference of Delta EtCO2 (EtCO2 minus PvCO2), and Delta tcPCO2 (tcPCO2 minus PvCO2) from end-of-case measurements, matched as closely as possible to the time of venous blood gas sampling. Independent t-tests were used to compare the mean differences between NICU and non-NICU patients. In view of the small sample size, we repeated these tests with a nonparametric Mann–Whitney U-test, which is not dependent on normally distributed data. Within-patient comparisons between EtCO2 and tcPCO2 measures were made using the Wilcoxon signed ranks test. We considered a P-value of <0.05 as significant. All statistical testing was performed using IBM SPSS v22 (IBM, Armonk, NY). Continuous variables were analyzed using parametric and/or nonparametric testing based on the presence or absence of normal distributions, and were done on an individual variable basis to ensure scientific rigor. All values are in mm Hg unless otherwise indicated.
Agreement between methods of measurement
EtCO2 and TcPCO2 were compared to venous blood gas measure of PCO2 using the Bland–Altman technique.8,9 This well-accepted graphical technique plots the mean of the two measures versus the difference of the two measures with 95% limits of agreement. If the two measures agree perfectly, all differences will be zero. The difference of the two measures is termed “bias”. One can calculate a 95% confidence interval around the mean difference (mean ±1.96*standard error of the mean). Statistical significance was defined a priori based on 95% confidence intervals of mean differences not including a determination of utility (bias of zero) between the two CO2 measurement techniques.
Results
Patient sample
A total of 38 patients were enrolled with parental written informed consent. For six patients no data was obtained due to delay or cancellation of surgery, or lack of availability of study staff at the time of surgery. One patient was excluded from analysis due to a protocol deviation (use of laryngeal mask airway). Two patients came to the OR twice, each time as a separate consent, as allowed by our IRB protocol; but only one surgery was used in this analysis to meet statistical assumptions that the observations are independent. The choice of which patients to include was made based on availability of blood gas data at the end of the case. Insufficient data for venous blood gas analysis was obtained at the end of 5 additional cases, and in 4 patients the venous blood gas was obtained post-extubation, leaving no corresponding value for EtCO2. This left 20 patients (6 NICU, 14 non-NICU) with concurrent end-tidal and transcutaneous CO2 values for analysis. Characteristics of the patient cohort are given in Table 1. Thirteen out of the 20 patients were intubated with cuffed ETT. The leak was between 15 and 25 mm Hg in both groups and no difference in EtCO2 was noted.
 | Table 1 Characteristics of NICU and non-NICU subjects. For continuous variables, values are mean±standard deviation |
The median post-natal age on the day of surgery was 10.9 weeks (range 0.3–47 weeks). The median weight was 4.45 kg (range 1.8–9.8 kg). Abdominal surgeries were the most frequent (n=9), followed by cleft lip/palate (n=3), neurological (n=2), orthopedic (n=2), bronchial (n=1), thoracic (n=1), urological (n=1), and central venous access (n=1). Within the NICU group (n=6), laparotomies were the most common procedure (n=3). As expected, NICU patients were significantly younger in gestational age (t=3.203, 17.3 df, P=0.001) and lower in weight (t=3.978, 18 df, P=0.001) than non-NICU patients (see Table 1). Anesthesia time did not differ between groups (see Table 1).
Two infants arrived from the NICU already intubated and were returned to the NICU in the same condition. Three additional neonates were not extubated after surgery and were returned to the NICU intubated. Vasoactive agents were not utilized for any of the patients.
Sensor placement
For the NICU group, all but one had the V-Sign Sensor 2 placed on the forehead (n=3) or abdomen/chest (n=2). A single baby had the sensor placed on the lower leg, which is a less favorable but accepted position for tcPCO2 measurement. Among the non-NICU patients, 8 had the sensor placed on the forehead, 2 on the abdomen/chest, and 4 on the shoulder/back.
Blood gas analysis
As shown in Table 2, the difference between blood pH and PvO2 was not statistically significant. However, NICU patients had higher levels of bicarbonate (t= −2.813, 18 df, P=0.012) and lower base excess (t= −2.298, 18 df, P=0.034).
 | Table 2 Blood gas analysis (mean±standard deviation) for NICU and non-NICU subjects. Venous blood gas samples were taken at the end of the case |
Measurement of PCO2. tcPCO2 levels were higher than EtCO2 in both populations (see Table 2). EtCO2 values in NICU patients did not differ significantly compared to older infants. The mean difference between EtCO2 and PvCO2 was significantly greater in NICU patients (−28.1±12.3) vs non-NICU patients (9.8±8.3) (t=3.912, 18 df, P=0.001, see Figure 2; P-value confirmed by Mann–Whitney U-test). The mean difference between tcPCO2 and PvCO2 between NICU (−0.7±11.2) and non-NICU patients (3.0±9.8) was not significantly different (t= −0.733, 18 df, P=0.473). However, Wilcoxon signed rank tests for related samples showed that tcPCO2 and EtCO2 were significantly different within both groups (P=0.028 for NICU and P=0.001 for non-NICU patients).
 | Figure 2 ΔEtCO2 and ΔTcPCO2 in NICU and non-NICU patients. Values are normalized to the measured PvCO2 for each patient, indicated by the zero line on the vertical axis. TcPCO2 rather than EtCO2 levels closely approximated PvCO2 in both populations. Dark bars: EtCO2; light bars: tcPCO2. Arrows indicate groups compared for independent-groups t-test. A nonparametric test for paired samples was also performed to compare measures of ΔEtCO2 and ΔTcPCO2 within each patient group. This test showed significant differences (P<0.05) between EtCO2 and tcPCO2 within both NICU and non-NICU patient groups. Abbreviations: PVCO2, venous blood gas; tcPCO2, transcutaneous CO2; EtCO2, end-tidal CO2; NICU, neo-natal intensive care unit; N.S., non significant. |
Blood gas results are shown in Table 2. The nonparametric Mann–Whitney U-Test found that venous blood gas was significantly different between the two groups at both the start (P=0.036) and end (P=0.033) of the surgery. By pairedt-test, these differences were significant only at the start of the case (t=−2.620, 12 df, P=0.022). NICU and non-NICU patients did not differ in venous blood gas PvCO2, tcPCO2 or EtCO2 at the end of the case. Delta EtCO2 was much greater in the NICU babies compared to non-NICU patients (−28.1 versus −9.8, t=3.912, 18 df, P=0.001). Delta tcPCO2 was close to zero in both groups. TcPCO2 did not differ significantly from measured PvCO2 in these two patient groups.
Comparison of methods by Bland–Altman analysis
Figure 3 and Table 3 show tcPCO2 and EtCO2 compared to the venous blood gas measurement (PvCO2) using the Bland–Altman technique. Comparing tcPCO2 to PvCO2 (Figure 3A), these plots show agreement between measures, with a mean difference (bias) of 1.86 (95% CI −2.57 to 6.29), in the full sample of 20 patients. The value is similarly low in NICU (−0.70, 95% CI −9.68 to 8.28) and non-NICU patients (2.96, 95% CI −2.19 to 8.11). Comparing EtCO2 to PvCO2 (Figure 3B), the plots show a much higher bias of −15.29 (95% CI −20.84 to −9.74) for the full sample, with high variability, especially among NICU patients. The mean bias is nearly three times as high among NICU patients (−28.07, 95% CI −37.91 to −18.23) as in the non-NICU group (−9.82, 95% CI −14.15 to −5.49). This variability seems to be most pronounced for the average measure of (EtCO2+PvCO2) below 40 (see Figure 3B). The standard deviations of the bias are similar among the two patient groups on both methods of measurement.
 | Table 3 Results of Bland–Altman analyses individually comparing tcPCO2 and EtCO2 to PvCO2. All measures were taken at the end of the surgery, as close as possible to the time of venous blood sampling. Values shown are bias (mean difference), the standard deviation (SD) of the bias, and 95% limits of agreement (mean±1.96*SD). Also shown is the standard error of the mean (sem), which is the basis for calculation of the confidence interval (CI) for the sampling error of the mean (mean±1.96*sem) |
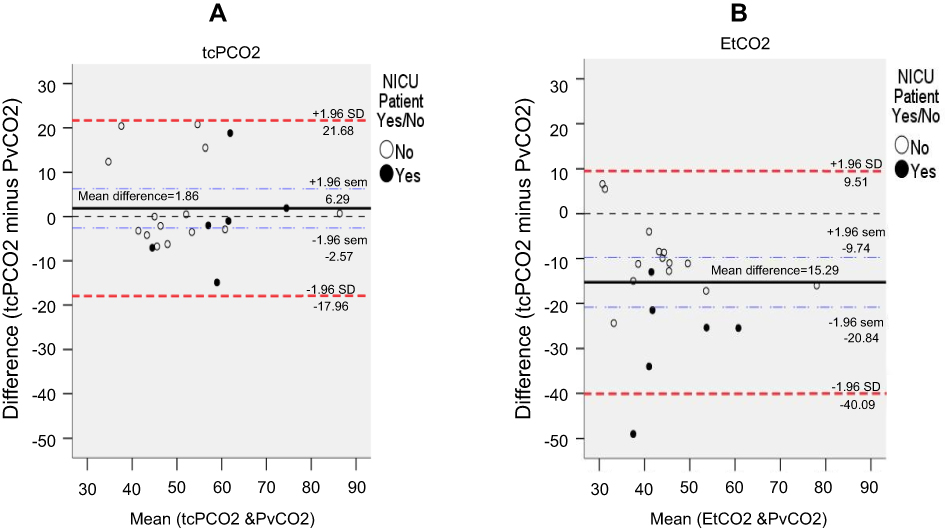 | Figure 3 Bland–Altman plots showing mean difference (bias) for tcPCO2 (A) and EtCO2 (B) with 95% limits of agreement (red dashed lines). Blue dashed lines show the 95% confidence interval for the mean difference (bias). The bias is significant if the confidence interval does not include the line of equality (dashed line at zero). NICU patients, solid circles; non-NICU patients, open circles. Comparing tcPCO2 to PvCO2 (Figure 3A), these plots show good agreement between measures, with a mean difference (bias) of 1.86, in the full sample of 20 patients. The 95% confidence interval for the mean difference (blue dashed lines) includes zero, indicating lack of meaningful difference between tcPCO2 and PvCO2 measurements comparing EtCO2 to PvCO2 (B), the plots show a much higher bias of −15.29 for the full sample, with high variability, especially among NICU patients. Notably, in (B), the 95% confidence limits for the mean difference (blue dashed lines) do not include zero. This indicates that the mean bias in EtCO2 measurements is significantly different from zero (P<0.05) for the sample taken as a whole. Abbreviations: PVCO2, venous blood gas; tcPCO2, transcutaneous CO2; EtCO2, end-tidal CO2; NICU, neo-natal intensive care unit. |
The 95% limits of agreement (red dashed lines) are much wider for EtCO2 measurements, reflecting the higher values of the mean difference between EtCO2 and the venous blood gas. Notably, in Figure 3B, the 95% confidence limits for the sampling error of the mean difference of EtCO2 versus PvCO2 (blue dashed lines) do not include zero. This indicates that the mean bias in EtCO2 measurements is significantly different from zero (P<0.05) for both NICU and non-NICU patients, as well as for the sample taken as a whole (see Table 3). In contrast, all the corresponding confidence intervals for tcPCO2 measurements include zero, indicating lack of difference between tcPCO2 and PvCO2 measurements (see Figure 3A and Table 3).
Discussion
The limits of agreement for both measurements were wide in both age groups. There are many physiological and iatrogenic changes during surgery which can alter CO2, and necessitates accurate CO2 values to assure proper ventilation in the operative care. The inaccuracy of EtCO2 in this population compelled this study of the agreement between the monitors and the PvCO2. Since this study utilized children below 10 kg, which encompasses both neonates and infants, we were able to study the effects of both EtCO2 and TcPCO2 on both populations. Our study found that tcPCO2 correlates better with PvCO2 in younger children, specifically in the neonatal population.
With long-term ventilator management in neonates and infants with respiratory failure, tcPCO2 is a viable alternative to EtCO2 in the NICU.1 A more recent study demonstrated that tcPCO2 was correlated with venous CO2, although the study was limited by small sample size.10 In cases of infants with bronchiolitis, it was found that there was reasonable correlation between tcPCO2 and PvCO2, but the investigators felt the monitor was to be used as an adjunct rather than as a primary monitoring tool.5 Long-term ventilator management in a larger study suggested moderate correlation of tcPCO2 with arterial CO2 levels, although bias was greater when transcutaneous monitoring was employed in HFOV.11 In addition, a recent study demonstrated poor correlation between EtCO2 and PvCO2 in anesthetized neonates for general surgery.12 Similar effects have been noted for PaCO2 as well.13 This is the same effect noted in our study; however, we were able to demonstrate improved agreement between PvCO2 and tcPCO2 during the perioperative period as compared to EtCO2.
Our study was limited to the perioperative period; however, the NICU literature suggests decreasing correlation with PvCO2 with long-term mechanical ventilation.11 This suggests that in the short term, the utility of having a single accepted, correlated monitor for both the OR and the NICU cannot be overstated. Further, larger studies are needed to validate tcPCO2 as a stand-alone monitor, specifically for acute events resulting in large CO2 shifts, such as an accidental or intentional extubation, endobronchial intubation, or mucus plugging, which are seen in the intraoperative period. Answers to these questions require a greater number of neonates across a greater spectrum of surgeries. Specifically, surgeries in which there are greater shifts of CO2 including those with abdominal insufflation (laparoscopy), neurosurgery with CO2 manipulation to influence cerebral blood flow, and lengthy surgeries would benefit from an additional monitor with a stronger agreement with PVCO2. This, in theory, would allow for a non-invasive calculation of MvO2 (mixed venous oxygen saturation) provided that PaO2 is either known or calculated from the SpO2.
One drawback of this study was the inability to obtain PvCO2 at the end of the surgery in all patients. This was due to a combination of difficult intravenous or heel sticks, vasoconstriction, and in some cases inadequate sample which was discovered only after the patient had left the OR.
Conclusions
End-tidal CO2 underestimates venous blood gas CO2 values in NICU and infant patients completing surgery. Transcutaneous CO2 closely agrees with venous blood gas values, in both the NICU and non-NICU sample, but more closely in NICU patients. We conclude that transcutaneous CO2 is a more accurate measure than EtCO2 of venous blood CO2 levels in both NICU patients and infants. We postulate that utilizing tcPCO2 values will improve the ability to effectively guide ventilation in this population during operative care.
Quick look
Current Knowledge: Transcutaneous CO2 has not been compared in the neonatal and infant perioperative population with EtCO2.
What this paper contributes to our knowledge: The study demonstrates that transcutaneous CO2 is better correlated with the venous CO2 than standard EtCO2 in younger and smaller infants, specifically NICU patients.
Ethics
This study was approved by the Stony Brook University Committee on Research Involving Human Subjects (IRB), 5 August 2014, Ref. #2014-2629-R3. This study was performed in accordance with the Declaration of Helsinki.
Acknowledgments
We thank Derek Nelsen MD, Faraz Khan MD, Alexander Praslick MD, and Stephanie Waring BS, Cert.AT., for their assistance in collecting the data. SenTec supplied monitor, disposables and technical support. For all other costs, the study was funded by departmental resources. This research was performed at Stony Brook University Hospital, Stony Brook, NY. This research was previously presented by Dr. Khmara at the Society for Pediatric Anesthesia, 2017, and was the winner of the AAP Award for Best Resident Research Award.
Disclosure
SenTec continues to support Dr Seidman’s research with monitors, disposables and technical support. She is on their clinical advisory board for which she receives no monetary compensation. Dr Peggy Seidman reports non-financial support from SenTec, during the conduct of the study; non-financial support from SenTec outside the submitted work. The authors report no other conflicts of interest in this work.
References
1. Tobias JD, Meyer JD. Noninvasive monitoring of carbon dioxide during respiratory failure in toddlers and infants: end-tidal versus transcutaneous carbon dioxide. AnesthAnalg. 1997;85:55–58.
2. Wilson J, Russo P, Russo J, Tobias JD. Noninvasive monitoring of carbon dioxide in infants and children with congenital heart disease: end-tidal versus transcutaneous techniques. J Int Care Med. 2005;20:291–300. doi:10.1177/0885066605278652
3. Tobias JD. Noninvasive carbon dioxide monitoring during one-lung ventilation: end-tidal versus transcutanous techniques. J Cardiothorac Vasc Anesth. 2003;17:306–308.
4. Tobias J. Transcutaneous carbon dioxide monitoring in infants and children. Ped Anes. 2009;19:434–444. doi:10.1111/j.1460-9592.2009.02930.x
5. Gal S, Riskin A, Chistyakov I, Shifman N, Srugo I, Kugelman A. Transcutaneous PCO2 monitoring in infants hospitalized with viral bronchiolitis. Eur J Ped. 2015;174(3):319–324. doi:10.1007/s00431-014-2407-2
6. Nangia S, Saili A, Dutta AK. End tidal carbon dioxide monitoring – its reliability in neonates. Ind J Ped. 1997;64:389–394. doi:10.1007/BF02845211
7. Nosovitch MA, Johnson JO, Tobias JD. Noninvasive intraoperative monitoring of carbon dioxide in children: endtidal versus transcutaneous techniques. PaediatrAnaesth. 2002;12:48–52.
8. Bland JM, Altman DG. Statistical methods for assessing agreement between two methods of clinical measurement. Int J Nursing Studies. 2010;47:931–936. (Reprinted from The Lancet 1986; 327(8476):307-310.). doi:10.1016/j.ijnurstu.2009.10.001
9. Giavarina D. Understanding Bland Altman analysis. Biochemia Medica. 2015;25(2):141–151. doi:10.11613/BM.2015.015
10. Karlsson V, Sporre B, Ågren J. Transcutaneous P
11. Mukhopadhyay S, Maurer R, Puopolo KM. Neonatal transcutaneous carbon dioxide monitoring—Effect on clinical management and outcomes. Resp Care. 2015; respcare.04212. doi:10.4187/respcare.04212
12. Karlsson V, Sporre B, Hellström-Westas L, Ågren J. Poor performance of main-stream capnography in newborn infants during general anesthesia. Ped Anes. 2017;27:1235–1240. doi:10.1111/pan.13266
13. Trevisanuto D, Giulliotto S, Cavallin F, Doglioni N, Toniazzo S, Zanardo V. End-tidal carbon dioxide monitoring in very low birth weight infants: correlation and agreement with arterial carbon dioxide. Pediatr Pulmonol. 2012;47(4):367–372. doi:10.1002/ppul.21558
 © 2019 The Author(s). This work is published and licensed by Dove Medical Press Limited. The
full terms of this license are available at https://www.dovepress.com/terms
and incorporate the Creative Commons Attribution
- Non Commercial (unported, 3.0) License.
By accessing the work you hereby accept the Terms. Non-commercial uses of the work are permitted
without any further permission from Dove Medical Press Limited, provided the work is properly
attributed. For permission for commercial use of this work, please see paragraphs 4.2 and 5 of our Terms.
© 2019 The Author(s). This work is published and licensed by Dove Medical Press Limited. The
full terms of this license are available at https://www.dovepress.com/terms
and incorporate the Creative Commons Attribution
- Non Commercial (unported, 3.0) License.
By accessing the work you hereby accept the Terms. Non-commercial uses of the work are permitted
without any further permission from Dove Medical Press Limited, provided the work is properly
attributed. For permission for commercial use of this work, please see paragraphs 4.2 and 5 of our Terms.