Back to Journals » International Journal of Nanomedicine » Volume 15
Transcriptomics-Based Characterization of the Toxicity of ZnO Nanoparticles Against Chronic Myeloid Leukemia Cells
Authors Alsagaby SA ![]() , Vijayakumar R, Premanathan M, Mickymaray S
, Vijayakumar R, Premanathan M, Mickymaray S ![]() , Alturaiki W
, Alturaiki W ![]() , Al-Baradie RS
, Al-Baradie RS ![]() , AlGhamdi S
, AlGhamdi S ![]() , Aziz MA
, Aziz MA ![]() , Alhumaydhi FA
, Alhumaydhi FA ![]() , Alzahrani FA
, Alzahrani FA ![]() , Alwashmi AS
, Alwashmi AS ![]() , Al Abdulmonem W
, Al Abdulmonem W ![]() , Alharbi NK
, Alharbi NK ![]() , Pepper C
, Pepper C ![]()
Received 12 May 2020
Accepted for publication 19 August 2020
Published 13 October 2020 Volume 2020:15 Pages 7901—7921
DOI https://doi.org/10.2147/IJN.S261636
Checked for plagiarism Yes
Review by Single anonymous peer review
Peer reviewer comments 2
Editor who approved publication: Prof. Dr. Anderson Oliveira Lobo
Suliman A Alsagaby,1 Rajendran Vijayakumar,2 Mariappan Premanathan,2 Suresh Mickymaray,2 Wael Alturaiki,1 Raid S Al-Baradie,1 Saleh AlGhamdi,3,4 Mohammad A Aziz,4,5 Fahad A Alhumaydhi,6 Faisal A Alzahrani,7 Ameen S Alwashmi,6 Waleed Al Abdulmonem,8 Naif Khalaf Alharbi,4,9 Chris Pepper10
1Department of Medical Laboratory Sciences, College of Applied Medical Sciences, Majmaah University, Majmaah 11932, Saudi Arabia; 2Department of Biology, College of Sciences, Majmaah University, Majmaah 11932, Saudi Arabia; 3Clinical Research Department, Research Center, King Fahad Medical City, Riyadh, Saudi Arabia; 4King Saud Bin Abdulaziz University for Health Sciences, Riyadh 11426, Saudi Arabia; 5Colorectal Cancer Research Program, King Abdullah International Medical Research Center, Riyadh, Saudi Arabia; 6Department of Medical Laboratories, College of Applied Medical Sciences, Qassim University, Buraydah, Kingdom of Saudi Arabia; 7Department of Biochemistry, Faculty of Science, King Abdulaziz University, Jeddah 21589, Saudi Arabia; 8Department of Pathology, College of Medicine, Qassim University, Buraidah, Saudi Arabia; 9Department of Infectious Disease Research, King Abdullah International Medical Research Center, Riyadh, Saudi Arabia; 10Brighton and Sussex Medical School, University of Sussex, Brighton, UK
Correspondence: Suliman A Alsagaby
Department of Medical Laboratory Sciences, College of Applied Medical Sciences, Majmaah University, PO Box 1712, Majmaah 11932, Saudi Arabia
Tel +966 542552749
Email [email protected]
Introduction: Zinc oxide nanoparticles (ZnO NPs) have recently attracted attention as potential anti-cancer agents. To the best of our knowledge, the toxicity of ZnO NPs against human chronic myeloid leukemia cells (K562 cell line) has not been studied using transcriptomics approach.
Objective: The goals of this study were to evaluate the capability of ZnO NPs to induce apoptosis in human chronic myeloid leukemia cells (K562 cells) and to investigate the putative mechanisms of action.
Methods: We used viability assay and flowcytometry coupled with Annexin V-FITC and propidium iodide to investigate the toxicity of ZnO NPs on K562 cells and normal peripheral blood mononuclear cells. Next we utilized a DNA microarray-based transcriptomics approach to characterize the ZnO NPs-induced changes in the transcriptome of K562 cells.
Results: ZnO NPs exerted a selective toxicity (mainly by apoptosis) on the leukemic cells (p≤ 0.005) and altered their transcriptome; 429 differentially expressed genes (DEGs) with fold change (FC)≥ 4 and p≤ 0.008 with corrected p≤ 0.05 were identified in K562 cells post treatment with ZnO NPs. The over-expressed genes were implicated in “response to zinc”, “response to toxic substance” and “negative regulation of growth” (corrected p≤ 0.05). In contrast, the repressed genes positively regulated “cell proliferation”, “cell migration”, “cell adhesion”, “receptor signaling pathway via JAK-STAT” and “phosphatidylinositol 3-kinase signaling” (corrected p≤ 0.05). Lowering the FC to ≥ 1.5 with p≤ 0.05 and corrected p≤ 0.1 showed that ZnO NPs over-expressed the anti-oxidant defense system, drove K562 cells to undergo mitochondrial-dependent apoptosis, and targeted NF-κB pathway.
Conclusion: Taken together, our findings support the earlier studies that reported anti-cancer activity of ZnO NPs and revealed possible molecular mechanisms employed by ZnO NPs to induce apoptosis in K562 cells.
Keywords: transcriptomics, ZnO NPs, CML, apoptosis
Introduction
There has been growing interest in nanoparticles (NPs) as promising therapeutic agents due to their distinctive physiochemical characteristics and surface reactivity.1 We and others have reported selective toxicity of metal NPs, such as gold NPs and sliver NPs, against various types of malignant cells including acute promyelocytic leukemia cells (HL-60),2 cervical carcinoma cells (HeLa),3 hepatocellular carcinoma cells (HepG2),4,5 lung cancer cell (A549),5,6 and breast cancer cells (MDA-MB-231).7 Another interesting class of metal NPs is in the oxide form, such as zinc oxide NPs (ZnO NPs), which have been extensively studied in the context of cancer therapy.8 Numerous reports have shown the potential of ZnO NPs to preferentially target the survival of malignant cells with no or little effect on normal cells. For example, our previous work has reported the induction of programmed cell death in acute promyelocytic leukemia cells (HL60) upon treatment with ZnO NPs, with minimal effects on normal peripheral blood mononuclear cells (PBMCs).9 Similar findings were reported by others in breast cancer cells (MCF7),10 colon cancer cells (Caco-2),11 hepatocellular carcinoma cells (HepG2),12 lung adenocarcinoma (A549),12 ovarian cancer cells (SKOV3)13 and cervical carcinoma cells (HeLa).14 The mechanism through which ZnO NPs kill cancer cells has not been fully characterized, but it appears to be linked to the increased concentration of Zn ions inside treated cells that results in zinc-dependent protein activity disequilibrium.15 As Zn is a co-factor for many human enzymes, alteration of its intracellular concentration affects a variety of biological processes, such as DNA replication, DNA damage repair, apoptosis and oxidative stress.16 Furthermore, ZnO NPs elevate the production of reactive oxygen species (ROS) through the pro-inflammatory response of the treated cells towards the NPs and via their surface reactivity that functions as a redox reaction system.8 Increased ROS production leads to oxidative stress-induced DNA damage, which can drive programmed cell death.17
Unlike the methods of conventional molecular biology that enable the assessment of gene expression at a small scale (for a single or few genes), DNA-microarray-based transcriptomics is a well-established approach that allows global gene expression profiling of all human coding-genes in a single assay.18 Therefore, transcriptomics is an attractive tool to better understand the underlying mechanisms of cytotoxicity of NPs against cancer cells. Following the same concept, different researchers utilized transcriptomic approach to identify ZnO NPs-induced transcriptomics alterations in malignant cells, such as lung cancer cells (A549),19 colon carcinoma cells (RKO),20 colorectal adenocarcinoma cells (Caco-2),20 melanoma cells (SK Mel-28),20 acute monocytic leukemia cells (THP-1)21 and acute T-cell leukemia cells (Jurkat A3).22 Based on “PubMed” search using the key words “ZnO nanoparticles gene expression” or “ZnO nanoparticles transcriptomics”, and to the best of our knowledge, the toxicity of ZnO NPs on human chronic myeloid leukemia (CML) cells (K562) has not been studied using transcriptomic technologies. K562 is a hematopoietic multipotential malignant blast that spontaneously differentiates into myeloid progenitors.23
CML is a hematological neoplasm that affects the myeloid linage and represents 15% of all adult leukemias.24 According to the Surveillance, Epidemiology, and End Result program (SEER), it is estimated that nearly 9000 patients will be diagnosed with CML in the United Stated in 2019, and 1140 patients will die of the neoplasm in the same year. A key factor of the tumorigenesis of CML is fusion of ABL on chromosome 9 with BCR on chromosome 22 as a result of the chromosomal translocation t(9;22).25 The BCR-ABL fused gene has a persistent tyrosine kinase activity that supports the survival and growth of the tumor.25 Despite the improvements in the clinical outcomes following the introduction of tyrosine kinase inhibitors (TKIs), such as imatinib and dasatinib, in the therapy of CML, the disease remains fatal for at least 20% of patients.26,27 Therefore, there is still need for alternative treatment, especially for those who show poor response to TKIs.
Given the promise of ZnO NPs as potential cancer therapy, we investigated the cytotoxicity and the transcriptomic-related mechanisms of action of ZnO NPs on human CML cell line (K562).
Materials and Methods
Cell Culture
Human K562 cells (cell line of chronic myeloid leukemia) were obtained from the American Type Culture Collection (ATCC). The leukemic cells were grown in RPMI 1640 medium supplemented with 10% fetal calf serum (FCS), 100 U/mL penicillin, 40 μg/mL gentamycin, 100 μg/mL streptomycin sulphate, 4.5 mg/mL glucose and 2 mg/mL sodium bicarbonate under an atmosphere of humidified air containing 5% CO2 at 37 °C. Peripheral blood mononuclear cells were isolated by density-gradient centrifugation using Lymphoprep from blood of healthy donors. PBMCs were stimulated in RPMI 1640 medium supplemented with 10% FCS, 5 μg/mL phytohemagglutinin, 100 U/mL penicillin, 40 μg/mL gentamycin, 100 μg/mL streptomycin sulphate, 4.5 mg/mL glucose and 2 mg/mL sodium bicarbonate for 3 days at 37 °C under an atmosphere of humidified air containing 5% CO2. Next the PBMCs were transferred to a medium as the above but which lacked phytohemagglutinin and contained 5 ng/mL of interleukin 2 and were incubated at 37 °C in a CO2 incubator for subsequent analysis.
Cell Viability
To determine the toxicity of the ZnO NPs (Sigma-Aldrich #721077) against K562 cells, suspensions of K562 cells (3×10⁵ cells/mL) in RPMI 1640 medium supplemented with 10% FCS were seeded into a 96-well culture plate (200 μL/well) in the presence of increasing concentrations of ZnO NPs (0 μg/mL, 10 μg/mL, 20 μg/mL, 30 μg/mL, 40 μg/mL, 50 μg/mL, 60 μg/mL, 70 μg/mL and 80 μg/mL). The K562 cells were then incubated for 5 days at 37 °C with the presence of CO2. The incubation of the cells was continued with no change of the culture medium.
To assess the toxicity of the ZnO NPs on normal PBMCs compared with K562 cells, four concentrations of the NPs (0 μg/mL, 20 μg/mL, 40 μg/mL, and 80 μg/mL) were selected. Suspensions of PBMCs (3×10⁵ cells/mL) in culture medium (RPMI 1640 with 10% FCS and 5 ng/mL interleukin 2) and suspensions of K562 cells (3×10⁵ cells/mL) in culture medium (RPMI 1640 supplemented with 10% FCS) were independently seeded into a 96-well culture plate (200 μL/well) containing different concentrations of the NPs (0 μg/mL, 20 μg/mL, 40 μg/mL, and 80 μg/mL). Next, the cells were continuously incubated for 5 days at 37 °C with the presence of CO2 with no change of the culture medium.
To investigate whether ZnO NPs induce time-dependent toxicity against K562 cells, suspensions of K562 cells (3×10⁵ cells/mL) in RPMI 1640 medium with 10% FCS were seeded in a 96-well plate containing 10 μg/mL ZnO NPs. The cells were incubated for 5 different periods of time (24 hours, 48 hours, 72 hours, 96 hours and 120 hours) at 37 °C with the presence of CO2 with no change of the culture medium.
At the end of each period of incubation time mentioned above, MTT [3-(4,5-dimethylthiazol-2-yl)-2,5-diphenyltetrazolium bromide] assay was employed to determine the viability K562 cells and PBMCs. The culture medium was replaced carefully with fresh RPMI 1640 supplemented with 10% FCS with diluted MTT dye (final concentration 0.5 mg/mL) and then incubated at 37 °C for 3 hours. After removing the previous incubated medium, the formazan crystals were dissolved in DMSO (200 μL). The reduced levels of MTT were quantified using the absorbance microplate reader, which measured the light absorbance, using a wavelength of 570 nm.28 All experiments were performed in triplicate.
Dissolution Analysis
To determine the concentration of zinc ions released from ZnO NPs to liquid medium, suspensions of ZnO NPs (0 μg/mL, 10 μg/mL, 20 μg/mL, 40 μg/mL and 80 μg/mL) in complete culture medium (RPMI 1640) were incubated at 37 °C for two periods of time (15 hours and 24 hours). Next, centrifugation at 20,000 rpm for 30 minutes was employed to sediment the non-dissolved ZnO NPs. The supernatant was transferred to new tubes, and the centrifugation step was repeated. Next, the supernatant was transferred to new tubes, and zinc concentration was measured using an inductive coupled plasma mass spectrometry (Thermo Fisher Scientific).
Identification of the Type of Cell Death
To identify the kind of cell death induced by ZnO NPs in K562 cells, suspensions of the leukemic cells (3×10⁵ cells/mL) in RPMI 1640 supplemented with 10% FCS were seeded into a 6-well plate in the absence of ZnO NPs (control cells) and in the presence of 40 μg/mL of ZnO NPs. The plate was then incubated for 3 days at 37 °C with the presence of CO2. The incubation of the cells was contiguous with no change of the culture medium. FACS analysis of cellular death was carried out using an Annexin V-FITC Kit (Trevigen, Inc.) at two time points of the incubation time (15 hours and 72 hours). In brief, cells (3×10⁵ cells/mL) were washed with cold 1X phosphate buffered saline (1X PBS) and centrifuged for 5 minutes at 300×g. Next, washed cells were resuspended in a staining solution containing fluorescein-labeled Annexin V, propidium iodide and 1X binding buffer. The cells in the staining solution were incubated for 15 minutes in the dark at room temperature. Next, 1X binding buffer was added to the stained cells that were transferred into a FACS tube for subsequent analyses. The stained cells were then analyzed using FACS CantoII flow cytometer coupled with FACSdiva software (Becton Dickinson). The experiments were performed in triplicate.
RNA Extraction and Quality Control
Total RNA was isolated from K562 cells using the materials and the instructions provided in RNeasy Mini Kits (QIAGEN). The purity and quantity of the extracted RNA was quantified using NanoDrop ND-1000 spectrophotometer (Thermo Fisher Scientific, Inc.). Only RNA samples with high purity (260 nm/280 nm ≥2) were used. The integrity of the isolated RNA was determined using the RNA Nano 6000 chips and the Agilent 2100 Bioanalyzer according the manufacturer’s instructions (Agilent Technologies, Inc.). Only RNA samples with good integrity (RNA Integrity Number (RIN) ≥8) were used.
Microarray-Based Transcriptomics Profiling
The transcriptome of K562 cells was studied by following the instructions in the Agilent protocol of “one-color microarray-based gene expression analysis”. Briefly, 100 ng of the extracted RNA from K562 cells and the RNA spikes from RNA Spike-In Kit, One-Color (Agilent) were converted to cDNA that was transcribed and amplified to fluorescent-labeled cRNA using the low input quick amp labeling (one-color) kit (Agilent). Next the labeled cRNA was purified using the materials and protocol of RNeasy Mini Kits (QIAGEN). Then, NanoDrop ND-1000 spectrophotometer (Thermo Fisher Scientific, Inc.) was used to determine the quality and quantity of the labeled cRNA; only samples with 260 nm/280 nm ≥2, cRNA yield ≥825 ng and specific activity (pmol Cy3/μg cRNA) ≥6 were moved on to the next steps. Hybridization samples were prepared by mixing 600 ng of the labeled cRNA with 5 μL of 10× Gene Expression Blocking Agent (Agilent) and 1 μL of 25× Fragmentation Buffer (Agilent); sample total volume was 25 μL. Next the hybridization samples were incubated for 30 min at 60°C to fragment the labeled cRNA. Hybridization samples were then cooled, and 25 μL of 2× Hi-RPM hybridization Buffer (Agilent) was added in order to stop the cRNA fragmentation (sample total volume = 50 μL). From each hybridization sample 40 μL was dispensed onto a gasket that was assembled to SurePrint G3 Human Gene Expression 8×60K Microarray slide (Agilent) and incubated at 65°C for 17 hours. Next, the microarray slides were washed with the Gene Expression Washing Buffer 1 and 2 to which 0.005% Triton X-102 was added (Agilent) and scanned using Agilent SureScan Microarray Scanner with the AgilentG3_GX_1color protocol. Next, quantitative data of probe features from the scanned microarray slide were extracted using Agilent Feature Extraction Software (version 11.0.1.1; Agilent Technologies, Inc.) and saved for subsequent data analyses.
Data Analysis and Filter Criteria
The data that were extracted using Agilent Feature Extraction Software (version 11.0.1.1; Agilent Technologies, Inc.) were loaded into the GeneSpring GX version 12.1 software package (Agilent Technologies, Inc.). To obtain the normalized signal value of the probes, the extracted data were log2 transformed and normalized on the basis of percentile shift algorithm with percentile target equal to 75. Only measurements from probes with either flag of “detected” or “not detected” were used in the present study. Two conditions were created; treated condition that included the ZnO NPs-treated samples (n= 3), and untreated condition that accommodated the untreated samples (control samples; n= 3). Probes were filtered on the basis of flag calls, where in our analyses only probes with flag “detected” in all samples in one of the two conditions were considered for further analyses. Differentially expressed genes (DEGs) in the treated samples versus the untreated samples were identified according to the fold change (FC). To focus on the most apparent DEGs in the two groups of samples, we set the FC to 4-fold or above with p≤0.008 and corrected p≤0.05. Next, we decreased the FC cut-off to ≥1.5-fold with p≤0.05 and corrected p≤0.1 in order to widen the search for DEGs that may have roles in the mode of action of ZnO NPs. Cluster analyses and heatmap presentations of DEGs were conducted using hierarchical algorithm and were based on probes (normalized signal value of probes) and conditions with Euclidean method for similarity measure and Wards for linkage rule. Gene ontology (GO) enrichment analyses were conducted using the GeneSpring GX version 12.1 software package (Agilent Technologies, Inc.) and only over-represented GO terms with corrected p≤0.05 were reported. GO enrichment analyses of the DEGs were also performed using the gProfiler (https://biit.cs.ut.ee/gprofiler/gost);29 the option “only annotated genes” was selected for statistical domain scope and corrected p-value cut-off was set at ≤0.05. We used the Ingenuity Pathway Analysis (IPA) Core analysis suite (Qiagen Biosciences) for understanding the functional significance and relevance of DEGs. For selecting the most significant canonical pathways, we utilized a cut-off -log(p-value)>3. Top upstream regulators and network were also derived from IPA analysis.
Statistical Analysis
Paired Student’s t-test was used to calculate the p values; and Benjamini–Hochberg false discovery rate (FDR) was employed to determine the corrected p values. The p values and corrected p values of DEGs were calculated using the GeneSpring GX version 12.1 software package (Agilent Technologies, Inc.). Excel software was used to calculate the p values of the viability assay and the analyses titled identification of the type of cell death. Excel software was also utilized to calculate the means and standard deviations; and to construct the column graphs.
Results
Cellular Viability and Identification of the Type of Cell Death
The preparation and characterization of the ZnO NPs used in the present study were previously reported by Triboulet et al.30 To assess the impact of ZnO NPs on the viability of K562 cells, we conducted MTT assay on K562 cells that were treated with increasing concentrations of ZnO NPs (from 0 μg/mL to 80 μg/mL) for five days (120 hours). The MTT assay showed cytotoxicity of ZnO NPs on the leukemic cells with the mean CC50 being 20 μg/mL (Figure 1A).
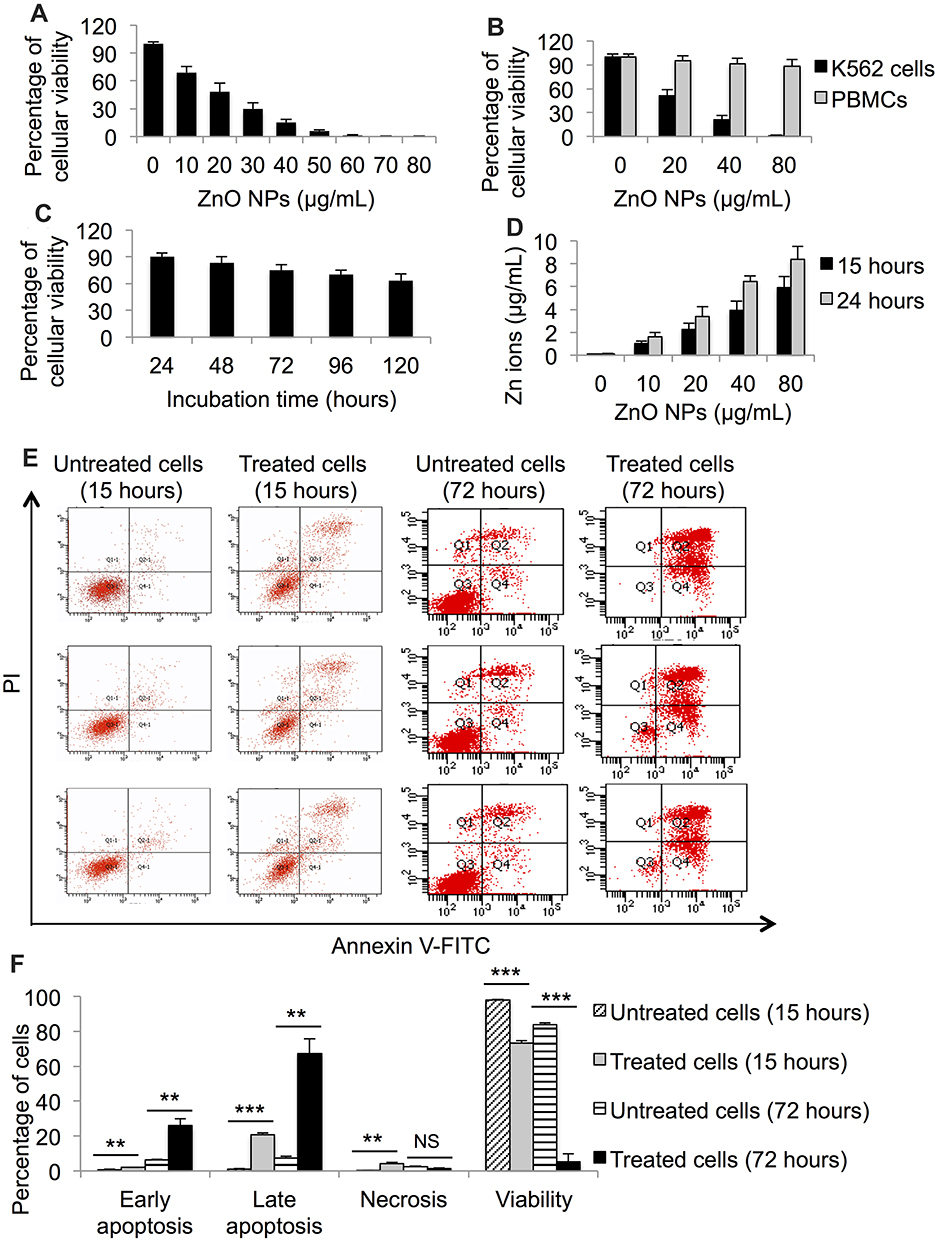 |
Figure 1 Cytotoxicity assessment of ZnO NPs on leukemic and normal cells; and dissolution analysis of the NPs in culture medium. MTT assay was used to measure the viability of K562 cells (A) and PBMCs (B) post treatment with different concentrations of ZnO NPs for 120 hours. MTT assay was also used to determine the viability of K562 cells post incubation with 10 μg/mL for five different periods of time (C). Dissolution analysis was conducted to determine the concentration of released Zn ions from ZnO NPs to the culture medium RPMI 1640 (D). Annexin V-FITC and propidium iodide (PI) with flow cytometer were used to identify the kind of death caused by ZnO NPs (40 μg/mL) in K562 cells (E). The data of flow cytometer were presented using column graph (F). All experiments were conducted in triplicate. PBMCs: peripheral blood mononuclear cells. Asterisk symbol was used to define p values; p ≤ 0.01 is ** and p ≤ 0.001 is ***. |
Next, the impact of the ZnO NPs on the viability of normal PBMCs as opposed to K562 cells was investigated. The cells were incubated with four concentrations of the ZnO NPs (0 μg/mL, 20 μg/mL, 40 μg/mL, and 80 μg/mL) for five days (120 hours). Figure 1B shows that the ZnO NPs had little effect on the survival of the PBMCs; ZnO NPs at concentration of 40 μg/mL reduced the viability of the PBMCs to 91.3% compared with 21% in the K562 cells. Even at high concentration of ZnO NPs (80 μg/mL) the viability of the PBMCs dropped only to 88.4% compared with 1% for the K562 cells. These findings indicated a selective toxicity of the ZnO NPs towards leukemic cells.
We also conducted an experiment to determine whether the ZnO NPs induce time-dependent toxicity on K562 cells. K562 cells were incubated with 10 μg/mL of ZnO NPs for five periods of time (24 hours, 48 hours, 72 hours, 96 hours and 120 hours). MTT assay showed that there was greater loss of the cell viability as the incubation time increased (Figure 1C).
Next, we conducted dissolution analysis of the ZnO NPs. The analysis was performed on suspensions of ZnO NPs in culture medium RPMI 1640 (0 μg/mL, 10 μg/mL, 20 μg/mL, 40 μg/mL and 80 μg/mL) that were incubated for 15 hours or 24 hours at 37 °C. Figure 1D shows that the release of zinc ions from the ZnO NPs to the culture medium appeared to be dose-dependent and time-dependent. For example, the concentration of zinc ions found in the supernatant of the culture medium was 1.04 μg/mL (incubation time = 15 hours) and 1.6 μg/mL (incubation time = 24 hours) for the ZnO NPs at 10 μg/mL. For the ZnO NPs at 80 μg/mL the released zinc ions were found to be 5.9 μg/mL (incubation time = 15 hours) and 8.4 μg/mL (incubation time = 24 hours).
We employed Annexin V-FITC and PI to identify the type of cellular death induced by ZnO NPs on K562 cells. The investigation was performed using flowcytometry on K562 cells that were treated with 40 μg/mL of ZnO NPs for 15 hours or 72 hours and on untreated K562 cells (with the same incubation time). Our findings indicated that ZnO NPs induced apoptosis in K562 cells at the two periods of incubation time (15 hours and 72 hours). In comparison with the untreated cells (control samples), the treated cells (15 hours) showed an increase in apoptotic population (doubly positive cells for annexin V-FITC and PI; p=0.0006; n=3 versus 3; Figure 1E and F); and the viability of the treated cells dropped to 73% compared with 98% for the control cells (p=0.0005; n=3 versus 3). For the longer exposure of the cells (72 hours) to ZnO NPs, the treated cells showed an increase in the early and late apoptotic populations (p≤0.005; n=3 versus 3; Figure 1E and F). Interestingly, the viability loss of the K562 cells caused by ZnO NPs was mainly driven by apoptosis rather than necrosis even with the long exposure (72 hours) to the NPs, in which the viability of the treated cells drastically decreased to 5.2% as opposed to 84% of the control cells (p≤0.0008; n=3 versus 3). The treated K562 cells with 40 μg/mL of ZnO NPs for 15 hours (n = 3) and the untreated K562 cells (n = 3) were stored for subsequent analyses.
Altered Transcriptomics Signature Was Associated with ZnO NPs-Treated K562 Cells
In an attempt to characterize the ZnO NPs-induced transcriptomics changes that drive K562 cells to undergo apoptosis, we compared the transcriptome of the two groups of K562 cells; the group that was treated with 40 μg/mL of ZnO NPs for 15 hours (where the cellular viability decreased to 73% mainly by apoptosis) and the untreated group that had cellular viability of 98% (n=3 versus 3; Figure 1E and F). The comparison was restricted to probes that were detected in all samples in one of the two groups (number of IDs=30,902). Initially, we set the following criteria: FC≥4 with p≤0.008 and corrected p≤0.05, to define genes with differential expression in the treated samples versus untreated samples. By applying these criteria to our transcriptomics data sets, we found 508 probes (429 genes) with altered expression in K562 cells as a result of treatment with ZnO NPs (Supplementary Table 1). Of these genes, 159 were over-expressed and 270 were down-expressed in the treated cells. Figure 2 shows a volcano plot of the gene expression profiling of the 30,902 probes and a hierarchical cluster analysis with heatmap of the DEGs (FC≥4; p≤0.008; corrected p≤0.05).
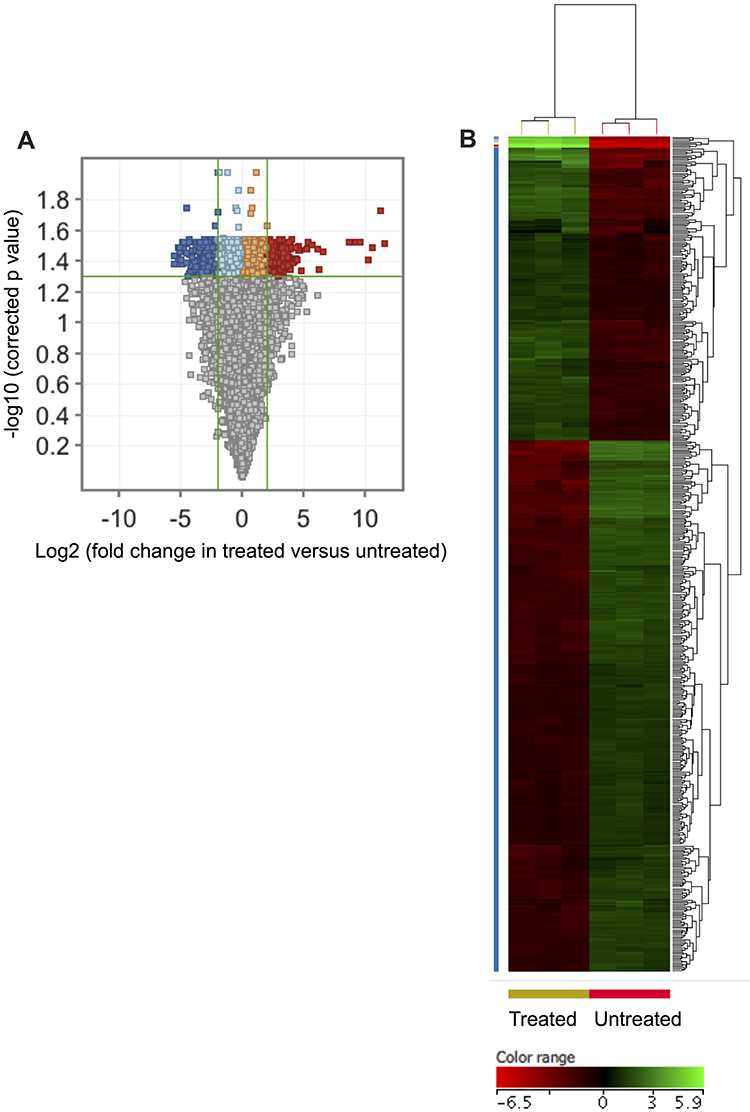 |
Figure 2 A transcriptomic signature was associated with ZnO NPs-treated K562 cells. Volcano plot shows differentially expressed genes (DEGs: FC≥4; p≤0.008; corrected p≤0.05) in the ZnO NPs-treated K562 cells versus untreated K562 cells (A). Hierarchical cluster analysis with heatmap presentation was performed on the DEGs (B). The color range represents the normalized signal value of probes (log2 transformation and 75 percentile shift normalization). |
To gain insights into the biological roles of these DEGs we conducted gene ontology (GO) enrichment analyses as described in the methods. Table 1 shows the significantly over-represented biological processes by the DEGs (corrected p≤0.05). The over-expressed genes showed significant enrichments of similar pathways that are related to the cellular response to toxic chemical. For example, eight different types of metallothionein-1 (MT1) over-represented the biological process “cellular response to zinc ions” (corrected p=1.06×10⁻¹¹; Figure 3A). Furthermore, the same eight genes enriched the term “negative regulation of growth” (corrected p=0.007). Another group of genes (n= 41), including metallothioneins (MT1), hemoglobin subunits (HBB, HBA2 and HBZ), lipid metabolism genes (ACSL6 and ACSS1), zinc exporter (SLC30A1), oxidative responsive genes (SOD3 and DUSP1), heat shock genes (HSPA1A and HSPH1) and myeloid cytoskeleton gene (SPTB), over-represented the biological process “response to chemicals” (corrected p=0.01; Figure 3B). Of note, in addition to the SLC30A1 and SLC7A8 that with other genes enriched the term “response to chemicals”, another four solute carriers (SLC17A4, SLC22A4, SLC39A8 and SLCO4A1; Supplementary Table 1) were also over-expressed in the treated cells. Similarly, the increased expression of myeloid cytoskeleton SPTB in the treated cells was combined with an over-expression of two other myeloid cytoskeleton genes (EPB41L4A and EPB42; Supplementary Table 1). Furthermore, the over-expression of the eight genes that were negative regulators of growth (metallothioneins) in the treated cells was associated with over-expression of three genes that antagonize cellular survival (GADD45B, EGR1 and HIP1R; Supplementary Table 1).
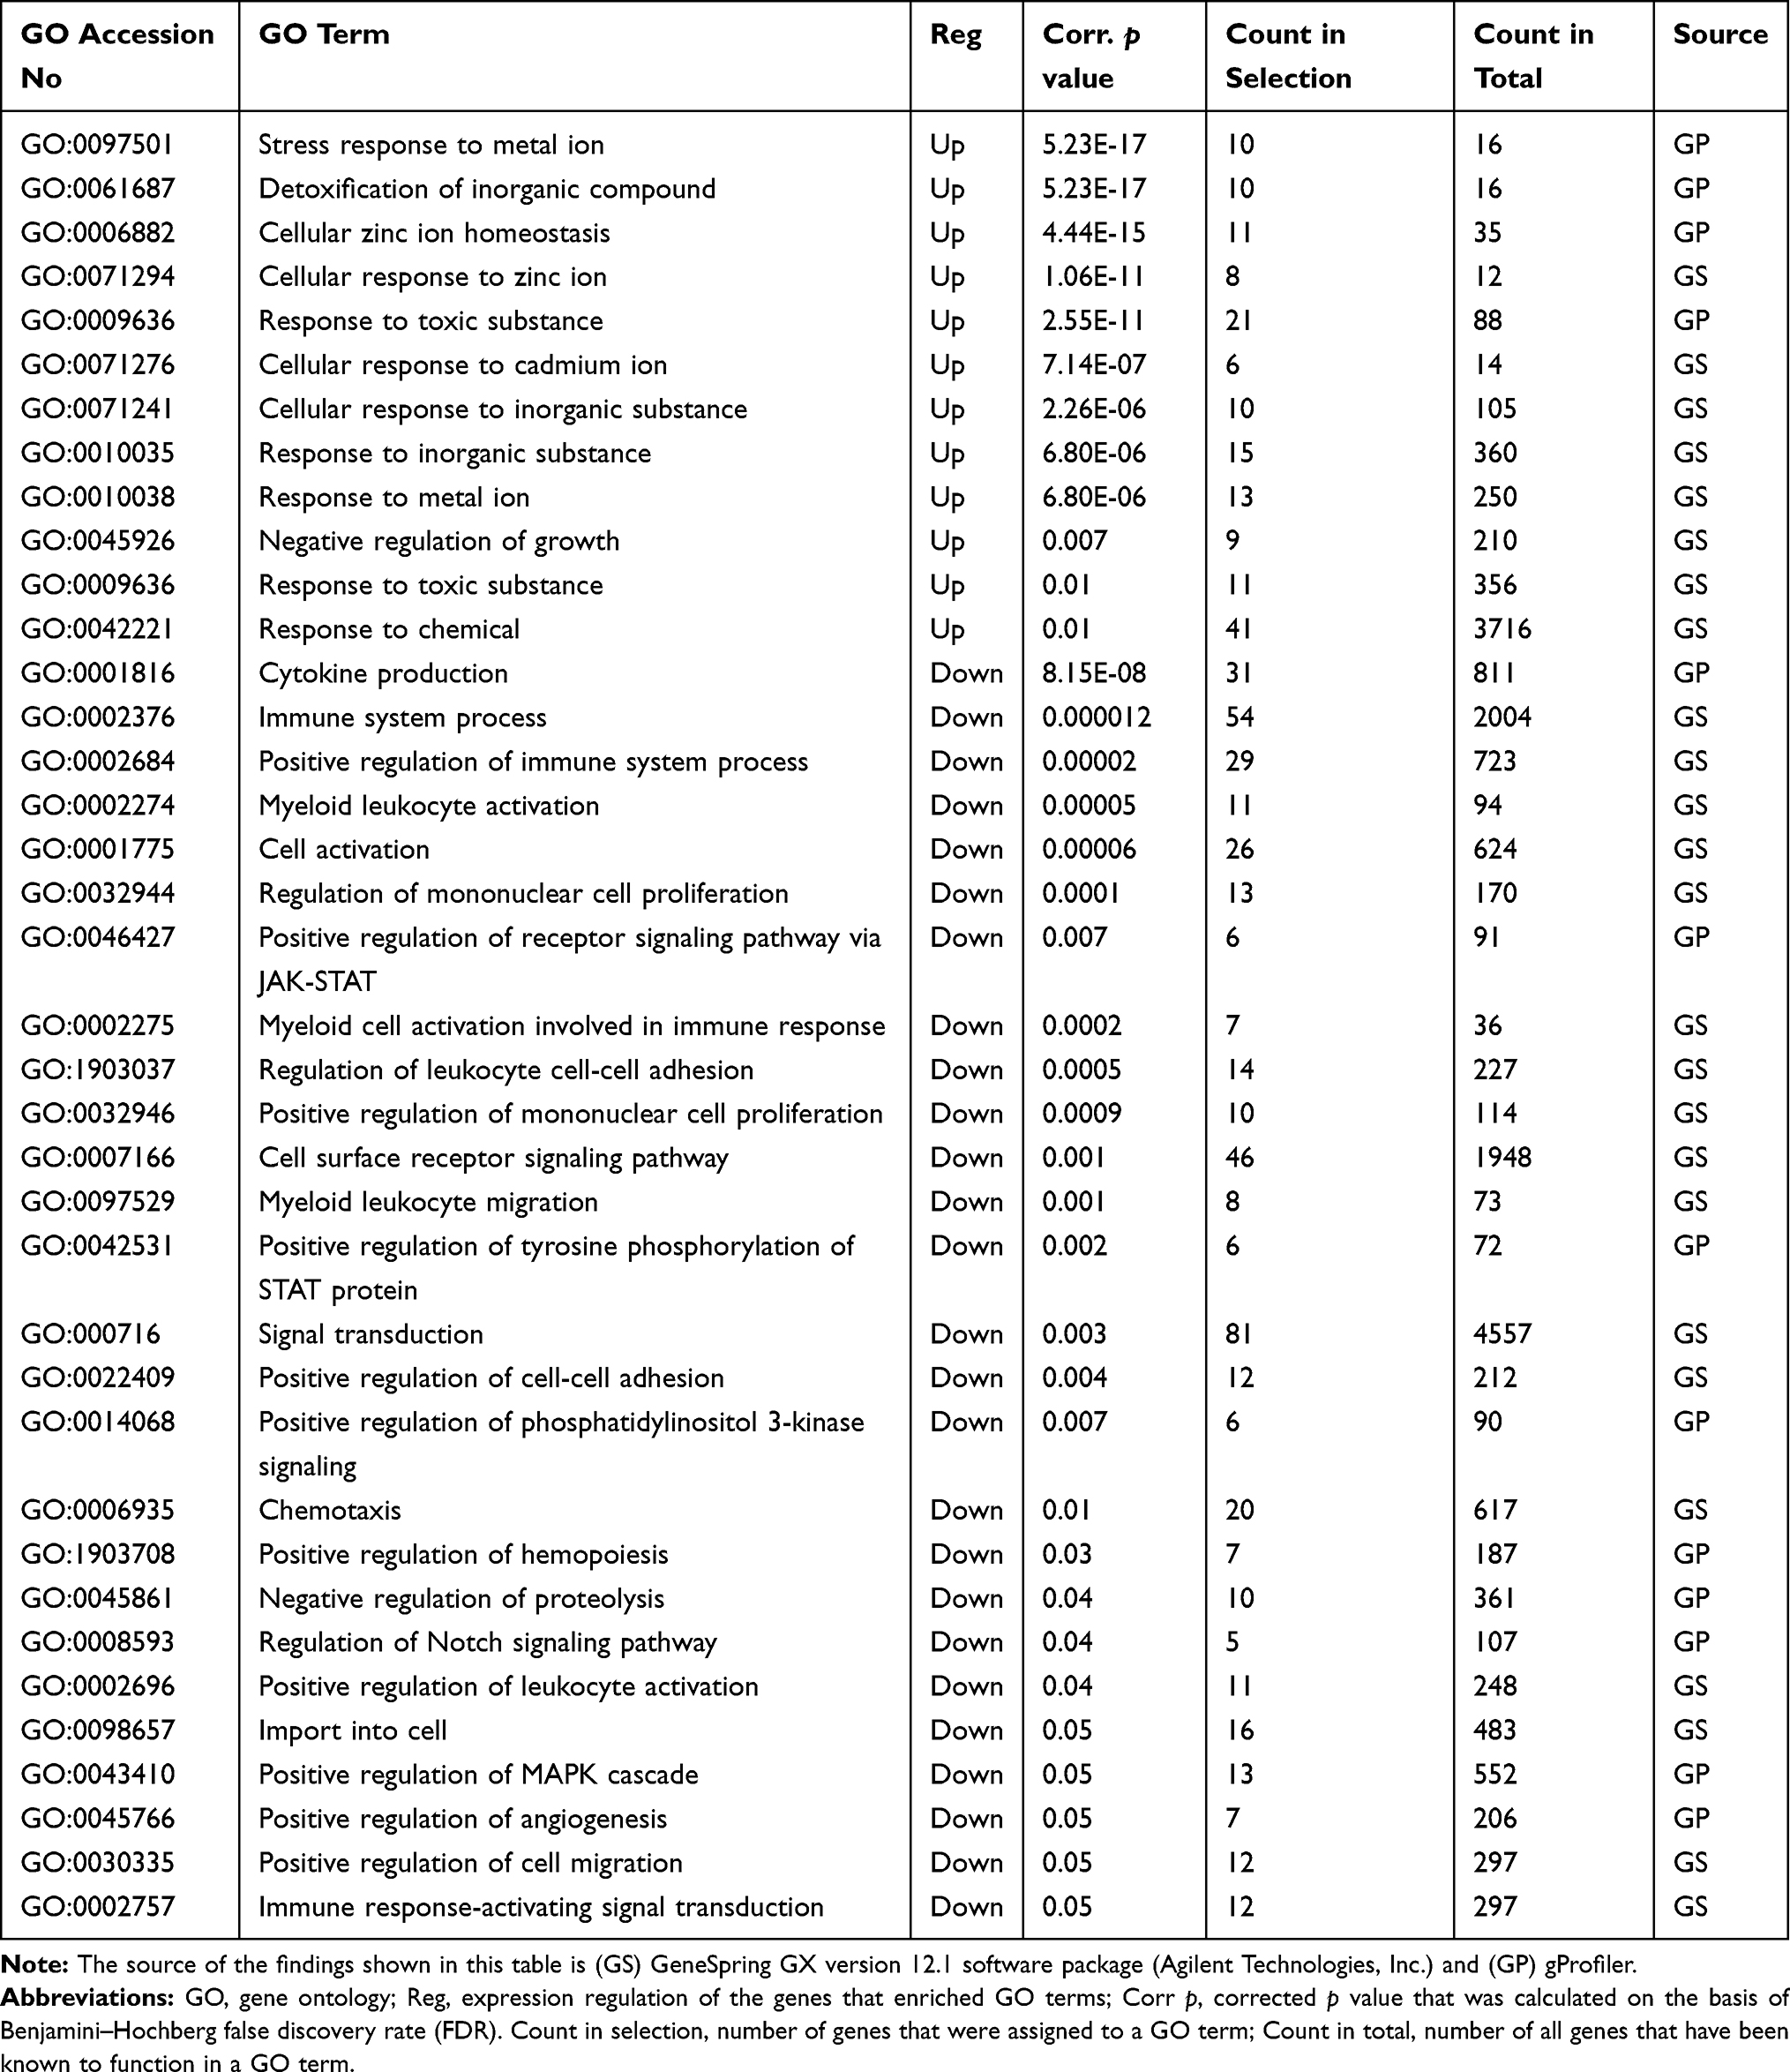 |
Table 1 Pathway Enrichment Analysis of the Differentially Expressed Genes (DEGs: FC≥4; p≤0.008; Corrected p≤0.05) in the ZnO NPs-Treated K562 Compared with the Untreated K562 Cells |
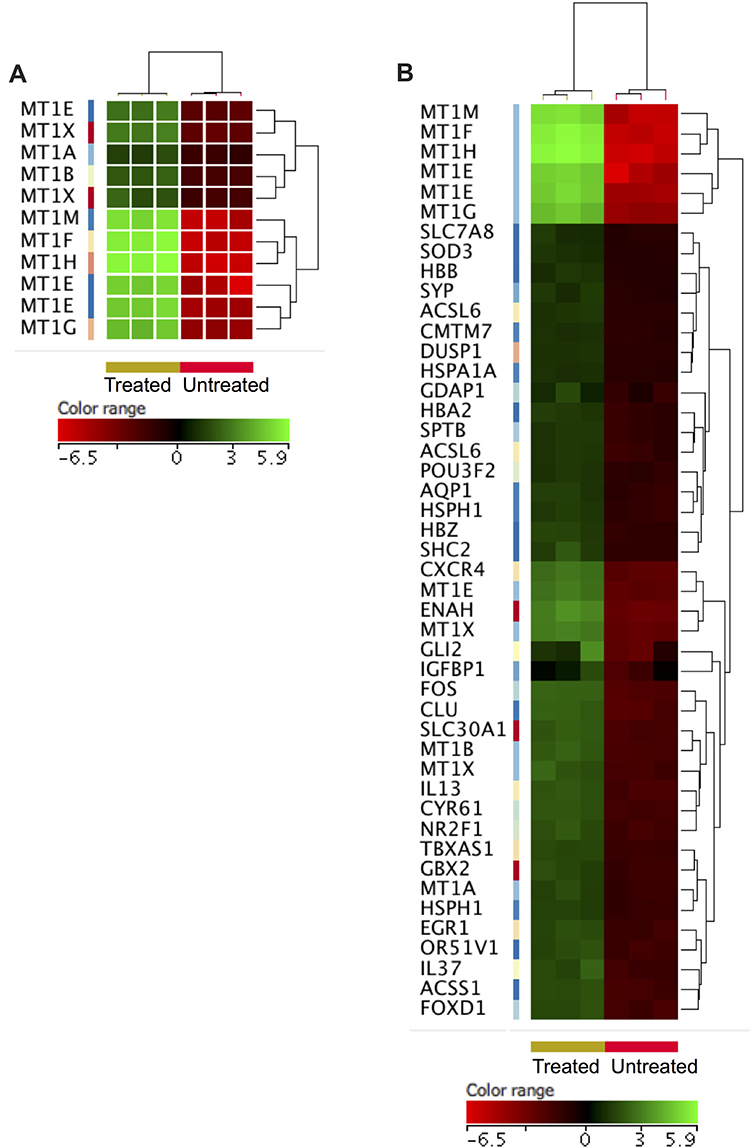 |
Figure 3 Over-expressed genes in the ZnO NPs-treated K562 cells compared with the untreated K562 cells. Hierarchical cluster analysis with heatmap presentation was conducted on the over-expressed genes (FC≥4; p≤0.008; corrected p≤0.05) that significantly over-represented the biological processes “cellular response to zinc ions and negative regulation of growth” (A) and “response to chemicals” (B). The color range represents the normalized signal value of probes (log2 transformation and 75 percentile shift normalization). |
The GO analyses of the down-expressed genes (FC≥4; p≤0.008; corrected p≤0.05) in the treated cells demonstrated a positive regulation of these genes on immune response, cell activation, cell proliferation, cell migration, cell adhesion and signal transduction (Table 1). For instance, 26 genes, such as stem cell growth factor receptor (KIT), signal transducer (CD24), AP-1 family transcription factor (BATF), protein tyrosine-protein phosphatase (PTPRC) and phosphoinositide-3-kinase (PIK3CG) over-represented the term “cell activation” (corrected p=6.01×10⁻⁵; Figure 4A). In addition, 10 genes including insulin like growth factor 1 (IGF1) and hematopoietic protein 1 (NCKAP1L, also known as HEM1) enriched the biological process “positive regulation of mononuclear cell proliferation” (corrected p=0.0009; Figure 4B). The term “positive regulation of cell adhesion” was over-represented by 12 genes (corrected p=0.004; Figure 4C) that were among the genes that enriched both “cell activation” and “positive regulation of mononuclear cell proliferation”. The chemokines (CCL5, CXCL1 and CXCL3) with the vascular endothelial growth factor A (VEGFA) and other eight genes over-represented the term “positive regulation of cell migration” (corrected p = 0.05; Figure 4D). Eight genes including IGF1, KIT, IL18, PIK3CG enriched three pathways termed “positive regulation of tyrosine phosphorylation of STAT protein“ (corrected p=0.002), “positive regulation of receptor signaling pathway via JAK-STAT” (corrected p=0.007), “positive regulation of phosphatidylinositol 3-kinase signaling” (corrected p=0.007) as shown in Figure 5. Our findings also indicated a decreased production of cytokines in the treated cells as evidenced by the over-represented term “cytokine production” by 41 genes with down-expression in the treated cells (corrected p=8.15×10⁻⁸); and by the reduced expression of 17 genes that encode for cytokines or cytokine receptors (p≤0.007 and corrected p≤0.05; Figure 6). The genes LGALS3, IGFL2, NLRP7, NUPR1, NCKAP1L and S1PR3 that are known to support cellular survival were found to be down-expressed in the treated cells (Supplementary table 1).
 |
Figure 4 Down-expressed genes in the ZnO NPs-treated K562 cells compared with the untreated K562 cells. Hierarchical cluster analysis with heatmap presentation was applied on the down-expressed genes (FC≥4; p≤0.008; corrected p≤0.05) that significantly enriched the biological processes “cell activation” (A), “positive regulation of mononuclear cell proliferation” (B), “positive regulation of cell adhesion” (C) and “positive regulation of cell migration” (D). The color range represents the normalized signal value of probes (log2 transformation and 75 percentile shift normalization). |
 |
Figure 5 ZnO NPs targeted pathways that promote cellular proliferation and survival. ZnO NPs reduced the expression of genes (FC≥4; p≤0.008; corrected p≤0.05) that significantly enriched “positive regulation of tyrosine phosphorylation of STAT protein” (IGF1, IL18, IL23A, KIT, CCL5 and HES1), “positive regulation of receptor signaling pathway via JAK-STAT” (IGF1, IL18, IL23A, KIT, CCL5 and HES1) and “positive regulation of phosphatidylinositol 3-kinase signaling” (IGF1, PIK3CG, IL18, KIT, CCL5 and UNC5B). The gene expression data were shown from three ZnO NPs-treated K562 samples and three untreated K562 samples. The normalized signal value of probes was generated by log2 transformation and 75 percentile shift normalization of the raw data. |
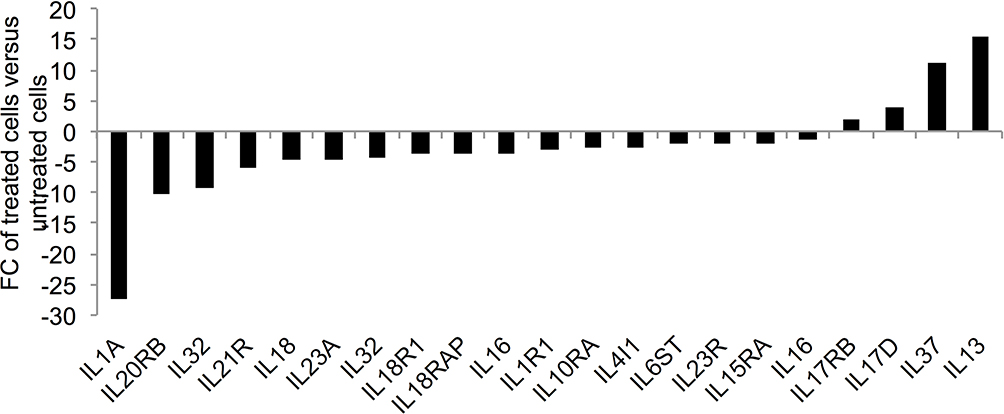 |
Figure 6 Expression of cytokine and cytokine receptor genes in the ZnO NPs-treated K562 cells compared with the untreated K562 cells. The fold change (FC) of the gene expression was based on the data that were recorded in three ZnO NPs-treated K562 samples and three untreated K562 samples. All FC data had p≤0.007 and corrected p≤0.05. |
Ingenuity pathway analysis (IPA) showed that the DEGs (FC≥4; p≤0.008; corrected p≤0.05) significantly enriched pathways named: IL-10 signaling (-log(p-value)=7.66×10⁻⁷; overlap=9/69), SPINK1 cancer pathway (-log(p-value)=7.66×10⁻⁷;overlap = 9/69), FXR/RXR activation (-log(p-value)=2071×10−6; overlap=11/126) and dendritic cell maturation (-log(p-value)=3.47×10⁻⁶; overlap=13/183). SPINK 1 cancer pathway was predicted to be inhibited (z-score=−2.33), but dendritic cell maturation pathway was activated (z-score=3.464). Activity prediction for the other two pathways could not be determined. Among the top upstream regulators, TNF was most significant and predicted to be activated (z-score=4.432) and p-value of overlap was 2.71×10⁻¹⁵. TNF affected 76 genes among the DEGs. Other top regulators were TGFB1 (p=1.20×10⁻¹³) and IFNG (p=1.62×10⁻¹²). All these regulators were predicted to be activated. Top network among the DEGs was associated with molecular transport and inflammatory response. A network of 35 genes was constructed from the DEGs, of which 23 were part of this network. Presence of BCL2A1, SOCS1 and IL13 genes was conspicuous (Figure 7).
 |
Figure 7 Network of differentially expressed genes (DEGs) is associated with molecular transport and inflammatory response. A network of 35 genes was constructed to understand the cross-talk between genes and functional relevance of this network. Red colored nodes indicated genes from the DEGs, whereas nodes with no color were not from the DEGs that was used for generating this network. Arrows show the direction of effect. The numbers under the genes are as follows from the top to bottom: p value, corrected p value, fold change (FC) of the DEGs, and log FC. |
Oxidative Stress Responsive Genes
As mentioned earlier, one mode of action that ZnO NPs use to target the survival of cancer cells is by increasing the production of ROS leading to oxidative stress-induced cell death.15,31 Therefore, we examined our transcriptomics data sets to determine whether oxidative stress responsive genes showed altered expression as consequence of the treatment with ZnO NPs. Among the DEGs (FC≥4; p≤0.008; corrected p≤0.05), there were four genes that have been implicated in the response to oxidative stress; superoxide dismutase 3 (SOD3), dual specificity phosphatase 1 (DUSP1) and heat shock protein family A (Hsp70) member 1A (HSPA1A) exhibited over-expression in the treated cells, while apolipoprotein E (APOE) recorded down-expression. To expand our search for oxidative stress responsive genes with altered expression post treatment with ZnO NPs, we set the FC threshold to ≥1.5 with p≤0.05 and corrected p≤0.1. Consequently, 35 genes were found with differential expression (Figure 8). Of these genes 24 were over-expressed and 11 were down-expressed in the treated cells. Of note, superoxide dismutases (SOD2 and SOD3), synuclein alpha (SNCA), 24-dehydrocholesterol reductase (DHCR24), oxidation resistance 1 (OXR1), apurinic/apyrimidinic endodeoxyribonuclease 1 (APEX1; also known as oxidative repair protein) peroxiredoxin 4 (PRDX4), frataxin (FXN) and sulfiredoxin 1 (SRXN1) showed an over-expression in the treated cells. Interestingly, the other member of superoxide dismutase family (SOD1) also recorded higher expression in the treated cells (FC=1.46; p=0.01; corrected p=0.06). In contrast, aldo-keto reductase family 1 member C3 (AKR1C3), glutathione peroxidase 1 (GPX1), pyrroline-5-carboxylate reductase 1 (PYCR1) and thioredoxin reductase 2 (TXNRD2) showed down-expression in the treated cells.
 |
Figure 8 K562 cells altered the expression of their oxidative stress responsive genes in response to the treatment with ZnO NPs. Hierarchical cluster analysis with heatmap presentation demonstrated changes in the expression of oxidative stress responsive genes in the ZnO NPs-treated K562 cells as opposed to the untreated K562 cells. The altered gene expression was identified with fold change ≥1.5, p≤0.05 and corrected p≤0.1. The color range represents the normalized signal value of probes (log2 transformation and 75 percentile shift normalization) |
Apoptotic Genes
Our flow cytometric analysis indicated that ZnO NPs induced apoptosis in K562 cells. In agreement with this finding, our DEGs (FC≥4; p≤0.008; corrected p≤0.05) showed that genes with antagonistic effect on cellular survival (MT1A, MT1H, MT1X, MT1B, MT1M, MT1F, MT1E, MT1G, GADD45B, EGR1 and HIP1R) were over-expressed in the treated cells, whereas genes that augment cellular survival (VEGFA, KIT, IGF1, LGALS3, INPP5D, IGFL2, NLRP7, NUPR1, NCKAP1L and S1PR3) were down-expressed (Supplementary Table 1). However, our DEGs (FC≥4; p≤0.008; corrected p≤0.05) did not include other core apoptotic genes, such as those that belong to tumor necrosis receptor superfamily and their ligands, BCL2 family or caspases. Therefore, we widened the search for apoptotic genes by decreasing the FC threshold (FC≥1.5 with p≤0.05 and corrected p≤ 0.1). Figure 9A and B show expression profiling of anti-apoptotic genes and pro-apoptotic genes, respectively. Seven anti-apoptotic genes, among which Fas apoptotic inhibitory molecule 2 (FAIM2, also known as LFG), cell death regulator (AVEN), apoptosis inhibitor (API5) and apoptosis regulator (MCL1), were over-expressed in the treated cells. In contrast, nine anti-apoptotic genes, such as BCL2 related protein A1 (BCL2A1), baculoviral IAP repeat containing 3 (BIRC3), TNF alpha induced protein 8 (TNFAIP8), p53 inhibitor (MDM4) and CASP8 and FADD like apoptosis regulator (CFLAR), were down-expressed post treatment with ZnO NPs. Twelve pro-apoptotic genes like growth arrest and DNA damage inducible genes (GADD45B and GADD45G), cell death inducing DFFA like effectors (CIDEB and CIDEC), tumor protein p53 inducible protein 3 (TP53I3), BCL2 associated transcription factor 1 (BCLAF1, also known as BTF), SIVA1 apoptosis inducing factor (SIVA1), BCL2 like 11 (BCL2L11, also known as BIM) and DNA fragmentation factor subunit beta (DFFB) were over-expressed in the treated cells. On the other hand, eight pro-apoptotic genes, such as death associated protein kinase 1 (DAPK1), caspases (CASP8 and CASP10), death receptors including TNF receptor superfamily member 1A (TNFRSF1A), TNF receptor superfamily member 10b (TNFRSF10B) and Fas cell surface death receptor (FAS), TNF superfamily members (TNFSF10 and TNFSF12) showed down-expression following treatment with ZnO NPs. Although BAX, which is a pro-apoptotic gene, did not meet the FC cut-off (FC≥1.5-fold), it showed an over-expression in the treated cells (FC=1.21, p=0.05).
 |
Figure 9 ZnO NPs induced changes in the expression of apoptotic genes in K562 cells. Hierarchical cluster analysis and heatmap presentation showed altered expression of anti-apoptotic genes (A) and pro-apoptotic genes (B) in the ZnO NPs-treated K562 cells compared with the untreated K562 cells. All differentially expressed genes were found with fold change ≥1.5, p≤0.05 and corrected p≤0.1. The color range represents the normalized signal value of probes (log2 transformation and 75 percentile shift normalization). |
NF-κB Pathway
The aforementioned changes in the transcriptome of K562 cells post treatment with ZnO NPs revealed reduced expression of genes such as KIT, CXCL1, VEGFA, NUPR1, BCL2A1, TNFAIP8, BIRC3, and CFLAR (also known as FLICE-like IP), which were previously reported to promote the activation or expression of NF-κB pathway, or to be downstream targets of NF-κB pathway. These data suggested down-regulation of NF-κB pathway in K562 cells by ZnO NPs. Therefore, we studied the expression of I-kappa-B-kinase beta (IKBKB) and the subunits of NF-κB. Although the FC was smaller than 4, Figure 10 shows that the treated cells exhibited reduced expression of IKBKB (FC=3.4, p=0.007; corrected p=0.05), NFKB2 (also known as p100 subunit; FC=2.42; p=0.001; corrected p=0.03), RELB (FC=2; p=0.01; corrected p=0.06) and REL (also known as c-REL; FC=1.42; p=0.03; corrected p=0.09).
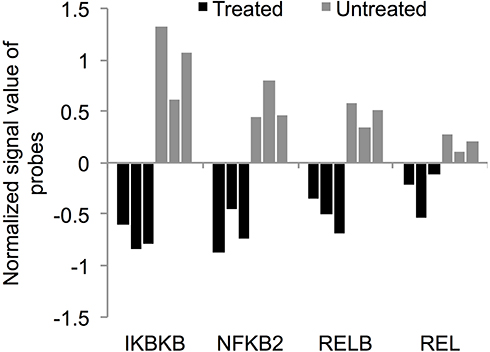 |
Figure 10 ZnO NPs targeted NF-κB pathway in K562 cells. The treatment with ZnO NPs reduced the expression of NF-κB pathway activator IKBKB (FC=3.4, p=0.007; corrected p=0.05) and the NF-κB subunits: NFKB2 (FC=2.42; p=0.001; corrected p=0.03), RELB (FC=2; p=0.01; corrected p=0.06) and REL (FC=1.42; p=0.03; corrected p=0.09). The gene expression data were obtained from three samples of ZnO NPs-treated K562 cells and three samples of untreated K562 cells. The normalized signal value of probes was generated by log2 transformation and 75 percentile shift normalization of the raw data. |
Discussion
ZnO NPs have been reported to cause cytotoxicity on a diverse range of cancer cells.15 Our current findings support this, as ZnO NPs were found to induce apoptosis in the CML cells line, K562. Our data indicated that the toxicity of ZnO NPs was limited to the leukemic cells but that normal PBMCs were not affected. Furthermore, we found that the toxicity of ZnO NPs on K562 cells was driven by apoptosis but not necrosis even when the leukemic cells were over-exposed to the NPs (72 hours). Performing microarray transcriptomics analysis on treated cells with viability loss = 25% identified transcriptomics alterations that preceded ZnO NPs-induced apoptosis (because 75% of the treated cells had not yet undergone apoptosis). Therefore, these transcriptomics changes were likely to underpin the apoptotic impact of ZnO NPs on K562 cells. Interestingly, our molecular findings (transcriptomics data) agreed with, and to a large extent explained, our cellular results that demonstrated an apoptosis induction in K562 cells by ZnO NPs. For example, the treatment with ZnO NPs increased the expression of genes that play roles in the “response to zinc ions”, “response to toxic substance”, “detoxification of inorganic compound”, “response to chemical” and “negative regulation of growth”. Amongst these genes were eight types of MT1, which are known to be important for the intracellular homeostasis of zinc ions, detoxification of heavy metal ions and suppression of tumor growth.32 In line with this, four transcriptomics studies that were conducted on immune cells (HMDM, MDDC and Jurkat),22 embryonic kidney cells (HEK293),33 lung cancer cells (A549),19 and keratinocyte cells (HaCaT)34 that were exposed to ZnO NPs consistently reported an over-expression of genes implicated in Zn homeostasis including MT1 genes. Interestingly, decreased expression of MT1 genes was reported in a wide range of neoplasms of different organs including breast, colon, stomach, lung and prostate.32 Importantly, MT1 genes exert tumor suppressor activity in a number of malignancies, such as hepatocellular carcinoma (MT1X, MT1M, MT1H and MT1G),35–38 prostate cancer (MT1H and MT1E)39,40 and thyroid cancer (MT1G, MT1M).41,42 Given the onco-suppression feature of MT1 genes, it is possible that their over-expression promoted apoptosis in the ZnO NPs-treated K562 cells. In consistence with this observation, FOS, which antagonizes proliferation and promotes apoptosis,43 was also found to be over-expressed in K562 cells post treatment with ZnO NPs. Furthermore, other genes that are known to target cellular survival such as GADD45B,44,45 EGR146,47 and HIP1R48 were also identified with over-expression in the treated cells.
Given the roles of heat shock proteins in the protection of cells against stress induced by hypoxia, drugs or other chemical agents,49 the elevated expression of HSPA1A and HSPH1 is likely to be a defense mechanism of K562 cells against the cytotoxicity of ZnO NPs. Similarly, the treated cells also raised the expression of SLC30A1 that exports intracellular Zn ions out of cells to maintain Zn homeostasis.50 Other transcriptomics studies also reported an over-expression of SLC30A1 upon treatment with ZnO NPs.19,22 Furthermore, the cytoskeleton genes (SPTP, EPB41L4A and EPB42) of erythrocytes, for which K562 cells are progenitor leukemic blasts, were found with over-expression in the treated cells possibly to overcome the ZnO NPs toxicity that were reported previously to alter the expression of structural proteins and cause cytoskeleton collapse.51,52
Our transcriptomics data showed that ZnO NPs reduced the expression of genes implicated in the positive regulation of “immune response”, “cell activation”, “cell proliferation”, “cell migration”, “cell adhesion” and “signal transduction”. For example, KIT, which is a key receptor whose signaling is essential for the activation, survival and proliferation of hematopoietic stem cells,53,54 BATF, which plays significant roles in the survival and proliferation of blood cells,55,56 and PTPRC, which is required for hemopoiesis and homing of leukemic cells to bone marrow,57 were down-expressed following the treatment with ZnO NPs. Other interesting genes including IGF1, VEGFA and NCKAP1L, which promote the survival, proliferation and migration of cancer cells,58–64 were also down-expressed in the treated cells. Our findings support the results of an earlier transcriptomics study that reported reduced expression of NCKAP1L and BATF in immune cells upon treatment with ZnO NPs.22 Our study also demonstrated decreased migration capacity of K562 cells post treatment with ZnO NPs as evidenced by the down-expression of migration genes, such as CCL5, CXCL1 and CXCL3.65 These chemokine genes not only play roles in the cellular migration, but are also important for the survival and proliferation of leukemic cells.66–68 The tyrosine phosphorylation of STAT and constitutive signaling of JAK-STAT were implicated in the tumorigenesis of different types of leukemia.69,70 Therefore, blocking the JAK-STAT signal transduction or targeting STAT was shown to significantly inhibit the survival and proliferation of leukemic cells.71,72 Similarly, PI3K signaling plays important roles in the extended survival and growth of various kinds of leukemia, and was reported by several studies to be a promising therapeutic target in blood cancer.73–75 Interestingly, ZnO NPs were found in the present study to target the STAT phosphorylation, JAK-STAT pathway and PI3K signaling in K562 cells by reducing the expression of genes that positively regulate them. Therefore, our findings support the notion that NPs target STATs in cancer cells.76 Of note, genes that were previously reported to inhibit apoptosis, such as LGALS3,77 NLRP7,78 NUPR1,79 and S1PR3,80 were identified in our transcriptomics data with down-expression post treatment with ZnO NPs. Taken together, the ZnO NPs-induced changes in the transcriptome of K562 cells (molecular findings; DEGs: FC≥4; p≤0.008; corrected p≤0.05) were consistent with a cytotoxic phenotype of K562 cells caused by ZnO NPs (cellular findings). Furthermore, the transcriptomics profiling identified molecular mechanisms through which ZnO NPs promoted apoptosis in K562 cells.
A growing body of evidence showed that ZnO NPs significantly increase the production of ROS promoting oxidative stress-induced cellular death.15,31,81 As a defense mechanism, cells increase the expression of oxidative stress responsive genes (anti-oxidant genes), such as SOD family, in order to neutralize the oxidative stress to escape cellular death.82 However, when the oxidative insult is persistent and overweighs the cellular anti-oxidant defense, the cells undergo apoptosis.83 Interestingly, in vitro and in vivo studies reported that ZnO NP-induced ROS production was associated with increased activity and expression of the anti-oxidant genes, SOD, catalase, PRDX2 and GSH.34,84,85 In line with this view, our current study showed altered expression of oxidative stress responsive genes in K562 cells post treatment with ZnO NPs. For example, genes like SOD2 (also known as mitochondrial SOD), which protects cells from superoxide anion radicals by converting these to hydrogen peroxide and oxygen,86 SOD3 (extracellular SOD), which guards the extracellular region from ROS by intermediating the conversion of superoxide to hydrogen peroxide and oxygen,87 ORX-1, which positively regulates the expression of genes that detoxify hydrogen peroxide,88 PRDX4, which reduces hydrogen peroxide and organic hydroperoxides to water and alcohols,89 were over-expressed in K562 cells in response to ZnO NPs. In contrast, genes including GPX1, which converts peroxides to water and alcohol,90 and TXNRD2, which keeps thioredoxin in the reduced state,91 were down-expressed in the treated K562 cells. Our findings indicated an altered expression of anti-oxidant genes in the ZnO NPs-treated cells, probably to antagonize the oxidative insult of the NPs.
In line with the apoptotic effect of the ZnO NPs on K562 cells, our transcriptomics data sets showed changes in the expression of apoptotic genes and proposed that ZnO NPs caused mitochondrial-dependent apoptosis in K562 cells, which was probably triggered by oxidative stress-induced DNA damage. For instance, among the over-expressed pro-apoptotic genes in the treated cells were BCLTF1, which is required for the transcription of TP53 in response to DNA damage, and P53I3, which is a downstream target of p53 that functions in the p53-dependent apoptosis pathway.92,93 In contrast, MDM4, which suppresses the activation of p53 in the event of DNA damage, was down-expressed in the treated cells. Interestingly, pro-apoptotic genes that are required for the DNA fragmentation during apoptosis, such as CIDEB, CIDEC, GADD45G, GADD45B and DFFB, were found to be over-expressed in the treated cells.44,94–96 The treated cells also exhibited increased expression of BIM, which is an initiator of the intrinsic apoptosis pathway,97 and SIVA1, which binds to and inhibits the anti-apoptotic gene BCL-XL allowing the mitochondrial-dependent apoptosis to occur.98 In line with these findings, the treated cells reduced the expression of BCL2A1, which antagonizes the release of cytochrome c from mitochondria by sequestering the pro-apoptotic effectors BAX and BAK.99 Similarly, CFLAR, which suppresses the release of cytochrome c from mitochondria,100 and BIRC3, which inhibits the activation of CASP3 and CASP7,101 demonstrated decreased expression in the treated cells. In contrast, the treated cells increased the expression of anti-apoptotic genes, such as AVEN, which interferes with activation of caspases, and MCL1, which inhibits the release of cytochrome c from the mitochondria by interacting with BH3-only pro-apoptotic proteins.102,103 This finding could perhaps be explained, at least partially, by the over-expressed anti-oxidant defense in the treated cell. Anti-oxidant enzymes such as SOD were found to increase the expression of anti-apoptotic genes like AVEN and MCL1.104,105 Strikingly, there was reduced expression of genes that play key proapoptotic roles in the extrinsic apoptosis pathway, such as FAS,106 TNFRSF1A (also known as TNFR-1),107 TNFRSF10B (also known as TRAIL-R2) and its ligand TNFSF10 (also known as TRAIL),108 and CASP8.109 These data strongly support the idea that the intrinsic apoptosis pathway was responsible for the ZnO NPs-induced death of K562 cells. Overall, our findings agree with the notion that ZnO NPs change the expression of apoptotic genes leading to mitochondrial-dependent apoptosis and revealed novel genes whose altered expression plays a potential role in this process.
NF-κB pathway has been heavily implicated in the survival and chemotherapy resistance of cancer cells.110 Interestingly, the treatment of K562 with ZnO NPs decreased expression of genes that were previously characterized as activators or downstream targets of NF-κB pathway. These genes included KIT,111 CXCL1,112 VEGFA,113 NUPR1,114 BCL2A,99 TNFAIP8,115 BIRC3116 and CFLAR (also known as FLICE-like IP).117 The activation of NF-κB pathway requires the phosphorylation of the inhibitors of NF-κB by I-kappa-B-kinase beta (IKBKB) leading to their degradation by proteasome and the translocation of NF-kB subunits to the nucleus in order to function as transcription factors.109 Interestingly, our transcriptomics data reported reduced expression of IKBKB, RELB, NFKB2 and REL in the treated cells, indicating that ZnO NPs targeted NF-κB pathway to promote apoptosis in K562 cells.
Conclusion
In summary, our study showed the capability of ZnO NPs to induce apoptosis in CML cells (K562), supporting earlier studies that reported cytotoxicity of ZnO NPs on cancer cells. Using DNA microarray-based transcriptomic approach, we were able to identify alterations in the transcriptome of K562 cells post treatment with ZnO NPs. Our transcriptomics findings were consistent with the apoptotic impact of ZnO NPs on K562 cells and revealed possible molecular mechanisms that were employed by the NPs to exert toxicity on the leukemic cells.
Acknowledgment
The authors would like to thank the Deanship of Scientific Research at Majmaah University in Saudi Arabia for supporting this study under a project number [R-1441-162].
Disclosure
The authors declare no conflicts of interest for this work.
References
1. Handy RD, Von der Kammer F, Lead JR, Hassellöv M, Owen R, Crane M. The ecotoxicology and chemistry of manufactured nanoparticles. Ecotoxicology. 2008;17(4):287–314. doi:10.1007/s10646-008-0199-8
2. Govindaraju K, Krishnamoorthy K, Alsagaby SA, Singaravelu G, Premanathan M. Green synthesis of silver nanoparticles for selective toxicity towards cancer cells. IET Nanobiotechnol. 2015;9:325–330. doi:10.1049/iet-nbt.2015.0001
3. Ke Y, Al Aboody MS, Alturaiki W, et al. Photosynthesized gold nanoparticles from Catharanthus roseus induces caspase-mediated apoptosis in cervical cancer cells (HeLa). Artif Cells Nanomed Biotechnol. 2019;47:1938–1946. doi:10.1080/21691401.2019.1614017
4. Kawata K, Osawa M, Okabe S. In vitro toxicity of silver nanoparticles at noncytotoxic doses to HepG2 human hepatoma cells. Environ Sci Technol. 2009;43:6046–6051. doi:10.1021/es900754q
5. Rajeshkumar S. Anticancer activity of eco-friendly gold nanoparticles against lung and liver cancer cells. J Genetic Eng Biotechnol. 2016;14:195–202. doi:10.1016/j.jgeb.2016.05.007
6. Foldbjerg R, Dang DA, Autrup H. Cytotoxicity and genotoxicity of silver nanoparticles in the human lung cancer cell line, A549. Arch Toxicol. 2011;85:743–750. doi:10.1007/s00204-010-0545-5
7. Gurunathan S, Han JW, Eppakayala V, Jeyaraj M, Kim J-H. Cytotoxicity of biologically synthesized silver nanoparticles in MDA-MB-231 human breast cancer cells. Biomed Res Int. 2013;2013.
8. Jiang J, Pi J, Cai J. The advancing of zinc oxide nanoparticles for biomedical applications. Bioinorg Chem Appl. 2018;2018.
9. Premanathan M, Karthikeyan K, Jeyasubramanian K, Manivannan G. Selective toxicity of ZnO nanoparticles toward Gram-positive bacteria and cancer cells by apoptosis through lipid peroxidation. Nanomed Nanotechnol Biol Med. 2011;7:184–192. doi:10.1016/j.nano.2010.10.001
10. Boroumand Moghaddam A, Moniri M, Azizi S, et al. Eco-friendly formulated zinc oxide nanoparticles: induction of cell cycle arrest and apoptosis in the MCF-7 cancer cell line. Genes. 2017;8:281.
11. Cao Y, Roursgaard M, Kermanizadeh A, Loft S, Møller P. Synergistic effects of zinc oxide nanoparticles and fatty acids on toxicity to caco-2 cells. Int J Toxicol. 2015;34(1):67–76. doi:10.1177/1091581814560032
12. Akhtar MJ, Ahamed M, Kumar S, Khan MAM, Ahmad J, Alrokayan SA. Zinc oxide nanoparticles selectively induce apoptosis in human cancer cells through reactive oxygen species. Int J Nanomedicine. 2012;7:845.
13. Bai D-P, Zhang X-F, Zhang G-L, Huang Y-F, Gurunathan S. Zinc oxide nanoparticles induce apoptosis and autophagy in human ovarian cancer cells. Int J Nanomedicine. 2017;12:6521. doi:10.2147/IJN.S140071
14. Pandurangan M, Enkhtaivan G, Kim DH. Anticancer studies of synthesized ZnO nanoparticles against human cervical carcinoma cells. J Photochem Photobiol B Biol. 2016;158:206–211. doi:10.1016/j.jphotobiol.2016.03.002
15. Bisht G, Rayamajhi S. ZnO nanoparticles: a promising anticancer agent. Nanobiomedicine. 2016;3:3–9. doi:10.5772/63437
16. Shen C, James SA, de Jonge MD, Turney TW, Wright PFA, Feltis BN. Relating cytotoxicity, zinc ions, and reactive oxygen in ZnO nanoparticle–exposed human immune cells. Toxicol Sci. 2013;136:120–130.
17. Manke A, Wang L, Rojanasakul Y. Mechanisms of nanoparticle-induced oxidative stress and toxicity. Biomed Res Int. 2013;2013.
18. Lowe R, Shirley N, Bleackley M, Dolan S, Shafee T. Transcriptomics technologies. PLoS Comput Biol. 2017;13.
19. Hanagata N, Xu M, Takemura T, Zhuang F. Cellular response to ZnO nanoparticle toxicity inferred from global gene expression profiles. Nano Biomedicine. 2010;2:153–169.
20. Moos PJ, Olszewski K, Honeggar M, et al. Responses of human cells to ZnO nanoparticles: a gene transcription study. Metallomics. 2011;3:1199–1211.
21. Poon W-L, Alenius H, Ndika J, et al. Nano-sized zinc oxide and silver, but not titanium dioxide, induce innate and adaptive immunity and antiviral response in differentiated THP-1 cells. Nanotoxicology. 2017;11:936–951. doi:10.1080/17435390.2017.1382600
22. Tuomela S, Autio R, Buerki-Thurnherr T, et al. Gene expression profiling of immune-competent human cells exposed to engineered zinc oxide or titanium dioxide nanoparticles. PLoS One. 2013;8.
23. Lozzio CB, Lozzio BB. Human Chronic Myelogenous Leukemia Cell-Line with Positive Philadelphia Chromosome. 1975.
24. Jabbour E, Kantarjian H. Chronic myeloid leukemia: 2018 update on diagnosis, therapy and monitoring. Am J Hematol. 2018;93:442–459.
25. An X, Tiwari AK, Sun Y, Ding P-R, Ashby CR
26. Druker BJ, Guilhot F, O’Brien SG, et al. Five-year follow-up of patients receiving imatinib for chronic myeloid leukemia. N Engl J Med. 2006;355:2408–2417.
27. Hochhaus A, Larson RA, Guilhot F, et al. Long-term outcomes of imatinib treatment for chronic myeloid leukemia. N Engl J Med. 2017;376(10):917–927. doi:10.1056/NEJMoa1609324
28. Mosmann T. Rapid colorimetric assay for cellular growth and survival: application to proliferation and cytotoxicity assays. J Immunol Methods. 1983;65(1–2):55–63. doi:10.1016/0022-1759(83)90303-4
29. Reimand J, Arak T, Adler P, et al. g: profiler—a web server for functional interpretation of gene lists (2016 update). Nucleic Acids Res. 2016;44:W83–W89. doi:10.1093/nar/gkw199
30. Triboulet S, Aude-Garcia C, Armand L, et al. Analysis of cellular responses of macrophages to zinc ions and zinc oxide nanoparticles: a combined targeted and proteomic approach. Nanoscale. 2014;6:6102–6114
31. Mishra PK, Mishra H, Ekielski A, Talegaonkar S, Vaidya B. Zinc oxide nanoparticles: a promising nanomaterial for biomedical applications. Drug Discov Today. 2017;22(12):1825–1834. doi:10.1016/j.drudis.2017.08.006
32. Si M, Lang J. The roles of metallothioneins in carcinogenesis. J Hematol Oncol. 2018;11:107.
33. Dua P, Chaudhari KN, Lee C-H, et al. Evaluation of toxicity and gene expression changes triggered by oxide nanoparticles. Bull Korean Chem Soc. 2011;32(6):2051–2057. doi:10.5012/bkcs.2011.32.6.2051
34. Lee SH, Pie J-E, Kim Y-R, Lee HR, Son SW, Kim M-K. Effects of zinc oxide nanoparticles on gene expression profile in human keratinocytes. Mol Cell Toxicol. 2012;8(2):113–118. doi:10.1007/s13273-012-0014-8
35. Zheng Y, Jiang L, Hu Y, et al. Metallothionein 1H (MT1H) functions as a tumor suppressor in hepatocellular carcinoma through regulating Wnt/β-catenin signaling pathway. BMC Cancer. 2017;17:161. doi:10.1186/s12885-017-3139-2
36. Liu Z. Ye, Q., Wu, L., et al. Metallothionein 1 family profiling identifies MT1X as a tumor suppressor involved in the progression and metastastatic capacity of hepatocellular carcinoma. Mol Carcinog. 2018;57:1435–1444. doi:10.1002/mc.22846
37. Wang Y, Wang, G, Tan, X, et al. MT1G serves as a tumor suppressor in hepatocellular carcinoma by interacting with p53. Oncogenesis. 2019;8:1–11. doi:10.1038/s41389-019-0176-5
38. Mao J, Yu H, Wang C, et al. Metallothionein MT1M is a tumor suppressor of human hepatocellular carcinomas. Carcinogenesis. 2012;33:2568–2577. doi:10.1093/carcin/bgs287
39. Han YC, Zheng ZL, Zuo ZH, et al. Metallothionein 1 h tumour suppressor activity in prostate cancer is mediated by euchromatin methyltransferase 1. J Pathol. 2013;230:184–193.
40. Demidenko R, Daniunaite K., Bakavicius A., et al. Decreased expression of MT1E is a potential biomarker of prostate cancer progression. Oncotarget. 2017;8:61709. doi:10.18632/oncotarget.18683
41. Fu J, Lv H, Guan H, et al. Metallothionein 1G functions as a tumor suppressor in thyroid cancer through modulating the PI3K/Akt signaling pathway. BMC Cancer. 2013;13:462. doi:10.1186/1471-2407-13-462
42. Chen Y, Quan R,Bhandari A, et al. Low metallothionein 1M (MT1M) is associated with thyroid cancer cell lines progression. Am J Transl Res. 2019;11:1760.
43. Appierto V. Villani MG, Cavadini, E, et al. Involvement of c-Fos in fenretinide-induced apoptosis in human ovarian carcinoma cells. Cell Death Differ. 2004;11:270–279. doi:10.1038/sj.cdd.4401349
44. Takekawa M, Saito H. A family of stress-inducible GADD45-like proteins mediate activation of the stress-responsive MTK1/MEKK4 MAPKKK. Cell. 1998;95:521–530. doi:10.1016/S0092-8674(00)81619-0
45. Yoo J, Ghiassi, M, Jirmanova L., et al. Transforming grow th factor-β-induced apoptosis is mediated by Smad-dependent expression of GADD45b through p38 activation. J Biol Chem. 2003;278:43001–43007. doi:10.1074/jbc.M307869200
46. Boone DN, Qi Y, Li Z, Hann SR. Egr1 mediates p53-independent c-Myc–induced apoptosis via a noncanonical ARF-dependent transcriptional mechanism. Proc Natl Acad Sci. 2011;108:632–637. doi:10.1073/pnas.1008848108
47. Yu J, Baron V, Mercola D, Mustelin T, Adamson ED. A network of p73, p53 and Egr1 is required for efficient apoptosis in tumor cells. Cell Death Differ. 2007;14(3):436. doi:10.1038/sj.cdd.4402029
48. Kim J-H, Yoon S, Won M, et al. HIP1R interacts with a member of Bcl-2 family, BCL2L10, and induces BAK-dependent cell death. Cell Physiol Biochem. 2009;23(1–3):043–52. doi:10.1159/000204088
49. Yun CW, Kim HJ, Lim JH, Lee SH. Heat shock proteins: agents of cancer development and therapeutic targets in anti-cancer therapy. Cells. 2020;9:60.
50. Chowanadisai W, Kelleher SL, Lonnerdal BO. Zinc deficiency is associated with increased brain zinc import and LIV-1 expression and decreased ZnT-1 expression in neonatal rats. J Nutr. 2005;135:1002–1007. doi:10.1093/jn/135.5.1002
51. Aude-Garcia C, Dalzon B, Ravanat J-L, et al. A combined proteomic and targeted analysis unravels new toxic mechanisms for zinc oxide nanoparticles in macrophages. J Proteomics. 2016;134:174–185. doi:10.1016/j.jprot.2015.12.013
52. García-Hevia L, Valiente R, Martín-Rodríguez R, et al. Nano-ZnO leads to tubulin macrotube assembly and actin bundling, triggering cytoskeletal catastrophe and cell necrosis. Nanoscale. 2016;8:10963–10973. doi:10.1039/C6NR00391E
53. Edling CE, Hallberg B. c-Kit—a hematopoietic cell essential receptor tyrosine kinase. Int J Biochem Cell Biol. 2007;39(11):1995–1998. doi:10.1016/j.biocel.2006.12.005
54. Rönnstrand L. Signal transduction via the stem cell factor receptor/c-Kit. Cell Mol Life Sci. 2004;61:2535–2548. doi:10.1007/s00018-004-4189-6
55. Schleussner N, Merkel O, Costanza M., et al. The AP-1-BATF and-BATF3 module is essential for growth, survival and TH17/ILC3 skewing of anaplastic large cell lymphoma. Leukemia. 2018;32:1994–2007. doi:10.1038/s41375-018-0045-9
56. Logan MR, Jordan-Williams KL, Poston S, Liao J, Taparowsky EJ. Overexpression of Batf induces an apoptotic defect and an associated lymphoproliferative disorder in mice. Cell Death Dis. 2012;3:e310–e10. doi:10.1038/cddis.2012.49
57. Shivtiel S, Lapid K, Kalchenko V, et al. CD45 regulates homing and engraftment of immature normal and leukemic human cells in transplanted immunodeficient mice. Exp Hematol. 2011;39(1161–70):e1.
58. Ma Y. Han, C.-C.; Huang, Q.; Sun, W.-Y. and Wei, W. GRK2 overexpression inhibits IGF1-induced proliferation and migration of human hepatocellular carcinoma cells by downregulating EGR1. Oncol Rep. 2016;35:3068–3074. doi:10.3892/or.2016.4641
59. Tagoug I, De Chalon AS, Dumontet C. Inhibition of IGF-1 signalling enhances the apoptotic effect of AS602868, an IKK2 inhibitor, in multiple myeloma cell lines. PLoS One. 2011;6.
60. Strömberg T, Ekman S, Girnita L, et al. IGF-1 receptor tyrosine kinase inhibition by the cyclolignan PPP induces G2/M-phase accumulation and apoptosis in multiple myeloma cells. Blood. 2006;107:669–678. doi:10.1182/blood-2005-01-0306
61. Park H, Chan, MM and Iritani, BM. Hem-1: putting the “WAVE” into actin polymerization during an immune response. FEBS Lett. 2010;584:4923–4932.
62. Joshi AD, Hegde GV, Dickinson JD, et al. ATM, CTLA4, MNDA, and HEM1 in High versus Low CD38–Expressing B-cell chronic lymphocytic leukemia. Clin Cancer Res. 2007;13:5295–5304. doi:10.1158/1078-0432.CCR-07-0283
63. Cao L, Branstrom A, Baird J, et al. PTC299 is a novel DHODH inhibitor that modulates VEGFA mRNA translation and inhibits proliferation of a broad range of leukemia cells. Blood. 2017;130:1371.
64. Ghosh A, Dasgupta D, Ghosh A, et al. MiRNA199a-3p suppresses tumor growth, migration, invasion and angiogenesis in hepatocellular carcinoma by targeting VEGFA, VEGFR1, VEGFR2, HGF and MMP2. Cell Death Dis. 2017;8(3):e2706–e06. doi:10.1038/cddis.2017.123
65. Moser B, Wolf M, Walz A,et al. Chemokines: multiple levels of leukocyte migration control. Trends Immunol. 2004;25:75–84.
66. Mukaida N. Tanabe, Y. and Baba, T. Chemokines as a conductor of bone marrow microenvironment in chronic myeloid leukemia. Int J Mol Sci. 2017;18:1824. doi:10.3390/ijms18081824
67. Olsnes AM, Hatfield KJ, Bruserud Ø. The chemokine system and its contribution to leukemogenesis and treatment responsiveness in patients with acute myeloid leukemia. J BUON. 2009;14:S131–40.
68. Burger J A. Chemokines and chemokine receptors in chronic lymphocytic leukemia (CLL): from understanding the basics towards therapeutic targeting. Seminars in cancer biology. 2010;20:424–430.
69. Vainchenker W, Constantinescu SN. JAK/STAT signaling in hematological malignancies. Oncogene. 2013;32:2601–2613.
70. Steelman LS, Pohnert SC, Shelton JG, Franklin RA, Bertrand FE, McCubrey JA. JAK/STAT, Raf/MEK/ERK, PI3K/Akt and BCR-ABL in cell cycle progression and leukemogenesis. Leukemia. 2004;18:189–218.
71. Faderl S, Ferrajoli A, Harris D, et al. Atiprimod blocks phosphorylation of JAK-STAT and inhibits proliferation of acute myeloid leukemia (AML) cells. Leuk Res. 2007;31:91–95. doi:10.1016/j.leukres.2006.05.027
72. Hayakawa F, Sugimoto K, Harada Y, et al. A novel STAT inhibitor, OPB-31121, has a significant antitumor effect on leukemia with STAT-addictive oncokinases. Blood Cancer J. 2013;3:e166–e66. doi:10.1038/bcj.2013.63
73. Zhao S, Konopleva M, Cabreira-Hansen M, et al. Inhibition of phosphatidylinositol 3-kinase dephosphorylates BAD and promotes apoptosis in myeloid leukemias. Leukemia. 2004;18:267–275.
74. Barragán M, Bellosillo B, Campas C, et al. Involvement of protein kinase C and phosphatidylinositol 3–kinase pathways in the survival of B-cell chronic lymphocytic leukemia cells. Blood J Am Soc Hematol. 2002;99:2969–2976.
75. Herman SEM, Gordon AL, Wagner AJ, et al. Phosphatidylinositol 3-kinase-δ inhibitor CAL-101 shows promising preclinical activity in chronic lymphocytic leukemia by antagonizing intrinsic and extrinsic cellular survival signals. Blood J Am Soc Hematol. 2010;116:2078–2088.
76. Ashrafizadeh M, Ahmadi Z, Kotla NG, et al. Nanoparticles targeting STATs in cancer therapy. Cells. 2019;8:1158. doi:10.3390/cells8101158
77. Matarrese P, Fusco O, Tinari N, et al. Galectin‐3 overexpression protects from apoptosis by improving cell adhesion properties. Int J Cancer. 2000;85:545–554. doi:10.1002/(SICI)1097-0215(20000215)85:4<545::AID-IJC17>3.0.CO;2-N
78. Okada K. Hirota E, Mizutani Y, et al. Oncogenic role of NALP7 in testicular seminomas. Cancer Sci. 2004;95:949–954. doi:10.1111/j.1349-7006.2004.tb03182.x
79. Zeng C, Li X, Li A, et al. Knockdown of NUPR1 inhibits the growth of U266 and RPMI8226 multiple myeloma cell lines via activating PTEN and caspase activation‑dependent apoptosis. Oncol Rep. 2018;40:1487–1494.
80. An S, Zheng, Y. and Bleu, T. Sphingosine 1-phosphate-induced cell proliferation, survival, and related signaling events mediated by G protein-coupled receptors Edg3 and Edg5. J Biol Chem. 2000;275:288–296. doi:10.1074/jbc.275.1.288
81. Nogueira DR, Rolim CMB, Farooqi AA. Nanoparticle induced oxidative stress in cancer cells: adding new pieces to an incomplete jigsaw puzzle. Asian Pac J Cancer Prev. 2014;15:4739–4743. doi:10.7314/APJCP.2014.15.12.4739
82. Zelko IN, Mariani TJ, Folz RJ. Superoxide dismutase multigene family: a comparison of the CuZn-SOD (SOD1), Mn-SOD (SOD2), and EC-SOD (SOD3) gene structures, evolution, and expression. Free Radic Biol Med. 2002;33:337–349. doi:10.1016/S0891-5849(02)00905-X
83. Gelain DP, Dalmolin RJS, Belau VL, Moreira JCF, Klamt F, Castro MA. A systematic review of human antioxidant genes. Front Biosci. 2009;14:4457–4463. doi:10.2741/3541
84. Muthuraman P, Ramkumar K, Kim DH. Analysis of dose-dependent effect of zinc oxide nanoparticles on the oxidative stress and antioxidant enzyme activity in adipocytes. Appl Biochem Biotechnol. 2014;174:2851–2863. doi:10.1007/s12010-014-1231-5
85. Syama S, Reshma SC, Sreekanth PJ, Varma HK, Mohanan P. V. Effect of zinc oxide nanoparticles on cellular oxidative stress and antioxidant defense mechanisms in mouse liver. Toxicol Environ Chem. 2013;95:495–503. doi:10.1080/02772248.2013.789606
86. MacMillan-Crow LA, Thompson JA. Tyrosine modifications and inactivation of active site manganese superoxide dismutase mutant (Y34F) by peroxynitrite. Arch Biochem Biophys. 1999;366:82–88. doi:10.1006/abbi.1999.1202
87. Folz RJ, Crapo JD. Extracellular superoxide dismutase (SOD3): tissue-specific expression, genomic characterization, and computer-assisted sequence analysis of the human EC SOD gene. Genomics. 1994;22:162–171. doi:10.1006/geno.1994.1357
88. Jaramillo-Gutierrez G, Molina-Cruz A, Kumar S, Barillas-Mury C. The Anopheles gambiae oxidation resistance 1 (OXR1) gene regulates expression of enzymes that detoxify reactive oxygen species. PLoS One. 2010;5.
89. Wang X, Wang L, Wang XE, Sun F, WangC-C. Structural insights into the peroxidase activity and inactivation of human peroxiredoxin 4. Biochem J. 2012;441:113–118. doi:10.1042/BJ20110380
90. Arthur JR. The glutathione peroxidases. Cell Mol Life Sci. 2001;57:1825–1835. doi:10.1007/PL00000664
91. Hanschmann E-M, Godoy JR, Berndt C, Hudemann C, Lillig CH. Thioredoxins, glutaredoxins, and peroxiredoxins—molecular mechanisms and health significance: from cofactors to antioxidants to redox signaling. Antioxid Redox Signal. 2013;19:1539–1605. doi:10.1089/ars.2012.4599
92. Liu H, Lu Z-G, Miki Y, Yoshida K. Protein kinase C δ induces transcription of the TP53 tumor suppressor gene by controlling death-promoting factor Btf in the apoptotic response to DNA damage. Mol Cell Biol. 2007;27:8480–8491. doi:10.1128/MCB.01126-07
93. Lee JH, Kang Y, Khare V, et al. The p53-inducible gene 3 (PIG3) contributes to early cellular response to DNA damage. Oncogene. 2010;29:1431–1450. doi:10.1038/onc.2009.438
94. Lugovskoy AA, Zhou P, Chou JJ, McCarty JS, Li P, Wagner G. Solution structure of the CIDE-N domain of CIDE-B and a model for CIDE-N/CIDE-N interactions in the DNA fragmentation pathway of apoptosis. Cell. 1999;99:747–755. doi:10.1016/S0092-8674(00)81672-4
95. Liang L, Zhao, M, Xu Z, Yokoyama KK, Li T. Molecular cloning and characterization of CIDE-3, a novel member of the cell-death-inducing DNA-fragmentation-factor (DFF45)-like effector family. Biochem J. 2003;370:195–203. doi:10.1042/bj20020656
96. Iglesias-Guimarais V, Gil-Guiñon E, Gabernet G, et al. Apoptotic DNA degradation into oligonucleosomal fragments, but not apoptotic nuclear morphology, relies on a cytosolic pool of DFF40/CAD endonuclease. J Biol Chem. 2012;287:7766–7779. doi:10.1074/jbc.M111.290718
97. Huang DCS, Strasser A. BH3-only proteins—essential initiators of apoptotic cell death. Cell. 2000;103:839–842. doi:10.1016/S0092-8674(00)00187-2
98. Xue L, Chu F, Cheng Y, et al. Siva-1 binds to and inhibits BCL-XL-mediated protection against UV radiation-induced apoptosis. Proc Natl Acad Sci. 2002;99:6925–6930. doi:10.1073/pnas.102182299
99. Vogler M. BCL2A1: the underdog in the BCL2 family. Cell Death Differ. 2012;19:67–74. doi:10.1038/cdd.2011.158
100. He M-X, He Y-W. c-FLIP protects T lymphocytes from apoptosis in the intrinsic pathway. J Immunol. 2015;194:3444–3451. doi:10.4049/jimmunol.1400469
101. Deveraux QL, Reed JC. IAP family proteins—suppressors of apoptosis. Genes Dev. 1999;13:239–252. doi:10.1101/gad.13.3.239
102. Chau BN, Cheng EHY, Kerr DA, Hardwick JM. Aven, a novel inhibitor of caspase activation, binds Bcl-xL and Apaf-1. Mol Cell. 2000;6:31–40. doi:10.1016/S1097-2765(05)00021-3
103. Chen L, Willis, SN, Wei A, et al. Differential targeting of prosurvival Bcl-2 proteins by their BH3-only ligands allows complementary apoptotic function. Mol Cell. 2005;17:393–403. doi:10.1016/j.molcel.2004.12.030
104. Borrelli A, Schiattarella A, Mancini R, et al. A recombinant MnSOD is radioprotective for normal cells and radiosensitizing for tumor cells. Free Radic Biol Med. 2009;46:110–116. doi:10.1016/j.freeradbiomed.2008.10.030
105. Chen P-M, Cheng Y-W, Wu T-C, Chen C-Y, Lee H. MnSOD overexpression confers cisplatin resistance in lung adenocarcinoma via the NF-κB/Snail/Bcl-2 pathway. Free Radic Biol Med. 2015;79:127–137. doi:10.1016/j.freeradbiomed.2014.12.001
106. Nagata S. Fas ligand-induced apoptosis. Annu Rev Genet. 1999;33:29–55. doi:10.1146/annurev.genet.33.1.29
107. Hsu H, Huang J, Shu H-B, Baichwal V, Goeddel DV. TNF-dependent recruitment of the protein kinase RIP to the TNF receptor-1 signaling complex. Immunity. 1996;4:387–396. doi:10.1016/S1074-7613(00)80252-6
108. Walczak H, Degli‐Esposti MA, Johnson RS, et al. TRAIL‐R2: a novel apoptosis‐mediating receptor for TRAIL. EMBO J. 1997;16:5386–5397. doi:10.1093/emboj/16.17.5386
109. Salvesen GS. Caspase 8: igniting the death machine. Structure. 1999;7:R225–R29. doi:10.1016/S0969-2126(00)80048-9
110. Gilmore TD. Introduction to NF-κB: players, pathways, perspectives. Oncogene. 2006;25(51):6680–6684. doi:10.1038/sj.onc.1209954
111. Reber L, Vermeulen L, Haegeman G, Frossard N. Ser276 phosphorylation of NF-kB p65 by MSK1 controls SCF expression in inflammation. PLoS One. 2009;4:e4393. doi:10.1371/journal.pone.0004393
112. Bandapalli OR, Ehrmann F, Ehemann V, et al. Down-regulation of CXCL1 inhibits tumor growth in colorectal liver metastasis. Cytokine. 2012;57:46–53. doi:10.1016/j.cyto.2011.10.019
113. Liu J-Y, Zeng Q-H, Cao P-G, et al. RIPK4 promotes bladder urothelial carcinoma cell aggressiveness by upregulating VEGF-A through the NF-κB pathway. Br J Cancer. 2018;118:1617–1627.
114. Hamidi T, Algül H, Cano CE, et al. Nuclear protein 1 promotes pancreatic cancer development and protects cells from stress by inhibiting apoptosis. J Clin Invest. 2012;122:2092–2103. doi:10.1172/JCI60144
115. You Z, Ouyang H, Lopatin D, Polver PJ, WangC-Y. Nuclear factor-κB-inducible death effector domain-containing protein suppresses tumor necrosis factor-mediated apoptosis by inhibiting caspase-8 activity. J Biol Chem. 2001;276:26398–26404. doi:10.1074/jbc.M102464200
116. Gyrd-Hansen M, Meier P. IAPs: from caspase inhibitors to modulators of NF-κB, inflammation and cancer. Nat Rev Cancer. 2010;10:561–574.
117. Matsuda A, Suzuki Y, Honda G, et al. Large-scale identification and characterization of human genes that activate NF-κ B and Mapk signaling pathways. Oncogene. 2003;22:3307–3318. doi:10.1038/sj.onc.1206406
 © 2020 The Author(s). This work is published and licensed by Dove Medical Press Limited. The
full terms of this license are available at https://www.dovepress.com/terms
and incorporate the Creative Commons Attribution
- Non Commercial (unported, 3.0) License.
By accessing the work you hereby accept the Terms. Non-commercial uses of the work are permitted
without any further permission from Dove Medical Press Limited, provided the work is properly
attributed. For permission for commercial use of this work, please see paragraphs 4.2 and 5 of our Terms.
© 2020 The Author(s). This work is published and licensed by Dove Medical Press Limited. The
full terms of this license are available at https://www.dovepress.com/terms
and incorporate the Creative Commons Attribution
- Non Commercial (unported, 3.0) License.
By accessing the work you hereby accept the Terms. Non-commercial uses of the work are permitted
without any further permission from Dove Medical Press Limited, provided the work is properly
attributed. For permission for commercial use of this work, please see paragraphs 4.2 and 5 of our Terms.