Back to Journals » Journal of Inflammation Research » Volume 19
Transcriptomic and Proteomic Analyses Identify THBS2, VWF, NFASC, and AKR1B10 as Diagnostic Biomarkers for Advanced Fibrosis in NAFLD
Authors Ding S, Liu Y ![]() , Liu Z, Chu F, Lu B, Xu L
, Liu Z, Chu F, Lu B, Xu L ![]()
Received 22 October 2025
Accepted for publication 12 May 2026
Published 22 May 2026 Volume 2026:19 569506
DOI https://doi.org/10.2147/JIR.S569506
Checked for plagiarism Yes
Review by Single anonymous peer review
Peer reviewer comments 4
Editor who approved publication: Dr Fatih Türker
Shan Ding,1,* Yiqing Liu,1,* Zhi Liu,1 Fulu Chu,1 Bingru Lu,1 Li Xu2
1Department of Clinical Laboratory, Shandong Provincial Hospital Affiliated to Shandong First Medical University, Jinan, Shandong Province, 250021, People’s Republic of China; 2Department of Infectious Disease and Hepatology, The Second Qilu Hospital of Shandong University, Jinan, Shandong Province, 250033, People’s Republic of China
*These authors contributed equally to this work
Correspondence: Li Xu, Department of Infectious Disease and Hepatology, The Second Qilu Hospital of Shandong University, No. 247, Beiyuan Street, Tianqiao District, Jinan, Shandong, 250033, People’s Republic of China, Tel +86-17660081397, Email [email protected]
Purpose: The increasing prevalence of non-alcoholic fatty liver disease (NAFLD) has paralleled changes in lifestyle and dietary habits. However, the gold standard for the staging of NAFLD relies on liver biopsy, which is highly damaging and poorly accepted. This study aims to identify convenient biomarkers for staging advanced fibrosis (stage F3–F4) in NAFLD patients, thereby improving disease management.
Patients and Methods: This study integrated liver transcriptomic sequencing data and peripheral blood proteomic data from NAFLD patients. Candidate diagnostic biomarkers for advanced fibrosis were screened using three machine learning algorithms. The dynamic expression patterns of these biomarkers were further validated by time series analysis from NAFLD mouse model. Additionally, a retrospective validation cohort comprising 119 biopsy-confirmed NAFLD patients was established at Shandong Provincial Hospital. Blood samples and clinical characteristics were collected before liver biopsy. These samples were used to validate the diagnostic performance of the candidate biomarkers via ELISA, which was further compared with established non‑invasive indicators (FIB‑4, APRI, and NFS). Finally, single-nucleus sequencing was employed to elucidate the underlying pathogenic mechanisms and their cellular location in NAFLD, while Mendelian randomization (MR) analyses based on whole proteome and whole genome data were conducted to explore causal relationship for NAFLD.
Results: This study identified THBS2, AKR1B10, NFASC, and VWF as diagnostic biomarkers for advanced fibrosis in NAFLD. Transcriptomic and proteomic analyses demonstrated that the combination of these four biomarkers exhibited robust diagnostic performance (AUC = 0.860– 0.880). In our NAFLD clinical cohort, each biomarker individually showed promising diagnostic performance (THBS2 AUC = 0.867; NFASC AUC = 0.834; VWF AUC = 0.777; AKR1B10 AUC = 0.733), which was comparable to established non-invasive indicators. Furthermore, the expression levels of THBS2, AKR1B10, and VWF increased progressively with the duration of high-fat diet feeding in NAFLD mouse model. NFASC and THBS2 were specifically enriched in activated hepatic stellate cells and showed significant upregulation in advanced fibrosis and cirrhosis.
Conclusion: THBS2, AKR1B10, NFASC, and VWF serve as diagnostic biomarkers for advanced fibrosis in NAFLD, providing novel insights for the development of non-invasive clinical diagnostic strategies. Diagram of NFALD patient analysis using biopsy, snRNA-seq, transcriptomics and proteomics for fibrosis diagnosis.The diagram outlines the analysis process for non-alcoholic fatty liver disease (NFALD) patients with varying fibrosis levels. It starts with a biopsy analyzed via single-nucleus RNA sequencing (snRNA-seq), enhancing macrophage and hepatic stellate cell interactions and immune infiltration. Transcriptomics and proteomics are performed, using weighted gene co-expression network analysis (WGCNA) and identifying differentially expressed genes (DEGs) and proteins (DEPs). This analysis identifies diagnostic biomarkers for advanced fibrosis, such as THBS2, AKR1B10, NFASC and VWF. These biomarkers undergo further analysis using LASSO, random forest (RF) and support vector machine (SVM) methods. Proteome-wide and genome-wide Mendelian randomization (MR) provide insights into NFALD and non-alcoholic steatohepatitis (NAFLD/NASH).
Keywords: advanced NAFLD fibrosis, diagnostic biomarkers, multi-omics sequencing, THBS2
Introduction
Non-alcoholic fatty liver disease (NAFLD) is a hepatic condition associated with obesity, insulin resistance, type 2 diabetes, and metabolic syndrome.1,2 A recent systematic review and meta-analysis revealed that the global prevalence of NAFLD has risen substantially, climbing from 25.3% during the period 1990–2006 to 38.0% in 2016–2019.3 NAFLD follows a continuous pathophysiological progression, starting from simple steatosis and advancing to necroinflammation and fibrosis, leading to nonalcoholic steatohepatitis (NASH), which may further progress to cirrhosis and hepatocellular carcinoma. A critical distinction across these stages is the prognosis of fibrosis: mild fibrosis (F0-F2) may be alleviated, improved, or even reversed with timely clinical intervention, while patients with advanced fibrosis (F3-F4) and cirrhosis face a significantly poorer prognosis, including higher risks of liver-related mortality and hepatocellular carcinoma.4 Therefore, early and accurate identification of patients with advanced fibrosis is critical for improving the outcome of NAFLD patients.
The current gold standard for diagnosing advanced fibrosis in NAFLD relies on histopathological examination of liver biopsies.5 However, this method has inherent limitations: it is invasive, associated with risks of bleeding or infection, poorly accepted by patients, and prone to sampling variability.6 To address these drawbacks, several non-invasive biomarkers have been proposed for detecting fibrosis, including the NAFLD fibrosis score (NFS), AST to platelet ratio index (APRI), Fibro Test, enhanced liver fibrosis (ELF) test, and fibrosis-4 (FIB-4) index; however, their sensitivity and specificity remain suboptimal in distinguishing advanced fibrosis from mild fibrosis.7–12 Moreover, vibration-controlled transient elastography (VCTE) and magnetic resonance elastography (MRE) demonstrate high diagnostic accuracy in distinguishing advanced fibrosis and cirrhosis, yet their widespread use is limited by high cost and equipment dependency.13,14 Collectively, there is a lack of safe, accurate, cost-effective, and widely applicable non-invasive diagnostic tools specifically for advanced NAFLD fibrosis.
Recent advances in omics technologies have provided valuable insights into the pathophysiological mechanisms underlying NAFLD fibrosis. A transcriptomic study of liver tissues from 98 NAFLD patients revealed that THBS2 effectively identified advanced fibrosis with an area under the curve (AUC) of 0.957, and peripheral blood THBS2 levels combined with platelet count were identified as risk factors for advanced fibrosis.15 Similarly, peripheral blood proteomic profiling identified an 8-protein panel that accurately detected high-risk NASH and significant fibrosis.16 However, the cellular localization and specific regulatory mechanisms of most candidate biomarkers in NAFLD fibrosis remain unclear. Interestingly, single-cell sequencing and Mendelian randomization (MR) studies have offered new perspectives on cellular heterogeneity and causal genetic influences underlying NAFLD fibrosis.17,18 Nevertheless, omics-based diagnostic biomarkers for advanced fibrosis have not been fully translated into clinical practice, and their stability and applicability require further validation.
To address these unmet needs, we identified diagnostic biomarkers for advanced fibrosis by integrating transcriptomes from 390 biopsy-confirmed NAFLD patients (stages F0-F4) and blood proteomes from 191 patients. Dynamic expression changes of candidate biomarkers were monitored in a high-fat diet-induced NAFLD mouse model. Single-nucleus sequencing of human liver tissue was used to clarify the cellular location and regulatory mechanisms of these biomarkers, and MR was employed to explore genetic causal relationships between the biomarkers and NAFLD. Finally, a clinical cohort was established to validate their diagnostic performance and compare them with existing non-invasive biomarkers, thereby facilitating the translation of NAFLD fibrosis biomarkers into clinical applications.
Materials and Methods
Analysis of Transcriptomic Sequencing and Proteomic Data
Liver transcriptomic sequencing datasets from NAFLD patients were obtained from the GEO database using the keyword “NAFLD”. Datasets containing pathological fibrosis scores from liver biopsies were selected for further analysis. This study utilized GSE130970, GSE135251, and GSE162694 as the training dataset. After data preprocessing, the sva package (version 3.46.0) was applied for batch effect removal and data integration. Based on pathological fibrosis staging, patients in the training set were divided into two groups: advanced fibrosis group (F3-F4) and mild fibrosis group (F0-F2), comprising 104 and 286 patients, respectively. Additionally, GSE193066 was used as the validation dataset, including 20 patients with advanced fibrosis and 80 with mild fibrosis. Detailed information on the datasets is provided in Supplementary Table 1. Differential gene expression analysis between the two groups was performed using DESeq2 (version 1.38.3), with differentially expressed genes (DEGs) defined as those showing |fold change| ≥ 1.5 and p-value < 0.05. Results were visualized using the ggplot2 package (version 3.5.1) in the form of volcano plots.
Furthermore, peripheral blood proteomic data from a previous study19 was incorporated, which included 79 patients with advanced fibrosis (F3–F4) and 112 patients with mild fibrosis (F0–F2). The cohort was composed of 38.4% females with a mean age of 55.2±11 years. Blood samples were analyzed using the SomaScan v.4.0 platform, which quantified 4730 unique proteins. Differential expression analysis of proteins was conducted using the limma package (version 3.54.2). Differentially expressed proteins (DEPs) were identified based on |fold change| ≥ 1.2 and p-value < 0.05, and results were similarly visualized with ggplot2.
Functional Enrichment and Immune Infiltration Analysis
Functional enrichment analysis was performed on the identified DEGs using the clusterProfiler package (version 4.6.2). Kyoto Encyclopedia of Genes and Genomes (KEGG) pathway enrichment and Gene Ontology (GO) analyses were conducted, covering the categories of molecular function (MF), biological process (BP), and cellular component (CC), to investigate the roles of these genes in cellular signaling and metabolic pathways. Gene Set Enrichment Analysis (GSEA) was carried out using the gene set file “c2.cp.v2022.1.Hs.symbols.gmt” obtained from the MSigDB database to explore potential pathogenic mechanisms. In addition, the CIBERSORT algorithm was employed to analyze the immune microenvironment in the samples. This approach enabled the deconvolution-based quantification of the infiltration proportions of 22 immune cell subtypes. Differences in immune cell infiltration between the compared groups were assessed to evaluate the role of immune cells in NAFLD-related liver fibrosis.
Construction of Protein-Protein Interaction Network
The STRING database integrates protein-protein interaction (PPI) data from multiple public databases and published literature, providing a comprehensive resource for exploring functional associations between proteins. In this study, protein interaction information for the DEGs was retrieved from the STRING database. Subsequently, PPI networks were constructed using Cytoscape software (version 3.8.2). Key functional modules within the network were identified and visualized using the built-in Molecular Complex Detection (MCODE) plugin. The selected key modules were further subjected to KEGG and GO enrichment analyses to gain deeper insights into the potential pathogenic mechanisms involved in advanced fibrosis.
Weighted Gene Co-Expression Network Analysis (WGCNA)
Weighted gene co-expression network analysis (WGCNA) was performed using the WGCNA package (version 1.73) to identify key modules associated with advanced fibrosis phenotype. Gene co-expression networks were constructed based on scale-free topology. Key modules showing significant correlation with advanced fibrosis (|correlation coefficient| ≥ 0.50) were selected for further analysis. DEGs and DEPs were then intersected with genes from the key modules to screen candidate diagnostic biomarkers.
Identification of Diagnostic Biomarkers for Advanced NAFLD Liver Fibrosis Using Machine Learning
Candidate diagnostic biomarkers for advanced fibrosis were selected by taking the intersection of DEGs, genes from key WGCNA modules, and DEPs. Three machine learning algorithms—Least Absolute Shrinkage and Selection Operator (LASSO), Random Forest (RF), and Support Vector Machine (SVM)—were employed to identify diagnostic biomarkers from the training cohort. Genes commonly identified by all three algorithms were considered candidate diagnostic biomarkers. Multivariate regression analysis was then performed on these candidate biomarkers, and a composite risk score was calculated based on regression coefficients and expression levels. The diagnostic performance of the biomarkers was evaluated by measuring the area under the curve (AUC) and visualized by receiver operating characteristic (ROC) curves in both training and validation datasets.
Time Series Analysis
Time series analysis (TSA) enables in-depth investigation of dynamic gene expression patterns and provides insights into the underlying mechanisms driving disease progression. In this study, we utilized a liver transcriptomic dataset from a high-fat diet (HFD) induced NAFLD mouse model (GSE109345). This public dataset was generated using male low-density lipoprotein receptor knockout (LDLr-/-) C57BL/6 mice, which were randomly allocated into two groups: the HFD group and the standard chow diet group. To capture the progressive pathological changes of NAFLD, liver tissue samples were collected at 5 key time points (0, 6, 12, 18, and 24 weeks after modeling), with 12 mice per time point in the HFD group and 6 mice per time point in the standard chow diet group. Subsequently, TSA was performed using the maSigPro package (version 1.70.0), and genes with time-dependent differential expression in the HFD induced NAFLD model were rigorously identified at a Benjamini-Hochberg adjusted P-value < 0.05. Furthermore, the dynamic expression changes of the diagnostic biomarkers proposed in this study were visualized to illustrate their temporal expression profiles during NAFLD progression.
Single-Nucleus and Single-Cell RNA Sequencing
This study utilized the GSE202379 dataset from the GEO database, which included single-nucleus RNA sequencing (snRNA-seq) data from liver tissues of 40 pathologically confirmed NAFLD patients—16 with advanced fibrosis (F3-F4) and 24 with mild fibrosis (F0-F2).20 After quality control filtering to remove mitochondrial genes and red blood cells, the Harmony package (version 1.2.0) was applied to correct for batch effects and integrate Seurat objects. Uniform Manifold Approximation and Projection (UMAP) was used for dimensionality reduction and visualization of cell clusters. Cell type annotation was performed using reference datasets from the CellMarker 2.0 database and the SingleR package (version 2.0.0). To further investigate gene expression differences between groups, DEGs were identified using the Wilcoxon rank-sum test with the following thresholds: |log2FC| ≥ 0.25, min.pct ≥ 0.1, and a significance level of P < 0.05. Additionally, scRNA-seq data from GSE136103, comprising liver samples from 5 cirrhosis patients and 5 normal individuals, was obtained from the GEO database.18 The same analytical pipeline described above was applied to this dataset.
Intercellular Communication and SCENIC Analysis
Intercellular communication analysis systematically deciphers interaction networks mediated by signaling molecules across different cell populations, providing critical insights into the molecular mechanisms of cellular coordination within the tissue microenvironment. In this study, Intercellular communication between advanced fibrosis and mild fibrosis groups in NAFLD patients was analyzed using the CellChat package (version 1.6.1). Specifically, gene expression data and known ligand-receptor interaction databases were integrated to infer intercellular communication probabilities, which were further summarized and interpreted at the signaling pathway level.
SCENIC (Single-Cell Regulatory Network Inference and Clustering) analysis was employed to identify cell type-specific transcription factors and their regulatory networks, elucidating distinct functional roles of various cell populations in the pathophysiology of NAFLD. The analysis involved three main steps: first, gene regulatory networks were constructed using GENIE3 (version 1.20.0); second, regulatory networks with significantly enriched transcription factor binding motifs were identified using RcisTarget (version 1.18.2); finally, the activity of these regulatory networks in individual cells was evaluated with AUCell (version 1.20.2).
Proteome-Wide and Genome-Wide Mendelian Randomization
We conducted this Mendelian randomization study in accordance with the Strengthening the Reporting of Observational Studies in Epidemiology Using Mendelian Randomization (STROBE-MR) guidelines.21,22 Our study was performed using summary-level data from single-nucleotide polymorphisms (SNPs). This study selected 3183 cis-pQTLs corresponding to 1561 proteins from previous studies as exposure variables, and integrated cis-eQTL data from the eQTLGen database as additional exposure variables.23,24 The selection of instrumental variables strictly adhered to the following criteria: ① genome-wide significant SNPs (P < 5 × 10⁻⁸), ② linkage disequilibrium clumping (r2 < 0.001), ③ exclusion of palindromic SNPs, and ④ retention of strong instrumental variables (F > 10).25 Due to the lack of large-scale GWAS summary statistics specifically for advanced NAFLD fibrosis, NAFLD and NASH GWAS data (R10_NAFLD and R10_NASH) from the FinnGen database were used as outcome variables to investigate potential causal relationships through proteome-wide and genome-wide MR analyses. Heterogeneity was assessed using Cochran’s Q test, and reverse causality was evaluated via Steiger test. Given the exploratory nature of this analysis, multiple testing correction was not applied in order to retain potentially meaningful biological signals.26
Establishment of the NAFLD Clinical Cohort
This study retrospectively included patients with NAFLD who underwent liver biopsy at Shandong Provincial Hospital between March 2025 and October 2025. In our study, the clinical indications for liver biopsy were based on current clinical practice guidelines: (1) Ruling out alternative etiologies of chronic liver disease (eg, viral hepatitis, autoimmune liver disease) or clarify overlap conditions when non-invasive tests; (2) Evaluating the severity of nonalcoholic, particularly microscopic features; (3) Confirming the stage of liver fibrosis.27,28 The inclusion criteria were as follows: (1) age ≥ 18 years, (2) NAFLD confirmed by pathological examination, and (3) availability of complete fibrosis stage (F0-F4). The exclusion criteria were: (1) age <18 years; (2) concurrent other chronic liver diseases, including but not limited to viral hepatitis, autoimmune liver disease, and alcoholic liver disease; (3) a history of continuous hepatotoxic drug use for ≥ 1 month prior to enrollment (acetaminophen, anti-tuberculosis drugs, etc).; (4) comorbid malignant tumors; (5) incomplete clinical or laboratory data. For eligible patients, clinical history and laboratory characteristics were retrospectively extracted from electronic medical records. Peripheral blood samples, which were originally collected during routine clinical visits and cryopreserved, were retrieved from our institution by trained clinical researchers and laboratory technicians from the research team of Shandong Provincial Hospital. All laboratory assays were performed in the Clinical Laboratory of Shandong Provincial Hospital. Specifically, aspartate aminotransferase (AST) and alanine aminotransferase (ALT) were measured using the rate method; albumin (ALB) was determined by the bromocresol green method; total bilirubin (TBIL) and direct bilirubin (DBIL) were quantified via the diazonium salt method. All detection kits were purchased from Beckman Coulter, and the assays were conducted on a Beckman AU5800 automatic biochemical analyzer. Informed consent was waived because of the retrospective nature of the study, and the study protocol adhered to the principles of the Declaration of Helsinki. The use of patient serum samples was approved by the Ethics Committee of Shandong Provincial Hospital (Ethics Approval No.: SWYX: NO.2025–535).
Liver Histology
Liver tissue samples were embedded in paraffin blocks and stained with hematoxylin and eosin (H&E) as well as Masson’s trichrome. All liver biopsy specimens were evaluated by an experienced Liver pathologist using the NAFLD Activity Score (NAS) and the fibrosis staging system developed by the NASH Clinical Research Network (NASH CRN).29 The NAS (ranging from 0 to 8) was used to assess steatosis (0–3), lobular inflammation (0–3), and hepatocellular ballooning (0–2). Liver fibrosis was scored on a scale from 0 to 4. In this study, fibrosis stage F3-F4 was defined as advanced fibrosis, while fibrosis stage F0-F2 was classified as mild fibrosis.29,30
ELISA Detection in Peripheral Blood
Fasting venous blood samples collected from patients after fasting were allowed to clot at room temperature for 30 minutes. The serum was then separated by centrifugation at 3000 × g for 15 minutes at 4°C and subsequently stored at −80°C. The expression levels of the candidate diagnostic biomarkers were measured using the following commercial ELISA kits: THBS2 (BSKH60180, Bioswamp, China), VWF (EK192, LiankeBio, China), NFASC (CB19786-Hu, Cusabio, China), and AKR1B10 (CB14079-Hu, Cusabio, China). All procedures were strictly performed according to the manufacturer’s protocols. Standard curves were generated for each target independently to calculate corresponding protein concentrations. Finally, ROC curves were plotted to evaluate the diagnostic performance of these biomarkers for advanced fibrosis in NAFLD patients.
Statistical Analysis
All statistical analyses in this study were performed using R software (version 4.2.2). Continuous variables following a normal distribution are presented as mean ± standard deviation, while non-normally distributed variables are expressed as median (interquartile range). Differences between two independent groups were compared using Student’s independent samples t-test when data were normally distributed with homogeneous variances, Welch’s t-test for normally distributed data with heterogeneous variances, and the Wilcoxon rank-sum test for non-normally distributed data. For comparisons of three or more independent groups of continuous variables, the Kruskal–Wallis (KW) test was used (a non-parametric alternative for non-normally distributed data or data with heterogeneous variances across groups). Categorical variables are described as numbers (percentages), and group comparisons were conducted using the chi-square test. A two-sided P-value < 0.05 was considered statistically significant.
Results
Fibrosis- and Inflammation-Related Pathways are Significantly Enriched
After batch effect removal, we integrated GSE130970, GSE135251, and GSE162694 into a training dataset comprising 104 patients with advanced fibrosis and 286 patients with mild fibrosis, including 16,340 common genes (Figure 1A). Based on the criteria for differential expression, 612 upregulated and 90 downregulated DEGs were identified (Figure 1B). The top 50 most significantly altered DEGs were visualized using a heatmap (Figure 1C). GO enrichment analysis revealed significant enrichment of fibrosis-related terms such as “extracellular matrix organization” and “collagen fibril organization” (Figure 1D). KEGG enrichment analysis indicated significant enrichment of fibrosis-associated pathways including “Focal adhesion” and “ECM-receptor interaction”, as well as the inflammation-related “TNF signaling pathway” (Supplementary Figure 1). The consistent results were obtained through GSEA (Figure 1E).
 |
Figure 1 Enrichment analysis of differentially expressed genes between advanced and mild fibrosis groups. (A) Venn diagram showing 16,340 common genes identified from the three datasets. (B) Volcano plot of differentially expressed genes between advanced fibrosis and mild fibrosis groups. (C) Heatmap of the top 50 differentially expressed genes between two groups. (D) Bubble plot of GO enrichment analysis for differentially expressed genes. (E) GSEA plot of the two groups. |
Infiltration of M1 Macrophages and Multiple Chemokines are Increased in Liver Tissue
PPI networks were constructed using the 702 DEGs, leading to the identification of two key functional modules that included multiple chemokines and extracellular matrix genes (Figure 2A and B). Subsequent KEGG enrichment analysis of genes within these key modules revealed significant enrichment of fibrosis- and inflammation-related pathways (Figure 2C). Immune infiltration analysis further demonstrated an increased proportion of M1 macrophages and a decreased proportion of M2 macrophages in liver tissues (Figure 2D).
 |
Figure 2 Immune infiltration and inflammation are involved in the progression of advanced fibrosis in NAFLD. (A) Key module cluster 1 from the PPI network constructed using differentially expressed genes. (B) Key module cluster 2 from the PPI network constructed using differentially expressed genes. (C) KEGG enrichment analysis of differentially expressed genes contained in cluster 1 and cluster 2. (D) Immune infiltration analysis between the two groups. *P < 0.05, **P < 0.01, ***P < 0.001, ****P < 0.0001. |
Integration of Peripheral Blood Proteomic Data Identifies Diagnostic Biomarkers for Advanced Fibrosis
This study further incorporated peripheral blood proteomic data from NAFLD patients.19 Based on the predefined criteria, 66 upregulated and 21 downregulated DEPs were identified (Figure 3A). WGCNA was performed to identify gene modules closely associated with advanced fibrosis in the training dataset. A key module, the blue module containing 318 genes, was identified as the most relevant (Figure 3B and C). By taking the intersection of DEGs from liver tissue, DEPs from peripheral blood, and the 318 genes from the key WGCNA module, 8 candidate genes were selected (Figure 3D). Subsequently, three machine learning algorithms were employed to identify diagnostic biomarkers for advanced fibrosis. The analysis consistently identified THBS2, VWF, NFASC, and AKR1B10 as diagnostic biomarkers (Figure 3E). In liver tissue transcriptomic data, the individual AUC for these biomarkers were 0.849 (THBS2), 0.767 (VWF), 0.770 (NFASC), and 0.787 (AKR1B10), while the combined model achieved an AUC of 0.860 (Figure 3F). In peripheral blood proteomic dataset, the individual AUC values were 0.862 (THBS2), 0.650 (VWF), 0.839 (NFASC), and 0.701 (AKR1B10), with a combined AUC of 0.880 (Figure 3G). All four diagnostic biomarkers were significantly elevated in both liver tissue and peripheral blood of NAFLD patients with advanced fibrosis. Finally, nomograms were constructed based on the four biomarkers using both liver transcriptomic and peripheral blood proteomic data to facilitate clinical diagnosis (Figure 3H and I).
 |
Figure 3 THBS2, VWF, NFASC, and AKR1B10 serve as diagnostic biomarkers for advanced fibrosis in NAFLD. (A) Volcano plot of differentially expressed proteins in the peripheral blood proteome of NAFLD patients.(B) Heatmap showing the correlation between gene modules from WGCNA and advanced fibrosis.(C) Scatter plot of gene significance versus module membership in the blue module.(D) Venn diagram illustrating the overlap among differentially expressed proteins from peripheral blood proteomics, differentially expressed genes from liver tissue, and genes in the WGCNA blue module.(E) Venn diagram showing the intersection of candidate biomarkers identified by the three machine learning algorithms.(F) ROC curves of the four diagnostic biomarkers based on liver transcriptomic data from NAFLD patients.(G) ROC curves of the four diagnostic biomarkers based on peripheral blood proteomic data from NAFLD patients.(H) Nomogram constructed using the four biomarkers from liver transcriptomic data.(I) Nomogram constructed using the four biomarkers from peripheral blood proteomic data. |
Expression Levels of THBS2, VWF, NFASC, and AKR1B10 Increase with Liver Fibrosis Stage
In the training dataset, the expression levels of THBS2, VWF, NFASC, and AKR1B10 showed a significant positive correlation with liver fibrosis stage (Figure 4A–D). Furthermore, the expression of THBS2 and AKR1B10 increased with higher NAFLD Activity Scores (NAS) (Figure 4E and F), while changes in VWF and NFASC expression with increasing NAS were not statistically significant (Supplementary Figure 2). In the independent validation transcriptomic dataset GSE193066, the AUC values for THBS2, VWF, NFASC, and AKR1B10 were 0.735, 0.697, 0.799, and 0.722, respectively, with a combined AUC of 0.760 for the four-marker panel (Figure 4G). All four diagnostic biomarkers were significantly upregulated in liver tissues of NAFLD patients with advanced fibrosis (Figure 4H).
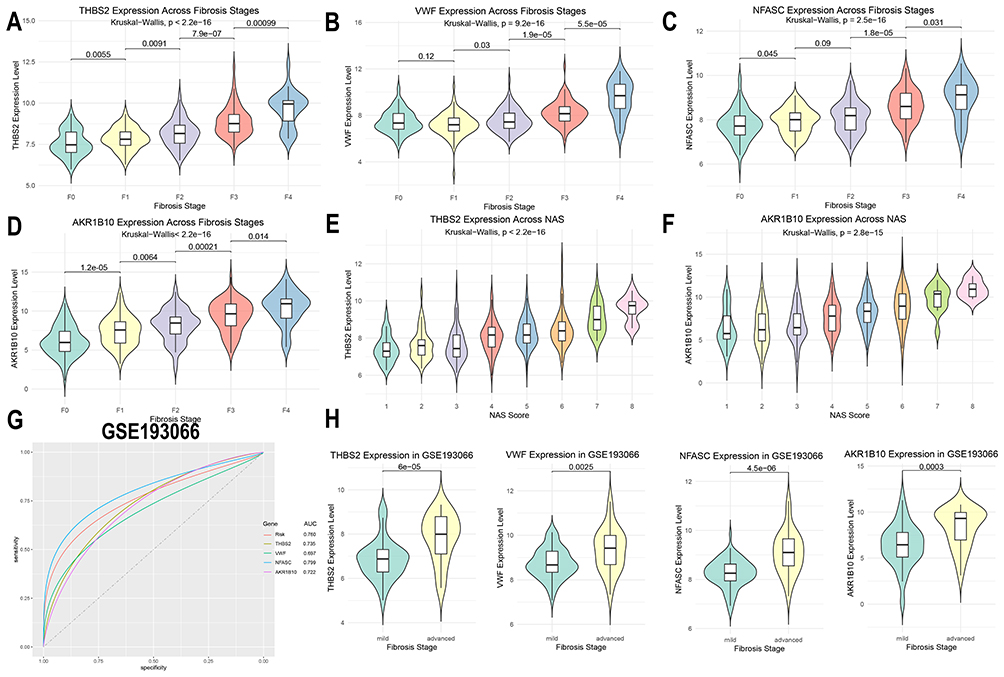 |
Figure 4 Validation of the expression and diagnostic performance of THBS2, VWF, NFASC, and AKR1B10 in training and validation datasets. (A-D) Expression differences of THBS2, VWF, NFASC, and AKR1B10 across fibrosis stages in the training cohort.(E-F) Expression differences of THBS2 and AKR1B10 across NAFLD Activity Score (NAS) grades in the training cohort.(G) ROC curves of THBS2, VWF, NFASC, and AKR1B10 in the validation dataset GSE193066.(H) Expression differences of THBS2, VWF, NFASC, and AKR1B10 between advanced and mild fibrosis groups in the validation dataset GSE193066. |
Expression Levels of THBS2, VWF, and AKR1B10 are Positively Correlated with Duration of High-Fat Diet
In liver transcriptomic data from a HFD induced NAFLD mouse model at 0, 6, 12, 18, and 24 weeks, the expression levels of THBS2, VWF, and AKR1B10 increased with the duration of high-fat diet feeding, while NFASC expression decreased (Figure 5B–E). Time series analysis further identified 657 genes in cluster1 whose expression increased over time, and 18 genes whose expression decreased (Figure 5A). Subsequent KEGG and GO enrichment analyses of the 657 up-regulated genes revealed significant enrichment of pathways related to collagen matrix organization and inflammation, particularly involving immune cell infiltration and the production of multiple inflammatory factors (Figure 5F and G).
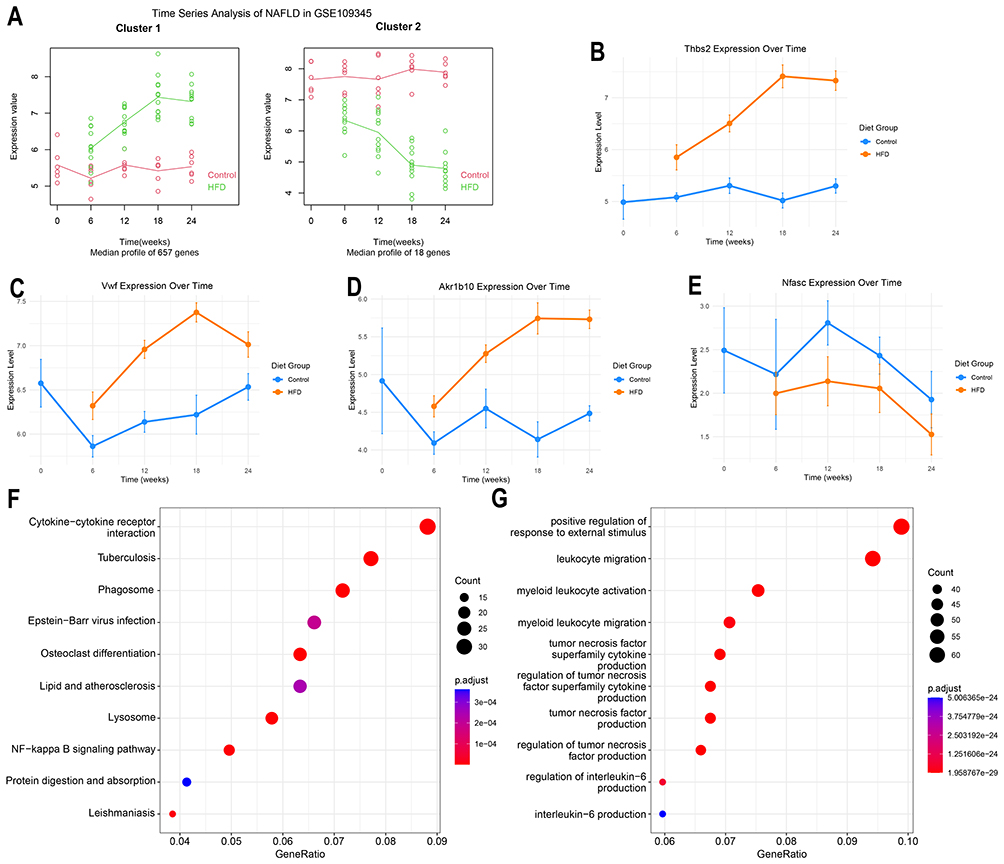 |
Figure 5 Time series analysis in high-fat diet-induced NAFLD mouse model. (A) Time series analysis of liver transcriptomic sequencing data from mice fed a high-fat diet for 0, 6, 12, 18, and 24 weeks.(B-E) Expression differences of THBS2, VWF, AKR1B10, and NFASC in liver tissues of mice fed a high-fat diet for 0, 6, 12, 18, and 24 weeks.(F) KEGG enrichment analysis of 657 genes in cluster1 showing progressively increased expression with prolonged high-fat diet feeding.(G) GO enrichment analysis of 657 genes in cluster1 showing progressively increased expression with prolonged high-fat diet feeding. |
THBS2 and NFASC Are Enriched in Hepatic Stellate Cells and Upregulated in Patients with Advanced Fibrosis and Cirrhosis
In snRNA-seq data from NAFLD patients, NFASC was found to be predominantly enriched in hepatic stellate cells (HSCs) and upregulated (Figure 6A–C). Acute-phase inflammatory response proteins such as SAA1 and SAA2 were also markedly increased in hepatocytes, endothelial cells, HSCs, and macrophages, suggesting a critical role of inflammatory infiltration in fibrosis progression (Figure 6B, Supplementary Figure 3A and B). Intercellular communication analysis revealed significantly enhanced interactions between HSCs, macrophages, and other cell types (Figure 6D). Our findings demonstrated that PTPRM signaling pathway was significantly upregulated in advanced fibrosis and was broadly activated across multiple cell types, with particularly pronounced increases in macrophages and HSCs (Figure 6E and F, Supplementary Figure 3C). Further SCENIC analysis systematically elucidated the transcription factor regulatory networks in different cell populations during advanced fibrosis (Figure 6G). The results indicated that in macrophages, the STAT5A, NR1H3, and STAT6 regulons were the top three most specific transcriptional regulators. In HSCs, the GATA6, MAFK, and JDP2 regulons exhibited the highest specificity. Subsequently, in scRNA-seq data from cirrhosis patients, THBS2 was found to be highly enriched in HSCs and significantly upregulated (Figure 6H and I). Similarly, expression levels of VWF and AKR1B10 were also elevated in the cirrhosis group (Figure 6J and K).
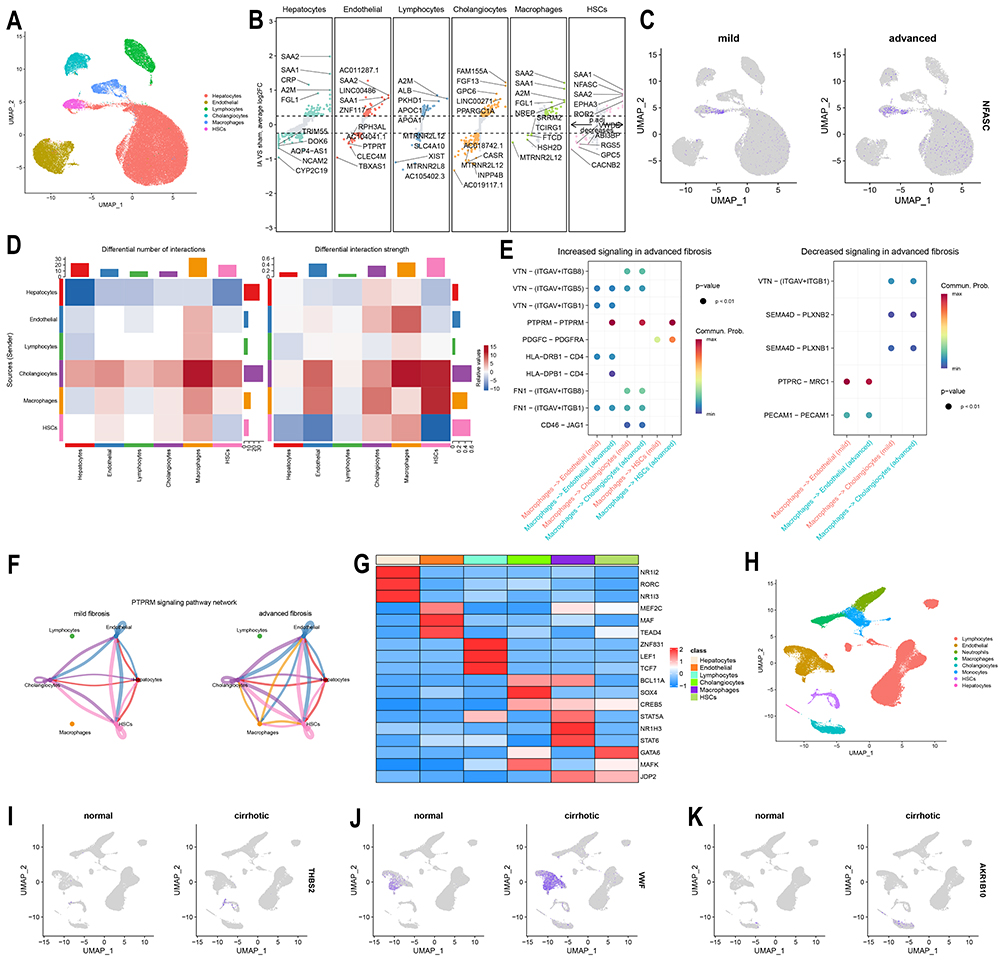 |
Figure 6 Single-cell sequencing analysis of liver tissues from patients with advanced fibrosis and cirrhosis. (A) UMAP projection of six major cell clusters from snRNA-seq data of NAFLD patient livers (GSE202379). (B) Volcano plot showing differentially expressed genes across the six cell clusters in GSE202379. (C) Expression levels of NFASC between advanced fibrosis and mild fibrosis groups in GSE202379. (D) Heatmap of Intercellular communication analysis between advanced fibrosis and mild fibrosis groups in GSE202379.(E) Differential signaling pathways originating from macrophages and targeting endothelial cells, cholangiocytes, and hepatic stellate cells in GSE202379.(F) Circular plot illustrating the PTPRM signaling pathway in GSE202379.(G) Heatmap of SCENIC analysis showing transcription factor regulon activity across the six cell clusters in GSE202379.(H) UMAP projection of eight cell clusters from scRNA-seq data of liver tissues in cirrhosis patients and healthy controls (GSE136103).(I-K) Expression levels of THBS2, VWF, and AKR1B10 between cirrhosis and healthy control groups in GSE136103. |
Proteome-Wide and Genome-Wide Mendelian Randomization Analysis in NAFLD and NASH
This study employed cis-protein quantitative trait loci (cis-pQTLs) and cis-expression quantitative trait loci (cis-eQTLs) as exposure variables, alongside GWAS summary data for NAFLD and NASH as outcomes, to investigate potential causal relationships using MR analysis. The results demonstrated that cis-eQTLs of THBS2 acted as a protective factor for NAFLD, while cis-pQTLs of THBS2 were identified as a risk factor for NASH (Figure 7C–E). In contrast, no clear causal relationships were observed between the other diagnostic biomarkers and NAFLD or NASH (Figure 7A and G). GO enrichment analysis of the 85 proteins causally associated with NAFLD revealed significant enrichment in processes related to lipid metabolism and extracellular matrix organization (Figure 7B). Meanwhile, KEGG enrichment analysis of the 75 proteins with causal relationships to NASH showed enrichment in pathways associated with inflammation and extracellular matrix remodeling (Figure 7F).
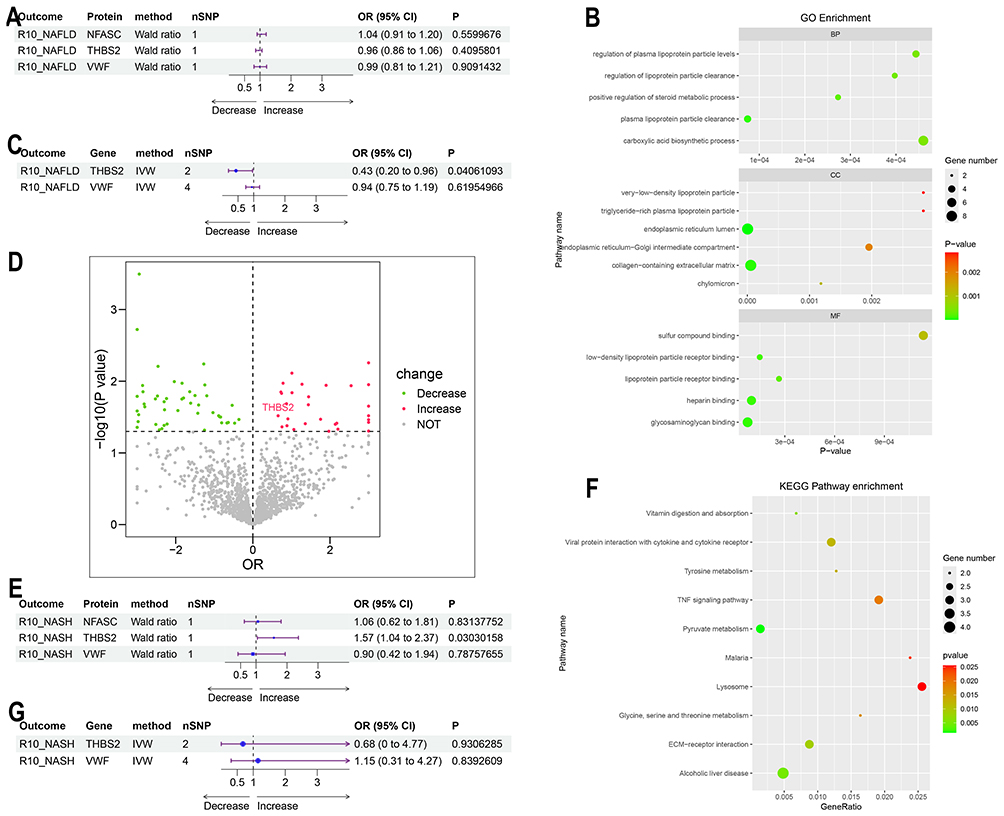 |
Figure 7 Proteome-wide and Genome-wide Mendelian randomization analysis of NAFLD and NASH. (A) Forest plot showing the causal relationships between cis-pQTLs of the diagnostic biomarkers and NAFLD.(B) GO enrichment analysis of proteins corresponding to cis-pQTLs causally associated with NAFLD.(C) Forest plot illustrating the causal relationships between cis-eQTLs of the diagnostic biomarkers and NAFLD.(D) Volcano plot of proteins corresponding to cis-pQTLs causally associated with NASH.(E) Forest plot demonstrating the causal relationships between cis-pQTLs of the diagnostic biomarkers and NASH.(F) KEGG enrichment analysis of proteins corresponding to cis-pQTLs causally associated with NASH. (G) Forest plot depicting the causal relationships between cis-eQTLs of the diagnostic biomarkers and NASH. |
THBS2, VWF, NFASC, and AKR1B10 Serve as Diagnostic Biomarkers for Advanced Fibrosis in NAFLD
In strict accordance with the inclusion and exclusion criteria, this study enrolled 119 NAFLD patients confirmed by liver histopathology, including 36 patients with advanced fibrosis and 83 patients with mild fibrosis. The two groups showed no significant differences in baseline characteristics such as age, gender, diabetes, hypertension, or NAFLD Activity Score (NAS) (Table 1). Patients in the advanced fibrosis group exhibited significantly elevated levels of serological non-invasive liver fibrosis indices (APRI, NFS, FIB-4), BMI, and AST, along with decreased ALB and PLT levels. In comparison to the established non-invasive indices (APRI, NFS, and FIB-4), THBS2 and NFASC demonstrated superior diagnostic accuracy (AUC = 0.867 and 0.834, respectively), while VWF and AKR1B10 exhibited comparable performance (AUC = 0.777 and 0.733, respectively) (Figure 8A and B). Correlation analysis further confirmed that the four biomarkers showed stronger correlations with pathological fibrosis stages (r =0.59–0.69) compared to APRI, NFS, and FIB-4 (r = 0.54–0.55) (Figure 8C). Notably, all four biomarkers were significantly negatively correlated with ALB and PLT (Figure 8E). Random Forest algorithm analysis also indicated that the variable importance rankings of THBS2 and NFASC in diagnosing advanced fibrosis were higher than those of APRI, NFS, and FIB-4, suggesting the superior clinical diagnostic performance (Figure 8D).
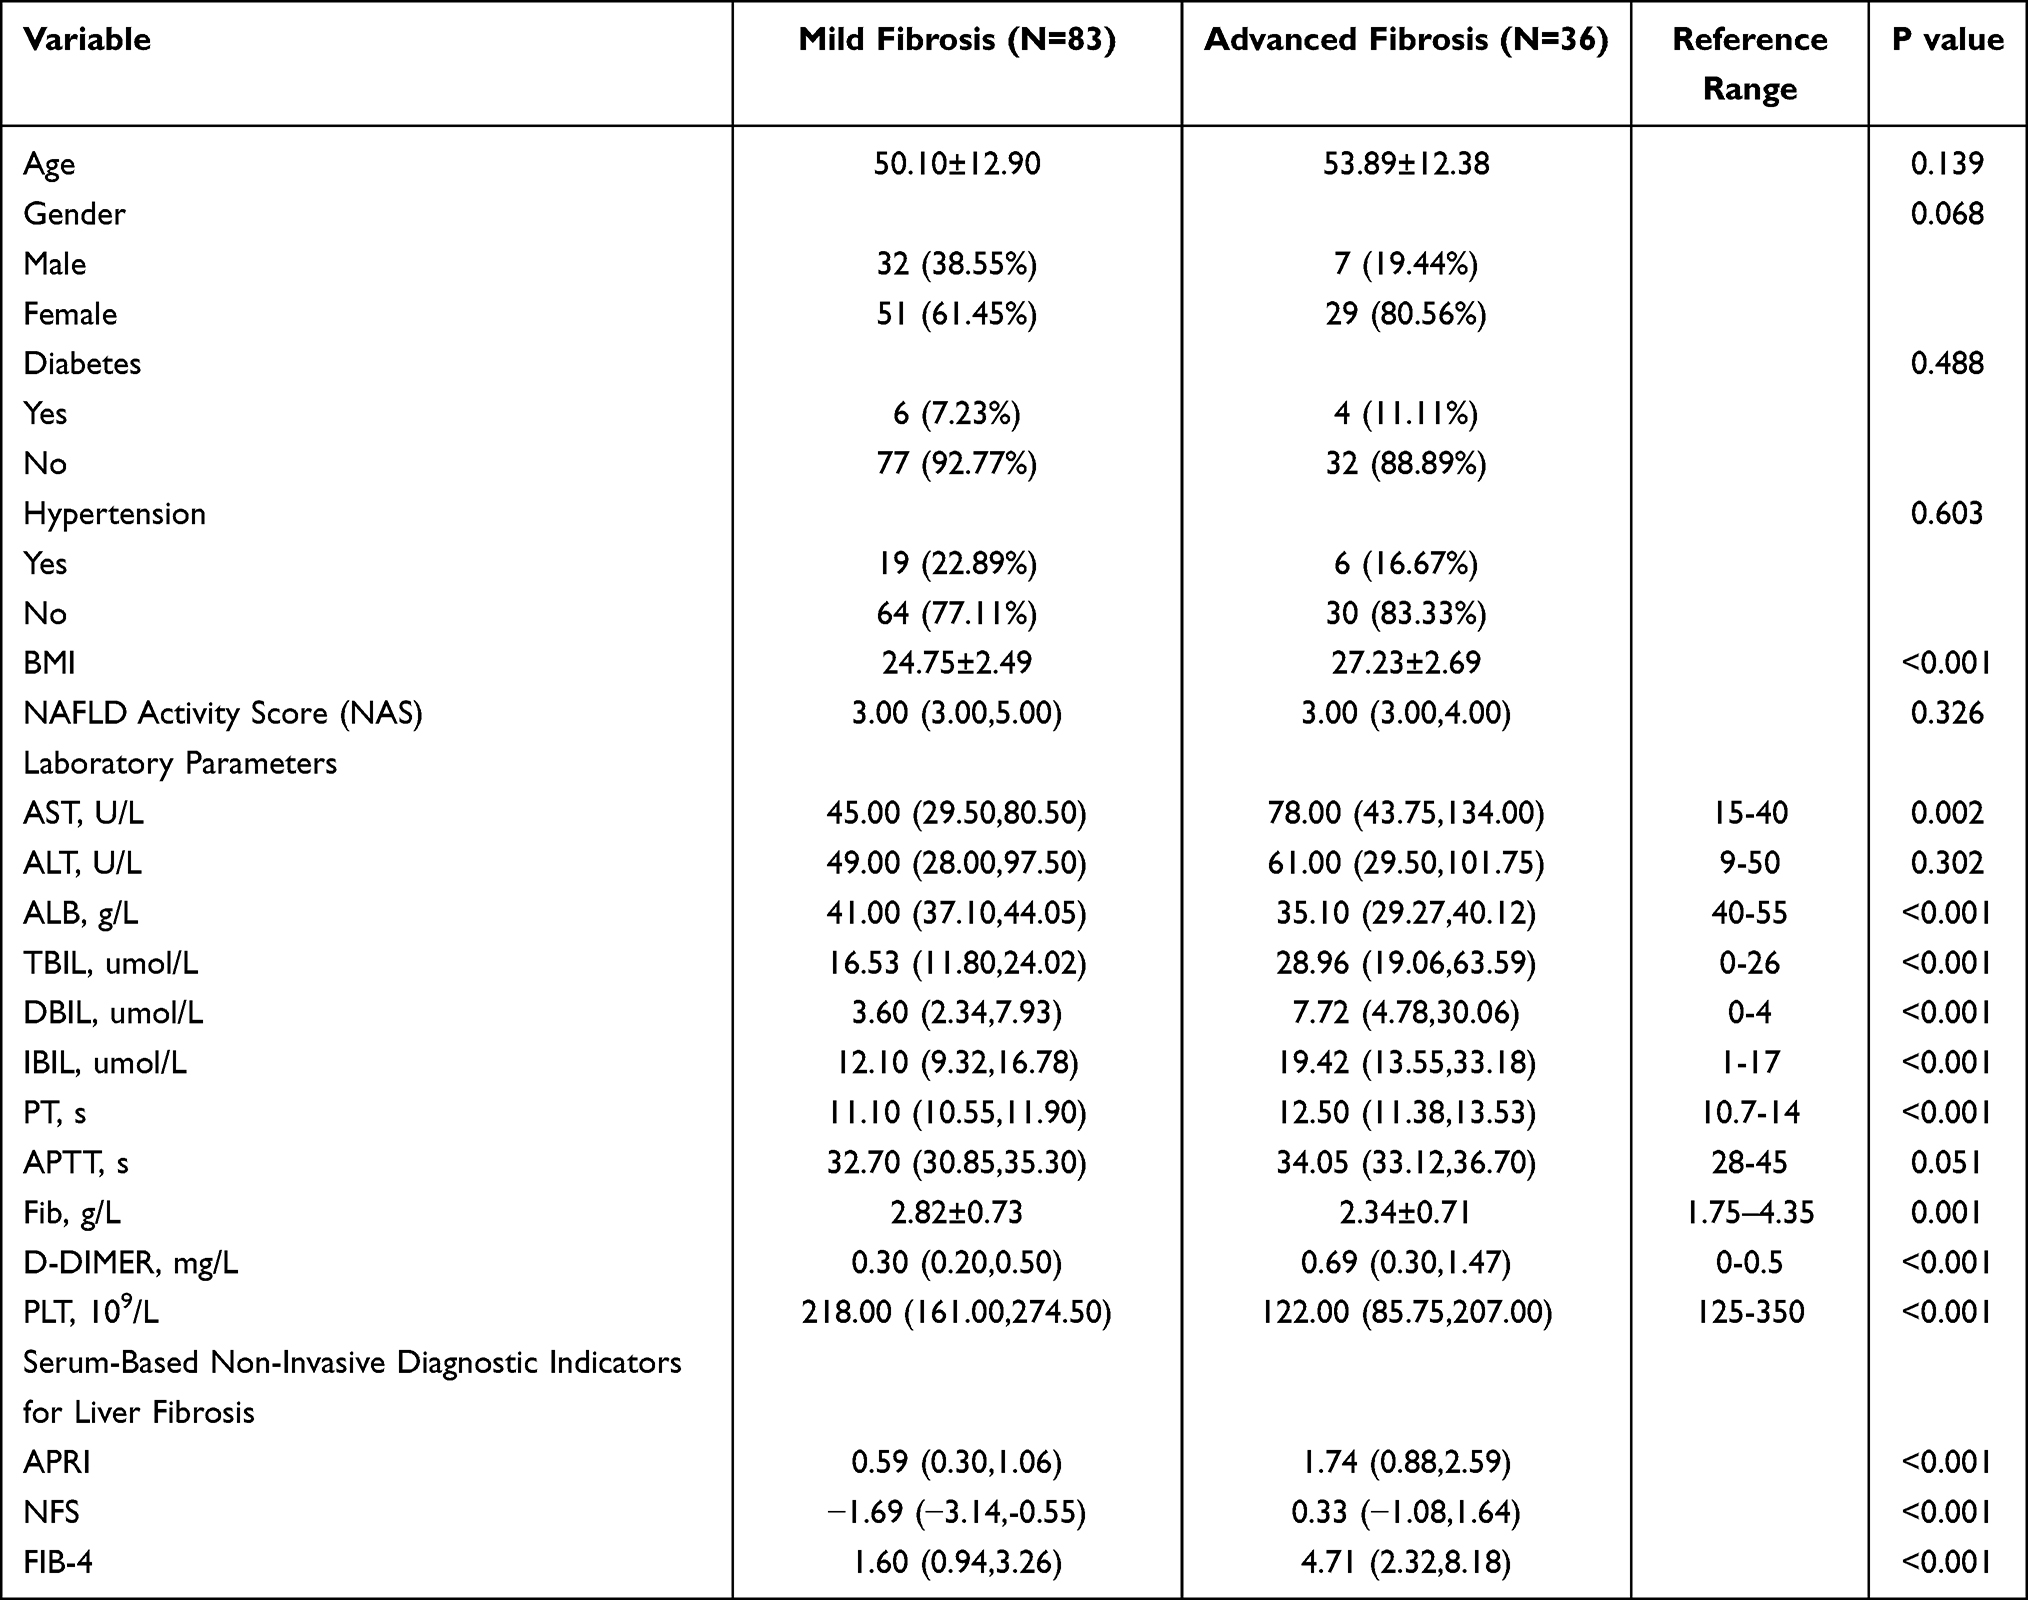 |
Table 1 Baseline Characteristics of the NAFLD Patient Cohort |
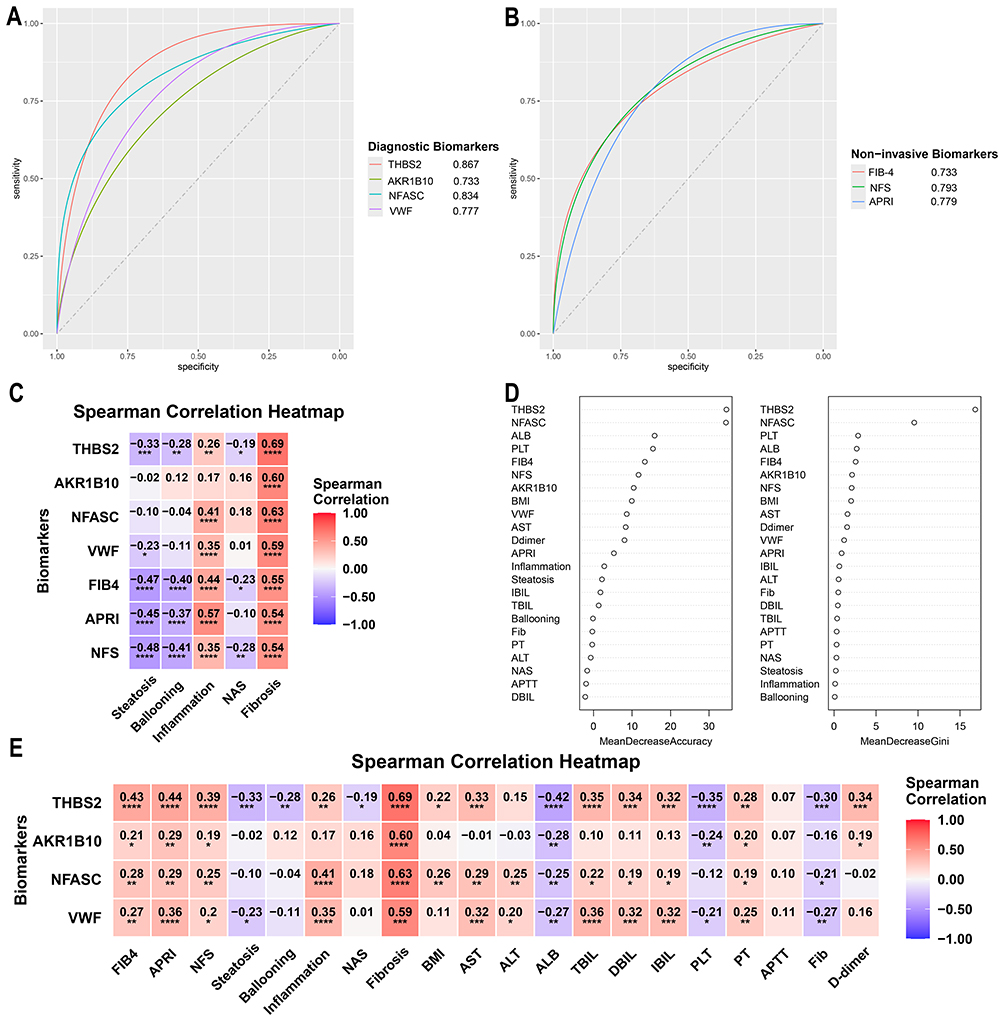 |
Figure 8 Diagnostic value of the four biomarkers THBS2, VWF, NFASC, and AKR1B10 in the NAFLD patient cohort. (A) ROC curves of THBS2, VWF, NFASC, and AKR1B10 in the NAFLD patient cohort. (B) ROC curves of the three serological non-invasive liver fibrosis indices (APRI, NFS, and FIB-4) in the NAFLD patient cohort. (C) Heatmap showing correlations between the four diagnostic biomarkers, three serological non-invasive indices, and liver pathological fibrosis scores. (D) Variable importance ranking derived from the Random Forest algorithm. (E) Heatmap of correlations between THBS2, VWF, NFASC, and AKR1B10 and clinical variables. *P < 0.05, **P < 0.01, ***P < 0.001, ****P < 0.0001. |
Discussion
This study identified THBS2, VWF, NFASC, and AKR1B10 as novel diagnostic biomarkers for advanced fibrosis in NAFLD patients through integrated analysis of liver transcriptomic sequencing and peripheral blood proteomic data. The findings revealed that THBS2 and NFASC are specifically highly expressed in HSCs, with their levels significantly increasing as fibrosis progresses. MR analysis further demonstrated that cis-eQTLs of THBS2 act as a protective factor for NAFLD, whereas cis-pQTLs of THBS2 serve as a risk factor for NASH, suggesting that THBS2 may contribute to the pathogenesis of NAFLD/NASH through differential regulation at the genetic and protein levels. Additionally, pathway analysis and intercellular communication studies indicated that fibrosis and inflammation play critical roles in the pathogenic mechanisms of NAFLD. In the clinical validation cohort, THBS2, VWF, NFASC, and AKR1B10 exhibited robust diagnostic performance (THBS2 AUC =0.867; AKR1B10 AUC = 0.733; NFASC AUC =0.834; VWF AUC =0.777). Compared to APRI, NFS, and FIB-4, their combination improves diagnostic specificity and reduces the risk of missed or misdiagnosis associated with single-marker testing. Moreover, these four biomarkers can be clinically detected using established techniques such as ELISA and chemiluminescence, requiring only 50μL of peripheral blood, making them suitable for large-scale screening.
The baseline characteristics of our study cohort (Table 1) reveal distinct differences between patients with mild fibrosis (F0-F2, N=83) and advanced fibrosis (F3-F4, N=36). The advanced fibrosis group exhibited a significantly higher body mass index (BMI) (27.23±2.69 kg/m2 vs 24.75±2.49 kg/m2, P<0.001), consistent with existing evidence that obesity is a key driver of liver fibrosis progression in NAFLD.31,32 This finding underscores the importance of weight management as a potential intervention strategy for delaying fibrosis advancement. Regarding laboratory parameters, marked abnormalities were observed in the advanced fibrosis group, reflecting impaired liver function. Specifically, the advanced fibrosis group had significantly lower serum albumin (ALB, 35.10 vs. 41.00 g/L, P<0.001) and substantially elevated AST, and total/ direct/indirect bilirubin (all P<0.001), indicating hepatocellular damage and cholestasis. Moreover, platelet count (PLT) was also reduced (both P<0.001), indicating splenic hyperfunction, which was typical characteristic of advanced liver fibrosis (or cirrhosis).3 Consistent with the above findings, serological non-invasive liver fibrosis indices (APRI, NFS, FIB-4) were significantly elevated in the advanced fibrosis group (all P<0.001), confirming their utility in distinguishing mild and advanced fibrosis.4,9,13 Notably, our study not only validates the performance of these established tools but also proposes novel biomarkers (THBS2, AKR1B10, NFASC, VWF) to address the limitations of current diagnostics, especially in ambiguous cases.
THBS2, primarily expressed in activated HSCs, is involved in collagen formation and maintenance of cell adhesion, and has been closely associated with advanced fibrosis and immune cell infiltration in NAFLD.15,33,34 It is also strongly linked to obesity-related metabolic syndrome and the development of metabolic-associated fatty liver disease.35 Interestingly, our MR analysis revealed an intriguing stage-specific dichotomy: cis-eQTLs of THBS2 acted as a protective factor against NAFLD, whereas cis-pQTLs were identified as a risk factor for NASH. This apparent contradiction highlights the complex dynamics of liver disease progression. Biologically, early transcriptional upregulation of THBS2 might serve as a compensatory metabolic defense. For instance, as a well-characterized ligand for the CD36 receptor, THBS2 can interact with CD36 to potentially restrict excessive hepatic free fatty acid uptake during initial steatosis.36 Nevertheless, as the disease progresses to advanced fibrosis, the extracellular accumulation of THBS2 protein, as reflected by cis-pQTLs, exerts pathogenic matricellular functions. Mechanistically, extracellular THBS2 activates HSCs in an autocrine manner through the TLR4/FAK/TGF-β pathway, promoting fibrogenic and inflammatory responses. Conversely, inhibition of THBS2 expression in HSCs has been shown to ameliorate liver fibrosis and inflammation.15,33 Consistent with this pathological role, circulating THBS2 is strongly associated with advanced liver disease. In a clinical cohort comprising 820 patients with type 2 diabetes and NAFLD, serum THBS2 levels are identified as a risk factor for advanced fibrosis (OR = 5.13, P < 0.001). After 18 months of follow-up, 8.8% of the cohort progresses to advanced fibrosis, and further analysis confirms that baseline THBS2 levels remain a predictor of incident advanced fibrosis (OR = 2.82, P = 0.005).37 It should be noted, however, that this cohort use vibration-controlled transient elastography (VCTE), rather than liver biopsy, to assess advanced fibrosis. Consistent with our findings, studies in NAFLD patients undergoing liver biopsy have also shown that THBS2 is significantly correlated with hepatocyte degeneration and fibrosis, and can serve as a diagnostic biomarker for advanced fibrosis, with an AUC exceeding 0.8.15,34 Nevertheless, the application of THBS2 in clinical practice has not yet been widely adopted. In this study, by constructing a NAFLD patient cohort confirmed by liver biopsy, we further demonstrated that serum THBS2 levels are significantly positively correlated with the degree of liver fibrosis and could function as a diagnostic biomarker for advanced fibrosis (AUC =0.867), providing a novel potential target for non-invasive risk stratification in NAFLD patients.
VWF, primarily synthesized by megakaryocytes and endothelial cells, plays a crucial role in hemostasis in humans, while also contributing to angiogenesis and wound healing.38 Recent studies have shown that deficiency of VWF ameliorates fibrosis in a long-term carbon tetrachloride-induced mouse model of liver fibrosis, though it does not significantly protect against hepatocyte necrosis.39,40 The underlying mechanism may involve the binding of VWF to tumor necrosis factor receptor superfamily member 11B on the surface of HSCs, leading to HSC activation.41 Elevated VWF levels are significantly associated with the progression of advanced liver disease and hepatic complications, serving as a predictive indicator for hepatic decompensation and mortality.42,43 Furthermore, VWF and its ratio to platelets have been validated as diagnostic biomarkers for advanced fibrosis and cirrhosis in patients with chronic hepatitis C.44 It is noteworthy that the diagnostic value of VWF in advanced fibrosis related to NAFLD remains unclear, and the specific mechanisms through which it promotes fibrosis require further investigation. The potential of VWF as a diagnostic biomarker, as proposed in this study, warrants validation in larger clinical cohorts. Its significant overexpression in endothelial cells of cirrhosis patients also merits deeper exploration to elucidate its role in the progression of fibrosis.
NFASC, an important cell adhesion molecule, generates isoforms such as NF155 through alternative splicing. It is primarily expressed in the central and peripheral nervous systems, where it regulates neuronal development, axonal guidance, and myelination.45,46 Although no direct evidence currently links NFASC to the pathogenesis or fibrosis progression of NAFLD, this study found that NFASC is specifically enriched and significantly upregulated in HSCs of patients with advanced NAFLD fibrosis.47 We hypothesized that NFASC may promote hepatic inflammation and fibrosis by mediating interactions between immune cells and HSCs. Clinical cohort analysis further supported NFASC as a potential diagnostic biomarker for advanced fibrosis (AUC = 0.834). Interestingly, NFASC expression exhibited a decreasing trend in HFD-fed LDLr knockout mice. While these mice predominantly develop NASH with early-to-moderate fibrosis, they fail to fully recapitulate the advanced fibrotic microenvironment that evolves over decades in NAFLD patients. Furthermore, the hepatic immune infiltration, inflammatory signaling responses, and the temporal kinetics of HSCs activation may differ substantially between NAFLD patients with advanced fibrosis and this murine model. During the compressed pathological timeframe in mice, acute metabolic stress may temporarily suppress NFASC expression. Conversely, the chronic and sustained HSCs activation in humans likely drives NFASC upregulation, which acts as a stable mediator of pathological liver remodeling. Consequently, the profound upregulation of NFASC in NAFLD patients with advanced fibrosis likely represents a specific molecular signature of chronic HSCs activation and advanced extracellular matrix stabilization.
AKR1B10 has been implicated in clinical cohort studies utilizing omics technologies, which demonstrate that its peripheral blood concentration is closely associated with NAFLD activity and fibrosis stage. Integrated diagnostic models incorporating AKR1B10 have shown effectiveness in identifying liver fibrosis and high-risk NASH, underscoring its potential value in clinical translation.19,48 However, in our cohort, AKR1B10 demonstrated a moderate diagnostic performance for advanced fibrosis (AUC = 0.733), which was lower than those of the ECM-related proteins THBS2 and NFASC. This disparity may be explained by the biological nature of AKR1B10. It is primarily an upstream metabolic enzyme rather than a direct structural component of the extracellular matrix. It may participate in NAFLD pathogenesis through regulating oxidative stress, endoplasmic reticulum stress, retinoic acid metabolism, and prostaglandin transformation.49,50 Notably, knockout of AKR1B10 has been shown to ameliorate fibrosis, fatty acid and glucose metabolic disorders, and reduce the expression of pro-inflammatory cytokines in NAFLD.51,52 This highlights its role as an active driver of disease progression rather than a passive consequence of advanced fibrosis.
The pathogenesis of NAFLD involves a complex pathophysiological network with multiple contributing factors and processes, centered around a vicious cycle of metabolic injury, inflammatory response, and fibrosis formation that collectively drives disease progression.53 Hepatic macrophages, upon sensing stress and damage signals from stromal cells, activate inflammatory pathways and secrete chemokines to recruit immune cells such as circulating monocytes, while also clearing cellular debris.54 Single-cell sequencing has further revealed a monocyte-derived scar-associated macrophage subpopulation (TREM2⁺CD9⁺) that expands significantly in fibrotic areas alongside endothelial cells (ACKR1⁺PLVAP⁺). These cells promote fibrosis and immune cell infiltration through ligand-receptor interactions.18 Consistent with these findings, our intercellular communication analysis demonstrated that interactions among macrophages, cholangiocytes, and HSCs were markedly enhanced in advanced fibrosis, potentially facilitating fibrotic progression via PTPRM and PDGFR signaling pathways. In chronic liver injury, HSCs play a central role in fibrosis by activating and transdifferentiating into myofibroblasts, further accelerating fibrosis through autocrine mechanisms.18,47,55 SCENIC analysis indicated that the GATA6 regulon was specifically enriched in HSCs. This transcription factor is a key regulator promoting the reversal of activated HSCs (myofibroblast-like phenotype) to a quiescent-like state (inactivated HSCs). Knockout of GATA6 impedes HSC deactivation, leading to sustained overexpression of pro-fibrotic genes such as collagen.56
This study integrated multi-omics data and clinical cohort analyses to comprehensively evaluate the diagnostic performance of THBS2, VWF, NFASC, and AKR1B10. Together, these form a novel biomarker panel for the rapid clinical identification of advanced NAFLD fibrosis. Subsequently, by incorporating single-cell sequencing data, we further elucidated the regulatory roles of HSCs and macrophages in the progression of fibrosis. The study revealed that THBS2 and NFASC were highly expressed in HSCs, with THBS2 having been previously validated by multiple studies to promote HSC activation and serve as a diagnostic marker for both NASH and advanced fibrosis.
Nevertheless, our study has several limitations that warrant acknowledgment. First, this was a single-center retrospective study with a relatively small sample size, which may restrict the generalizability of our findings. However, this single-center design also provided a distinct advantage by ensuring strict uniformity in patient management, biopsy protocols, and sample cryopreservation. Second, the histological staging of NAFLD fibrosis was evaluated by a single highly experienced pathologist. Although this senior pathologist was strictly blinded to the patients’ clinical data to minimize subjective bias, the absence of an independent review by a second pathologist remains a limitation. Third, serum biomarker levels were quantified using a single ELISA kit. While this approach effectively eliminated inter-assay variability across different manufacturers and ensured internal consistency within our cohort, it emphasizes the need for cross-platform validation. Finally, although we lacked comprehensive FibroScan data for a direct comparison with our identified biomarker panel, our reliance on biopsy-confirmed staging ensures the highest diagnostic accuracy for the cohort.
Data Sharing Statement
The data of this study can be obtained from the corresponding author Li Xu upon reasonable request.
Ethics Approval and Informed Consent
The study was approved by Biomedical Research Ethic Committee of Shandong Provincial Hospital (SWYX: NO.2025-535). The requirement for informed consent was waived by the Institutional Review Board of Shandong Provincial Hospital because of the retrospective nature of the study. I confirm that all methods were performed in accordance with the relevant guidelines. All procedures were performed in accordance with the ethical standards laid down in the 1964 Declaration of Helsinki and its later amendments.
Author Contributions
Shan Ding: Writing - original draft, Data curation, Formal analysis, Conceptualization, Methodology, Validation. Yiqing Liu: Writing - original draft, Funding acquisition, Investigation. Zhi Liu: Investigation, Methodology. Fulu Chu: Project administration, Resources, Methodology. Bingru Lu: Data curation, Software. Li Xu: Conceptualization, Writing - review & editing, Supervision. All authors read and approved the final manuscript. All authors have participated in the drafting, revision, or critical review of the article; given final approval of the version to be published; agreed on the journal to which the article has been submitted; and agreed to be accountable for all aspects of the work.
Funding
This work was supported by the Natural Science Foundation of Shandong Province (Grant/Award Number: No. ZR2020MH316, ZR2016HM52).
Disclosure
The authors report no conflicts of interest in this work.
References
1. Younossi ZM. Non-alcoholic fatty liver disease - A global public health perspective. J Hepatol. 2019;70(3):531–20. doi:10.1016/j.jhep.2018.10.033
2. Tilg H, Adolph TE, Dudek M, et al. Non-alcoholic fatty liver disease: the interplay between metabolism, microbes and immunity. Nat Metab. 2021;3(12):1596–1607. doi:10.1038/s42255-021-00501-9
3. Wong VW, Ekstedt M, Wong GL, et al. Changing epidemiology, global trends and implications for outcomes of NAFLD. J Hepatol. 2023;79(3):842–852. doi:10.1016/j.jhep.2023.04.036
4. Reinson T, Buchanan RM, Byrne CD. Noninvasive serum biomarkers for liver fibrosis in NAFLD: current and future. Clin Mol Hepatol. 2023;29(Suppl):S157–s170. doi:10.3350/cmh.2022.0348
5. Fedchuk L, Nascimbeni F, Pais R, et al. Performance and limitations of steatosis biomarkers in patients with nonalcoholic fatty liver disease. Aliment Pharmacol Ther. 2014;40(10):1209–1222.
6. Castera L, Friedrich-Rust M, Loomba R. Noninvasive assessment of liver disease in patients with nonalcoholic fatty liver disease. Gastroenterology. 2019;156(5):1264–1281.e4.
7. Mounika N, Mungase SB, Verma S, et al. Inflammatory protein signatures as predictive disease-specific markers for Non-Alcoholic Steatohepatitis (NASH). Inflammation. 2025;48(1):25–41.
8. Sterling RK, Lissen E, Clumeck N, et al. Development of a simple noninvasive index to predict significant fibrosis in patients with HIV/HCV coinfection. Hepatology. 2006;43(6):1317–1325. doi:10.1002/hep.21178
9. Kim D, Kim WR, Kim HJ, et al. Association between noninvasive fibrosis markers and mortality among adults with nonalcoholic fatty liver disease in the United States. Hepatology. 2013;57(4):1357–1365. doi:10.1002/hep.26156
10. Enomoto H, Bando Y, Nakamura H, et al. Liver fibrosis markers of nonalcoholic steatohepatitis. World J Gastroenterol. 2015;21(24):7427–7435. doi:10.3748/wjg.v21.i24.7427
11. Perakakis N, Stefanakis K, Mantzoros CS. The role of omics in the pathophysiology, diagnosis and treatment of non-alcoholic fatty liver disease. Metabolism. 2020;111:154320. doi:10.1016/j.metabol.2020.154320
12. Angulo P, Hui JM, Marchesini G, et al. The NAFLD fibrosis score: a noninvasive system that identifies liver fibrosis in patients with NAFLD. Hepatology. 2007;45(4):846–854. doi:10.1002/hep.21496
13. Long MT, Gandhi S, Loomba R. Advances in non-invasive biomarkers for the diagnosis and monitoring of non-alcoholic fatty liver disease. Metabolism. 2020;111:154259. doi:10.1016/j.metabol.2020.154259
14. Eddowes PJ, Sasso M, Allison M, et al. Accuracy of fibroscan controlled attenuation parameter and liver stiffness measurement in assessing steatosis and fibrosis in patients with nonalcoholic fatty liver disease. Gastroenterology. 2019;156(6):1717–1730. doi:10.1053/j.gastro.2019.01.042
15. Kozumi K, Kodama T, Murai H, et al. Transcriptomics Identify Thrombospondin-2 as a Biomarker for NASH and Advanced Liver Fibrosis. Hepatology. 2021;74(5):2452–2466. doi:10.1002/hep.31995
16. Corey KE, Pitts R, Lai M, et al. ADAMTSL2 protein and a soluble biomarker signature identify at-risk non-alcoholic steatohepatitis and fibrosis in adults with NAFLD. J Hepatol. 2022;76(1):25–33. doi:10.1016/j.jhep.2021.09.026
17. Chen Y, Du X, Kuppa A, et al. Genome-wide association meta-analysis identifies 17 loci associated with nonalcoholic fatty liver disease. Nat Genet. 2023;55(10):1640–1650. doi:10.1038/s41588-023-01497-6
18. Ramachandran P, Dobie R, Wilson-Kanamori JR, et al. Resolving the fibrotic niche of human liver cirrhosis at single-cell level. Nature. 2019;575(7783):512–518. doi:10.1038/s41586-019-1631-3
19. Govaere O, Hasoon M, Alexander L, et al. A proteo-transcriptomic map of non-alcoholic fatty liver disease signatures. Nat Metab. 2023;5(4):572–578. doi:10.1038/s42255-023-00775-1
20. Gribben C, Galanakis V, Calderwood A, et al. Acquisition of epithelial plasticity in human chronic liver disease. Nature. 2024;630(8015):166–173. doi:10.1038/s41586-024-07465-2
21. Skrivankova VW, Richmond RC, Woolf BAR, et al. Strengthening the reporting of observational studies in epidemiology using mendelian randomisation (STROBE-MR): explanation and elaboration. BMJ. 2021;375:n2233.
22. Skrivankova VW, Richmond RC, Woolf BAR, et al. Strengthening the reporting of observational studies in epidemiology using mendelian randomization: the STROBE-MR statement. JAMA. 2021;326(16):1614–1621. doi:10.1001/jama.2021.18236
23. Pietzner M, Wheeler E, Carrasco-Zanini J, et al. Mapping the proteo-genomic convergence of human diseases. Science. 2021;374(6569):eabj1541. doi:10.1126/science.abj1541
24. Jie H, Wang B, Zhang J, et al. Uncovering SPP1(+) macrophage, neutrophils and their related diagnostic biomarkers in intracranial aneurysm and subarachnoid hemorrhage. J Inflamm Res. 2024;17:8569–8587. doi:10.2147/JIR.S493828
25. Zhao J, Stewart ID, Baird D, et al. Causal effects of maternal circulating amino acids on offspring birthweight: a Mendelian randomisation study. EBioMedicine. 2023;88:104441. doi:10.1016/j.ebiom.2023.104441
26. Zhang Y, Li D, Zhu Z, et al. Evaluating the impact of metformin targets on the risk of osteoarthritis: a mendelian randomization study. Osteoarthritis Cartilage. 2022;30(11):1506–1514. doi:10.1016/j.joca.2022.06.010
27. McPherson S, Armstrong MJ, Cobbold JF, et al. Quality standards for the management of non-alcoholic fatty liver disease (NAFLD): consensus recommendations from the British Association for the Study of the Liver and British Society of Gastroenterology NAFLD Special Interest Group. Lancet Gastroenterol Hepatol. 2022;7(8):755–769. doi:10.1016/S2468-1253(22)00061-9
28. Tacke F, Horn P, Wong VW, et al. EASL-EASD-EASO clinical practice guidelines on the management of metabolic dysfunction-associated steatotic liver disease (MASLD). J Hepatol. 2024;81(3):492–542. doi:10.1016/j.jhep.2024.04.031
29. Sanyal AJ, Shankar SS, Yates KP, et al. Diagnostic performance of circulating biomarkers for non-alcoholic steatohepatitis. Nat Med. 2023;29(10):2656–2664. doi:10.1038/s41591-023-02539-6
30. Sanyal AJ, Foucquier J, Younossi ZM, et al. Enhanced diagnosis of advanced fibrosis and cirrhosis in individuals with NAFLD using FibroScan-based Agile scores. J Hepatol. 2023;78(2):247–259. doi:10.1016/j.jhep.2022.10.034
31. Peng H, Zhao Z, Gong J, et al. BMI trajectories are associated with NAFLD and advanced fibrosis via aging-inflammation mediation. BMC Public Health. 2025;25(1):147. doi:10.1186/s12889-025-21322-5
32. Abdeldyem SM, Goda T, Khodeir SA, et al. Nonalcoholic fatty liver disease in patients with acute ischemic stroke is associated with more severe stroke and worse outcome. J clin lipidol. 2017;11(4):915–919. doi:10.1016/j.jacl.2017.04.115
33. Zhang N, Wu X, Zhang W, et al. Targeting thrombospondin-2 retards liver fibrosis by inhibiting TLR4-FAK/TGF-β signaling. JHEP Rep. 2024;6(3):101014. doi:10.1016/j.jhepr.2024.101014
34. Kimura T, Tanaka N, Fujimori N, et al. Serum thrombospondin 2 is a novel predictor for the severity in the patients with NAFLD. Liver Int. 2021;41(3):505–514. doi:10.1111/liv.14776
35. Wu X, Cheung CKY, Ye D, et al. Serum thrombospondin-2 levels are closely associated with the severity of metabolic syndrome and metabolic associated fatty liver disease. J Clin Endocrinol Metab. 2022;107(8):e3230–e3240. doi:10.1210/clinem/dgac292
36. Adams JC, Lawler J. The thrombospondins. Cold Spring Harbor Perspect. Biol. 2011;3(10):a009712. doi:10.1101/cshperspect.a009712
37. Lee CH, Seto WK, Lui DT, et al. Circulating thrombospondin-2 as a novel fibrosis biomarker of nonalcoholic fatty liver disease in type 2 diabetes. Diabetes Care. 2021;44(9):2089–2097. doi:10.2337/dc21-0131
38. Groeneveld DJ, Poole LG, Luyendyk JP. Targeting von Willebrand factor in liver diseases: a novel therapeutic strategy? J Thromb Haemost. 2021;19(6):1390–1408. doi:10.1111/jth.15312
39. Joshi N, Kopec AK, Ray JL, et al. Von Willebrand factor deficiency reduces liver fibrosis in mice. Toxicol Appl Pharmacol. 2017;328:54–59. doi:10.1016/j.taap.2017.05.018
40. Yang M, Wang C, Li S, et al. Annexin A2 promotes liver fibrosis by mediating von Willebrand factor secretion. Dig Liver Dis. 2017;49(7):780–788. doi:10.1016/j.dld.2017.02.013
41. Wang ZY, Keogh A, Waldt A, et al. Single-cell and bulk transcriptomics of the liver reveals potential targets of NASH with fibrosis. Sci Rep. 2021;11(1):19396. doi:10.1038/s41598-021-98806-y
42. Prasanna KS, Goel A, Amirtharaj GJ, et al. Plasma von Willebrand factor levels predict in-hospital survival in patients with acute-on-chronic liver failure. Indian J Gastroenterol. 2016;35(6):432–440. doi:10.1007/s12664-016-0708-2
43. van den Boom BP, Stamouli M, Timon J, et al. Von Willebrand factor is an independent predictor of short-term mortality in acutely ill patients with cirrhosis. Liver Int. 2023;43(12):2752–2761.
44. Maieron A, Salzl P, Peck-Radosavljevic M, et al. Von Willebrand Factor as a new marker for non-invasive assessment of liver fibrosis and cirrhosis in patients with chronic hepatitis C. Aliment Pharmacol Ther. 2014;39(3):331–338. doi:10.1111/apt.12564
45. Humphrey J, Venkatesh S, Hasan R, et al. Integrative transcriptomic analysis of the amyotrophic lateral sclerosis spinal cord implicates glial activation and suggests new risk genes. Nat Neurosci. 2023;26(1):150–162.
46. Kira JI, Yamasaki R, Ogata H. Anti-neurofascin autoantibody and demyelination. Neurochem Int. 2019;130:104360. doi:10.1016/j.neuint.2018.12.011
47. Wang S, Li K, Pickholz E, et al. An autocrine signaling circuit in hepatic stellate cells underlies advanced fibrosis in nonalcoholic steatohepatitis. Sci Transl Med. 2023;15(677):eadd3949. doi:10.1126/scitranslmed.add3949
48. Govaere O, Cockell S, Tiniakos D, et al. Transcriptomic profiling across the nonalcoholic fatty liver disease spectrum reveals gene signatures for steatohepatitis and fibrosis. Sci Transl Med. 2020;12:572. doi:10.1126/scitranslmed.aba4448
49. Park A, Choi SJ, Park S, et al. Plasma Aldo-Keto Reductase Family 1 Member B10 as a biomarker performs well in the diagnosis of nonalcoholic steatohepatitis and fibrosis. Int J Mol Sci. 2022;23(9):5035.
50. Endo S, Matsunaga T, Nishinaka T. The role of AKR1B10 in physiology and pathophysiology. Metabolites. 2021;11:6. doi:10.3390/metabo11060332
51. Yang S, Cao SJ, Li CY, et al. Berberine directly targets AKR1B10 protein to modulate lipid and glucose metabolism disorders in NAFLD. J Ethnopharmacol. 2024;332:118354.
52. Rajak S, Gupta P, Anjum B, et al. Role of AKR1B10 and AKR1B8 in the pathogenesis of non-alcoholic steatohepatitis (NASH) in mouse. Biochim Biophys Acta Mol Basis Dis. 2022;1868(4):166319.
53. Tacke F, Puengel T, Loomba R, et al. An integrated view of anti-inflammatory and antifibrotic targets for the treatment of NASH. J Hepatol. 2023;79(2):552–566. doi:10.1016/j.jhep.2023.03.038
54. Krenkel O, Tacke F. Liver macrophages in tissue homeostasis and disease. Nat Rev Immunol. 2017;17(5):306–321. doi:10.1038/nri.2017.11
55. Schwabe RF, Tabas I, Pajvani UB. Mechanisms of fibrosis development in nonalcoholic steatohepatitis. Gastroenterology. 2020;158(7):1913–1928.
56. Liu X, Xu J, Rosenthal S, et al. Identification of lineage-specific transcription factors that prevent activation of hepatic stellate cells and promote fibrosis resolution. Gastroenterology. 2020;158(6):1728–1744.e14. doi:10.1053/j.gastro.2020.01.027
 © 2026 The Author(s). This work is published and licensed by Dove Medical Press Limited. The
full terms of this license are available at https://www.dovepress.com/terms
and incorporate the Creative Commons Attribution
- Non Commercial (unported, 4.0) License.
By accessing the work you hereby accept the Terms. Non-commercial uses of the work are permitted
without any further permission from Dove Medical Press Limited, provided the work is properly
attributed. For permission for commercial use of this work, please see paragraphs 4.2 and 5 of our Terms.
© 2026 The Author(s). This work is published and licensed by Dove Medical Press Limited. The
full terms of this license are available at https://www.dovepress.com/terms
and incorporate the Creative Commons Attribution
- Non Commercial (unported, 4.0) License.
By accessing the work you hereby accept the Terms. Non-commercial uses of the work are permitted
without any further permission from Dove Medical Press Limited, provided the work is properly
attributed. For permission for commercial use of this work, please see paragraphs 4.2 and 5 of our Terms.