Back to Journals » Journal of Pain Research » Volume 15
Transcriptomic Analysis of Trigeminal Ganglion and Spinal Trigeminal Nucleus Caudalis in Mice with Inflammatory Temporomandibular Joint Pain
Authors Dong T, Si H ![]() , Li Z, Bai Q
, Li Z, Bai Q ![]() , Tao F
, Tao F ![]()
Received 3 March 2022
Accepted for publication 17 May 2022
Published 23 May 2022 Volume 2022:15 Pages 1487—1502
DOI https://doi.org/10.2147/JPR.S364887
Checked for plagiarism Yes
Review by Single anonymous peer review
Peer reviewer comments 2
Editor who approved publication: Dr Qi Fang
Tieli Dong,1,* Haichao Si,1,2,* Zhisong Li,1 Qian Bai,1 Feng Tao3
1Department of Anesthesiology, The Second Affiliated Hospital of Zhengzhou University, Zhengzhou, People’s Republic of China; 2Department of Anesthesiology, Nanyang Central Hospital, Nanyang, People’s Republic of China; 3Department of Biomedical Sciences, Texas A&M University College of Dentistry, Dallas, TX, USA
*These authors contributed equally to this work
Correspondence: Qian Bai; Feng Tao, Email [email protected]; [email protected]
Background: Persistent facial pain heavily impacts the quality of life in patients with temporomandibular joint (TMJ) disorders. Previous studies have demonstrated that long non-coding ribonucleic acid (lncRNA) is an important regulator of pain. In this study, we aimed to analyze lncRNA expression in the whole transcriptome of trigeminal ganglia (TG) and spinal trigeminal nucleus caudalis (Sp5C) in a chronic inflammatory TMJ pain mouse model.
Methods: Chronic inflammatory TMJ pain was induced by intra-TMJ injection of complete Freund’s adjuvant (CFA). Mouse TG and Sp5C tissues were harvested on day 4 after CFA injection. The lncRNA expression patterns in the whole transcriptome of TG and Sp5C were profiled with RNA sequencing.
Results: We observed that 38 lncRNAs and 849 mRNAs were differentially expressed after CFA treatment. Gene Ontology and Kyoto Encyclopedia of Genes and Genomes analysis further revealed relationships among those differentially expressed lncRNAs and mRNAs and their potential functions. Specific categories of biological process, cellular processes, and molecular function of the differentially expressed transcripts were ascertained.
Conclusion: Our results suggest that lncRNA expression in the whole transcriptome of trigeminal nociceptive system could contribute to the molecular mechanisms that underlie chronic inflammatory TMJ pain.
Keywords: temporomandibular joint pain, lncRNAs, RNA sequencing, trigeminal ganglia, spinal trigeminal nucleus caudalis
Introduction
Temporomandibular joint disorders (TMDs) affect about 10–15% of the total population.1 The recent clinical study has shown that 54–68% of the patients with TMDs experience TMJ pain.2 However, the molecular mechanisms underlying TMJ pain are not fully understood.
In recent years, long non-coding RNAs (lncRNAs) have been studied in different pain models,3–7 but it remains unclear whether lncRNA expression is involved in TMJ pain. It has been reported that lncRNA HOTAIR in chondrocytes contributes to chondrocyte destruction in TMJ osteoarthritis.8 In trigeminal neuropathic pain induced by chronic constriction injury of the infraorbital nerve, lncRNA uc.48+ in the trigeminal system plays an important role in pain transmission.9 Our previous study indicates that altered gene expression (such as tumor necrosis factor-alpha) in the trigeminal ganglia (TG) and spinal trigeminal nucleus caudalis (Sp5C) is critical for chronic inflammatory TMJ pain induced by intra-TMJ injection of complete Freund’s adjuvant (CFA).10 Thus, examining the expression of lncRNAs and relevant mRNAs in trigeminal nociceptive system could advance our understanding of the molecular mechanisms for TMJ pain.
In the present study, we performed RNA sequencing–based lncRNA profiling analysis in TG and Sp5C tissues of mice with CFA-induced chronic inflammatory TMJ pain. We aimed to identify the dysregulated trigeminal lncRNAs and provide new insight into the lncRNA‐mediated regulatory network of TMJ pain. The genes we identified in this study may be targeted to develop a novel gene therapy for such pain in patients with TMDs.
Materials and Methods
Animals
C57BL/6 male mice (18–20 g) from Zhengzhou University Laboratory Animal Center (Zhengzhou, Henan, China) were used. The mice were housed under 12 h light–dark condition with water and food available ad libitum. The mice were randomly assigned to CFA and control groups with equal number in each group. We made all efforts to minimize animal suffering and reduce the number of animals we used in this study. All experiments were approved by the Animal Ethics Committee of Zhengzhou University (Animal Protocol Number: 2021328). We carried out these experiments in accordance with the National Institutes of Health Guide for the Care and Use of Laboratory Animals.
Chronic Inflammatory TMJ Pain Model
We injected CFA (10 μL, 5 mg/mL, Chondrex. Inc.) into the superior joint space of the mouse TMJ bilaterally to induce chronic inflammatory TMJ pain as described in our previous study.10 Saline was used as the vehicle control.
Orofacial Mechanical Hypersensitivity Test
The calibrated von Frey filaments were used to measure orofacial mechanical pain as described previously.10 We placed each mouse in a 10-cm-long plexiglass cylinder and the mouse was allowed to poke out their heads but could not turn around in the cylinder. After 60-min acclimation, we applied the von Frey filaments to the trigeminal nerve V3 branch-innervated facial skin area. A positive stimulation-induced response was defined as a sharp withdrawal of the mouse head. Each filament was applied five times for 1-s stimulation, each at 10-s intervals. We started the test with the lowest force of von Frey filament and continued in ascending order. The head withdrawal threshold was determined as the force at which the positive response was produced in three of five stimuli.
Tissue Harvest and RNA Extraction
The mice were sacrificed under isoflurane anesthesia on day 4 after CFA or saline injection, and whole Sp5C and TG tissues were harvested. We selected day 4 post-CFA because the head withdrawal threshold reached the lowest level, which indicates the strongest TMJ pain at that time point. According to the manufacturer’s instructions, all RNA content was extracted from the TG and Sp5C tissues using a TRIzol RNA Purification Kit (Invitrogen, Carlsbad, Canada). 1% agarose gel was used to check degradation and contamination in RNA. Nano-Photometer® spectrophotometer (Implen, Inc., USA) was utilized to evaluate isolated RNA’s purity. A Qubit® RNA Assay Kit (Life Technologies, USA) was used for RNA concentration measurement, and quality of isolated RNA was checked with Bio-analyzer 2100 system (Agilent Technologies, USA) with an RNA Integrity Number (RIN) at 8.7.
Library Preparation and RNA Sequencing
For each sample, 3 μg of RNA was used as the input material. Initially, Epi-center Ribo-zero™ rRNA Removal Kit was used to isolate rRNA, and ethanol precipitation was performed to obtain rRNA-free residues. Afterward, we used NEBNext® Ultra™ Directional RNA Library Prep-Kit for Illumina® to prepare genomic libraries with depleted rRNA according to the manufacturer’s instructions. NEB-Next First-Strand Synthesis Reaction Buffer (5X) was used for the fragmentation along with divalent cations under elevated temperature range. M-MuLV Reverse Transcriptase, Random hexamer primer, DNA polymerase-I, RNase-H was used to synthesize the first and second cDNA strands. DUTPs replaced all dTTPs in the reaction buffer, and the remaining reads were converted into blunt ends using polymerase/exonuclease proceedings. Adenylation of 3’-ends of DNA reads was carried out, and then NEBNext-Adaptor ligated to hairpin-loop structures was prepared for hybridization procedure. Using AMPure XP system (Beckman Coulter, Beverly, USA), we purified the library of fragments to select 150 to 200 bps reads. Afterward, 3 μL of USER Enzyme was used along with adaptor-ligated, optimized cDNA at a temperature of 37°C for about 15 min, followed by 5 min at 95°C. Phusion High-Fidelity DNA polymerase enzyme, Index (X) primers, and Universal PCR primers were used for PCR reaction. Next, gene products were refined, and the quality of the library was evaluated on Agilent Bio-analyzer 2100 apparatus. Novogene Bioinformatics Technology was used for whole transcriptomic libraries, and deep sequencing was performed. Per the manufacturer’s instructions, index-coded sample clustering was proceeded on cBot Cluster-Generation System utilizing TruSeq PE Cluster Kit v3-cBot-HS (Illumina, USA). After generating cluster, Illumina HiSeq 4000 system was used for sequencing all libraries, and paired-end 150 bp reads were made. We have deposited our sequencing data in Gene Expression Omnibus (GEO) and the GEO accession number is GSE188922.
Quality Control, Reference Genome Mapping, Transcriptome Assembly, and Transcripts Predicted with Coding Potential
Perl in-house scripts were compiled for raw reads data of fastq format. Clean reads were acquired after eliminating lower quality reads, which are adapters and contain ploy-N. After that, Q20 value, Q30 value, and the clean data were evaluated. All downstream analyses were based upon refined data having higher quality. Referred species genomic file (.fna) and genetic model annotation file (.gtf) were retrieved directly by the ftp genome web-server. Bowtie2 version 2.2.8 software was used for the development of referred genome index against target genes, and refined reads having paired-end were assembled against the downloaded reference genome using HISAT2 (version 2.0.4).11 HISAT2 was executed along “RNA-stranded-ness RF” default parameters. Next, these mapped-reads for all samples were aligned using String-Tie tool (version 1.3.1)12 under a referenced dependent method. String-Tie tool utilizes an advanced networking flow algorithm along with an additional de-novo assembly step to align and quantify fuller-length transcripts that represent extra spliced variants for all gene loci. Transcripts were predicted to have coding putative by the following procedures: 1) Coding/Non-Coding-Index (CNCI, version 2)13 with default parameters was used; 2) Coding Putative Calculator (CPC, 0.9-r2),14 NCBI eukaryotes protein database were used with a pre-set e-value of “1e-10” in our analysis; 3) Pfam Scan (version 1.3), default parameters of -E 0.001 –domE 0.00115 were used; 4) Phylogenetic codon substitution frequency (PhyloCSF, version 20121028),16 a multi-species genome sequence alignment set, was built and executed, and genes that do not have the coding potential were chosen as our query cluster of lncRNAs.
Quantification and Analysis of Differential Expression of Genes
Fragments-per-kilo-base of exon-per-million fragments mapped (FPKM) is computed based upon the length of fragments and mapped reads count against each fragment. For the evaluation of FPKM values for lncRNAs along with putative coding genes, a tool Cuffdiff (version: 2.1.1) is utilized for all samples.17 FPKM values for all genes were executed by the collective sum of all FPKM values for all gene group transcripts. All transcripts are referred to as differentially expressed (DE) genes that have an adjusted P value of less than 0.05.
Analyses of Gene Ontology (GO) and Kyoto-Encyclopedia of Genes and Genomes (KEGG)
GO analysis of lncRNA query genes or DE genes was conducted with GO sequencing. The R-based package, which is used for gene length biases, was verified and corrected.18 GO referred to as corrected P value <0.05 was assumed to be potentially enriched from DE genes. KEGG is a database resource that can be used to understand different biological systems and pathways.19 The KOBAS tools were utilized for the statistical enrichment test of lncRNA or DE genes and target genes in KEGG pathways.20
lncRNA Target Gene Prediction
PhyloFit tool was used for the computation of all phylogeny models for conserved or non-conserved reads in different organisms of species. After that, we evaluated a conservative scoring set in coding genes and lncRNAs. Functional annotation of reference mRNAs in cis/trans was used to predict query genes of lncRNAs. We scanned 100 kb upstream and downstream of lncRNA for putative cis mRNAs. Co-expressed mRNA sequences of lncRNAs along Pearson correlation-coefficients under/above 0.95 and above 100 kilo-base in genome distances from the lncRNA and situated upon alternative chromosomes were referred to as genes that are trans-regulated.
Protein–Protein Interaction Network Analysis
Depending upon the screening of mRNAs-lncRNAs gene pairs, a co-expression network was developed, Pearson’s-coefficient of correlation (PCC) greater than 0.95 or P value <0.05. For the prediction of protein/protein interaction (PPI) for DE genes, STRING database was referred. BLASTx (version 2.2.28) was utilized to retrieve query sequences of those genes that were not retrieved by developed networks, and for all chosen referred organisms, networks were built as per known interactions. The Cytoscape tool was utilized for the visualization of PPIs, which is developed by the Institute for Systems Biology (Seattle, Washington, USA).
Statistical Analysis
Data are expressed as the mean ± SEM. Two-way ANOVA with repeated measures was performed for behavioral data analysis. For all comparisons, the statistical significance standard was set at p < 0.05.
Results
Intra-TMJ Injection of CFA Induces Chronic Inflammatory TMJ Pain
We observed that intra-TMJ injection of CFA significantly decreased the head withdrawal threshold in trigeminal nerve V3 branch-innervated facial skin areas compared to the saline group (Figure 1). The CFA-induced TMJ pain started from day 1 post-CFA injection and lasted for at least for 10 days. On day 4 post-CFA injection, the head withdrawal threshold reached the lowest value, indicating the strongest TMJ pain at that time point.
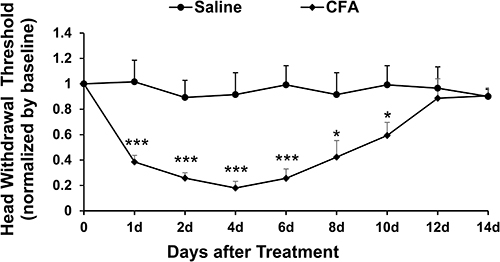 |
Figure 1 Intra-TMJ injection of CFA induces inflammatory TMJ pain in mice. CFA injection significantly decreased the head withdrawal threshold in trigeminal nerve V3 branch-innervated skin areas compared to the saline control group (*p < 0.05, ***p < 0.001 vs the saline control group at corresponding time points). The decreased head withdrawal threshold started from day 1 post-CFA injection and lasted at least for 10 days, and the lowest head withdrawal threshold was shown on day 4 after CFA injection. n = 6 for each group. |
Quality Control and Data Correlations
RNA-seq data quality was examined by analyzing the ratio of clean data to all data (Figure 2A). The ratio of clean reads to all raw reads was more than 95% for all samples, which suggests that the quality of RNA-seq data was high and they can be used for subsequent analysis. We used Pearson correlation coefficient to analyze correlations as calculated in R (Figure 2B). The R2 values in each group were more extensive than 0.90, indicating that the samples’ biological replicates in each group met analysis requirements.
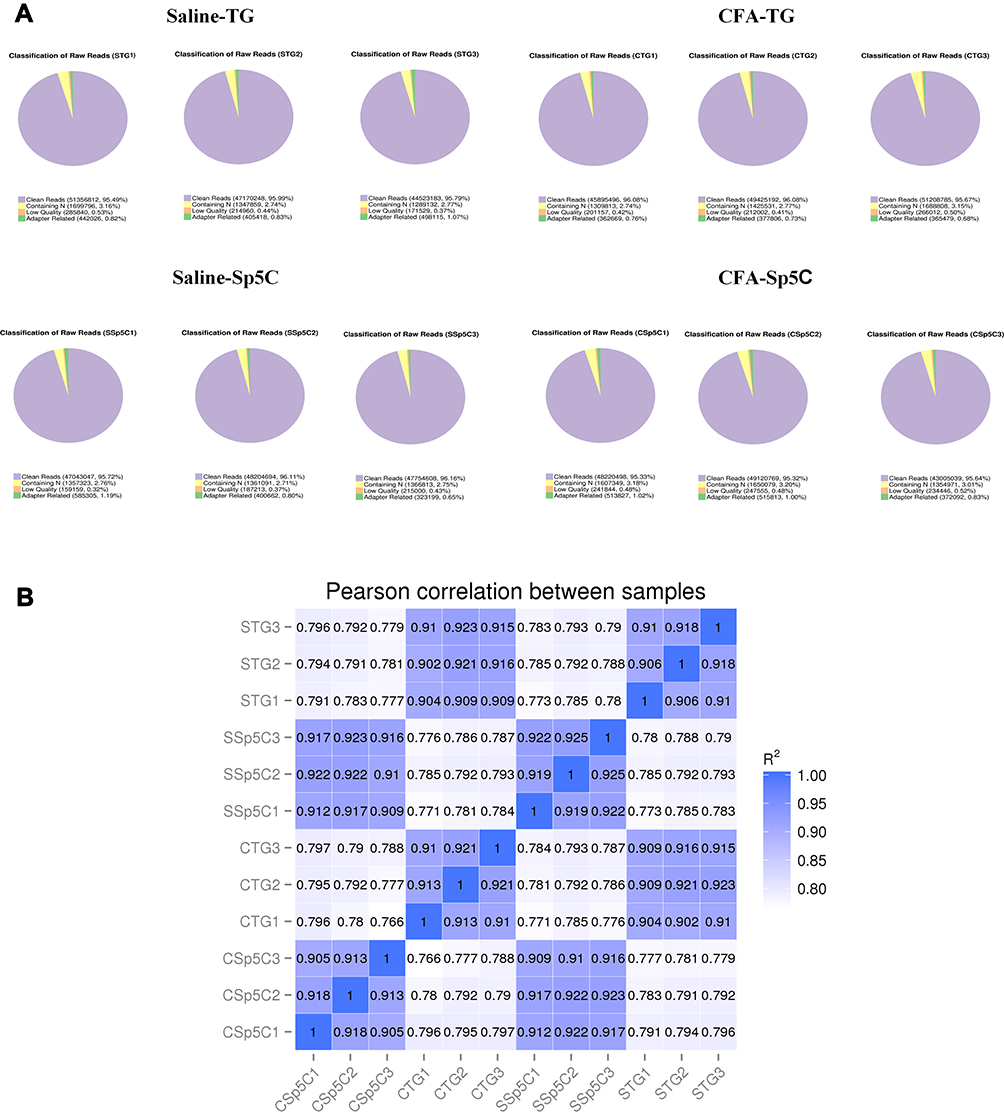 |
Figure 2 General information regarding the quality of and correlations of the data. (A) Clean reads as a percentage of raw reads for each sample. (B) Pearson correlation analysis results. |
DE mRNAs and lncRNAs in TMJ Pain
To identify previously unrecognized molecular features of TMJ pain, high‐throughput RNA‐seq was carried out. TG and Sp5C tissues were harvested from mice on day 4 after intra-TMJ injection of CFA or saline. We extracted and sequenced the total TG and Sp5C RNA from these groups. DE mRNAs and lncRNAs in the comparison between CFA (C) and Saline (S) groups are listed in Table 1. There were 457 DE mRNAs in the TG (229 upregulated and 228 downregulated); There were 392 DE mRNAs in the Sp5C (145 upregulated and 247 downregulated); There were 30 DE lncRNAs in the TG (2 upregulated and 28 downregulated); There were 8 DE lncRNAs in the Sp5C (6 upregulated and 2 downregulated); There were 11 DE transcripts of uncertain coding potential RNAs (TUCP-RNAs) in the TG (5 upregulated and 6 downregulated); There were 7 DE TUCP-RNAs in the Sp5C (5 upregulated and 2 downregulated).
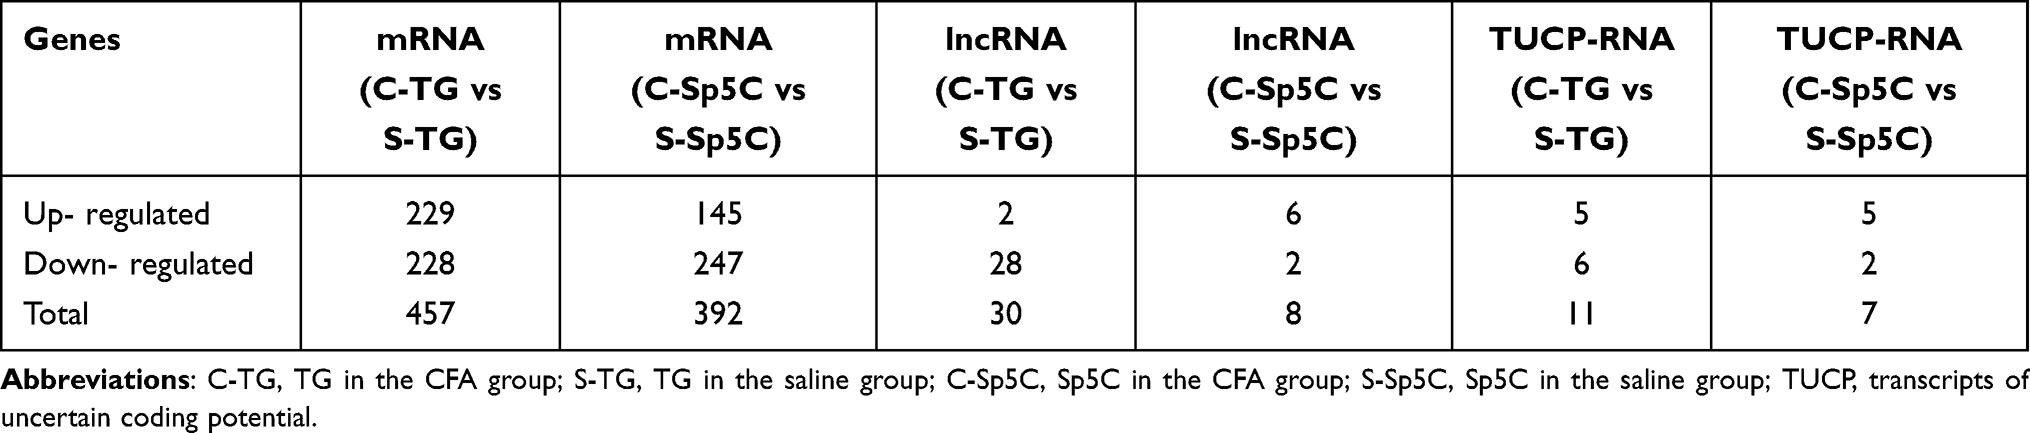 |
Table 1 Differentially Expressed mRNAs and lncRNAs in the TG and Sp5C After TMJ Pain Induction |
DE mRNAs and lncRNAs in each group were also displayed with volcano plots, Venn diagrams, and heat maps. We generated volcano plots to show the DE mRNAs profiles with the statistical significance threshold set at P < 0.05 (Figure 3A and B). To determine the similarity between TG and Sp5C comparisons, Venn diagrams were drawn (Figure 3C–E). A heat map of the DE mRNAs is displayed in Figure 3F. The heat map revealed the variations in DE mRNAs among groups (Figure 3F). Representatives of differentially expressed mRNAs in the TG and Sp5C after TMJ pain induction are shown in Table 2. Similarly, we drew volcano plots to show the DE lncRNAs profiles with the statistical significance threshold set at P < 0.05 (Figure 4A and B). To determine the similarity between TG and Sp5C comparisons, Venn diagrams were drawn (Figure 4C–E). We then screened the candidate lncRNAs. Four tools (CPC, CNCI, PFAM, and PhyloCSF) were used to analyze the coding potential of lncRNAs. The candidate lncRNAs were designated by four analytical tools and used in subsequent analyses (Figure 4F). A heat map showed the variations in DE lncRNAs among groups (Figure 4G). Moreover, the class distribution of DE lncRNAs was assessed, including lncRNA, antisense, and intronic transcripts. Detailed biotypes of these lncRNAs are displayed in Figure 4H, which indicates that most lncRNAs are in the intergenic lncRNA category. Representatives of differentially expressed lncRNAs in the TG and Sp5C after TMJ pain induction are shown in Table 3.
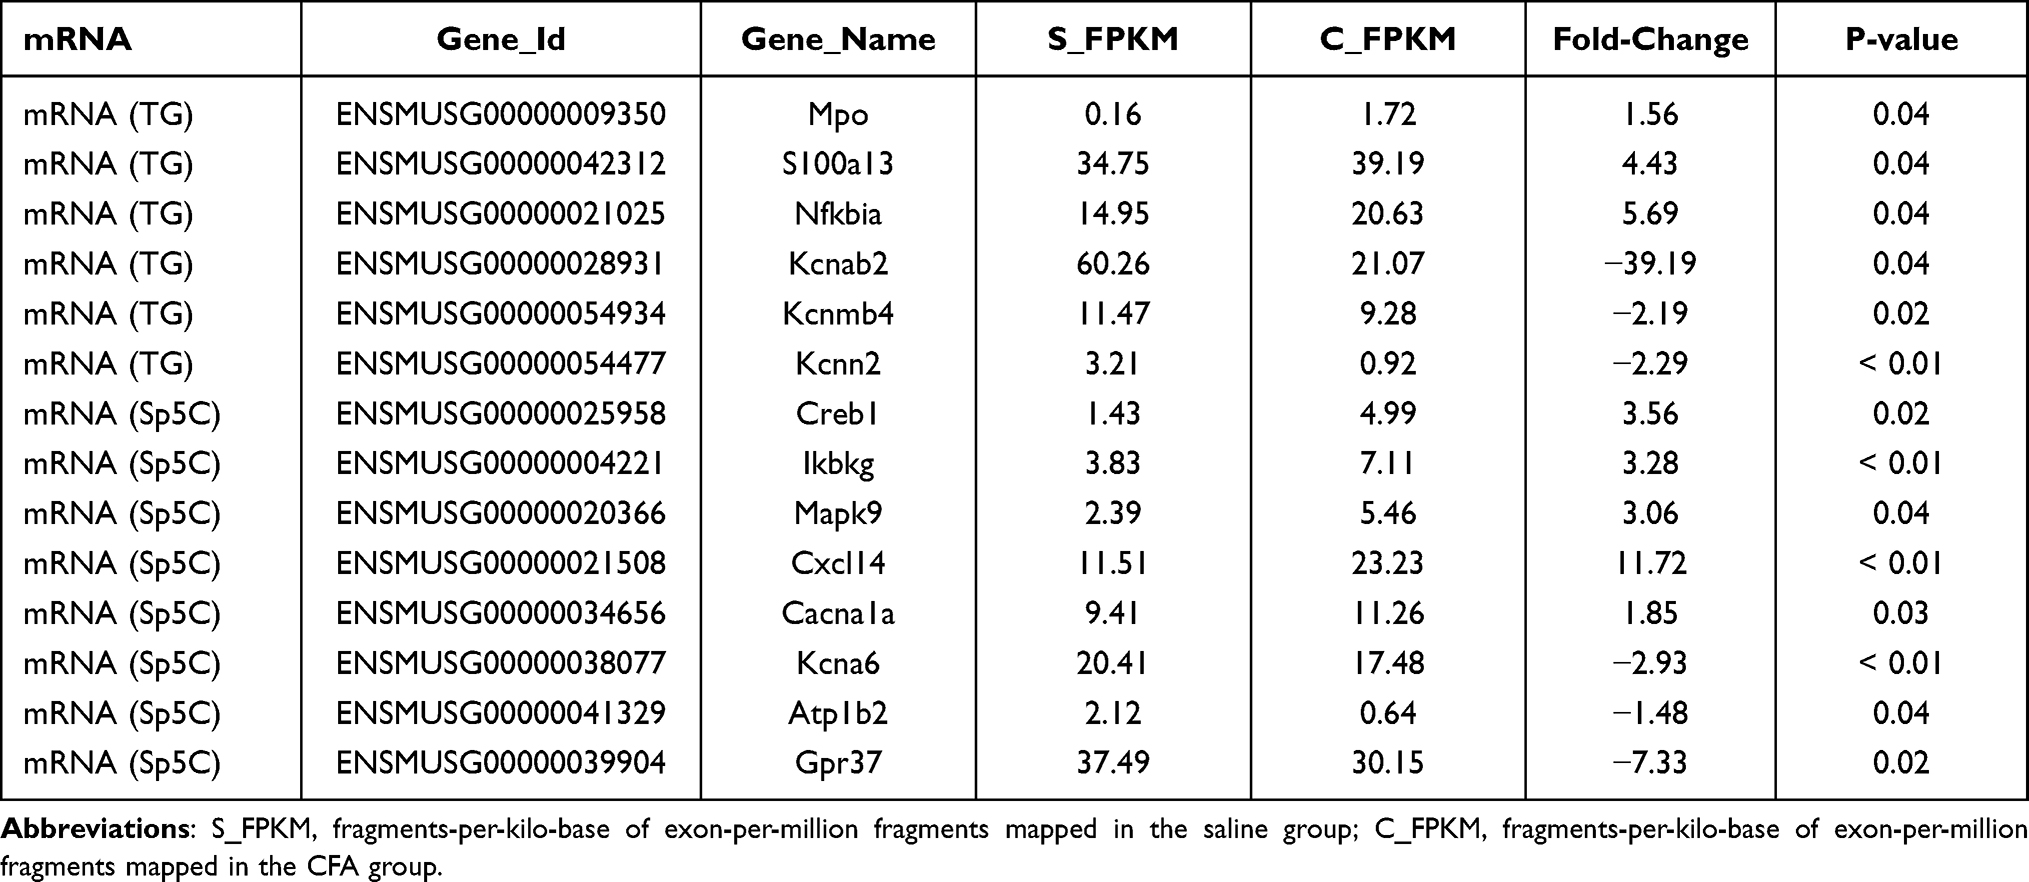 |
Table 2 Representative Differentially Expressed mRNAs in the TG and Sp5C After TMJ Pain Induction |
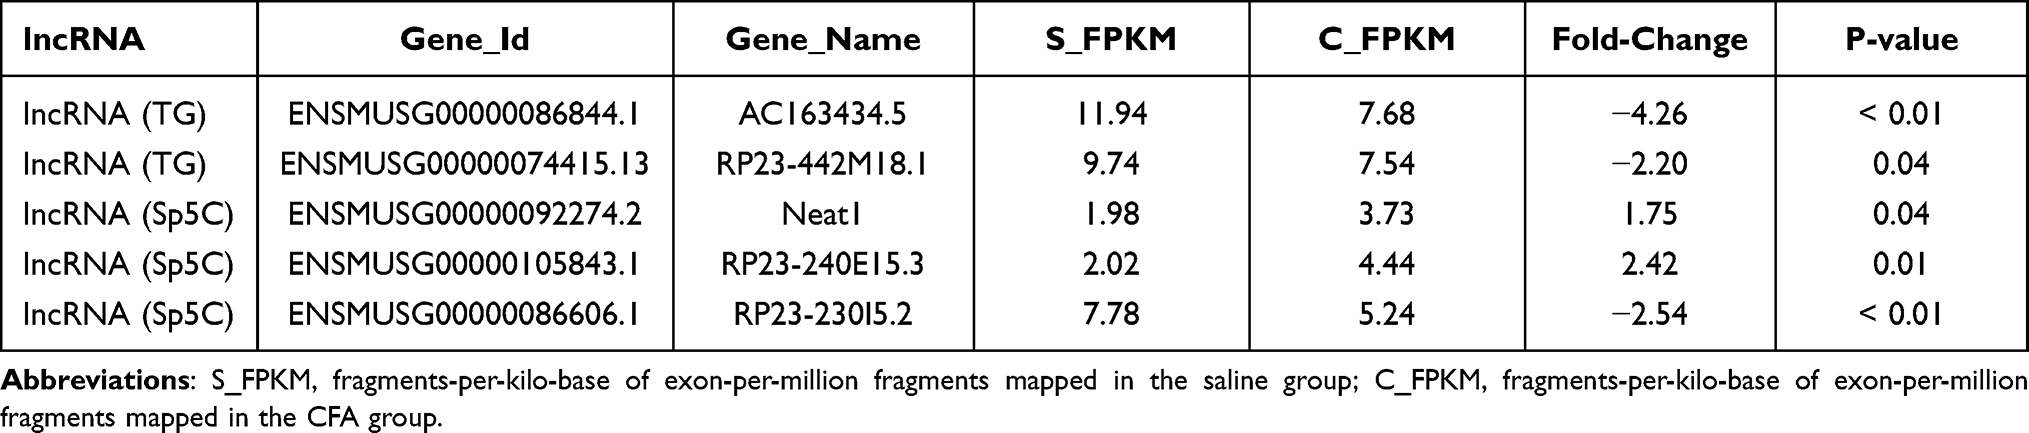 |
Table 3 Representative Differentially Expressed lncRNAs in the TG and Sp5C After TMJ Pain Induction |
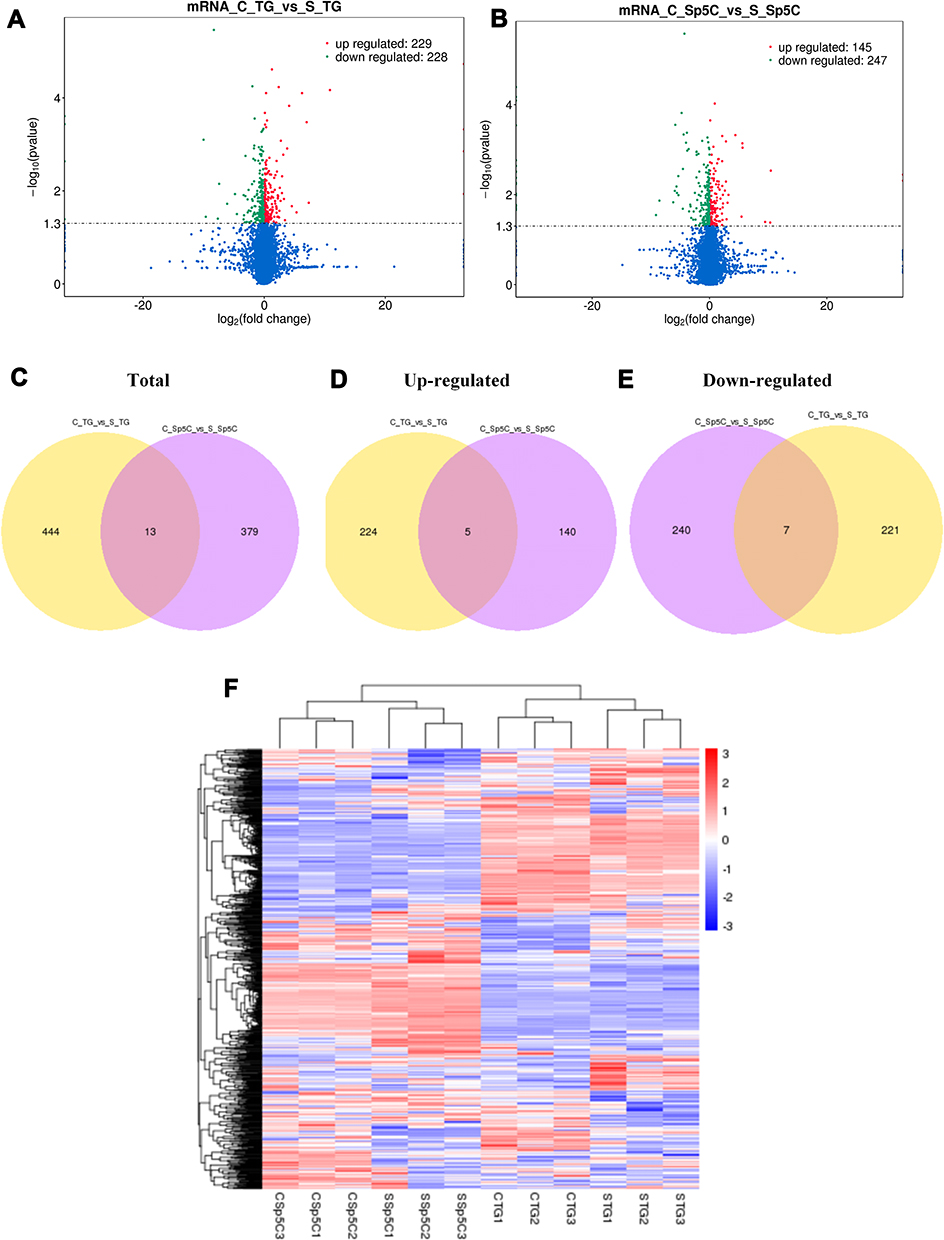 |
Figure 3 Volcano plots, venn diagrams, and heat maps of DE mRNAs. (A and B) Volcano plots illustrating comparisons of DE mRNAs between CFA group and saline control group in the TG and Sp5C. (C−E) Venn diagrams showing overlap of DE mRNAs between CFA group and saline control group in the TG and/or Sp5C: total DE mRNAs; up-regulated DE mRNAs; down-regulated DE mRNAs. (F) Heat map displaying the hierarchical clustering of DE mRNAs in each group (red color indicates up-regulation and blue color indicates down-regulation). C_TG, TG from CFA group; S_TG, TG from saline control group; C_Sp5C, Sp5C from CFA group; S_Sp5C, Sp5C from saline control group. |
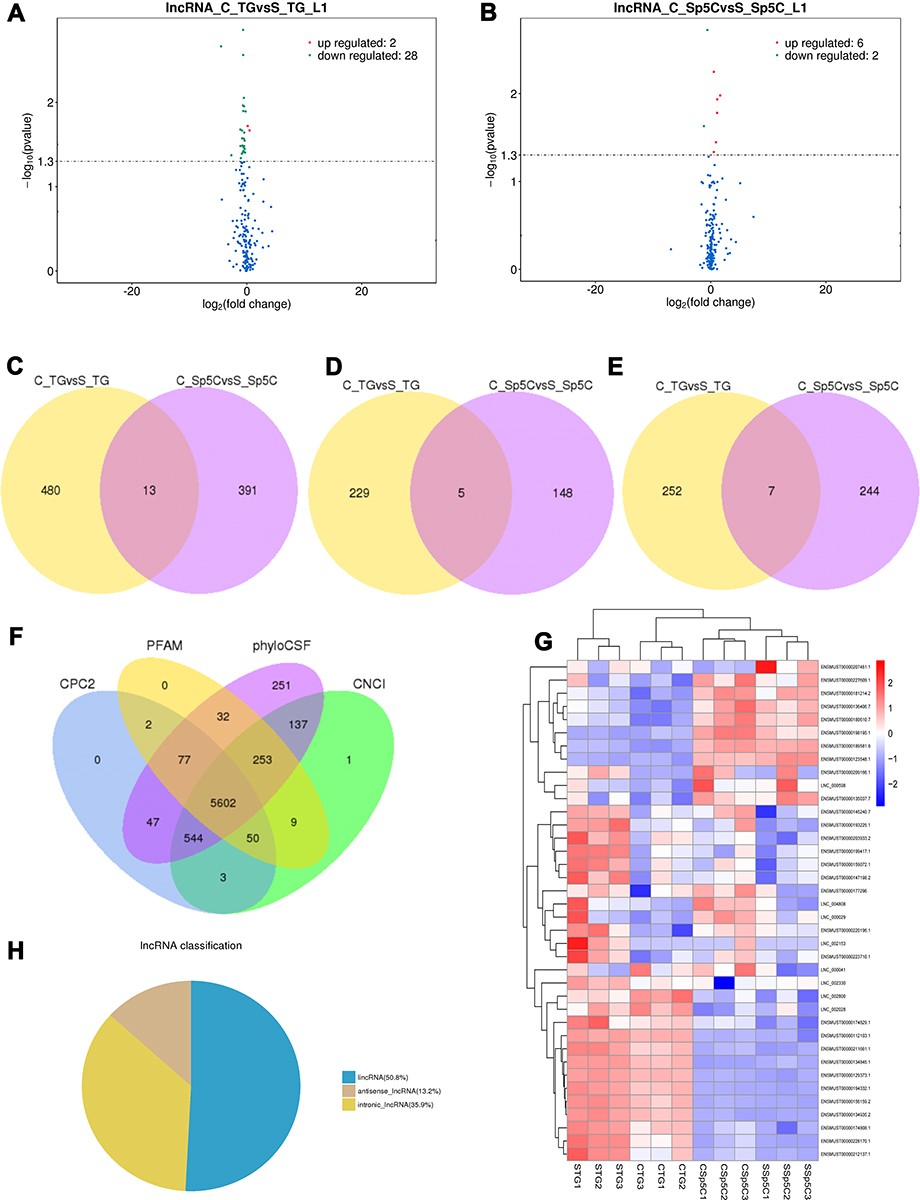 |
Figure 4 Volcano plots, venn diagrams, and heat maps of DE lncRNAs. (A and B) Volcano plots illustrating comparisons of DE lncRNAs between CFA group and saline control group in the TG and Sp5C. (C−E) Venn diagrams showing overlap of DE lncRNAs between CFA group and saline control group in the TG and/or Sp5C: total DE lncRNAs; up-regulated DE lncRNAs; down-regulated DE lncRNAs. (F) Venn diagram showing candidate lncRNAs selected by four tools (CPC, CNCI, PFAM, and phyloCSF) for subsequent analyses. (G) Heat map displaying the hierarchical clustering of DE lncRNAs in each group (red color indicates up-regulation and blue color indicates down-regulation). (H) A pie chart showing three categories of the altered lncRNAs. C_TG, TG from CFA group; S_TG, TG from saline control group; C_Sp5C, Sp5C from CFA group; S_Sp5C, Sp5C from saline control group. |
Genomic Features of lncRNAs
It has been reported that lncRNAs are shorter in length and less conserved than protein-coding transcripts.17 Consistently, our results showed that the predicated lncRNAs tended to contain fewer exons (Figure 5A), and their genes were shorter in length than protein-coding transcripts (Figure 5B). Furthermore, we identified that lncRNAs tended to be shorter in Open Reading Frame (Orf) length than protein-coding genes (Figure 5C). We observed that lncRNAs tended to be expressed at lower levels than mRNAs (Figure 5D). We also observed that the predicted lncRNAs were less conserved than protein-coding transcripts (Figure 5E), which is consistent with a previous report.21
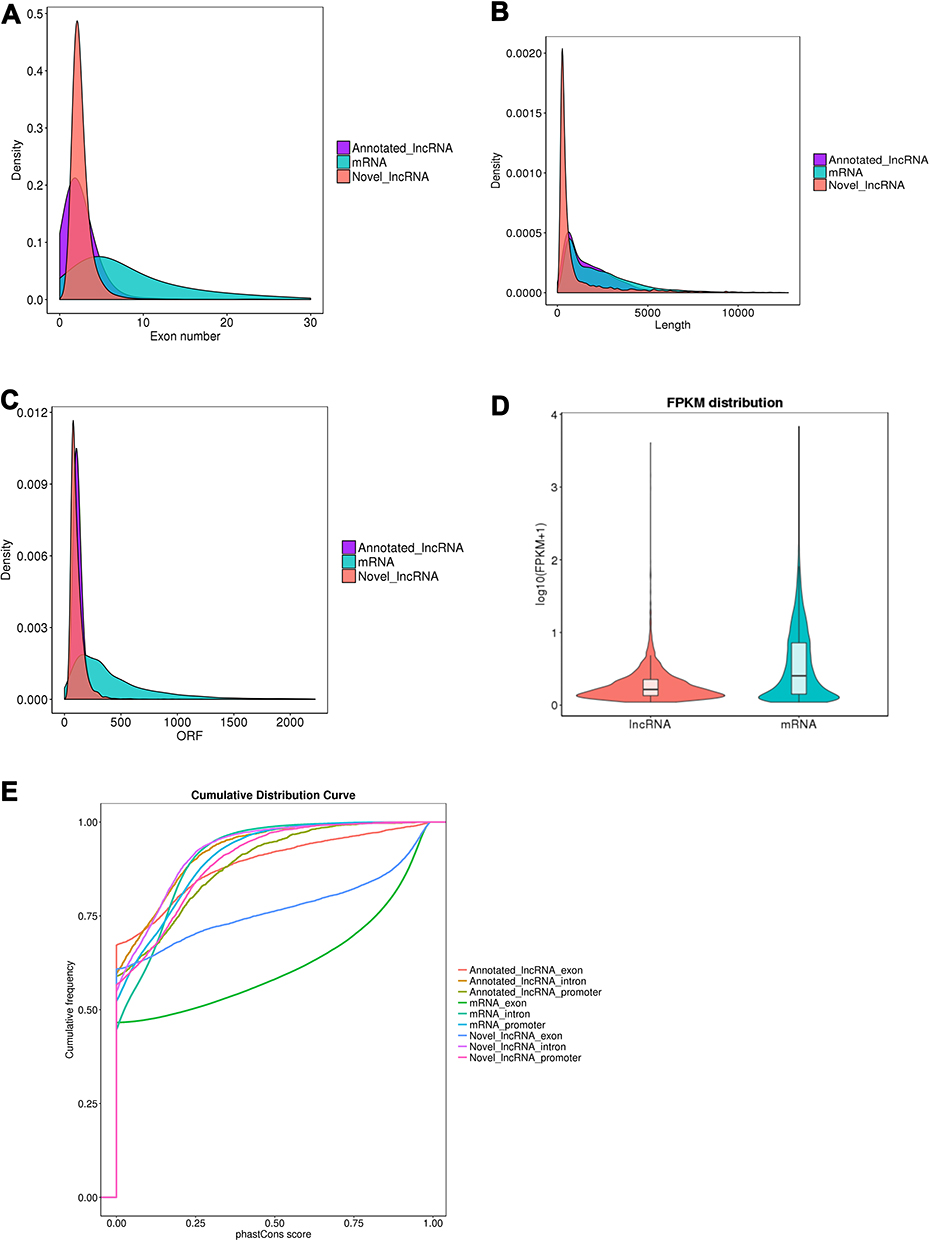 |
Figure 5 Comparison of the identified lncRNAs and mRNAs. (A) Distribution of the number of exons in the identified mRNAs and lncRNAs. (B) Distribution of transcript lengths in the identified mRNAs and lncRNAs. (C) Distribution of number of open reading frame (Orf) in the identified mRNAs and lncRNAs. (D) Expression level analysis in the identified mRNAs and lncRNAs. (E) Conservative analysis of sequences in the identified mRNAs and lncRNAs. |
Functional Analysis of DE mRNAs and lncRNAs
The pathway patterns predicted by KEGG could provide information for future studies on mRNAs’ roles in TMJ pain mechanisms. Using KEGG pathway enrichment analysis of DE mRNAs, we identified top 20 dysregulated pathways in the TG (Figure 6A) and Sp5C (Figure 6B). Moreover, GO analysis of the DE mRNAs was conducted to ascertain specific categories of biological process (BP), cellular processes (CC), and molecular function (MF) of the DE transcripts. For the DE mRNAs in the TG, a histogram displaying the number of genes for each GO term was shown in Figure 6C. For the DE mRNAs in the Sp5C, a histogram displaying the number of genes for each GO term was shown in Figure 6D.
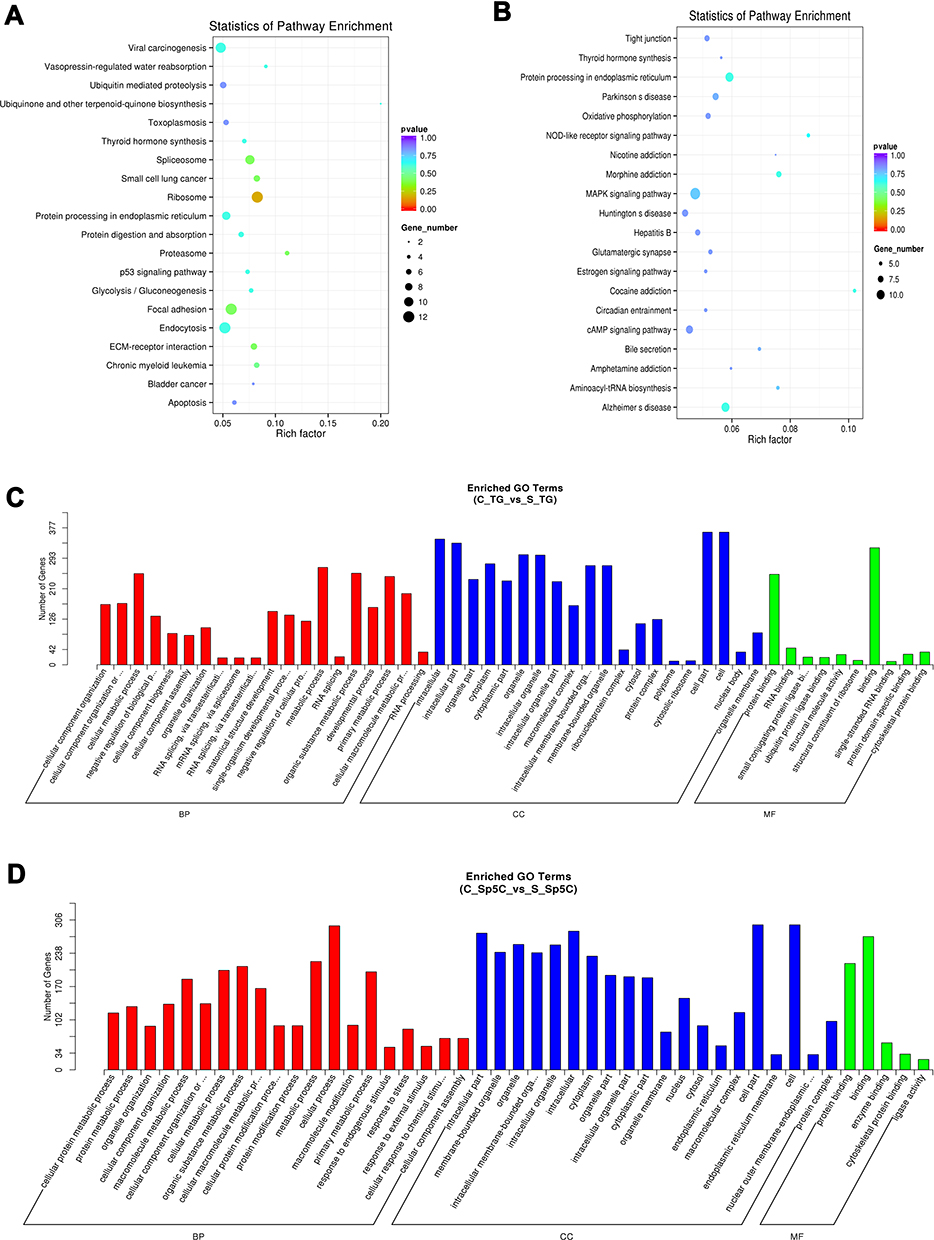 |
Figure 6 KEGG and GO analyses of the DE mRNAs. (A and B) KEGG analysis of the DE mRNAs showing top 20 dysregulated pathways in the TG and Sp5C comparing CFA group with saline control group. (C and D) GO analysis of the DE mRNAs showing the number of genes for each GO term in the TG and Sp5C comparing CFA group with saline control group. C_TG, TG from CFA group; S_TG, TG from saline control group; C_Sp5C, Sp5C from CFA group; S_Sp5C, Sp5C from saline control group. |
To identify potential target genes of the DE lncRNAs, we set a threshold for collocation as 100 kb upstream and 100 kb downstream of each lncRNA. Using the KEGG pathway enrichment analysis of the DE lncRNAs, we revealed top 20 significantly enriched pathways in the TG (Figure 7A) and Sp5C (Figure 7B). Moreover, GO analysis of the DE lncRNAs was conducted to ascertain specific categories of the DE transcripts. For the DE lncRNAs in the TG, a histogram displaying the number of genes for each GO term is shown in Figure 7C. For the DE lncRNAs in the Sp5C, a histogram displaying the number of genes for each GO term is shown in Figure 7D.
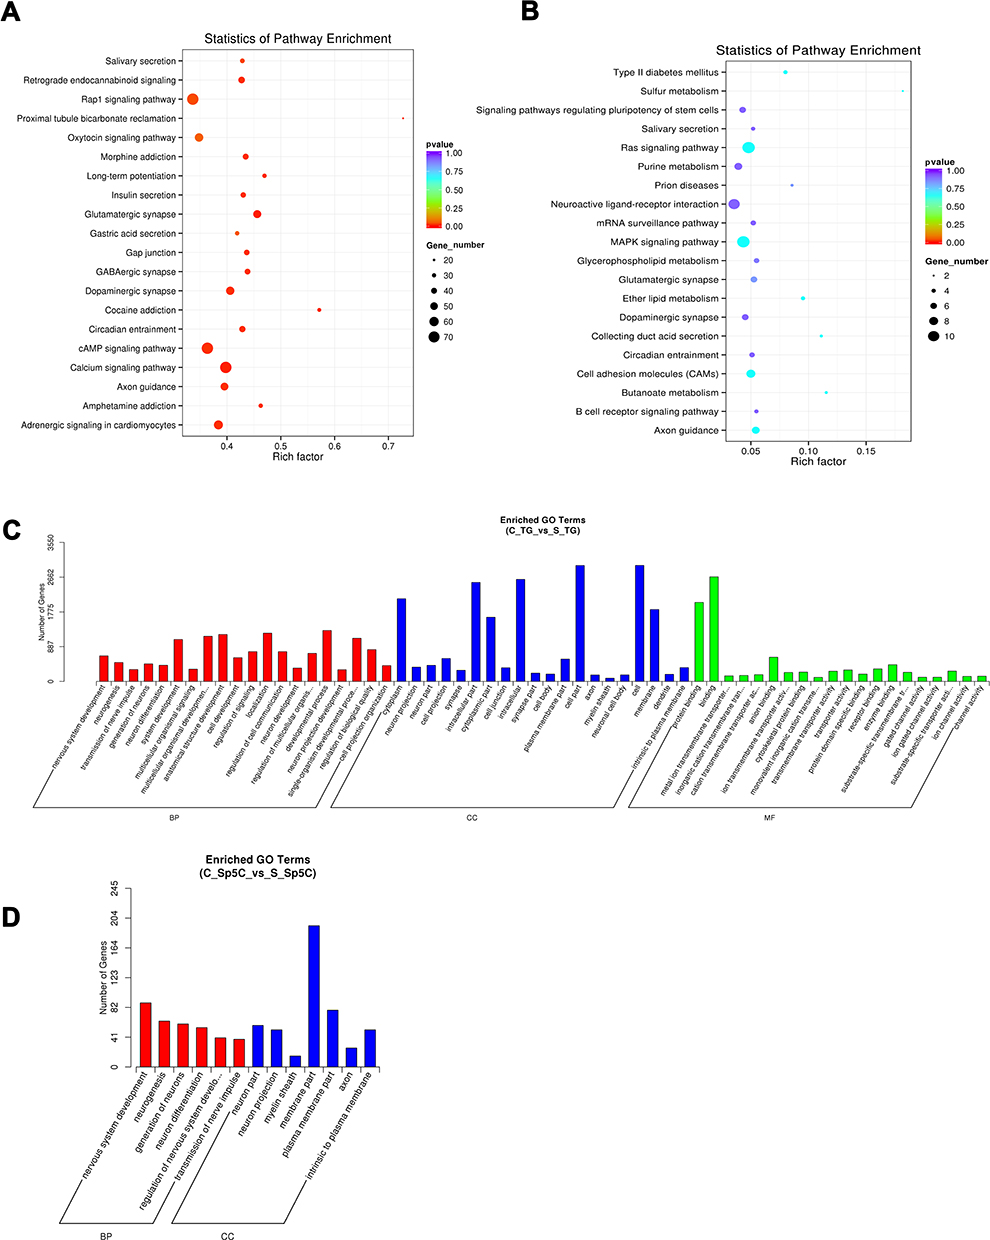 |
Figure 7 KEGG and GO analyses of the DE lncRNAs. (A and B) KEGG analysis of the DE lncRNAs showing top 20 dysregulated pathways in the TG and Sp5C comparing CFA group with saline control group. (C and D) GO analysis of the DE lncRNAs showing the number of genes for each GO term in the TG and Sp5C comparing CFA group with saline control group. C_TG, TG from CFA group; S_TG, TG from saline control group; C_Sp5C, Sp5C from CFA group; S_Sp5C, Sp5C from saline control group. |
Protein–Protein Interaction (PPI) Networks Under TMJ Pain
To explore the lncRNA-mediated molecular mechanisms for TMJ pain, we further conduct PPI network analysis. We identified that the PPI network consisted of 2063 nodes and 4535 edges in the TG (Figure 8A) and the PPI network consisted of 87 nodes and 91 edges in the Sp5C (Figure 8B). Genes were displayed as nodes and PPIs were displayed as edges. The node size is proportional to the degree of the node. Interesting genes were enlarged and labeled with red color. The PPI networks indicated the reliability of our sequencing data and provided a lot of information on downstream targets of the DE lncRNAs.
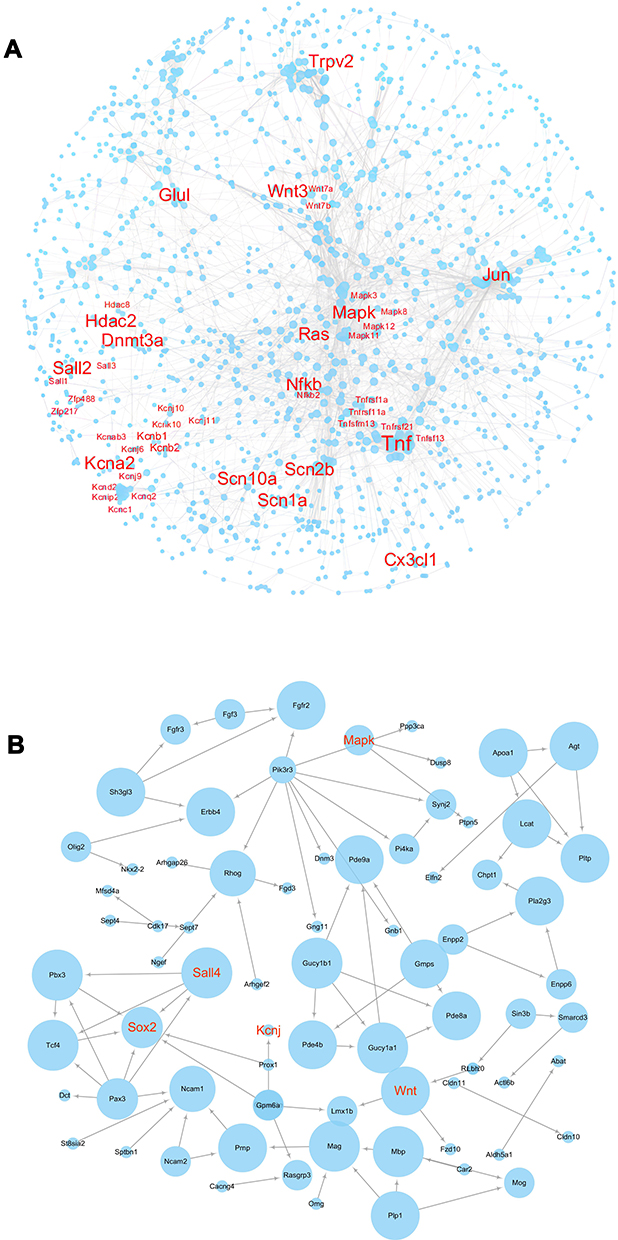 |
Figure 8 PPI networks under TMJ pain in the TG and Sp5C. (A) PPI networks constructed by DE lncRNAs target mRNAs in the TG comparing CFA group with saline control group. (B) PPI networks constructed by DE lncRNAs target mRNAs in the Sp5C comparing CFA group with saline control group. Genes were displayed as nodes and PPIs were displayed as edges. The node size is proportional to the degree of the node. Interesting genes were enlarged and labeled with red color. |
Discussion
Previous studies have shown that the expression of protein‐coding genes is altered in the TG neurons following CFA- or capsaicin-induced orofacial pain.22,23 In recent years, several lncRNAs have been reported to regulate different types of pain.3,4,24–26 However, the potential functions of lncRNAs in orofacial pain are not fully understood. Xiong et al demonstrate that lncRNA uc.48+ is upregulated in the TG and plays an essential role in pain transmission of trigeminal neuralgia.9 In the present study, we analyze the transcripts of both TG and Sp5C in a CFA-induced inflammatory TMJ pain mouse model. Using the sequencing technique, we carried out a comprehensive genome‐wide transcriptional screening of lncRNAs and mRNAs during CFA-induced TMJ pain. Our results indicate that on day 4 post-CFA when maximal TMJ pain is induced, the expression patterns of many mRNAs and lncRNAs in both TG and Sp5C are significantly altered.
The DE mRNAs and lncRNAs identified in this study are associated with each other and contribute to pain regulation. It has been reported that decreased potassium channel gene expression can reduce voltage-gated potassium currents in ganglion neurons for pain regulation.27 In this study, we observed that after TMJ pain induction, Kcnab2, Kcnn2 and Kcnmb4 in the TG and Kcna6 in the Sp5C were decreased (see Table 2). Meanwhile, we also observed that TMJ pain induction decreased AC163434.5 (predicted target mRNA: Kcnab2) in the TG (see Table 3). These results suggest that potassium channel gene regulation in the trigeminal nociceptive system contributes to the pathogenesis of TMJ pain. The DE mRNAs and lncRNAs we identified provide consistent information for specific gene regulation in TMJ pain. Moreover, previous studies have demonstrated that the Mitogen-activated protein kinase (MAPK) signaling pathway is involved in pain sensitization28 and TMJ pain.29 In the present study, we identified increased Mapk9 in the Sp5C after TMJ pain induction (see Table 2), which indicates a potential role of MAPK signaling in TMJ pain. Additionally, lncRNA RP23-240E15.3 and its predicted target mRNA Cxcl14 as well as lncRNA RP23-230I5.2 and its predicted target mRNA Gpr37 are altered after TMJ pain induction (see Tables 2 and 3). The change in the expression of these genes may also contribute to TMJ pain. Therefore, our results in this study provide potential targets for us to further investigate the underlying molecular mechanisms for TMJ pain in the future.
We next conduct a KEGG pathway analysis of the identified DE mRNAs and lncRNAs in the TG and Sp5C. The top 20 dysregulated pathways for each condition are summarized. We further conduct GO analysis of the identified DE mRNAs and lncRNAs to ascertain specific categories of the DE transcripts. For instance, the cAMP signaling pathway we identified is involved in inflammatory TMJ hypersensitivity30 and neuropathic pain,31 the MAPK signaling pathway we identified can enhance TMJ nociceptive processing,29 and the Ras signaling pathway we identified has been reported to contribute to immune processes in the pathophysiology of TMD pain.32 Furthermore, PPI network analysis of the identified DE lncRNAs shows interesting genes that are mostly relevant to pain regulation. Therefore, transcriptomic analysis data we report here not only demonstrate several common signaling pathways in pain mechanisms but also indicate some potential genes, including potassium channel genes, as well as those genes in cAMP, MAPK and Ras signaling pathways, may be specifically involved in TMJ pain. However, the identified genes have not been validated to confirm their roles in TMJ pain. We will conduct an experimental validation of the identified genes in our future studies.
Conclusion
Our results in this study highlight important transcriptional changes induced by intra-TMJ injection of CFA into the TG and Sp5C. We identify DE mRNAs and lncRNAs in the trigeminal nociceptive system of mice with inflammatory TMJ pain. Based on bioinformatic analysis, we reveal that the dysregulated mRNAs and lncRNAs are mostly involved in pain regulation. Our study advances our understanding of different gene expressions in TMJ pain. Additional functional analyses are needed to further unravel the potential roles of the identified transcriptional modification in the molecular mechanisms underlying TMD and TMJ pain.
Data Sharing Statement
The datasets generated during and/or analysed during the current study are available in the GEO repository, and the GEO accession number is GSE188922.
Ethics Approval
This study was approved by the Animal Ethics Committee of Zhengzhou University (Animal Protocol Number: 2021328).
Author Contributions
All authors made substantial contributions to conception and design, acquisition of data, or analysis and interpretation of data; took part in drafting the article or revising it critically for important intellectual content; agreed on the journal to which the article will be submitted; gave final approval of the version to be published; and agreed to be accountable for all aspects of the work.
Funding
This work was supported by the National Natural Science Foundation of China Youth Project (NO: 82001191, Q. Bai) and Program for Science & Technology Innovation Talents in Universities of Henan Province (NO: 22HASTIT047, Q. Bai).
Disclosure
The authors declare that there are no conflicts of interest.
References
1. Gil-Martinez A, Grande-Alonso M, Lopez-de-Uralde-Villanueva I, Lopez-Lopez A, Fernandez-Carnero J, La Touche R. Chronic temporomandibular disorders: disability, pain intensity and fear of movement. J Headache Pain. 2016;17(1):103. doi:10.1186/s10194-016-0690-1
2. Kuc J, Szarejko KD, Sierpinska T. Evaluation of orofacial and general pain location in patients with temporomandibular joint disorder-myofascial pain with referral. Front Neurol. 2019;10:546. doi:10.3389/fneur.2019.00546
3. Sun W, Ma M, Yu H, Yu H. Inhibition of lncRNA X inactivate-specific transcript ameliorates inflammatory pain by suppressing satellite glial cell activation and inflammation by acting as a sponge of miR-146a to inhibit Nav 1.7. J Cell Biochem. 2018;119(12):9888–9898. doi:10.1002/jcb.27310
4. Wei M, Li L, Zhang Y, Zhang ZJ, Liu HL, Bao HG. LncRNA X inactive specific transcript contributes to neuropathic pain development by sponging miR-154-5p via inducing toll-like receptor 5 in CCI rat models. J Cell Biochem. 2018;120(2):1271–1281.
5. Liu Z, Liang Y, Wang H, et al. LncRNA expression in the spinal cord modulated by minocycline in a mouse model of spared nerve injury. J Pain Res. 2017;10:2503–2514. doi:10.2147/JPR.S147055
6. Zhou J, Fan Y, Chen H. Analyses of long non-coding RNA and mRNA profiles in the spinal cord of rats using RNA sequencing during the progression of neuropathic pain in an SNI model. RNA Biol. 2017;14(12):1810–1826. doi:10.1080/15476286.2017.1371400
7. Zhou J, Xiong Q, Chen H, Yang C, Fan Y. Identification of the spinal expression profile of non-coding RNAs involved in neuropathic pain following spared nerve injury by sequence analysis. Front Mol Neurosci. 2017;10:91. doi:10.3389/fnmol.2017.00091
8. Zhang C, Wang P, Jiang P, et al. Upregulation of lncRNA HOTAIR contributes to IL-1beta-induced MMP overexpression and chondrocytes apoptosis in temporomandibular joint osteoarthritis. Gene. 2016;586(2):248–253. doi:10.1016/j.gene.2016.04.016
9. Xiong W, Tan M, Tong Z, et al. Effects of long non-coding RNA uc.48+ on pain transmission in trigeminal neuralgia. Brain Res Bull. 2019;147:92–100. doi:10.1016/j.brainresbull.2019.02.009
10. Bai Q, Liu S, Shu H, et al. TNFalpha in the trigeminal nociceptive system is critical for temporomandibular joint pain. Mol Neurobiol. 2019;56(1):278–291. doi:10.1007/s12035-018-1076-y
11. Langmead B, Salzberg SL. Fast gapped-read alignment with bowtie 2. Nat Methods. 2012;9(4):357–359. doi:10.1038/nmeth.1923
12. Pertea M, Kim D, Pertea GM, Leek JT, Salzberg SL. Transcript-level expression analysis of RNA-seq experiments with HISAT, Stringtie and Ballgown. Nat Protoc. 2016;11(9):1650–1667. doi:10.1038/nprot.2016.095
13. Sun L, Luo H, Bu D, et al. Utilizing sequence intrinsic composition to classify protein-coding and long non-coding transcripts. Nucleic Acids Res. 2013;41(17):e166. doi:10.1093/nar/gkt646
14. Kong L, Zhang Y, Ye ZQ, et al. CPC: assess the protein-coding potential of transcripts using sequence features and support vector machine. Nucleic Acids Res. 2007;35(Web Server issue):W345–W349. doi:10.1093/nar/gkm391
15. Bateman A, Coin L, Durbin R, et al. The Pfam protein families database. Nucleic Acids Res. 2002;30(1):276–280. doi:10.1093/nar/30.1.276
16. Lin MF, Jungreis I, Kellis M. PhyloCSF: a comparative genomics method to distinguish protein coding and non-coding regions. Bioinformatics. 2011;27(13):i275–i282. doi:10.1093/bioinformatics/btr209
17. Trapnell C, Williams BA, Pertea G, et al. Transcript assembly and quantification by RNA-Seq reveals unannotated transcripts and isoform switching during cell differentiation. Nat Biotechnol. 2010;28(5):511–515. doi:10.1038/nbt.1621
18. Young MD, Wakefield MJ, Smyth GK, Oshlack A. Gene ontology analysis for RNA-seq: accounting for selection bias. Genome Biol. 2010;11(2):R14. doi:10.1186/gb-2010-11-2-r14
19. Kanehisa M, Araki M, Goto S, et al. KEGG for linking genomes to life and the environment. Nucleic Acids Res. 2008;36(Database issue):D480–D484. doi:10.1093/nar/gkm882
20. Mao X, Cai T, Olyarchuk JG, Wei L. Automated genome annotation and pathway identification using the KEGG orthology (KO) as a controlled vocabulary. Bioinformatics. 2005;21(19):3787–3793. doi:10.1093/bioinformatics/bti430
21. Qu Z, Adelson DL. Bovine ncRNAs are abundant, primarily intergenic, conserved and associated with regulatory genes. PLoS One. 2012;7(8):e42638. doi:10.1371/journal.pone.0042638
22. Okumura M, Iwata K, Yasuda K, et al. Alternation of gene expression in trigeminal ganglion neurons following complete Freund’s adjuvant or capsaicin injection into the rat face. J Mol Neurosci. 2010;42(2):200–209. doi:10.1007/s12031-010-9348-7
23. Chung MK, Park J, Asgar J, Ro JY. Transcriptome analysis of trigeminal ganglia following masseter muscle inflammation in rats. Mol Pain. 2016;12:174480691666852. doi:10.1177/1744806916668526
24. Zhao X, Tang Z, Zhang H, et al. A long noncoding RNA contributes to neuropathic pain by silencing Kcna2 in primary afferent neurons. Nat Neurosci. 2013;16(8):1024–1031. doi:10.1038/nn.3438
25. Bali KK, Kuner R. Noncoding RNAs: key molecules in understanding and treating pain. Trends Mol Med. 2014;20(8):437–448. doi:10.1016/j.molmed.2014.05.006
26. Baskozos G, Dawes JM, Austin JS, et al. Comprehensive analysis of long non-coding RNA expression in dorsal root ganglion reveals cell type specificity and dysregulation following nerve injury. Pain. 2018. doi:10.1097/j.pain.0000000000001301
27. Xiao Y, Wu Y, Zhao B, Xia Z. Decreased voltage-gated potassium currents in rat dorsal root ganglion neurons after chronic constriction injury. Neuroreport. 2016;27(2):104–109. doi:10.1097/WNR.0000000000000505
28. Ji RR, Gereau R, Malcangio M, Strichartz GR. MAP kinase and pain. Brain Res Rev. 2009;60(1):135–148. doi:10.1016/j.brainresrev.2008.12.011
29. Tashiro A, Okamoto K, Bereiter DA. Chronic inflammation and estradiol interact through MAPK activation to affect TMJ nociceptive processing by trigeminal caudalis neurons. Neuroscience. 2009;164(4):1813–1820. doi:10.1016/j.neuroscience.2009.09.058
30. Zhang P, Bi RY, Gan YH. Glial interleukin-1beta upregulates neuronal sodium channel 1.7 in trigeminal ganglion contributing to temporomandibular joint inflammatory hypernociception in rats. J Neuroinflammation. 2018;15(1):117. doi:10.1186/s12974-018-1154-0
31. Yan XT, Xu Y, Cheng XL, et al. SP1, MYC, CTNNB1, CREB1, JUN genes as potential therapy targets for neuropathic pain of brain. J Cell Physiol. 2019;234(5):6688–6695. doi:10.1002/jcp.27413
32. Smith SB, Parisien M, Bair E. Genome-wide association reveals contribution of MRAS to painful temporomandibular disorder in males. Pain. 2019;160:579–591. doi:10.1097/j.pain.0000000000001438
 © 2022 The Author(s). This work is published and licensed by Dove Medical Press Limited. The
full terms of this license are available at https://www.dovepress.com/terms
and incorporate the Creative Commons Attribution
- Non Commercial (unported, 3.0) License.
By accessing the work you hereby accept the Terms. Non-commercial uses of the work are permitted
without any further permission from Dove Medical Press Limited, provided the work is properly
attributed. For permission for commercial use of this work, please see paragraphs 4.2 and 5 of our Terms.
© 2022 The Author(s). This work is published and licensed by Dove Medical Press Limited. The
full terms of this license are available at https://www.dovepress.com/terms
and incorporate the Creative Commons Attribution
- Non Commercial (unported, 3.0) License.
By accessing the work you hereby accept the Terms. Non-commercial uses of the work are permitted
without any further permission from Dove Medical Press Limited, provided the work is properly
attributed. For permission for commercial use of this work, please see paragraphs 4.2 and 5 of our Terms.