Back to Journals » Breast Cancer: Targets and Therapy » Volume 15
Transcriptome Profiling Analysis of Breast Cancer Cell MCF-7 Treated by Sesamol
Received 5 January 2023
Accepted for publication 23 May 2023
Published 29 May 2023 Volume 2023:15 Pages 391—401
DOI https://doi.org/10.2147/BCTT.S392480
Checked for plagiarism Yes
Review by Single anonymous peer review
Peer reviewer comments 2
Editor who approved publication: Professor Robert Clarke
Jiafa Wu,1 Dongping Luo,2 Jiayun Xu2
1School of Food and Bioengineering, Henan University of Science and Technology, Luoyang, People’s Republic of China; 2The First Affiliated Hospital, Henan University of Science and Technology, Luoyang, People’s Republic of China
Correspondence: Jiafa Wu, School of Food and Bioengineering, Henan University of Science and Technology, Kaiyuan Avenue 263, Luoyang, People’s Republic of China, Email [email protected] Jiayun Xu, The First Affiliated Hospital, Henan University of Science and Technology, Guanlin Avenue 636, Luoyang, People’s Republic of China, Email [email protected]
Background: Breast cancer is a highly malignant tumor that affects a large number of women worldwide. Sesamol, a natural compound, has been shown to exhibit inhibitory effects on various tumors, including breast cancer. However, the underlying mechanism of its action has not been fully explored. In this study, we aimed to investigate the effect of sesamol on the transcriptome of MCF-7 breast cancer cells, in order to better understand its potential as an anti-cancer agent.
Methods: The transcriptome profiles of MCF-7 breast cancer cells treated with sesamol were analyzed using Illumina deep-sequencing. The differentially expressed genes (DEGs) between the control and sesamol-treated groups were identified, and GO and KEGG pathway analyses of these DEGs were conducted using ClueGO. Protein–protein interaction (PPI) network of DEGs was mapped on STRING database and visualized by Cytoscape software. Hub genes in the network were screened by Cytohubba plugin of Cytoscape. Prognostic values of hub genes were analyses by the online Kaplan–Meier plotter and validated by qRT-PCR in MCF-7 cells.
Results: The results of the study showed that sesamol treatment had a significant effect on the transcriptome of MCF-7 cells, with a total of 351 DEGs identified. Functional enrichment analyses of DEGs revealed their involvement in extracellular matrix (ECM) remodeling, fatty acid metabolism and monocyte chemotaxis. The protein–protein interaction (PPI) network analysis of DEGs resulted in the identification of 10 hub genes, namely IGF2, MMP1, MSLN, CXCL10, WT1, ITGAL, PLD1, MME, TWIST1, and FOXA2. Survival analysis showed that MMP1 and ITGAL were significantly associated with overall survival (OS) and recovery-free survival (RFS) in breast cancer patients.
Conclusion: Sesamol may play important roles in extracellular matrix (ECM) remodeling, fatty acid metabolism and cell cycle of MCF-7.
Keywords: breast cancer cells, sesamol, transcriptome, differentially expressed genes, GO and KEGG pathway analyses
Introduction
Breast cancer is the most frequently diagnosed cancer in women worldwide, accounting for 25.8% of all new cancer cases in 2020.1 Several studies have shown that the incidence of breast cancer is closely related to diet, particularly dietary pattern.2,3 For example, dietary antioxidants have been shown to regulate oxidative stress in the body,4 with higher antioxidant intake associated with lower risk of breast cancer.5
Sesamol is the main aroma components and quality stabilizer of sesame oil. It is a potent nontoxic antioxidant with strong antimicrobial and antioxidant properties.6,7 Sesamol has been shown to inhibit the progression of atherosclerosis and downregulate levels of cholesterol and triglycerides.8,9 Moreover, sesamol has chemopreventive, anti-mutagenic, and anti-aging potential.10–12 Recent research has revealed various biological functions of sesamol, including its anti-inflammatory and anticancer properties. Sesamol can inhibit COX-2 transcription, which helps to suppress inflammation in mouse intestinal cancer cells,13 and can induce apoptosis in liver, colon, and breast cancer cells.14–16
Recent advancements in high-throughput sequencing technology have made it possible to analyze the transcriptome under specific conditions. This study aimed to investigate the impact of sesamol on the transcriptome of breast cancer cells MCF-7. The study identified differentially expressed genes (DEGs) and performed functional enrichment analyses. A total of 351 DEGs were identified, with 159 downregulated genes and 192 upregulated genes. The functional enrichment analyses revealed that the DEGs were involved in various processes, including extracellular matrix (ECM) remodeling, fatty acid metabolism, cell cycle, and monocyte chemotaxis. The top 10 hub genes (IGF2, MMP1, MSLN, CXCL10, WT1, ITGAL, PLD1, MME, TWIST1, and FOXA2) were found in the protein–protein interaction (PPI) network constructed by Cytoscape software. The survival analysis showed that MMP1 and ITGAL were significantly associated with overall survival (OS) and recovery-free survival (RFS) in breast cancer patients.
Materials and Methods
Cell Culture
The MCF-7 breast cancer cell line was obtained from the National Infrastructure of Cell Line Resource and cultured in RPMI1640 media with 10% FBS at 37°C in 5% CO2. To investigate the effects of sesamol on the cells, MCF-7 cells were treated with 50μmol/L of sesamol for 48 hours, while the control group was treated with the same amount of DMSO. Each group had three duplicates.
RNA Isolation and Transcriptome Sequencing
RNA was collected in Trizol reagent (Invitrogen, CA, USA), packed in dry ice and shipped to Sangon Biotech (Shanghai) Co., Ltd. for sequencing. RNA isolation, library preparation and sequencing, data assessment and quality control, as well as alignment and expression analysis were conducted by Sangon Biotech (Shanghai) Co., Ltd.17
Functional Enrichment Analysis of DEGs
DEGs were determined based on p-value <0.05 and log2 |FoldChange| ≥1. To perform large-scale functional enrichment studies, a common method is to conduct Gene Ontology (GO) annotation analysis. Gene functions can be classified into biological process (BP), molecular function (MF), cellular component (CC). The Kyoto Encyclopedia of Genes and Genomes (KEGG) is a widely used database that provides information on genomes, biological pathways, diseases, chemicals, and drugs. The functional analysis of DEGs was conducted using ClueGO plugin of Cytoscape software (www.cytoscape.org/).18,19
PPI Network Construction and Hub Gene Identification
The protein–protein interaction (PPI) analysis was conducted using the STRING database (http://string-db.org/). The DEGs were uploaded to the STRING database to investigate the potential PPI relationships. The PPI network was constructed based on combined score >0.4 and visualized using Cytoscape. Nodes with a higher connectivity degree tend to be more crucial in maintaining the stability of the entire network. The CytoHubba plugin of Cytoscape was used to calculate the degree of each node.20 In this study, the top 10 genes were identified as hub genes.
Quantitative RT-PCR Experiments
MCF-7 cells were treated with sesamol for 48 hours. Total RNA was extracted using Trizol reagent (Invitrogen, CA, USA). Two micrograms of total RNA was then used to reverse transcribe cDNA using the HiFi-MMLV cDNA Kit (Cwbio, Beijing, China). Quantitative real-time PCR (qRT-PCR) was performed using the UltraSYBR Mixture (Cwbio, Beijing, China) in a CFX96 instrument (Bio-Rad, CA, USA) and analyzed using the 2−ΔΔCT method. The sequences of primers used for qRT-PCR are described in Table S1.
Survival Analysis
The Kaplan–Meier plotter (http://kmplot.com/analysis/) is an online tool that can assess the correlation between the expression of all genes and survival in more than 30,000 samples from 21 tumor types, including breast, ovarian, lung, and gastric cancer. In this study, the prognostic value of the hub genes identified in breast cancer patients was evaluated using the Kaplan–Meier plotter mRNA tool. The patients were split by “Medium”. For genes with multiple probes, only the analysis results with consistent prognostic values were adopted. The OS, RFS, distant metastasis-free survival (DMFS), and post-progression survival (PPS) were analyzed, respectively. P < 0.05 was considered to be statistically significant.21
Results
Quality Assessment of Transcriptome Profiling
After sequencing with Illumina HiSeq XTen platform, High quality paired-end reads were obtained from the control group (C) and sesamol-treated group (E), respectively, which were then cleaned and mapped to the reference genome sequence. The proportion of clean reads in each sample was greater than 98%. Over 98% of the reads from control group (C) and sesamol-treated group (E) were mapped to the reference genome and the majority of which were uniquely mapped (Table 1). By sequence alignment, over 26,000 genes were hit by the unique reads and most of these genes showed very high level (90–100%) of gene coverage (Figure 1). The above results indicate that the transcriptome profiling is qualified and can be used for subsequent analysis. (For further details on the quality of the RNA-Seq data, please refer to Tables S2–S4)
 |
Table 1 Summary of Mapping Transcriptome Reads to Reference Genome |
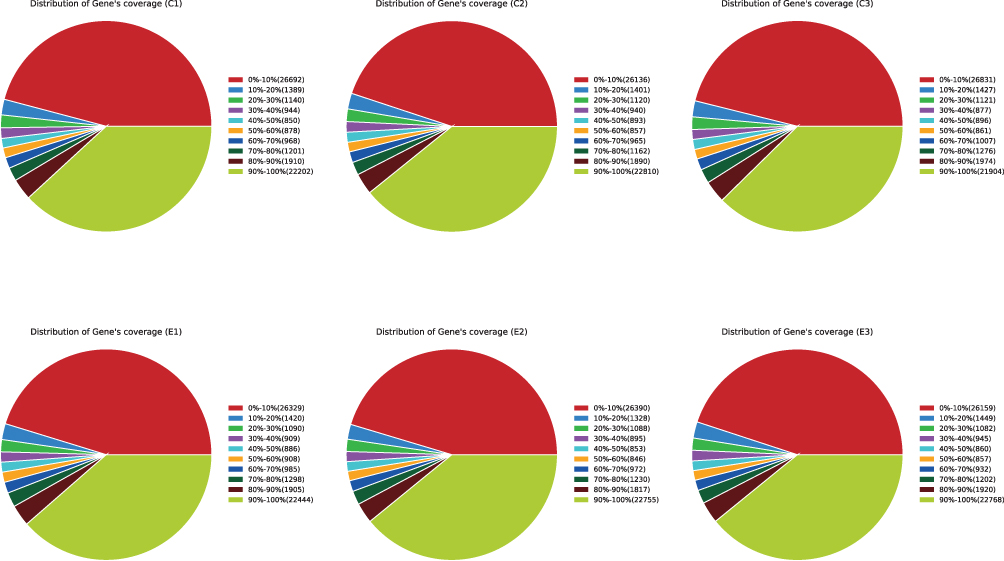 |
Figure 1 Distribution of Gene’ coverage. The pie chart shows the percentage of genes that can be sequenced in different coverage areas and the number of genes is shown in brackets. C1, C2 and C3 are duplicates of control group. E1, E2 and E3 are duplicates of sesamol-treated group. |
Identification of DEGs
Based on the criteria of p-value <0.05 and log2|FoldChange| ≥1, a total of 351 DEGs were identified between the sesamol-treated group and the control group, with 192 genes upregulated and 159 genes downregulated (for more detailed information, please refer to Table S5). Gene expression differences were visualized by volcano plot (Figure 2).
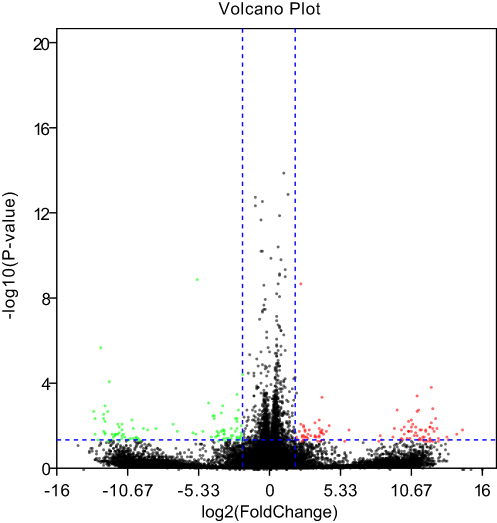 |
Figure 2 Volcano plot comparing all DEGs. The red and green dots indicate upregulated and downregulated DEGs respectively (p-value<0.05 and log2|FoldChange|≥1). |
Functional Enrichment Analyses of DEGs
The study performed GO function and KEGG pathway enrichment analysis for the identified DEGs using ClueGO. The enriched GO terms were divided into MF, BP, and CC ontologies. BP analysis indicated that the DEGs were significantly enriched in processes such as long-chain fatty acid-CoA ligase activity, positive regulation of phospholipid metabolic process, positive regulation of monocyte chemotaxis, and regulation of membrane lipid distribution (Figure 3). The CC analysis showed that the DEGs were significantly enriched in specific granule membrane and stereocilium bundles (Figure 4). The MF analysis revealed that the DEGs were significantly enriched in processes such as medium-chain fatty acid-CoA ligase activity, positive regulation of phosphatidylinositol 3-kinase activity, extracellular matrix constituent conferring elasticity, and MHC protein binding (Figure 5). KEGG pathway analysis showed that the DEGs were mainly enriched in Fc gamma R-mediated phagocytosis and Taste transduction (Figure 6). Reactome pathway analysis revealed that the DEGs were mainly enriched in processes such as condensation of prophase chromosomes, degradation of the extracellular matrix, molecules associated with elastic fibres, COPI-independent Golgi-to-ER retrograde traffic, post-translational modification: synthesis of GPI-anchored proteins, regulation of beta-cell development, and integrin cell surface interactions (Figure 7). (The detailed results and pathways can be found in Table S6).
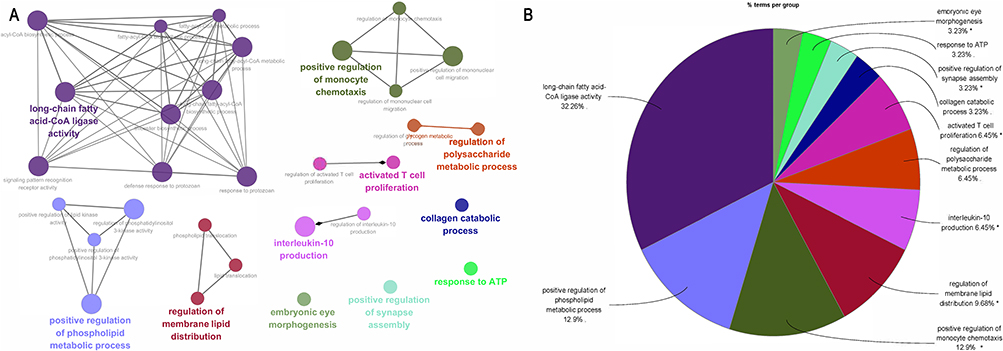 |
Figure 3 BP analysis by ClueGO. (A) GO terms enriched in BP. (B) Pie chart statistics of BP terms. Single (*) asterisk indicate significant enriched GO terms at the p < 0.05 statistical levels. |
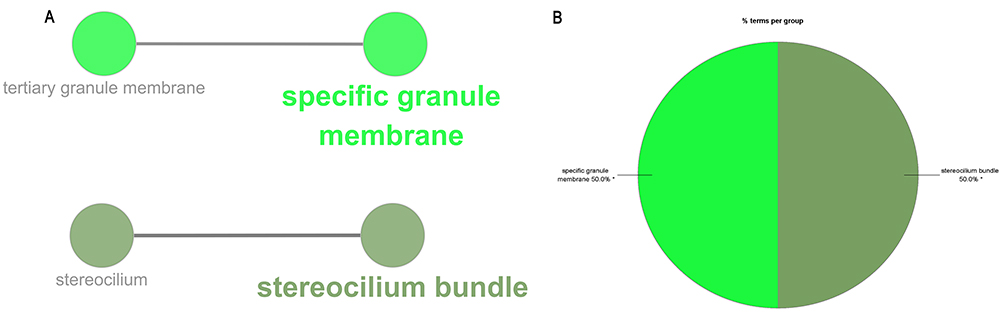 |
Figure 4 CC analysis by ClueGO. (A) GO terms enriched in CC. (B) Pie chart statistics of CC terms. Single (*) asterisk indicate significant enriched GO terms at the p < 0.05 statistical levels. |
 |
Figure 5 MF analysis by ClueGO. (A) GO terms enriched in MF. (B) Pie chart statistics of MF terms. Single (*) or double (**) asterisk indicate significant enriched GO terms at the p < 0.05 and p < 0.01 statistical levels, respectively. |
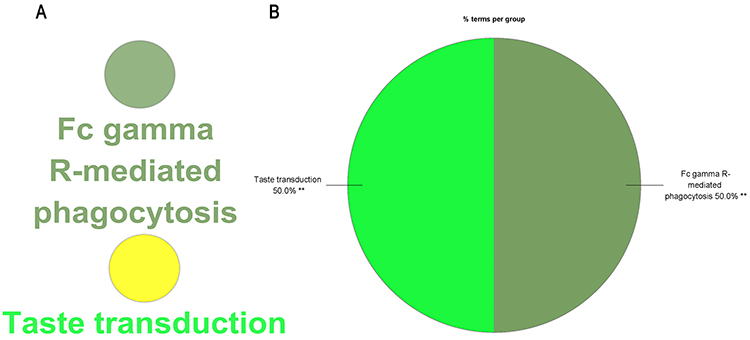 |
Figure 6 KEGG analysis by ClueGO. (A) Pathways enriched in KEGG. (B) Pie chart statistics of pathways. Double (**) asterisk indicate significant enriched GO terms at the p < 0.01 statistical levels. |
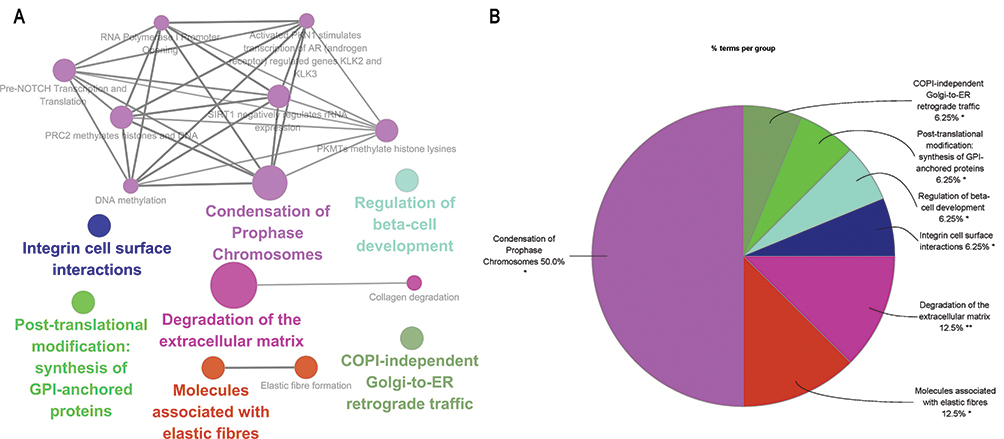 |
Figure 7 Reactome pathways analysis by ClueGO. (A) Pathways enriched in Reactome. (B) Pie chart statistics of pathways. Single (*) or double (**) asterisk indicate significant enriched GO terms at the p < 0.05 and p < 0.01 statistical levels, respectively. |
PPI Network Construction of DEGs and Hub Genes Identification
The protein interactions among the DEGs were predicted using the STRING tool, revealing a PPI network with 165 nodes and 86 edges (local clustering coefficient = 0.319, expected number of edges = 62, and PPI enrichment p-value = 0.00214, Figure 8). Such enrichment suggests that these proteins are biologically connected as a group.
 |
Figure 8 PPI network of DEGs identified by STRING. A total of 165 nodes and 86 edges were involved in the PPI network with p-value = 0.00214. Red rectangles indicate the upregulated DEGs. Green ellipses indicate the downregulated DEGs. |
The top ten hub genes in the PPI network were identified by connectivity degree (Table 2). The results indicated that matrix metallopeptidase 1 (MMP1) and insulin-like growth factor II (IGF2) were the most prominent genes with connectivity degree of 7, followed by mesothelin (MSLN), C-X-C motif chemokine 10 (CXCL10), and WT1 transcription factor (WT1) with connectivity degree of 6. Integrin alpha-L (ITGAL), phospholipase D1 (PLD1), and membrane metalloendopeptidase (MME) had a connectivity degree of 5, while twist family bHLH transcription factor 1 (TWIST1) and forkhead box A2 (FOXA2) had a degree of 4.
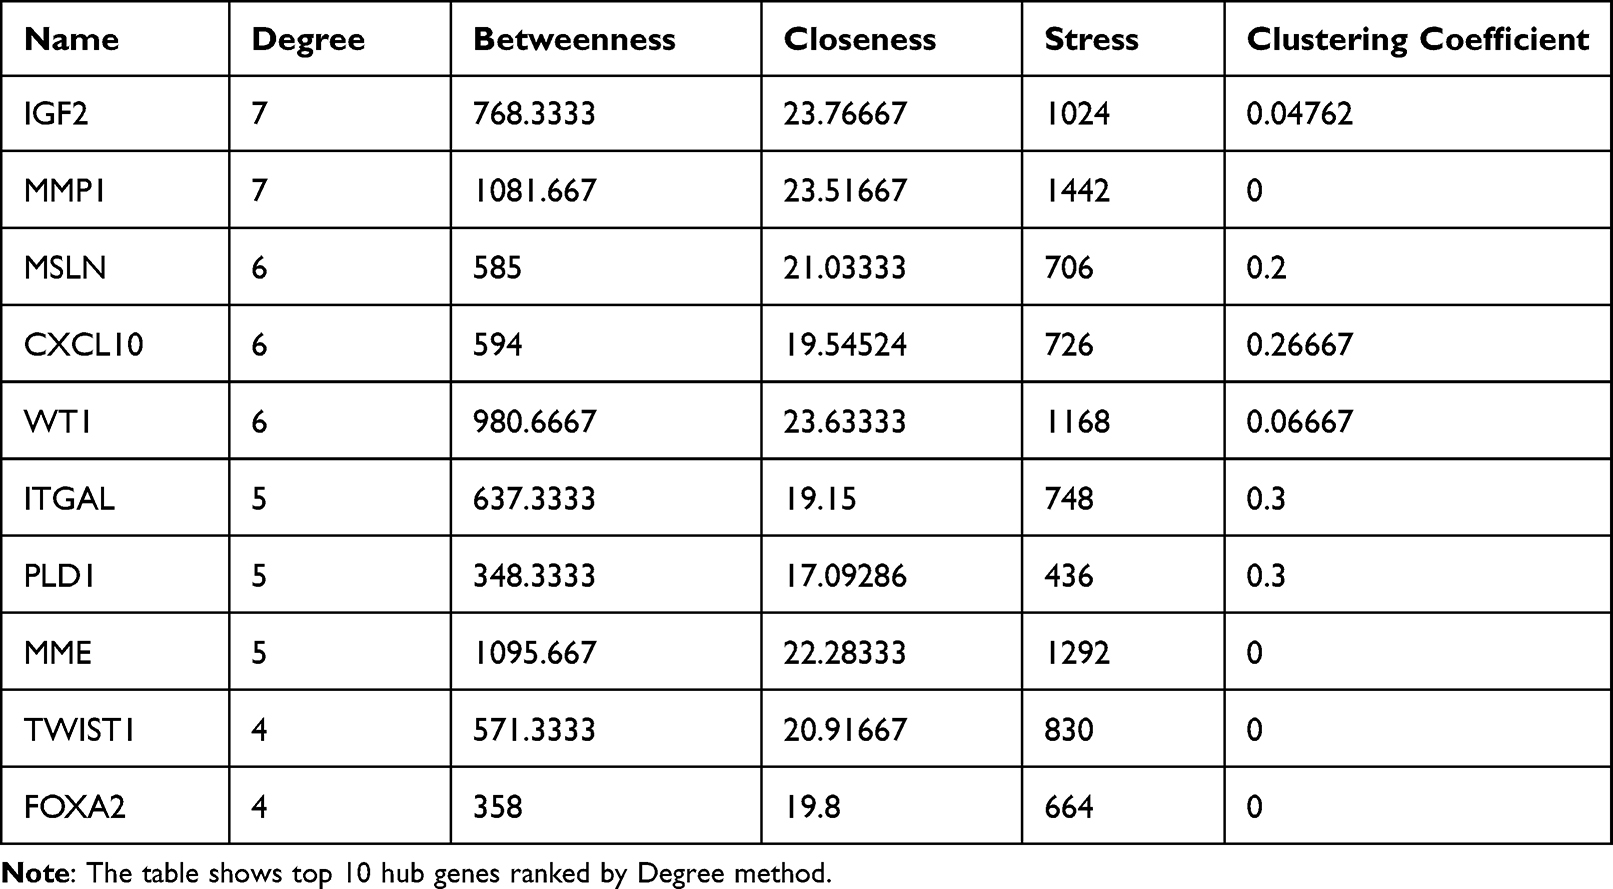 |
Table 2 Top 10 Hub Genes Ranked by Degree Method |
Quantitative RT-PCR Results
To assess the effect of sesamol treatment on gene expression, we used qRT-PCR to detect expression levels of hub genes in MCF-7 cells. The results showed a significant increase in the expression of CXCL10, IGF2, MME, MMP1, MSLN, and TWIST1, while ITGAL and WT1 expression decreased significantly (Figure S1).
Survival Analysis
The prognostic value of the top 10 hub genes was assessed using Kaplan–Meier plotter in a cohort of 1879, 4929, 2765 and 458 breast cancer patients for OS, RFS, DMFS, and PPS, respectively. The results showed that expression levels of MMP1, ITGAL, and TWIST1 were significantly associated with OS, while IGF2, MMP1, MSLN, CXCL10, WT1, ITGAL, PLD1 and FOXA2 were significantly correlated with RFS and DMFS. However, none of the genes were significantly associated with PPS. Additional information on these findings is available in Figure S2.
Discussion
The effect of sesamol on the MCF-7 breast cancer cells was investigated at the transcriptome level in this study. Transcript abundances from the control group and sesamol-treated group were acquired by Illumina HiSeq XTen platform. High-quality transcriptome reads were mapped onto the reference genome and identified more than 26,000 expressed genes. Of these, 351 genes (192 upregulated and 159 downregulated genes) were found to be significantly differentially expressed between the two groups.
Cancer cells undergo metabolic reprogramming to support their proliferation, growth, and spread, with changes in lipid metabolism being a well-documented aspect of this reprogramming.22,23 Fatty acid-CoA ligase is a key enzyme that controls the pool of free fatty acids and is crucial for their utilization as both a structural unit and an energy source.24,25 The BP and MF analyses conducted in this study revealed that the DEGs were significantly involved in the fatty acid metabolism pathway, which is a part of lipid metabolism (Figures 3 and 5). Moreover, the DEGs were also found to participate in the regulation of phospholipid metabolism and transport, membrane lipid distribution, and lipid translocation (Figure 3). These findings may explain why sesamol is able to stabilize the cell membrane, as described in previous studies.26
The ECM is a crucial non-cellular component of the tumor microenvironment (TME), serving as a scaffold in tumors.27,28 Throughout cancer development, the ECM is a highly dynamic structure constantly undergoing remodeling, where ECM components are deposited, degraded, or modified. This remodeling plays a crucial role in the communication between cancer cells and neighboring cells within the TME.29–31 The CC and Reactome pathways analyses indicated that sesamol could induce collagen degradation, extracellular matrix degradation, and elastic fiber formation. Therefore, targeting the ECM through sesamol treatment could have potential therapeutic benefits in disrupting TME communication and hindering cancer progression.
Liu et al previously reported that sesamol can interact with DNA at the minor groove, resulting in cytotoxicity to HepG2 cells.14 Additionally, in another study, sesamol was found to act as a radioprotector for DNA by enhancing DNA repair.32 The Reactome pathway analysis indicated that sesamol may also play a role in the condensation of prophase chromosomes. These findings suggest that sesamol may possess regulatory functions in the cell cycle, including DNA replication, DNA repair, and even high-level architecture formation.
We validated the expression of the top ten genes using qRT-PCR and the results are shown in Figure S1. It is important to note that the expression differences between RNA-seq and qRT-PCR are expected due to the use of different experimental platforms, and direct one-to-one correspondence between the two methods is not always possible. While RNA-seq is useful for large-scale screening and can provide insight into the overall trend of gene expression changes in a sample, it does not guarantee consistency with qRT-PCR results for individual genes. Among the top 10 hub genes identified in the study, only MMP1 and ITGAL were found to be significantly associated with OS, RFS, and DMFS, as shown in Figure S2. Previous studies have shown that MMP1 promotes the progression of different types of tumors and high levels of matrix metalloproteinases are linked with poor prognosis in various carcinomas such as ovarian cancer, breast cancer, and esophageal squamous cell cancer.33–37 The survival analysis in this study revealed that the expression of MMP1 was negatively correlated with OS, RFS, and DMFS (Figure S2). On the other hand, ITGAL acts as a receptor for ICAM1, ICAM2, ICAM3, ICAM4, and F11R,38 and plays a role in various immune phenomena including leukocyte-endothelial cell interaction, cytotoxic T-cell mediated killing, and antibody-dependent killing by granulocytes and monocytes.39–41 While the expression of ITGAL is associated with a poor prognosis in renal cancer, it is linked to a good prognosis in endometrial cancer, head and neck cancer, and melanoma.42,43 In breast cancer, high expression of ITGAL is significantly positively correlated with OS, RFS and DMFS, as shown in Figure S2.
Conclusion
In conclusion, the findings suggest that sesamol may be involved in critical biological processes, such as ECM remodeling, fatty acid metabolism, and cell cycle regulation, in MCF-7 cells. However, further studies are required to gain a deeper understanding of the mechanisms underlying the effects of sesamol on breast cancer development. This may include investigating the role of sesamol in other cancer cell lines and animal models, as well as exploring potential clinical applications of sesamol as a therapeutic agent for breast cancer.
Abbreviations
CXCL10, C-X-C motif chemokine ligand 10; DEGs, Differentially expressed genes; ECM, Extracellular matrix; FOXA2, Forkhead box A2; GO, Gene ontology; IGF2, Insulin-like growth factor 2; ITGAL, Integrin subunit alpha L; KEGG, Kyoto Encyclopedia of Genes and Genomes; MF, Molecular function; MME, Membrane metalloendopeptidase; MMP1, matrix metallopeptidase 1; MSLN, Mesothelin; OS, overall survival; PLD1, Phospholipase D1; PPI, Protein–protein interactions; qRT-PCR, Quantitative real-time PCR; RFS, Relapse-free survival; TME, Tumor microenvironment; TWIST1, Twist family bHLH transcription factor 1; WT1, WT1 transcription factor.
Ethics Statement
In this study, bioinformatics methods were mainly adopted to analyze transcriptome data of MCF-7. Cell line MCF-7 was used in this research, which did not involve human beings and experimental animals, and approved by Institutional Review Board of The First Affiliated Hospital of Henan University of Science and Technology.
Acknowledgments
The authors acknowledge Dr. Xi Lian of Oxford University for providing valuable feedback and critically reading the manuscript.
Funding
This work was funded by Natural Science Foundation of Henan Province (No. 162300410099), and Doctor Scientific Research start-up Fund from Henan University of Science & Technology (No. 13480064).
Disclosure
The authors declare no conflicts of interest in this work.
References
1. Worldwide cancer data. Available from: https://www.wcrf.org/cancer-trends/worldwide-cancer-data/.
2. Kim JH, Lee J, Jung SY, Kim J. Dietary factors and female breast cancer risk: a prospective cohort study. Nutrients. 2017;9(12):1331. doi:10.3390/nu9121331
3. Catsburg C, Kim RS, Kirsh VA, Soskolne CL, Kreiger N, Rohan TE. Dietary patterns and breast cancer risk: a study in 2 cohorts. Am J Clin Nutr. 2015;101(4):817–823. doi:10.3945/ajcn.114.097659
4. Bjorklund G, Chirumbolo S. Role of oxidative stress and antioxidants in daily nutrition and human health. Nutrition. 2017;33:311–321. doi:10.1016/j.nut.2016.07.018
5. Pantavos A, Ruiter R, Feskens EF, et al. Total dietary antioxidant capacity, individual antioxidant intake and breast cancer risk: the Rotterdam Study. Int J Cancer. 2015;136(9):2178–2186. doi:10.1002/ijc.29249
6. Hou RC, Chen HL, Tzen JT, Jeng KC. Effect of sesame antioxidants on LPS-induced NO production by BV2 microglial cells. Neuroreport. 2003;14(14):1815–1819. doi:10.1097/00001756-200310060-00011
7. Elleuch MBS, Roiseux O, Blecker C, Attia H. Quality characteristics of sesame seeds and by-products. Food Chem. 2007;103(2):10. doi:10.1016/j.foodchem.2006.09.008
8. Pathak N, Rai AK, Kumari R, Bhat KV. Value addition in sesame: a perspective on bioactive components for enhancing utility and profitability. Pharmacogn Rev. 2014;8(16):147–155. doi:10.4103/0973-7847.134249
9. Jan KC, Ho CT, Hwang LS. Bioavailability and tissue distribution of sesamol in rat. J Agric Food Chem. 2008;56(16):7032–7037. doi:10.1021/jf8012647
10. Kaur IP, Saini A. Sesamol exhibits antimutagenic activity against oxygen species mediated mutagenicity. Mutat Res. 2000;470(1):71–76. doi:10.1016/S1383-5718(00)00096-6
11. Sharma S, Kaur IP. Development and evaluation of sesamol as an antiaging agent. Int J Dermatol. 2006;45(3):200–208. doi:10.1111/j.1365-4632.2004.02537.x
12. Kapadia GJ, Azuine MA, Tokuda H, et al. Chemopreventive effect of resveratrol, sesamol, sesame oil and sunflower oil in the Epstein-Barr virus early antigen activation assay and the mouse skin two-stage carcinogenesis. Pharmacol Res. 2002;45(6):499–505.
13. Shimizu S, Fujii G, Takahashi M, et al. Sesamol suppresses cyclooxygenase-2 transcriptional activity in colon cancer cells and modifies intestinal polyp development in Apc (Min/+) mice. J Clin Biochem Nutr. 2014;54(2):95–101. doi:10.3164/jcbn.13-91
14. Liu Z, Xiang Q, Du L, Song G, Wang Y, Liu X. The interaction of sesamol with DNA and cytotoxicity, apoptosis, and localization in HepG2 cells. Food Chem. 2013;141(1):289–296. doi:10.1016/j.foodchem.2013.02.105
15. Khamphio M, Barusrux S, Weerapreeyakul N. Sesamol induces mitochondrial apoptosis pathway in HCT116 human colon cancer cells via pro-oxidant effect. Life Sci. 2016;158:46–56. doi:10.1016/j.lfs.2016.06.017
16. Jacklin A, Ratledge C, Welham K, Bilko D, Newton CJ. The sesame seed oil constituent, sesamol, induces growth arrest and apoptosis of cancer and cardiovascular cells. Ann N Y Acad Sci. 2003;1010:374–380. doi:10.1196/annals.1299.068
17. Chen B, You W, Shan T. Myomaker, and Myomixer-Myomerger-Minion modulate the efficiency of skeletal muscle development with melatonin supplementation through Wnt/beta-catenin pathway. Exp Cell Res. 2019;385(2):111705. doi:10.1016/j.yexcr.2019.111705
18. Bindea G, Mlecnik B, Hackl H, et al. ClueGO: a Cytoscape plug-in to decipher functionally grouped gene ontology and pathway annotation networks. Bioinformatics. 2009;25(8):1091–1093. doi:10.1093/bioinformatics/btp101
19. Mlecnik B, Galon J, Bindea G. Comprehensive functional analysis of large lists of genes and proteins. J Proteomics. 2018;171:2–10. doi:10.1016/j.jprot.2017.03.016
20. Chin CH, Chen SH, Wu HH, Ho CW, Ko MT, Lin CY. cytoHubba: identifying hub objects and sub-networks from complex interactome. BMC Syst Biol. 2014;8(Suppl 4):S11. doi:10.1186/1752-0509-8-S4-S11
21. Gyorffy B, Lanczky A, Eklund AC, et al. An online survival analysis tool to rapidly assess the effect of 22,277 genes on breast cancer prognosis using microarray data of 1809 patients. Breast Cancer Res Treat. 2010;123(3):725–731. doi:10.1007/s10549-009-0674-9
22. Cheng C, Geng F, Cheng X, Guo D. Lipid metabolism reprogramming and its potential targets in cancer. Cancer Commun. 2018;38(1):27.
23. Li Z, Kang Y. Lipid metabolism fuels cancer’s spread. Cell Metab. 2017;25(2):228–230. doi:10.1016/j.cmet.2017.01.016
24. Corbet C, Feron O. Emerging roles of lipid metabolism in cancer progression. Curr Opin Clin Nutr Metab Care. 2017;20(4):254–260. doi:10.1097/MCO.0000000000000381
25. Kaur J, Tiwari R, Kumar A, Singh N. Bioinformatic analysis of leishmania donovani long-chain fatty acid-CoA ligase as a novel drug target. Mol Biol Int. 2011;2011:278051. doi:10.4061/2011/278051
26. Khan S, Choudhary S, Kumar A, et al. Evaluation of sesamol-induced histopathological, biochemical, haematological and genomic alteration after acute oral toxicity in female C57BL/6 mice. Toxicol Rep. 2016;3:880–894. doi:10.1016/j.toxrep.2016.03.005
27. Najafi M, Farhood B, Mortezaee K. Extracellular matrix (ECM) stiffness and degradation as cancer drivers. J Cell Biochem. 2019;120(3):2782–2790. doi:10.1002/jcb.27681
28. Filipe EC, Chitty JL, Cox TR. Charting the unexplored extracellular matrix in cancer. Int J Exp Pathol. 2018;99(2):58–76. doi:10.1111/iep.12269
29. Gilkes DM, Semenza GL, Wirtz D. Hypoxia and the extracellular matrix: drivers of tumour metastasis. Nat Rev Cancer. 2014;14(6):430–439. doi:10.1038/nrc3726
30. Walker C, Mojares E, Del Río Hernández A. Role of extracellular matrix in development and cancer progression. Int J Mol Sci. 2018;19:10. doi:10.3390/ijms19103028
31. Pickup MW, Mouw JK, Weaver VM. The extracellular matrix modulates the hallmarks of cancer. EMBO Rep. 2014;15(12):1243–1253. doi:10.15252/embr.201439246
32. Kumar A, Choudhary S, Adhikari JS, Chaudhury NK. Sesamol ameliorates radiation induced DNA damage in hematopoietic system of whole body gamma-irradiated mice. Environ Mol Mutagen. 2018;59(1):79–90. doi:10.1002/em.22118
33. Isaacson KJ, Martin Jensen M, Subrahmanyam NB, Ghandehari H. Matrix-metalloproteinases as targets for controlled delivery in cancer: an analysis of upregulation and expression. J Control Release. 2017;259:62–75. doi:10.1016/j.jconrel.2017.01.034
34. Bell R, Barraclough R, Vasieva O. Gene expression meta-analysis of potential metastatic breast cancer markers. Curr Mol Med. 2017;17(3):200–210. doi:10.2174/1566524017666170807144946
35. Shen CJ, Kuo YL, Chen CC, Chen MJ, Cheng YM. MMP1 expression is activated by Slug and enhances multi-drug resistance (MDR) in breast cancer. PLoS One. 2017;12(3):e0174487. doi:10.1371/journal.pone.0174487
36. Liu M, Hu Y, Zhang MF, et al. MMP1 promotes tumor growth and metastasis in esophageal squamous cell carcinoma. Cancer Lett. 2016;377(1):97–104. doi:10.1016/j.canlet.2016.04.034
37. Yokoi A, Yoshioka Y, Yamamoto Y, et al. Malignant extracellular vesicles carrying MMP1 mRNA facilitate peritoneal dissemination in ovarian cancer. Nat Commun. 2017;8:14470. doi:10.1038/ncomms14470
38. Ostermann G, Weber KS, Zernecke A, Schroder A, Weber C. JAM-1 is a ligand of the beta(2) integrin LFA-1 involved in transendothelial migration of leukocytes. Nat Immunol. 2002;3(2):151–158. doi:10.1038/ni755
39. Futosi K, Fodor S, Mocsai A. Neutrophil cell surface receptors and their intracellular signal transduction pathways. Int Immunopharmacol. 2013;17(3):638–650. doi:10.1016/j.intimp.2013.06.034
40. Chan JR, Hyduk SJ, Cybulsky MI. Alpha 4 beta 1 integrin/VCAM-1 interaction activates alpha L beta 2 integrin-mediated adhesion to ICAM-1 in human T cells. J Immunol. 2000;164(2):746–753. doi:10.4049/jimmunol.164.2.746
41. Weber C, Lu CF, Casasnovas JM, Springer TA. Role of alpha L beta 2 integrin avidity in transendothelial chemotaxis of mononuclear cells. J Immunol. 1997;159(8):3968–3975. doi:10.4049/jimmunol.159.8.3968
42. Boguslawska J, Kedzierska H, Poplawski P, Rybicka B, Tanski Z, Piekielko-Witkowska A. Expression of genes involved in cellular adhesion and extracellular matrix remodeling correlates with poor survival of patients with renal cancer. J Urol. 2016;195(6):1892–1902. doi:10.1016/j.juro.2015.11.050
43. ITGAL protein expression summary-The Human Protein Atlas. Available from: https://www.proteinatlas.org/ENSG00000005844-ITGAL.
 © 2023 The Author(s). This work is published and licensed by Dove Medical Press Limited. The
full terms of this license are available at https://www.dovepress.com/terms
and incorporate the Creative Commons Attribution
- Non Commercial (unported, 3.0) License.
By accessing the work you hereby accept the Terms. Non-commercial uses of the work are permitted
without any further permission from Dove Medical Press Limited, provided the work is properly
attributed. For permission for commercial use of this work, please see paragraphs 4.2 and 5 of our Terms.
© 2023 The Author(s). This work is published and licensed by Dove Medical Press Limited. The
full terms of this license are available at https://www.dovepress.com/terms
and incorporate the Creative Commons Attribution
- Non Commercial (unported, 3.0) License.
By accessing the work you hereby accept the Terms. Non-commercial uses of the work are permitted
without any further permission from Dove Medical Press Limited, provided the work is properly
attributed. For permission for commercial use of this work, please see paragraphs 4.2 and 5 of our Terms.