Back to Journals » Infection and Drug Resistance » Volume 13
Transcriptome Analysis Reveals the Resistance Mechanism of Pseudomonas aeruginosa to Tachyplesin I
Authors Hong J, Jiang H, Hu J, Wang L, Liu R
Received 9 August 2019
Accepted for publication 17 December 2019
Published 16 January 2020 Volume 2020:13 Pages 155—169
DOI https://doi.org/10.2147/IDR.S226687
Checked for plagiarism Yes
Review by Single anonymous peer review
Peer reviewer comments 5
Editor who approved publication: Dr Sahil Khanna
Video abstract presented by Jun Hong.
Views: 725
Jun Hong, 1, 2 Honghao Jiang, 1 Jianye Hu, 1 Lianzhe Wang, 1 Ruifang Liu 1
1College of Life Science and Engineering, Henan University of Urban Construction, Ping Dingshan 467036, People’s Republic of China; 2Henan Province Key Laboratory of Water Pollution Control and Rehabilitation Technology, Henan University of Urban Construction, Pingdingshan, Henan 467036, People’s Republic of China
Correspondence: Lianzhe Wang
College of Life Science and Engineering, Henan University of Urban Construction, Ping Dingshan 467036, People’s Republic of China
Tel +86-180 3758 0131
Email [email protected]
Background: Tachyplesin I is a cationic antimicrobial peptide with a typical cyclic antiparallel β-sheet structure. We previously demonstrated that long-term continuous exposure to increased concentration of tachyplesin I can induce resistant Gram-negative bacteria. However, no significant information is available about the resistance mechanism of Pseudomonas aeruginosa (P. aeruginosa) to tachyplesin I.
Materials and Methods: In this study, the global gene expression profiling of P. aeruginosa strain PA-99 and P. aeruginosa CGMCC1.2620 (PA1.2620) was conducted using transcriptome sequencing. For this purpose, outer membrane permeability and outer membrane proteins (OMPs) were further analyzed.
Results: Transcriptome sequencing detected 672 upregulated and 787 downregulated genes, covering Clusters of Orthologous Groups (COGs) of P. aeruginosa strain PA-99 compared with PA1.2620. Totally, 749 differentially expressed genes (DEGs) were assigned to 98 Kyoto Encyclopedia of Genes and Genomes (KEGG) pathways, and among them, a two-component regulatory system, a beta-lactam resistance system, etc. were involved in some known genes resistant to drugs. Additionally, we further attempted to indicate whether the resistance mechanism of P. aeruginosa to tachyplesin I was associated with the changes of outer membrane permeability and OMPs.
Conclusion: Our results indicated that P. aeruginosa resistant to tachyplesin I was mainly related to reduced entry of tachyplesin I into the bacterial cell due to overexpression of efflux pump, in addition to a decrease of outer membrane permeability. Our findings were also validated by pathway enrichment analysis and quantitative reverse transcription polymerase chain reaction (RT-qPCR). This study may provide a promising guidance for understanding the resistance mechanism of P. aeruginosa to tachyplesin I.
Keywords: antibiotic resistance, tachyplesin I, P. aeruginosa, differentially expressed genes, outer membrane permeability, outer membrane proteins
Introduction
Pseudomonas aeruginosa (P. aeruginosa) is a Gram-negative and ubiquitous environmental bacterium. It is also an opportunistic human pathogen capable of causing a wide array of life-threatening acute and chronic infections, particularly in patients with compromised immune defense. A potential alternative to antibiotics for the control of P. aeruginosa and other microbes is antimicrobial peptides (AMPs). A number of AMPs have been reported to have a satisfactory inhibitory effect on P. aeruginosa, such as LL-37, tachyplesin, polymyxin, and helical peptides extracted from snakes.1,2
During co-evolution of hosts and bacterial pathogens, bacteria have developed an ability to sense and initiate an adaptive response to AMPs to resist their bactericidal activity. Previous studies indicated that Gram-negative pathogens exhibited resistance mechanisms of AMPs, including proteolytic degradation of AMPs, shielding of the bacterial surface, modification of the bacterial outer membrane, pumping AMPs into or out of the cell, downregulation of AMP expression,3,4 diverse genetic alterations, and alterations of amino acids and carbohydrate metabolism.5,6
Some bacteria (e.g., P. aeruginosa) also could develop resistance to a number of AMPs, such as polymyxin,7 and reports on resistance of polymyxins in P. aeruginosa have increased. A growing number of P. aeruginosa strains demonstrated resistance to AMPs due to mutations in two-component regulatory systems (e.g., PhoPQ and PmrAB). These two-component regulatory systems play substantial roles in lipid A modification systems, in which P. aeruginosa may become resistant to polymyxin.8 The arnBCADTEF operon encodes genes that modify lipopolysaccharide (LPS) by the addition of 4-aminoarabinose to the lipid A moiety, thereby reducing the negative charge on LPS and its ability to mediate the self-promoted uptake across the outer membrane of AMPs. The regulation of LPS modifications in P. aeruginosa is possibly involved in the complex regulatory network, mediating adaptive resistance to AMPs by at least 4 two-component regulatory systems (e.g., PmrAB, PhoPQ, ParRS, and CprRS).9 The molecular mechanisms of antibiotic resistance in P. aeruginosa are mainly involved in changes of porins and efflux pumps, however, it needs to be indicated whether the resistance of AMPs in P. aeruginosa is also involved in these changes?
Tachyplesin I, a 17-amino acid cationic antimicrobial peptide (CAMP), was originally isolated from hemocytes of marine horseshoe crabs in 1988.10 With potent and broad-spectrum activities against both Gram-positive and Gram-negative bacteria, tachyplesin I has been found as a promising candidate for the development of anti-infection, anti-tumor, and anti-virus drugs.11–13 Bacterial resistance to tachyplesin I has been induced in Aeromonas hydrophila XS91-4-1, P. aeruginosa CGMCC1.2620 (PA1.2620), P. aeruginosa ATCC27853 (PA27853), Escherichia coli ATCC25922 and F41 with cross-resistance to other AMPs (e.g., pexiganan, tachyplesin III, and polyphemusin I), conventional antimicrobial agents (amikacin), as well as the potential involvement of extracellular proteases in mediating tachyplesin I-resistance in Gram-negative bacteria reported in previous studies.14,15 A limited number of researches concentrated on the mechanism of bacterial resistance to tachyplesin I.14–16 However, the resistance mechanism of P. aeruginosa to tachyplesin I has largely remained elusive.
RNA sequencing (RNA-Seq) is an advanced method for transcriptome profiling that can provide more precise measurement for genome-wide quantitative analysis of all types of transcripts (including coding, non-coding, and antisense) with a relatively high accuracy. RNA-Seq can reveal specific biological processes, such as biological evolution, basic metabolism, disease occurrence, and drug targets. In addition to the extensive utilization of RNA-Seq in clinical researches, it is very sensitive for measuring low abundance genes.17 In the present study, we employed RNA-Seq to investigate differences in genome-wide gene expression between tachyplesin I-resistant PA-99 and the original strain PA1.2620, followed by validation of our findings via pathway enrichment analysis and quantitative reverse transcription polymerase chain reaction (RT-qPCR). Then, the bacterial outer membrane permeability and outer membrane proteins (OMPs) were further analyzed to reveal the resistance mechanism of P. aeruginosa to tachyplesin I. The findings may contribute to enhance our understanding of the resistance mechanism of P. aeruginosa to tachyplesin I.
Materials and Methods
Strains, Media, and Growth Conditions
PA1.2620 was provided by China General Microbiological Culture Collection Center (CGMCC; Beijing, China). P. aeruginosa ATCC27853 (PA27853) was provided by the laboratory of the College of Life Science and Engineering, Henan University of Urban Construction (Pingdingshan, China). The minimal inhibitory concentration (MIC) values of tachyplesin I were 10 and 5 μg/mL for PA1.2620 and PA27853, respectively, in which these two strains were sensitive to tachyplesin I. Tachyplesin I-resistant mutants (PA-99 and P. aeruginosa ATCC27853-88-2 (PA-88)) were synthesized in our laboratory as described previously.14,15 These strains were cultured in Mueller-Hinton broth (MHB) medium, and then seeded onto nutrient agar plates at 30°C or 37°C.
Tachyplesin I
Tachyplesin I (>95% purity) was synthesized by Gil Biochemical Co., Ltd. (Shanghai, China), and its sequence was as follows: NH2-K-W-C-F-R-V-C-Y-R-G-I-C-Y-R-R-C-R-CONH2, including two disulfide bonds (C3–C16 and C7–C12).10 It was dissolved in sterile water to yield a 10 mg/mL stock solution, which was filter-sterilized before utilization. Peptide solution was freshly prepared on the day of the assay or stored at −20°C for a short period of time.
Selection of PA-99 and PA-88 Mutant Strain Resistance to Tachyplesin I
Bacteria were cultured in MHB with constant shaking at 160 rpm at 30°C (PA1.2620) or 37°C (PA27853). We transferred bacteria daily by inoculating 20 μL stationary phase culture in 2 mL MHB. All cells were initially grown in medium without tachyplesin I for five transfers. At the 6th transfer, 20 μL cell suspension was added to 2 mL MHB with or without tachyplesin I at a final concentration equal to half of MIC with shaking for 15 transfers at 160 rpm for 20 h. The bacteria were thereafter transferred into broth containing a double concentration of tachyplesin I every 10 transfers or more frequently, if the selected strains showed weak growth. The experiment was conducted for 88–99 serial transfers. All experiments were performed in duplicate.
RNA Isolation, cDNA Library Construction, and Transcriptome Sequencing
PA1.2620 original strain and PA-99 mutant were grown overnight for within 12 h in 3 mL MHB medium at 30°C, and shaken at 180 rpm. Then, cultures were refreshed with medium to OD600nm=0.2 and grown to mid-exponential phase (OD600nm=1.0) until the time of harvesting. Extraction and purification of the total RNA from the cells were carried out using a Bacterial Total RNA Purification Kit (Sangon Biotech Co., Ltd., Shanghai, China). To ensure the use of total RNA sequencing for transcriptome analysis, quality, quantity, and integrity of extraction were analyzed by using a NanoDrop 2000 Spectrophotometer (Thermo Fisher Scientific, Waltham, MA, USA), gel electrophoresis, and an Agilent 2100 Bioanalyzer (Agilent Technologies Inc., Santa Clara, CA, USA), respectively. All experiments were performed in triplicate.
After the samples of total RNA passed the test, the library construction was carried out. The main procedures for library construction were as follows: First, remove 16S ribosomal RNA (16S rRNA) of prokaryotes with a probe complementary to the rRNA gene sequencing technique. Second, join the fragmentation buffer in rRNA-depleted RNA and randomly interrupt it. Third, deplete rRNA as a template, synthesize the first cDNA chain using six random primers, then, add the buffer, dUTP, dATP, dGTP, dCUP, RNase H, and DNA polymerase I to synthesize the second cDNA chain using AMPure XP Beads purifying cDNA. AMPure XP Beads were utilized to select strand size. Special enzymes were used to degrade the second strand of cDNA containing U bases. Finally, the cDNA library was constructed by PCR enrichment.
The RNA-Seq libraries of six samples were prepared and subsequently sequenced using the Illumina HiSeq 2500 Platform (Illumina Inc., San Diego, CA, USA) according to the manufacturer’s instructions. The construction of the libraries and the transcriptome sequencing were performed by Biomarker Biotechnology Co., Ltd. (Beijing, China).
Analysis and Assembly of RNA-Seq Data
Based on sequencing by synthesis technology, the clean reads were assembled using the Illumina HiSeq 2500 platform (Illumina Inc., San Diego, CA, USA). Generally, the raw reads contain tiny minority primer sequences, adapter sequences, sequencing connector, and other potential contaminants. Prior to subsequent analysis, the clean reads were filtered from the raw reads by removing the reads with only adaptor and unknown nucleotides.
The clean reads obtained from RNA-Seq were mapped on the reference genome of P. aeruginosa PAO1 by Bowtie-2 software, and only mapped data were used for subsequent analysis.18 Data analysis and base-calling were undertaken by using Illumina sequencing software (Illumina Inc., San Diego, CA, USA).
Gene Expression Analysis
To evaluate the expression level of all reads, each UniGene cluster was compared via UniGene database by using Bowtie-2 software, and normalized into RPKM (Reads Per Kilobase of transcript per Million fragments mapped) values according to the following formula: RPKM = (Map the UniGene cluster)/[Map all UniGene clusters (million)]) × (The length of UniGene cluster (kb)).1 Besides, differentially expressed genes (DEGs) with a false discovery rate (FDR < 0.01) and a fold change of ≥2 were selected for analysis.19 Functional annotation of each UniGene cluster was searched against various protein databases, and identified by annotation information of the given UniGene cluster that has the highest sequence similarity with the tested one. All UniGene clusters were also searched in the National Center for Biotechnology Information (NCBI)’s non-redundant protein database (Nr), Swiss-Prot database, and Cluster of Orthologous Groups (COGs) of proteins using BLAXTX with an E-value of less than 10–5.20 The Blast2GO program and WEGO software were also employed to obtain the gene ontology (GO) annotations and the distribution of gene functions for each UniGene cluster using a value of less than 10–5.21 Assignment of each UniGene cluster to different pathways was carried out by searching in the Kyoto Encyclopedia of Genes and Genomes (KEGG) database using the KEGG Automatic Annotation Server.22 DEGs were annotated in the Comprehensive Antibiotic Resistance Database (CARD) to find out the antibiotic resistance genes.23
Validation by RT-qPCR
To increase the reliability of the analysis, RT-qPCR was conducted to verify some of the changes in expressions detected by RNA-Seq. Herein, 10 target genes were respectively selected from PA-99 mutant and the original strain PA1.2620 for analysis by RT-qPCR. For two strains, RT-qPCR was carried out in triplicate. Moreover, RT-qPCR was undertaken on an ABI 7900 Real-Time PCR system (Applied Biosystems, Foster City, CA, USA) using KAPA SYBR FAST qPCR kit (Kapa Biosystems Inc., Wilmington, MA, USA). Specific primers of the genes showed in Supplementary Table S1 were designed using Primer Premier 5 software based on the genome sequence of P. aeruginosa. The thermal cycler conditions were as follows: 40 cycles of denaturation at 94°C for 20 s, annealing at 60°C for 20 s, and extension at 72°C for 30 s. Using 16SrRNA as a reference, relative expression levels of the genes were quantified using 2−ΔΔCt method.24
NPN Assay to Determine Outer Membrane Permeability
Outer membrane permeability was determined by using the NPN assay with minor modification.25 Cells were harvested from overnight cultures by centrifugation, washing, and re-suspending in 25 mM Tris-HCl (pH 7.2). The value of OD600 was adjusted to 0.5 with the same buffer; however, the exact OD600 was measured and recorded. In addition, 80 μL of NPN (1 mM) was swiftly mixed with 1.92 mL of the above-mentioned cell suspension. The fluorescence of the mixture was monitored immediately by a spectrofluorometer (PerkinElmer, Waltham, MA, USA). The wavelengths of excitation, emission, and slits were 350, 420, and 5 nm, respectively. The permeability was indicated by the fluorescence absorption per OD600 value of the sample.
Analysis of OMPs
Preparation of OMPs and Determination of Their Total Contents
OMPs of the original and mutant strains were extracted by a previously described method26 with minor modification. A single colony was selected, which inoculated in 2 mL MHB medium, P. aeruginosa strains at 30°C or 37°C for 18 h at 180 r/min. After the culture was inoculated in 100 mL MHB medium for 4 h under the same condition, the cells were centrifuged (at 6000 ×g for 10 min at 4°C), suspended in 15 mL of 10 mM phosphate-buffered saline (PBS, pH 7.0) containing 0.14 mol/L β-mercapto ethanol, and disrupted by ultrasonic wave for 6 min in ice bath. Cellular debris was removed by centrifugation at 6000 ×g for 10 min at 4°C. The supernatant was centrifuged at 10,000 ×g for 30 min at 4°C. Outer membrane precipitation collected was added to 5 mL of 2% sodium lauroyl sarcosinate (Sarkosyl; Sigma-Aldrich, St. Louis, MO, USA) and 5 mL of 10 mM PBS (pH 7.0) incubated at room temperature overnight. The mixture was centrifuged at 20,000 ×g for 90 min to recover the detergent-solubilized OMPs. The pelleted proteins were resuspended in 3 mL of 10 mM PBS (pH 7.0), incubated with 1% sarkosyl at room temperature for 20 min, and recovered by ultracentrifugation as described above. The final pellet was re-suspended in 1 mL of 10 mM PBS and stored at −20°C until analysis.
The content of OMPs was determined by ultraviolet absorption spectroscopy according to the following formula: protein concentration (mg/mL) = 1.45 * OD280 - 0.74 * OD260. Protein concentration was adjusted for a final concentration of 45 μg/mL, and the protein samples were stored at –80°C.
SDS-PAGE Assay and Calculating the Molecular Weight of the Protein
Sodium dodecyl sulfate-polyacrylamide gel electrophoresis (SDS-PAGE) was carried out with 12% separating gel and 5% concentrating gel after preparation of OMPs was solubilized according to 1:4 (V/V) at 100°C for 5 min in 1 M Tris-HC1 buffer (10% SDS, 5% 2-mercaptoethanol, 50% glycerol, and 0.1% bromophenol blue). When the molecular weight of the protein was between 15,000 and 200,000 Da, electrophoretic mobility and logarithm of molecular weight showed a linear relationship according to the equation of LgMr = K - bmR; where Mr represents the molecular weight of protein; K is a constant; and mR denotes the relative mobility. Under certain conditions, both b and K are constant. A standard curve can be obtained by plotting the logarithm of the molecular weight of standard proteins with known molecular weight. Those proteins with unknown molecular weight underwent electrophoresis under the same conditions, in which the molecular weight could be obtained by the standard curve according to its electrophoretic mobility.
Results
Selection of Tachyplesin I-Resistant PA-99 and PA-88 Mutants
We experimentally induced bacterial resistance to tachyplesin I in P. aeruginosa in vitro for long term, in which concentration of tachyplesin I continuously increased. High-resistance to tachyplesin I was developed after 99 serial transfers in PA1.2620 and 88 serial transfers in PA27853. There were significant differences in the MIC values for PA1.2620 and PA27853 between the induced strains and the corresponding induced strains for treatment. The MIC values of tachyplesin I were 150 and 80 μg/mL for PA-99 and PA-88 mutants, respectively, in which these two mutants were highly resistant to tachyplesin I. Considering the expenses of the experiments, the similarity of strain, and the higher resistant to tachyplesin I, we only investigated differences in genome-wide gene expression between tachyplesin I-resistant PA-99 and PA1.2620 by RNA-Seq analysis.
Sequence Analysis and Assembly
Transcriptome sequencing of six cDNA libraries was performed by using total RNA extracted from tachyplesin I-resistant PA-99 strain and the original strain PA 1.2620. After filtering raw data and passing quality control, clean data of each sample were no less than 2.11 Gb, GC content of clean data was above 62.57%, and Q30 base reached over 95.42% (Table 1). These data were selected as high-quality reads for further analysis.
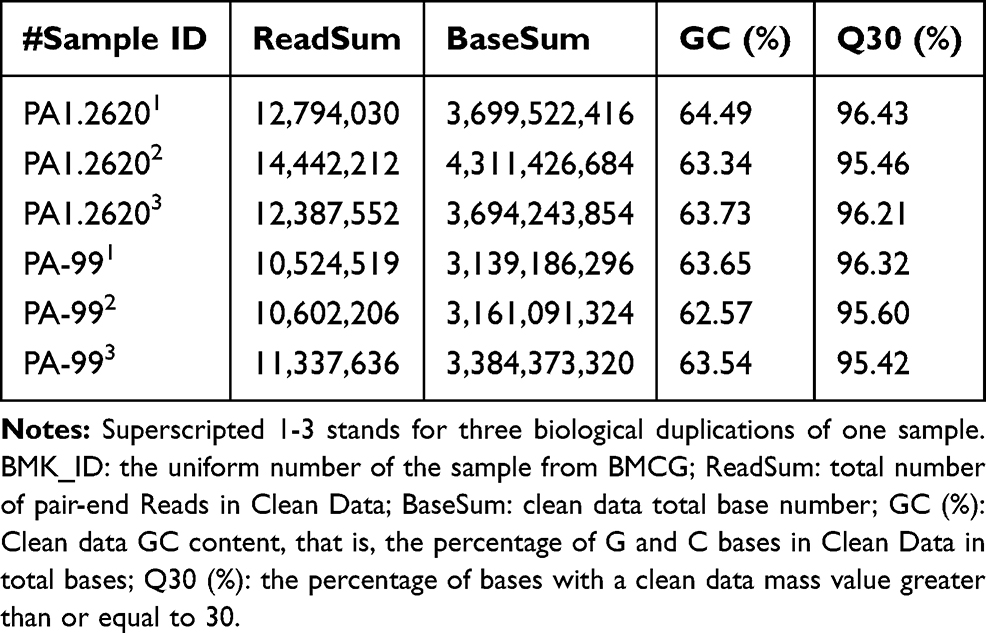 |
Table 1 Transcriptome Sequencing Summary for Different P. aeruginosa Strains |
By evaluating the transcriptome of sequencing data of six samples, including those mapped to the reference genome, randomness testing of mRNA fragmentation, saturation testing of data, and distribution of reads on the reference genome, the results revealed that the transcriptome data obtained were ideal and reliable in terms of quality. The data related to quality and mapping statistical data are presented in Supplementary Table S2.
In the result of transcriptome sequencing, we found a correlation between one biological replicate and the other two replicates, with low correlations (0.4689, 0.4735) among the three biological replicates of the original strain PA1.2620, whereas R2 between the other two samples was 0.9931 (see Supplementary Table S3). The reason may be that the one biological replicate was prepared and tested without any association with the other two biological replicates. Considering the accuracy of the results, we deleted one biological replicate with a low correlation. Therefore, the expression profiling analysis was undertaken based on the two biological replicates of PA1.2620.
Gene Expression Analysis and Functional Annotation
To investigate the changes in transcription levels before and after PA1.2620 resistant to tachyplesin I, we selected tachyplesin I-resistant PA-99 mutant and the original strain PA1.2620 to perform expression profiling analysis. Results of hierarchical clustering and volcano plots are shown in Figure 1A and B. As illustrated in Figure 1A, PA-99 resistant mutant had several DEGs compared with the original strain, and log2FC values of expression levels were mainly distributed at the range of −5 and 5. There were 1459 DEGs with 318 novel genes, including 672 (10.64%) upregulated genes and 787 (12.45%) downregulated genes among 6318 genes. There were 254 downregulated genes in the 318 novel genes. Besides, the expression of 57 genes was upregulated with more than 5-fold changes, and the expression of 30 genes was downregulated with more than 20-fold changes. According to BLAST analysis, the three upregulated and downregulated genes were described as hypothetical proteins in the DEGs. The novel gene (gene ID: Novel_392) and PA2754a were both downregulated form of the above-mentioned genes, and no homologous proteins were found by BLAST analysis. The third downregulated gene was PA2764 (log2FC=−16.39), and its homologous protein was alpha/beta hydrolase superfamily. The most significantly upregulated gene was PA0912, which had high homology with the lipoprotein-related gene of Pseudomonas stutzeri. The second upregulated gene was Novel_146. The third upregulated gene was Novel_94 (Novel_94), and its homologous protein was RNA polymerase-binding transcription factor (DksA). It needs to be further indicated whether PA-99 resistant to tachyplesin I was associated with the changes in highly expressed genes described as hypothetical proteins. Numerous DEGs related to drug resistance were identified, which mainly involved in efflux pumps, porins, OMPs, two-component regulatory systems, etc. We speculated that these DEGs may play a substantial role in PA-99 resistant to tachyplesin I.
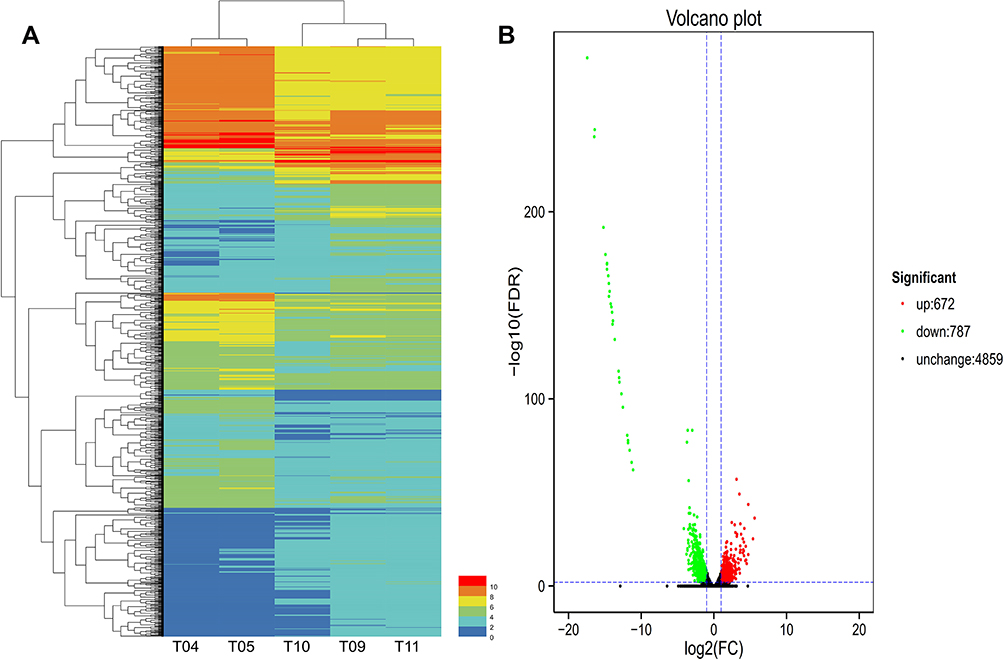 |
Figure 1 Hierarchical clustering and Volcano plot of differential expression in PA1.2620 original strain vs PA-99 mutant. (A). Hierarchical clustering. T04-T05 stands for two biological duplications of PA1.2620 strain, T09-T11 stands for three biological duplications of tachyplesin I-resistant PA-99 strain. Each column represents one sample, and each row represents one gene. The red and green gradients indicate an increase and a decrease in gene expression abundance, respectively. (B). Volcano plot. Each point in the volcano plot represents one gene, and the abscissa represents the logarithm of the expression difference fold of one gene in PA1.2620 original strain vs PA-99 mutant. This vertical axis represents the negative logarithm of the error detection rate. The green dots represent downregulated genes, the red dots represent upregulated genes and the black dots represent unchanged genes. |
All DEGs of PA1.2620 versus PA-99 were tested for functional annotation using COG, GO, KEGG, Swiss-Prot, NR, and Pfam databases, in which the number of DEGs annotated in different databases is presented in Table 2.
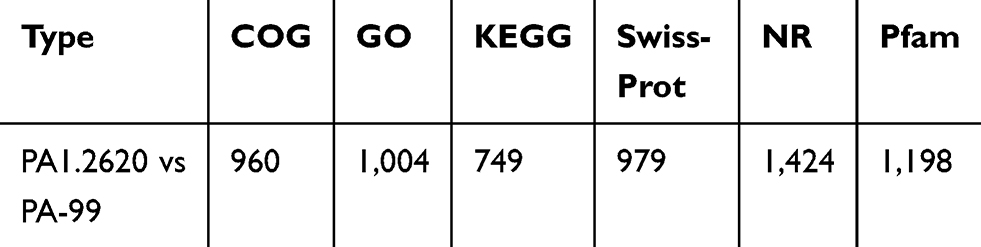 |
Table 2 The Numbers Statistics of Annotated DEGs |
A further functional classification of all DEGs in 5 samples was performed using the GO database. The DEGs of GO annotation classification indicated that P. aeruginosa resistant to tachyplesin I was enriched in cellular components (CCs), molecular functions (MFs), and biological processes (BPs), which was subdivided into 43 functional groups, as shown in Figure 2A and Supplementary Table S4. In BPs, DEGs were mainly related to localization, single-organism process, cellular process, and cell killing. In CCs, the differences in enrichment trends were related to cell (26.49% vs 31.27%), macromolecular complex (3.78% vs 4.75%), organelle (1.59% vs 2.67%), and cell part (26.49% vs 31.27%) in DEGs. For MFs, the differences in enrichment trends in DEGs were related to receptor activity (1.49% vs 2.44%), transporter activity (11.35% vs 12.69%), and binding (46.51% vs 47.64%). Collected data from CCs, MFs, and BPs suggested that P. aeruginosa resistant to tachyplesin significantly affected cell, cell part, receptor activity, transporter activity, and binding.
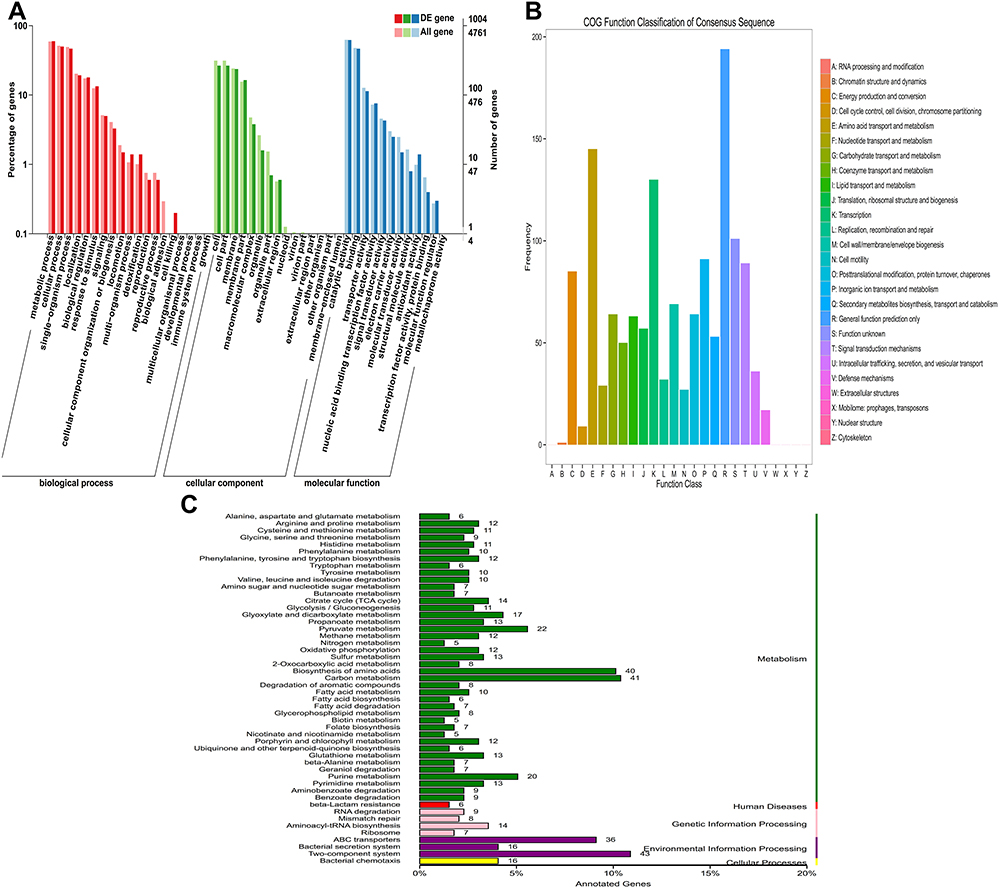 |
Figure 2 Functional annotation of DEGs in PA1.2620 original strain vs tachyplesin-resistant PA-99 mutant. (A). GO enrichment categorization; (B). COG classification; (C). KEEG categorization. |
Next, DEGs were further analyzed by COG enrichment analysis. COG was classified into 21 functional categories, as illustrated in Figure 2B and Supplementary Table S5. The top 3 COG classes based on the percentage in total COG were as follows: general functional prediction (20.20%), amino acid transport and metabolism (15.10%), and transcription (13.54%), in which they totally accounted for 48.85% of COG. These 3 COG classes may be closely associated with P. aeruginosa resistant to tachyplesin I. The following ranked COG was unknown function (10.52%), inorganic ion transport and metabolism (9.48%), signal transduction pathways (9.28%), energy production and conversion (8.85%), cell wall/membrane/envelope biogenesis (7.19%), posttranslational modification, protein turnover, chaperones (6.67%), carbohydrate transport and metabolism (6.67%), and lipid transport and metabolism (6.56%). In the above-mentioned 11 COG categories, each category accounted for over 6%, which may be related to resistance to tachyplesin I. Meanwhile, COG categories without functional changes included RNA processing and modification, nuclear structure, as well as cytoskeleton and extracellular structures, indicating that P. aeruginosa resistant to tachyplesin I did not have any correlation with these functions.
In total, with the help of KEGG pathway analysis, 749 DEGs were assigned to 98 KEGG pathways. These pathways were mainly divided into “the genetic information processing”, “cellular processes”, “environmental information processing”, “human diseases”, and “metabolism” (Figure 2C). Among them, the metabolism pathway was involved in the majority of DEGs, including 40 DEGs with the biosynthesis of amino acids (17 upregulated and 23 downregulated genes), carbon metabolism (41 DEGs), pyruvate metabolism (22 DEGs), purine metabolism (20 DEGs), etc. These results showed that the tachyplesin I-resistant PA-99 mutant resulted in the alteration of several metabolic pathways. The two-component regulatory system (ko02020), beta-lactam resistance system (ko01501), lipopolysaccharide biosynthesis (ko00540), and ABC transporter (ko02010) pathways were involved in a number of known drugs resistant to DEGs. In addition, 43 DEGs with 18 novel genes included 23 upregulated and 20 downregulated genes in a two-component regulatory system, in which these genes were mainly related to OmpR family (PhoB, PhoA, PhoP, OprD, etc.), NarL family, NtrC family, and Chemotaxis family (Supplementary Figure S1A). There were 36 DEGs, including 21 upregulated and 15 downregulated genes in ABC transporter (Supplementary Figure S1B). Additionally, 6 DEGs (3 upregulated and 3 downregulated genes) in beta-lactam resistance system were involved in genes encoded by outer membrane porin oprD (gene ID: Novel_156 and Novel_157), efflux pumps of the resistance-nodulation-division family (mexB, PA4374), mexR for repressor of the mexAB-oprM, and armR anti-repressor for mexR (Supplementary Figure S1C).
Annotation and Analysis of Resistant Genes
Firstly, to select the known resistant genes, DEGs were annotated in the CARD database, and a total of 14 antibiotic resistance genes were matched. The resistance mechanisms of these genes mainly involved in antibiotic target alteration (pmrB, mexR), antibiotic efflux (PA2018, PA0156, PA4136, PA3677, PA4374, mexC, mexE, mexB, armR, nalC, PA3521) mainly coding RND efflux pumps, and antibiotic inactivation (PA5514 coding for OXA beta-lactamase). The majority of these genes were upregulated, indicating that the resistance mechanism of P. aeruginosa to tachyplesin I may be related to overexpression of efflux pumps.
Secondly, except for the selected antibiotic resistance genes, according to the gene annotation, DEGs contributed to resistance to antibiotic or AMPs were classified and statistically analyzed. These genes were mainly related to encoded efflux pumps, a two-component regulatory system, a DNA mismatch repair system, etc. (Table 3). Besides, 8 genes from the major facilitator superfamily (MFS) were detected as antibiotic resistance genes, such as PA1131, PA0334, and PA1282 encoded by tetracycline resistance protein, PA4136 encoded by bicyclomycin resistance protein, and PA3573 encoded by multidrug resistance transporter. Moreover, 4 genes (PA2837, PA3404, PA3521/opmE, and PA4592) encoded by outer membrane efflux protein were all upregulated (log2FC≥1.236), as well as 7 genes encoded by outer membrane porin, oprD family with 3 novel-genes and 4 known genes; except for opdB that was upregulated, others were all downregulated. In particular, the PA2760 (oprQ) gene was strongly downregulated (log2FC≥14).
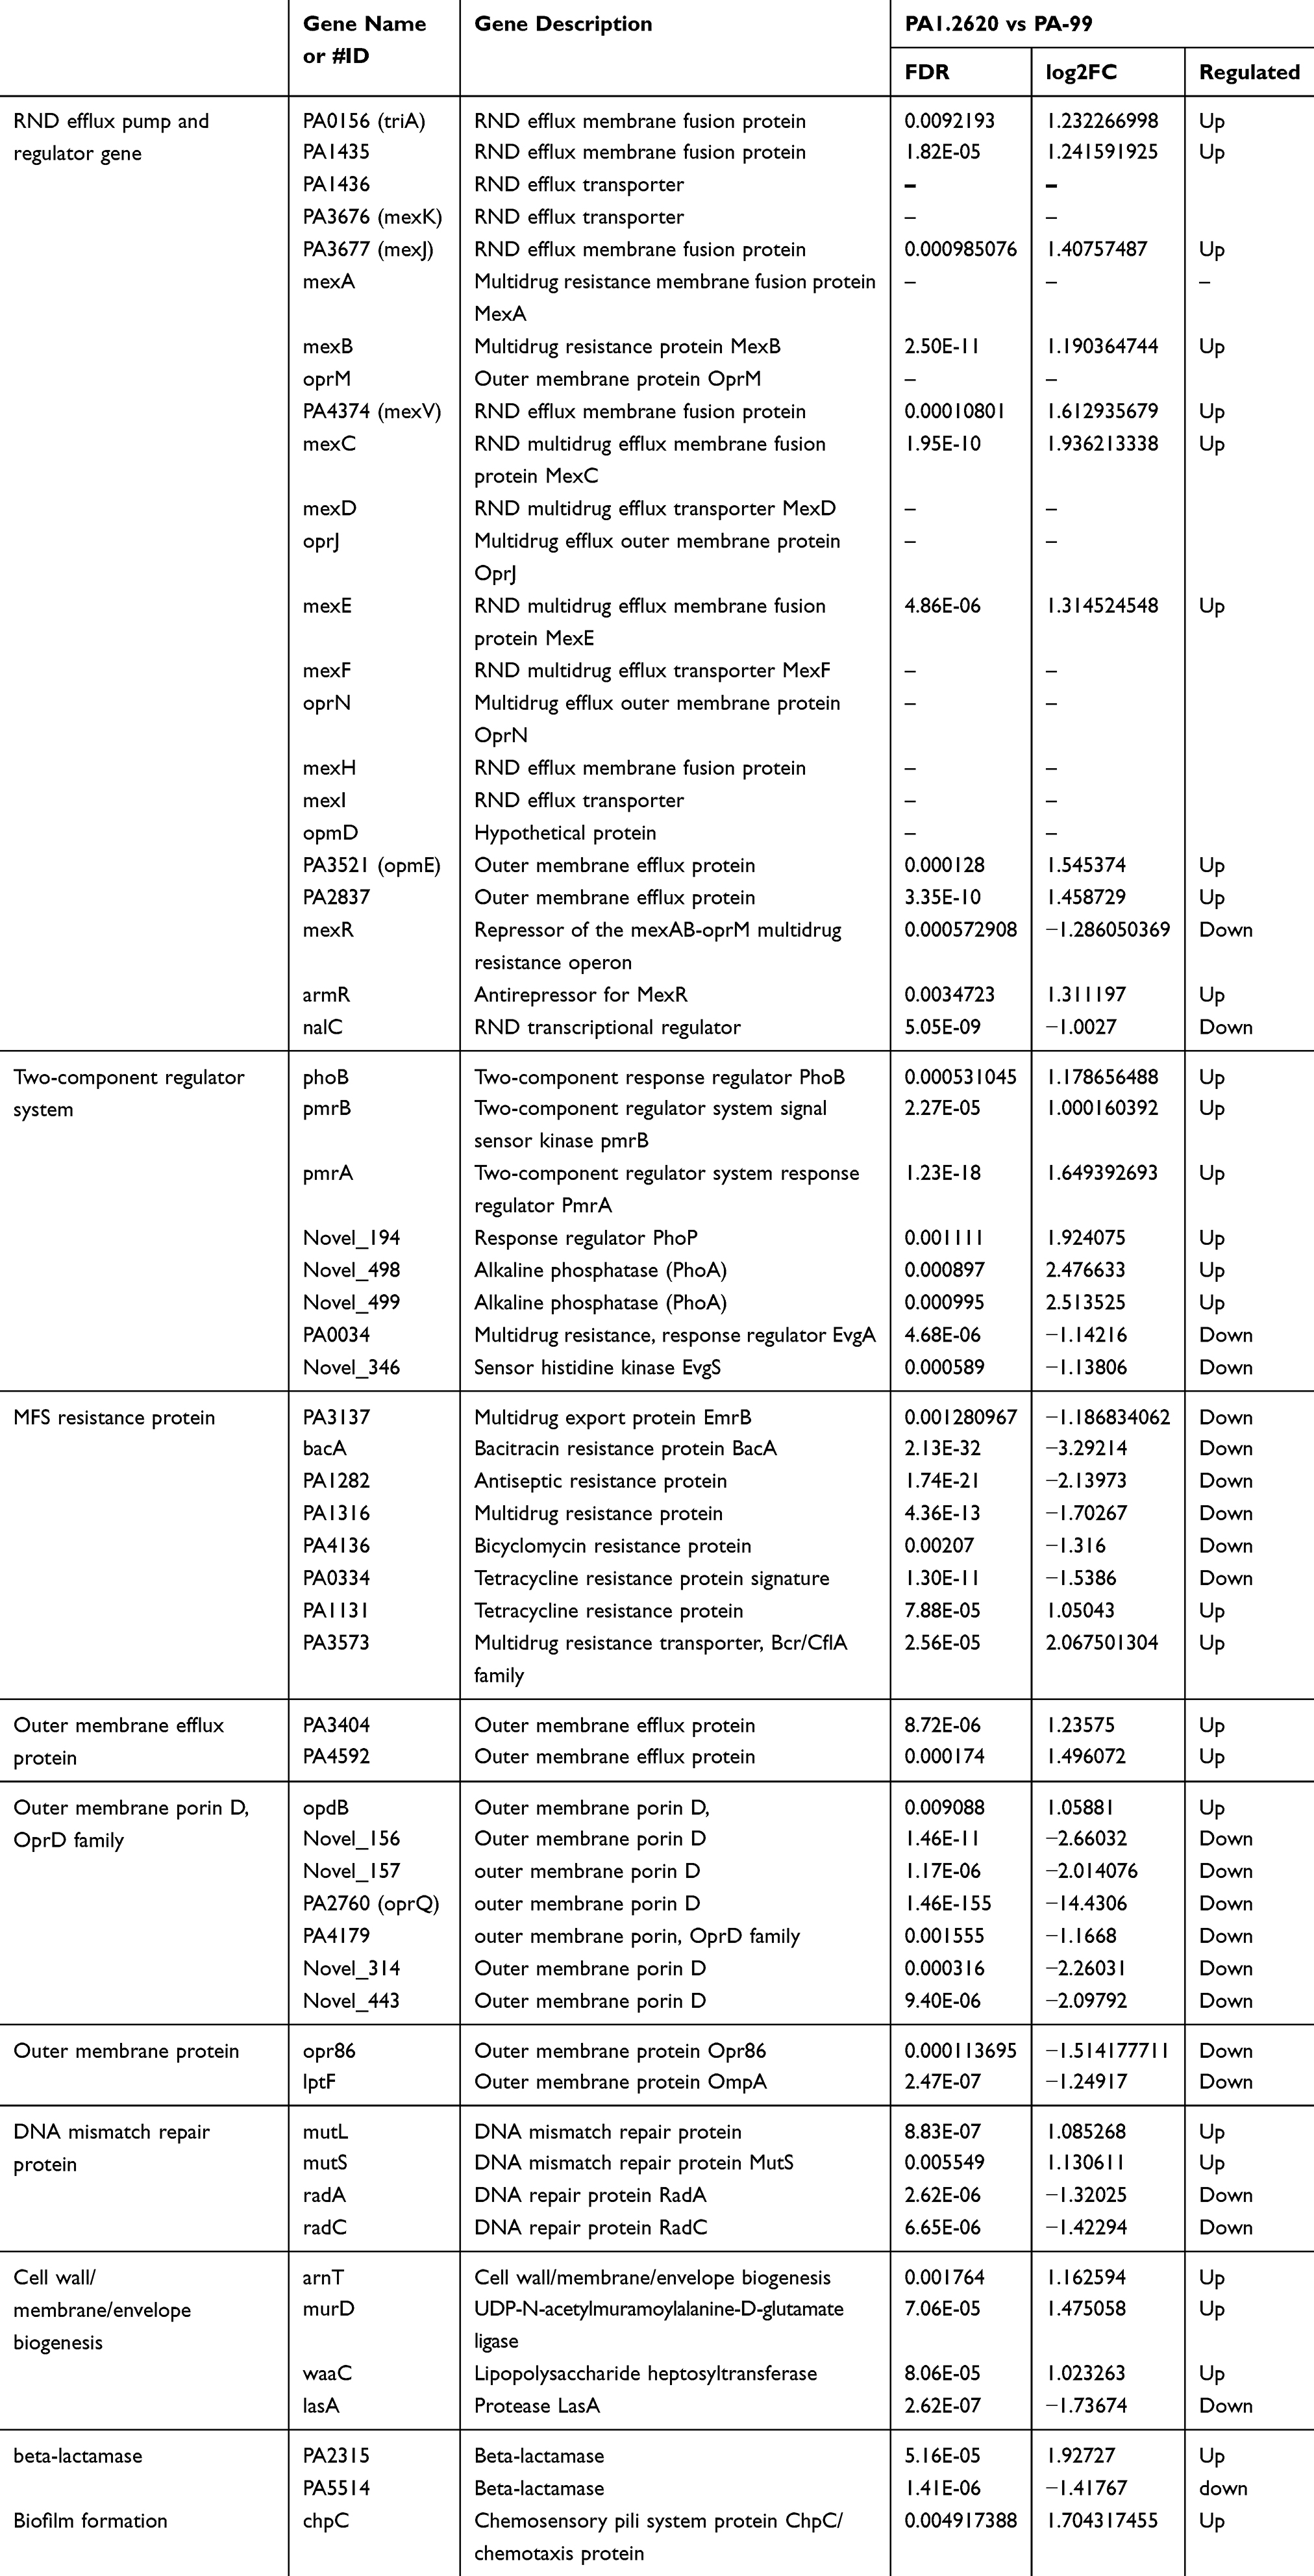 |
Table 3 Expression of Part Genes Related to Drug Resistance |
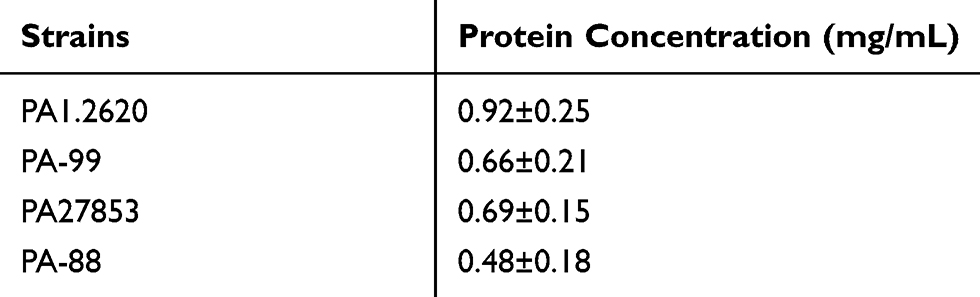 |
Table 4 The Contents of OMPs from Different P. aeruginosa Strains |
According to the above-mentioned results, RND, MFS, and oprD families, and a two-component regulatory system play a pivotal role in P. aeruginosa resistant to tachyplesin I.
Validation via RT-qPCR
To validate the results of transcriptome sequencing, 10 DEGs from tachyplesin I-resistant mutant PA-99 and original strains (e.g., PA1435, PA2018, mexB, PA4396, parR, phoB, PA3573, PA0156, mexC and motB) were randomly selected for RT-qPCR. As displayed in Figure 3, all the selected DEGs showed concordant expression patterns between the RNA-Seq and the results of RT-qPCR.
 |
Figure 3 Illustrating the RT-qPCR conformation results for the 10 selected DEGs. The X-axis represents the selected 10 genes and the Y-axis represents the fold change values derived from RNA-seq and RT-qPCR. |
NPN Assays
To indicate whether P. aeruginosa resistant to tachyplesin I was involved in the changes of the outer membrane permeability, an NPN (n-phenyl-1-naphthylamine) assay was performed in different P. aeruginosa strains. The nonpolar probe NPN tends to stay in a hydrophobic environment and fluoresces strongly in a hydrophobic environment, while weakly in an aqueous environment.
The results of this assay revealed that two tested mutants, namely PA-99 and PA-88 mutants, exhibited weaker outer membrane permeability compared with PA 1.2620 and PA27853, respectively (Figure 4). This provides a tenable explanation for resistance to tachyplesin I, as the peptide would be able to translocate across the outer membrane more difficult than in the original strain. These data indicated that P. aeruginosa resistant to tachyplesin I was associated with the decrease of outer membrane permeability.
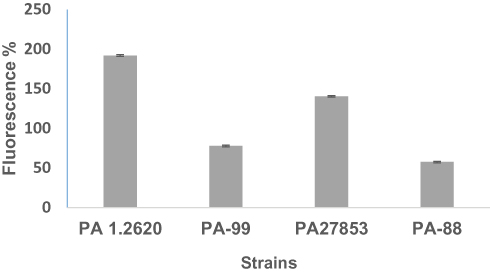 |
Figure 4 Outer membrane permeability of original and mutant strains. |
Analysis of OMPs
To clarify whether OMPs of P. aeruginosa play a role in outer membrane permeability and drug resistance, we detected the content and differences in OMPs in two strains by SDS-PAGE. As shown in Table 4, the total concentration of OMPs was higher in both original strains than that of the resistant-tachyplesin mutants. Figure 5 illustrates the molecular weight and the amount (%) of OMPs extracted from original strains using SDS-PAGE. Additionally, the bands of OMPs were similar in both original strains (Figure 5). According to the standard curve, the relative molecular weight of the tested protein was obtained. A linear regression equation was achieved according to the standard curve: y=−1.0858x+5.4353, R2=0.9934. As depicted in Figure 5A, there were three bands with molecular weights of 69.28, 43, and 46.19 kDa between PA1.2620 original strain and tachyplesin I-resistant PA-99 strain. The molecular weights of two bands (69.28 (A) and 43 kDa) were reduced, while the molecular weight of one band (46.19 kDa (C)) was increased in PA-99 mutant. Similarly, compared with PA27853, the molecular weight of one band (69.28 (A) kDa) was attenuated, while molecular weights of two bands (46.19 (C) and 52.87 kDa (B)) were increased in PA-88 mutant (Figure 5B). The results showed that OMPs in both tachyplesin-resistant P. aeruginosa strains were different.
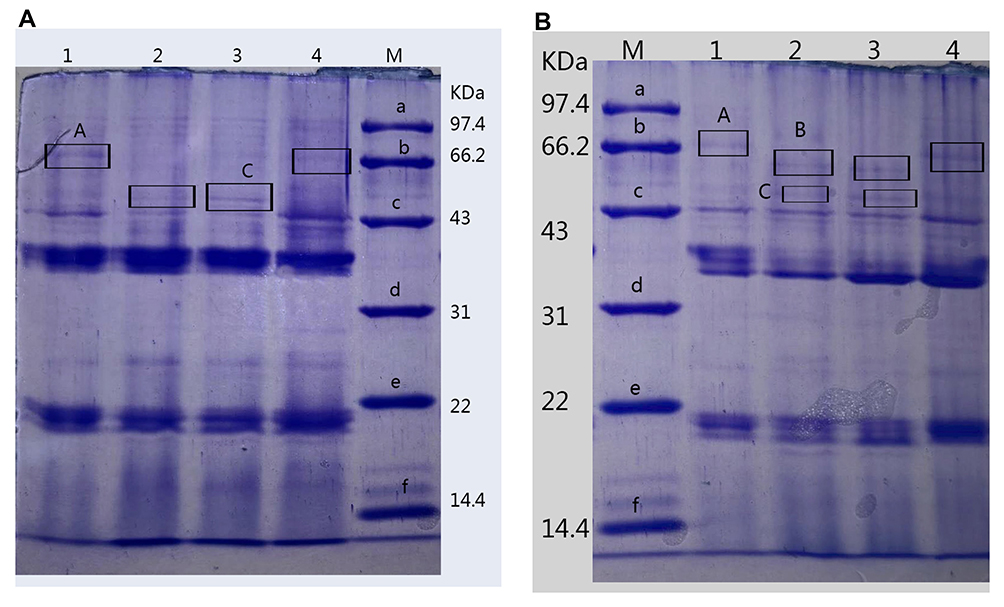 |
Figure 5 Analysis of OMPs of different P. aeruginosa strains. (A). 1, 4: PA1.2620; 2–3: PA-99. (B). 1, 4: PA27853; 2–3: PA-88. Abbreviation: M, standard protein marker. |
Discussion
To our knowledge, this research is the first attempt to explore the resistance mechanism of P. aeruginosa to tachyplesin I using whole-genome expression profiling. For detecting the changes of gene expression in tachyplesin-resistant PA-99 strain relative to the original PA1.2620 strain, transcriptome sequencing was carried out, and the results were further validated by RT-qPCR. From the transcriptome data, we found that a great number of genes exhibited significantly altered expressions.
In order to enhance the accuracy and reliability of the analysis, each test was performed in triplicate in our study. With respect to Pearson’s correlation coefficient (R) as an indicator for evaluation, R2 is the closer to 1, and the correlation between the two repeated samples is the stronger.27 Therefore, in the present study, considering the accuracy of the results, we deleted one biological replicate in the original PA1.2620 strain, which was poorly correlated with the other two samples (Supplementary Table S3).
A two-component regulatory system plays a substantial role in the pathogenicity, virulence, biofilm formation, and drug resistance in P. aeruginosa. In the current research, we detected 43 DEGs in a two-component regulatory system, including some regulated resistant genes, such as pmrA-pmrB, response regulator phoP (gene ID: Novel_194, log2FC=1.924075), alkaline phosphatase encoded by phoA (gene ID: Novel_498, 499), and a two-component response regulator phoB in PA-99 mutant. A two-component regulatory system may also play a significant role in P. aeruginosa resistant to tachyplesin in the present study. A previous research demonstrated the importance of regulatory genes, such as phoP-phoQ and pmrA-pmrB, as well as the addition of aminoarabinose to Lipid A.8 The pmrB mutant of P. aeruginosa showed a significant metabolic perturbation in the total intracellular lipid level, the methionine salvage cycle, and synthesis of spermidine.5 Resistance can be mediated by the addition of positively charged arabinosamine through the action of the arnBCADTEF operon. The results achieved in the present research were consistent with a previous report, in which the complex regulation of LPS modification involved the participation of at least 4 two-component regulatory systems in P. aeruginosa.9
Drug efflux through efflux pumps is one of the main resistance mechanisms of antibiotic or AMPs of P. aeruginosa. Some bacteria can use efflux pumps or increase the expression of efflux pumps to mediate resistance against CAMPs.3,28 Especially, the efflux pumps of the RND family were studied in P. aeruginosa, which could be directly related to the efflux of antibiotics. At least 7 RND family drug efflux pumps have been reported to exist in cells of P. aeruginosa, such as MexAB-OprM, MexCD-OprJ, MexEF-OprN, MexXY-OprM, MexJK-OprM, MexVW-OprM, and MexGHI-OpmD, which could be involved in the antibiotic resistance.29 MFS is another important superfamily of secondary membrane transporter, playing a significant role in substance exchange, energy metabolism, and drug resistance. The ABC family includes transporters involved in both uptake and efflux, and these transporters can transport a wide range of substrates, including sugars, amino acids, ions, drugs, polysaccharides, and proteins. In the present study, DEGs were found in ABC transporters, MFS transporters, and RND superfamily. There were a number of upregulated genes, which were encoded by RND efflux membrane fusion proteins and outer membrane efflux proteins. For instance, there were 7 upregulated genes in RND superfamily, including 6 efflux membrane fusion proteins (mexC/E/V/J, PA0156, PA1435), 1 export membrane protein (mexB), and 1 downregulated gene that is responsible for repressor of the mexAB-oprM multidrug resistance operon (mexR). No encoded multidrug efflux outer membrane proteins (oprJ/M/N, opmD) were expressed, while genes with unknown function (opmE, PA2837), which were encoded by outer membrane efflux proteins, were upregulated (Table 3). Besides, 31 DEGs of MFS, including 15 up- and 16 downregulated genes, contained 8 known genes related to antibiotic resistance. In ABC transporters, there were 36 DEGs; however, whether they are related to the resistance mechanism of P. aeruginosa should be further clarified. The expression levels of efflux pumps showed that P. aeruginosa resistant to tachyplesin was also related to the expression of efflux pumps, while their participation in drug resistance needs to be further studied.
Another mechanism of bacterial resistance to AMPs is the reduced entry of the AMPs into the bacterial cell due to modifications of the cell surface that limit interactions with the drug or reduce the number of entry channels (porins). OMPs of P. aeruginosa play a key role in membrane permeability, antibiotic resistance, nutrient uptake, and virulence in the infection site. In addition, reduction or loss of the oprD porin can reduce or block the antibacterial drug to enter into P. aeruginosa in part due to the decreased permeability of the P. aeruginosa outer membrane.30 To investigate whether P. aeruginosa resistant to tachyplesin I could be involved in expression of the genes encoded by OMPs or changes of outer membrane permeability, transcriptional regulation revealed that 4 genes encoded by outer membrane efflux protein were all upregulated (log2FC≥1.236 folds), 6 genes encoded by outer membrane porin D were downregulated, and only 1 opdB gene was upregulated in resistant strains of PA 99 (Table 3). The genes (ID: Novel_156 and Novel_157) encoded by oprD belonged to β-Lactam resistance and two-component regulatory systems. In particular, the PA2760 (oprQ) gene encoded by porin was strongly downregulated (log2FC≥14). The previous study indicated that P. aeruginosa oprQ protein did not function in roles common to this class of OMPs. The regulation of oprQ expression may be in dual regulation with other proteins and the overexpression of oprQ could lead to increased sensitivity to certain classes of antibiotics.31 A co-regulation of the two porin genes (oprD and oprQ) has been recently reported since both genes are overexpressed in an Hfq mutant of P. aeruginosa.32 We further analyzed the changes of outer membrane permeability and OMPs, and the results showed that the reduced outer membrane permeability and decreased levels of OMPs were related to tachyplesin I-resistant P. aeruginosa strain compared with the original strain. According to the achieved results, it can be concluded that a decrease of outer membrane permeability could be possibly due to the reduced expression of porin. The differences in type and content of the OMPs were related to expression levels of the genes encoded by outer membrane efflux protein and porin. Furthermore, it was uncovered that P. aeruginosa resistant to tachyplesin I was associated with reduced outer membrane permeability. It is also noteworthy that the lower expression of proteins should be further identified by MALDI-TOF-TOF. The porin-deficient strains in the identified OMPs might be generated to explore their resistance to tachyplesin I.
The drug resistance mechanism of biofilm formation plays a pivotal role in P. aeruginosa. In a previous study, PA-88 formed an easier biofilm than the original strain PA27853, and the content of extracellular polysaccharide was also higher than that of the original strain.15 The similar results were also found in the PA-99 and PA1.2620 (data were not shown). When the content of exopolysaccharide reaches a certain concentration, it can promote the formation of biofilm. In the present study, we found that a number of genes, formerly known to be associated with biofilm formation, in tachyplesin-resistant PA-99 strain were differentially expressed. The chemosensory pili system protein (chpC) gene was upregulated. The biofilm formation pathway involves the quorum sensing, bacterial secretion system, chemosensory system, etc. The results indicated that P. aeruginosa resistant to tachyplesin I could be involved in the expression of biofilm-related genes. The global interactions of the proteins encoded by the biofilm-related genes were further analyzed.
Some bacteria evade host defense peptides by employing protease-mediated degradation. The PA-99 and PA-88 exhibited the increased levels of extracellular proteolytic activity and reduced the antimicrobial activity of tachyplesin I in previous studies.14,15 Some DEGs were found to encode protease and peptidase in the present study, such as upregulated genes encoding protease (PA3913) and encoding peptidase (PA2658). The upregulated gene PA2315 and downregulated gene PA5514 both encoded beta-lactamase. The downregulated gene PA2764 (log2FC=−16.39) encoded alpha/beta hydrolase superfamily. In the DEGs, some genes that encoded the peptidase S9, S49, and M23 were downregulated. The results revealed that P. aeruginosa resistant to tachyplesin I was associated with the expression of genes, which encoded protease, hydrolase, and peptidase.
To improve the stability of peptides against proteolytic digestion, various chemical modifications, including the use of D-amino acids, cyclization, acetylation, and utilization of delivery systems for AMPs, have been presented.33 Tachyplesin peptides and their cyclized analogs are differentiated by only one or two amino acid residues. A study showed that tachyplesin peptides and cyclized analogs have similarly potent antimicrobial and anticancer properties, while the backbone cyclization improves their stability and therapeutic potential.34
In summary, PA1.2620 strain resistant to tachyplesin I may cause that several genes to be differentially expressed, especially DEGs resistant to drugs. We further verified that P. aeruginosa resistant to tachyplesin I was associated with a decrease of outer membrane permeability, loss of outer membrane porin, and differences in OMPs. The resistance mechanism of P. aeruginosa to tachyplesin I was found to be mainly related to the reduced entrance of tachyplesin I into the bacterial cell through efflux pumps and decrease of outer membrane permeability, which was also similar to antibiotic resistance in P. aeruginosa. The result also indicates that PA-99 strain has many diverse mechanisms including biofilm formation, protease degradation to resist killing by tachyplesin I. However, most changes in the transcriptomes of resistant mutants are the consequence, not the cause of resistance. Therefore, the acquisition of resistance should further be determined the mutations (including gene amplification) involved by whole-genome sequencing to the PA-99 mutant and PA1.2620 strain. Once this is known, transcriptomics may help to track second-order effects as well as to analyze the effect of acquiring resistance on the bacterial physiology.
Acknowledgments
This study was financially supported by the National Natural Science Foundation of China (Grant No. 31540060), the Key Project of Science and Technology Department of Henan Province (Grant No. 142102210106), Key Scientific Research Project of Henan Provincial Higher School (Grant No. 14A180027), and Academic and Technical Leader Program of Henan University of Urban Construction. The authors would like to thank Biomarker Biotechnology Corporation (Beijing, China) for their technical assistance via transcriptome sequencing.
Disclosure
The authors report no conflicts of interest in this work.
References
1. Overhag J, Strehmel J, Strempel N. Potential application of antimicrobial peptides in the treatment of bacterial biofilm infections. Curr Pharm Des. 2015;21(1):66–84.
2. Dosler S, Karaaslan E. Inhibition and destruction of Pseudomonas aeruginosa biofilms by antibiotics and antimicrobial peptides. Peptides. 2014;62:32–37. doi:10.1016/j.peptides.2014.09.021
3. Andersson DI, Hughes D, Kubicek-Sutherland JZ. Mechanisms and consequences of bacterial resistance to antimicrobial peptides. Drug Resist Update. 2016;26:43–57. doi:10.1016/j.drup.2016.04.002
4. Nuri R, Shprung T, Shai Y. Defensive remodeling: how bacterial surface properties and biofilm formation promote resistance to antimicrobial peptides. Biochim Biophys Acta Biomembr. 2015;1848(11):3089–3100. doi:10.1016/j.bbamem.2015.05.022
5. Han ML, Zhu Y, Creek DJ, et al. Alterations of metabolic and lipid profiles in polymyxin-resistant. Pseudomonas Aeruginosa. Antimicrob Agents Chemother. 2018;62(6):e02656–17.
6. Lee JY, Park YK, Chung ES, Na IY, Ko KS. Evolved resistance to colistin and its loss due to genetic reversion in Pseudomonas aeruginosa. Sci Rep. 2016;6:25543. doi:10.1038/srep25543
7. Moskowitz SM, Brannon MK, Dasgupta N, et al. PmrB mutations promote polymyxin resistance of Pseudomonas aeruginosa isolated from colistin-treated cystic fibrosis patients. Antimicrob Agents Chemother. 2012;56(2):1019–1030. doi:10.1128/AAC.05829-11
8. McPhee JB, Bains M, Winsor G, et al. Contribution of the PhoP-PhoQ and PmrA-PmrB two-component regulatory systems to Mg2+-induced gene regulation in Pseudomonas aeruginosa. J Bacteriol. 2006;188:3995–4006. doi:10.1128/JB.00053-06
9. Fernández L, Jenssen H, Bains M, Wiegand I, Gooderham WJ, Hancock RE. The two-component system cprRS senses cationic peptides and triggers adaptive resistance in Pseudomonas aeruginosa independently of parRS. Antimicrob Agents Chemother. 2012;56(12):6212–6222. doi:10.1128/AAC.01530-12
10. Nakamura T, Furunaka H, Miyata T, Tokunaga MT, Iwanaga S, Shimonishi Y. Tachyplesin, a class of antimicrobial peptide from the hemocytes of the horseshoe crab (Tachypleus tridentatus) isolation and chemical structure. J Biol Chem. 1988;263:16709–16713.
11. Li X, Dai JG, Tang YJ, Li LL, Jin G. Quantitative proteomic profiling of proteomic profiling of tachyplesin I targets in U251 gliomaspheres. Mar Drugs. 2017;15(1):20–25. doi:10.3390/md15010020
12. Xie HW, Wei J, Qin Q. Antiviral function of tachyplesin I against iridovirus and nodavirus. Fish Shellfish Immun. 2016;58:96–102. doi:10.1016/j.fsi.2016.09.015
13. Yu G, Z H L, Xin F, et al. Expression of recombinant human lysozyme-tachyplesin I (hLYZ-TP I) in Pichia pastoris and analysis of antibacterial activity. Biomed Environ Sci. 2013;26(4):319–322. doi:10.3967/0895-3988.2013.04.012
14. Hong J, Hu JY, Ke F. Experimental induction of bacterial resistance to the antimicrobial peptide tachyplesin I and investigation of the resistance mechanisms. Antimicrob Agents Chemother. 2016;60(10):6067–6075. doi:10.1128/AAC.00640-16
15. Hong J, Hu JY, Liu K, et al. Characteristics and resistance of tachyplesin-I resistance in Pseudomonas Aeruginosa. Acta Microbiol Sinica. 2018;58(8):1–12. doi:10.13343/j.cnki.wsxb.20170540
16. Li M, Lai YP, Villaruz AE, Cha DJ, Sturdevant DE, Otto M. Gram-positive three-component antimicrobial peptide-sensing system. PNAS. 2007;104(22):9469–9474. doi:10.1073/pnas.0702159104
17. Lei R, Ye K, Gu Z, Sun X. Diminishing returns in next-generation sequencing (NGS) transcriptome data. Gene. 2015;557:82–87. doi:10.1016/j.gene.2014.12.013
18. Langmead B, Trapnell C, Pop M, Salzberg SL. Ultrafast and memory-efficient alignment of short DNA sequences to the human genome. Genome Biol. 2009;10:R25. doi:10.1186/gb-2009-10-3-r25
19. Wang L, Feng Z, Wang X, Wang X, Zhang X. DEGseq: an R package for identifying differentially expressed genes from RNA-seq data. Bioinformatics. 2010;26:136–138. doi:10.1093/bioinformatics/btp612
20. Tatusov RL, Galperin MY, Natale DA, Koonin EV. The COG database: a tool for genome-scale analysis of protein functions and evolution. Nucleic Acids Res. 2000;28:33–36. doi:10.1093/nar/28.1.33
21. Ashburner M, Ball CA, Blake JA, et al. Gene ontology: tool for the unification of biology. Nat Genet. 2000;25(1):25–29. doi:10.1038/75556
22. Kanehisa M, Goto S, Kawashima S, Okuno Y, Hattori M. The KEGG resource for deciphering the genome. Nucleic Acids Res. 2004;32:D277–D280. doi:10.1093/nar/gkh063
23. Jia B, Raphenya AR, Alcock B, et al. CARD 2017: expansion and model-centric curation of the comprehensive antibiotic resistance database. Nucleic Acids Res. 2017;45:D566–573. doi:10.1093/nar/gkw1004
24. Livak KJ, Schmittgen TD. Analysis of relative gene expression data using real-time quantitative PCR and the 2(-Delta Delta C(T)) Method. Methods. 2001;25:402–408. doi:10.1006/meth.2001.1262
25. Wang Z, Jiuzhou C. Influence of lipid A acylation pattern on membrane permeability and innate immune stimulation. Mar Drugs. 2013;11(9):3197–3208. doi:10.3390/md11093197
26. Yehia HM, Hassanein WA, Ibraheim SM. Studies on molecular characterizations of the outer membrane proteins, lipids profile, and exopolysaccharides of antibiotic resistant strain Pseudomonas aeruginosa. Biomed Res Int. 2015;7. doi:10.1155/2015/651464
27. Robasky K, Lewis NE, Church GM. The role of replicates for error mitigation in next-generation sequencing. Nat Rev Genet. 2014;15:56–62. doi:10.1038/nrg3655
28. Band V, Weiss D. Mechanisms of antimicrobial peptide resistance in Gram-negative bacteria. Antibiotics. 2015;4(1):18–41. doi:10.3390/antibiotics4010018
29. Fernández L, Hancock REW. Adaptive and mutational resistance: role of porins and efflux pumps in drug resistance. Clin Microbiol Rev. 2012;25(4):661–681. doi:10.1128/CMR.00043-12
30. Terzi HA, Kulah C, Atasoy AR, Ciftci IH. Investigation of OprD porin protein levels in carbapenem-resistant Pseudomonas aeruginosa isolates. Jundishapur J Microbiol. 2015;8(12):e25952.
31. Arhin A, Boucher C. The outer membrane protein OprQ and adherence of Pseudomonas aeruginosa to human fibronectin. Microbiology. 2010;156(5):1415–1423. doi:10.1099/mic.0.033472-0
32. Pusic P, Tata M, Wolfinger MT, Sonnleitner E, Häussler S, Bläsi U. Cross-regulation by CrcZ RNA controls anoxic biofilm formation in Pseudomonas aeruginosa. Sci Rep. 2016;6:639621. doi:10.1038/srep39621
33. Kumar P, Kizhakkedathu JN, Straus SK. Antimicrobial peptides: diversity, mechanism of action and strategies to improve the activity and biocompatibility in vivo. Biomole. 2018;8(1):1–24. doi:10.3390/biom8010004
34. Vernen F, Harvey PJ, Dias SA, et al. Characterization of tachyplesin peptides and their cyclized analogues to improve antimicrobial and anticancer properties. Int J Mol Sci. 2019;20:4184. doi:10.3390/ijms20174184
 © 2020 The Author(s). This work is published and licensed by Dove Medical Press Limited. The
full terms of this license are available at https://www.dovepress.com/terms
and incorporate the Creative Commons Attribution
- Non Commercial (unported, 3.0) License.
By accessing the work you hereby accept the Terms. Non-commercial uses of the work are permitted
without any further permission from Dove Medical Press Limited, provided the work is properly
attributed. For permission for commercial use of this work, please see paragraphs 4.2 and 5 of our Terms.
© 2020 The Author(s). This work is published and licensed by Dove Medical Press Limited. The
full terms of this license are available at https://www.dovepress.com/terms
and incorporate the Creative Commons Attribution
- Non Commercial (unported, 3.0) License.
By accessing the work you hereby accept the Terms. Non-commercial uses of the work are permitted
without any further permission from Dove Medical Press Limited, provided the work is properly
attributed. For permission for commercial use of this work, please see paragraphs 4.2 and 5 of our Terms.