Back to Journals » OncoTargets and Therapy » Volume 11
Transcriptional profiling of NCI/ADR-RES cells unveils a complex network of signaling pathways and molecular mechanisms of drug resistance
Authors Vert A, Castro J, Ribó M ![]() , Vilanova M
, Vilanova M ![]() , Benito A
, Benito A ![]()
Received 17 October 2017
Accepted for publication 22 November 2017
Published 4 January 2018 Volume 2018:11 Pages 221—237
DOI https://doi.org/10.2147/OTT.S154378
Checked for plagiarism Yes
Review by Single anonymous peer review
Peer reviewer comments 2
Editor who approved publication: Dr Carlos E Vigil
Anna Vert1,2 Jessica Castro,1,2 Marc Ribó,1,2 Maria Vilanova,1,2 Antoni Benito1,2
1Protein Engineering Laboratory, Department of Biology, Faculty of Sciences, Universitat de Girona, 2Biomedical Research Institute of Girona (IDIBGi), Girona, Spain
Background: Ovarian cancer has the highest mortality rate among all the gynecological cancers. This is mostly due to the resistance of ovarian cancer to current chemotherapy regimens. Therefore, it is of crucial importance to identify the molecular mechanisms associated with chemoresistance.
Methods: NCI/ADR-RES is a multidrug-resistant cell line that is a model for the study of drug resistance in ovarian cancer. We carried out a microarray-derived transcriptional profiling analysis of NCI/ADR-RES to identify differentially expressed genes relative to its parental OVCAR-8.
Results: Gene-expression profiling has allowed the identification of genes and pathways that may be important for the development of drug resistance in ovarian cancer. The NCI/ADR-RES cell line has differential expression of genes involved in drug extrusion, inactivation, and efficacy, as well as genes involved in the architectural and functional reorganization of the extracellular matrix. These genes are controlled through different signaling pathways, including MAPK–Akt, Wnt, and Notch.
Conclusion: Our findings highlight the importance of using orthogonal therapies that target completely independent pathways to overcome mechanisms of resistance to both classical chemotherapeutic agents and molecularly targeted drugs.
Keywords: multidrug resistance, microarray analysis, ovarian cancer, drug extrusion, drug inactivation
Introduction
Ovarian cancer represents only 10% of all gynecological cancers in Europe,1 but has the highest mortality rate among them. This is mostly due to the resistance of ovarian cancer to current chemotherapy regimens. Although most patients initially respond to chemotherapy, a significant percentage of them relapse and develop resistance to a broad spectrum of structurally unrelated drugs that do not share a common target. Consequently, ovarian cancer becomes refractory to the different alternatives for its treatment and is typically incurable. Indeed, 90% of the deaths from ovarian cancer can be attributed to drug resistance.2
The phenomenon of MDR is multifactorial, and may result from a variety of cellular mechanisms, such as activation or overexpression of drug-export proteins involving Pgp, as well as other associated proteins;3 alteration of target enzymes, such as mutated topoisomerase II;4 increased drug metabolism and elimination, due to altered expression of cytochrome P450 enzymes;5 alterations in cell-cycle control or changes in apoptotic threshold;6 enhanced intracellular drug inactivation, due to conjugation with glutathione;7 and alterations in DNA-repair ability.8 Furthermore, the multicellular structure of cancer displays a set of transport barriers to drug delivery. The ECM of tumor cells allows the formation of dense cellular structures that limit drug diffusion into cells that are localized away from the blood vessels.9,10 In addition, the interaction of the ECM with cancer cells can affect their sensitivity to apoptosis and DR.11
Drug export is the most prevalent and important mechanism of DR. Therefore, most studies attempting to circumvent MDR have been focused on the possibility of modulating the activity of Pgp or associated proteins like breast cancer-resistance protein by using competitive inhibitors or modulating its expression (for a review, see Wu et al12). MDR reversion through inhibition of Pgp was first achieved in vitro using verapamil,13 and several years later using other unrelated compounds, such as cyclosporines, phenothiazines, antimalarials, or antibiotics. However, at their highest tolerable concentration, these drugs failed to achieve clinical inhibition.12 Although alternative Pgp modulators with higher specificity have been produced, clinical trials have evidenced that elimination of Pgp+ cells through the combined use of chemotherapeutics and Pgp modulators may lead to the selection of cells presenting alternative MDR mechanisms.14
In the last few years, it has become clear that the development of an MDR-cell population does not arise from a single mechanism, but likely from multiple stacked processes. Cancer heterogeneity explains the fact that every cancer expresses a different array of DR genes, and that even cells within the same cancer can exhibit a large amount of heterogeneity regarding DR.15 Resistance to new tumor-cell-specific therapies has also been described. Importantly, the mechanisms of resistance to these new drugs are identical or at least overlapping to those causing resistance to the classical drugs.16
The NCI/ADR-RES human cell line is a model for the study of MDR in ovarian cancer. To get a better comprehension of the enormous amount of published works related to this cell line, a study of the MDR mechanisms developed in NCI/ADR-RES compared to its parental OVCAR-8 is needed. In the present work, we identify changes in gene expression of NCI/ADR-RES cells compared to OVCAR-8. We used gene-expression profiling to identify those genes and pathways that may be important for the development of DR in ovarian cancer. Overall, a better understanding of how DR arises may ultimately lead to new approaches for overcoming resistance and improving patient survival. Large-scale expression analysis is an attractive strategy to study MDR, because it is a multifactorial phenomenon that involves multiple genes and pathways. Therefore, it can identify new candidate genes involved in MDR that can be targets for cancer therapy.
Materials and methods
Cell lines and culture conditions
The MDR NCI/ADR-RES human ovarian cancer cell line (formerly MCF7/ADR)17 was a generous gift from Dr Ramon Colomer of the Institut Català d’Oncologia de Girona, Hospital Universitari de Girona Dr Josep Trueta (Girona, Spain). It was initially obtained from the American Type Culture Collection and used immediately after resuscitation. The OVCAR-8 human ovarian cancer cell line was obtained from the Division of Cancer Treatment and Diagnosis, National Cancer Institute (Rockville, MD, USA) and used immediately after resuscitation. NCI/ADR-RES and OVCAR-8 cells were routinely grown at 37°C in a humidified atmosphere of 5% CO2 in Dulbecco’s Modified Eagle Medium and Roswell Park Memorial Institute, respectively, supplemented with 10% FBS, 50 U/mL penicillin, and 50 μg/mL streptomycin (Thermo Fisher Scientific, Waltham, MA, USA). In addition, NCI/ADR-RES cells were maintained in media containing 1.84 μM doxorubicin (Tedec-Meiji Farma, Madrid, Spain). Cells remained free of Mycoplasma and were propagated according to established protocols.
Cell-proliferation assay
NCI/ADR-RES cells (7,000 per well) and OVCAR-8 cells (2,500 per well) were seeded into 96-well plates. After 24 hours of incubation, cells were treated for 72 hours with varying concentrations of a particular chemotherapeutic among the following: doxorubicin, paclitaxel, docetaxel, cisplatin, carboplatin, gemcitabine, and etoposide. Sensitivity was determined by the MTT method, as described previously.18 Data were collected by measuring the absorbance at 570 nm using a Synergy 4 multiwell plate reader (BioTek Instruments, Winooski, VT, USA). IC50 values were calculated by interpolation from the obtained growth curves. Data are expressed as means ± SD of three independent experiments conducted in triplicate.
RNA isolation
NCI/ADR-RES cells (2×10⁵ per well) and OVCAR-8 cells (5×10⁴ per well) were seeded into six-well plates. After 60 hours of incubation, cells were harvested at 400 g for 5 minutes at 4°C and washed twice with cold PBS. Total RNA was extracted using the mirVana miRNA-isolation kit (Thermo Fisher Scientific) according to the manufacturer’s instructions and stored at −80°C. Four independent preparations were obtained. RNA integrity and 260:280 nm absorbance ratio of each sample were checked using an Agilent 2100 bioanalyzer (Agilent Technologies, Santa Clara, CA, USA) and a NanoDrop ND-1000 spectrophotometer (Thermo Fisher Scientific), respectively.
Gene-expression microarray analysis
Gene-expression microarray experiments were performed at Bioarray (Elche, Spain) using a SurePrint G3 human gene-expression microarray (Agilent Technologies), a high-density oligonucleotide microarray that contains 60,000 probes, corresponding to 27,958 Entrez Gene RNAs and 7,419 lncRNAs. Sample preparation and microarray processing were done according to two-color microarray-based gene expression analysis (version 6.5; Agilent Technologies) as described in Vert et al.19 Also, statistical data analyses were done as previously described.19 Genes were considered differentially expressed when they had a false-discovery rate-adjusted P-value ≤0.05 and a fold change ≥2 or ≤−2. The microarray data generated during the current study are available under the accession number GSE75494 in the Gene Expression Omnibus repository (http://www.ncbi.nlm.nih.gov/geo).20 The Multiple Experimental Viewer program (http://mev.tm4.org) was used to generate a heat map of gene expression.
Gene Ontology analysis and KEGG pathway annotation
Differentially expressed genes were functionally characterized with a hypergeometric test to find overrepresented Gene Ontology terms in the three main broad ontologies (biological process, molecular function, and cellular component; www.geneontology.org) and were also mapped to the KEGG (www.kegg.jp), which assigns proteins to pathways, to find overrepresented pathways. Analyses were done using the software packages GOstats and RamiGO from Bioconductor (www.bioconductor.org). In all cases, P≤0.05 was considered statistically significant.
Transcription-factor target analysis
An in silico prediction of which TFs could be regulating multiple genes involved in the maintenance of the MDR phenotype in NCI/ADR-RES was made using the TFT-analysis tool implemented in WebGestalt (http://www.webgestalt.org).21 We analyzed whether the set of genes whose expression change in NCI/ADR-RES compared to OVCAR-8 was significantly enriched with TFTs. TFTs are specific sets of genes that share a common transcription-factor-binding site. Enrichment was evaluated through a hypergeometric test calibrated by the Benjamini–Hochberg procedure with a maximum significance level of P<10−6 as the threshold value.
Reverse-transcription quantitative PCR
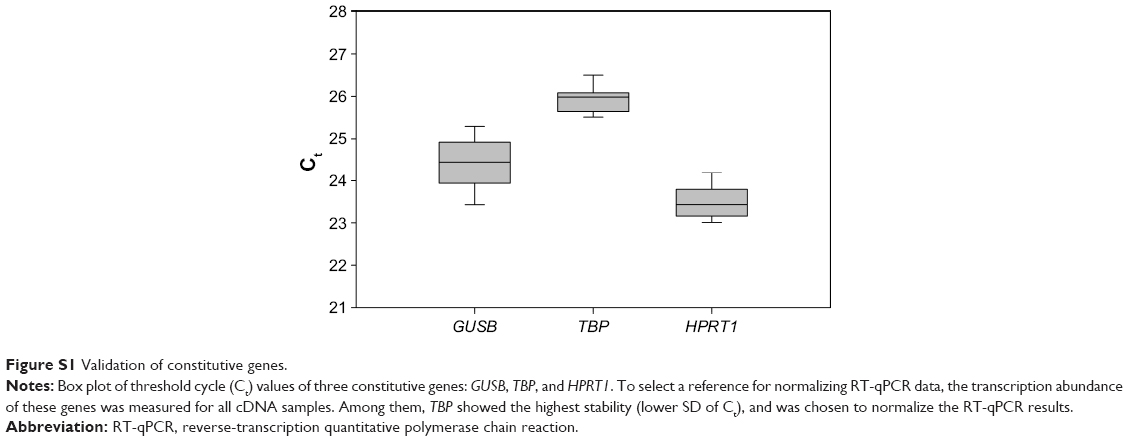
mRNA expression of four upregulated genes (GALC, WNT5A, NOTCH3, EPCAM) and two downregulated genes (TOP2A, DCK) was examined by RT-qPCR. The same RNA samples used for microarray analysis were used for this analysis, which was done according to Vert et al.19 Primer sequences for the selected genes were: F, GGCAGACAACAGACGGCACT and R, CATCAACCACCACTCGTATCCT for GALC; F, GTGATGCCCTGAAGGAGAAGT and R, CGGCTGTTGACCTGTACCAA for WNT5A; F, GCTAATGCTGGCTTCCTTCTG and R, GTGTCATCTGCCTCATCCTCTT for NOTCH3; F, GCTGTTATTGTGGTTGTGGTGAT and R, GCCTTCTCATACTTTGCCATTCT for EPCAM; F, TCCCTTCTATGGTGGATGGTT and R, TCTCGCTTGTCATTCCGTTT for TOP2A; and F, GACTGGCATGACTGGATGAATAA and R, CATGTCTCTGGAGTGGCTTGA for DCK. To select a constitutive gene as a reference for normalizing data, the TA of three genes (GUSB, TBP, HPRT1) was measured for all samples. The used primer sequences were: F, GAACGCCCTGCCTATCTGTATT and R, ATGAGGAACTGGCTCTTGGTG for GUSB; F, GGCACCACAGCTCTTCCACT and R, TGCGGTACAATCCCAGAACTC for TBP; and F, CAGACTTTGCTTTCCTTGGTCA and R, AACACTTCGTGGGGTCCTTT for HPRT1. Among these, TBP showed the highest stability (lower SD of the Ct) (Figure S1), and thus it was selected as the reference gene for data normalization. The RTA of the target genes (GALC, WNT5A, NOTCH3, EPCAM, TOP2A, DCK) was calculated using:
|
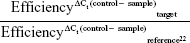
where “control” refers to a mix of equal amounts of OVCAR-8 samples. Fold changes were calculated as the ratio between RTA values obtained for NCI/ADR-RES cells and RTA values obtained for OVCAR-8 cells. The absence of genomic DNA contamination was checked using non-RT controls and the absence of environmental contamination using nontemplate controls.
Results
Cytotoxic effects of different chemotherapeutic agents
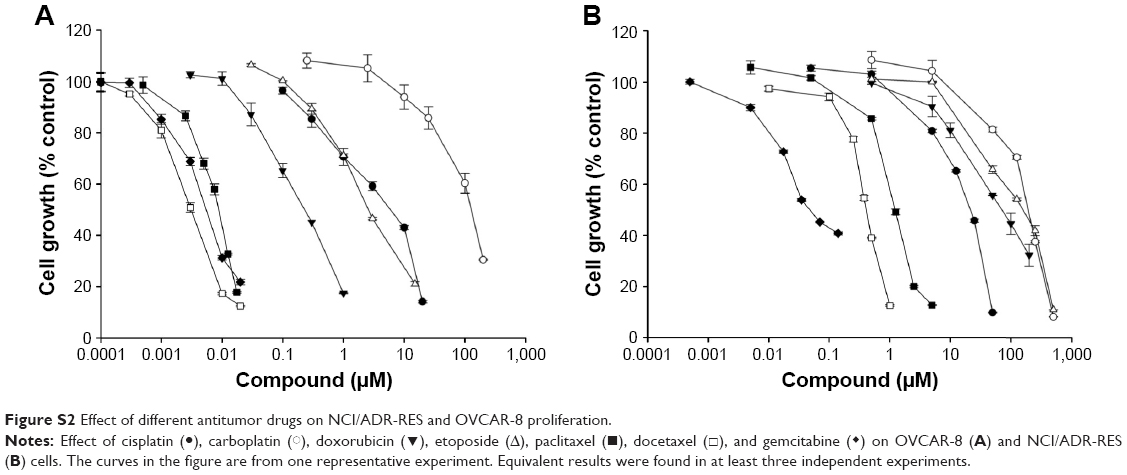
Figure S2 shows that NCI/ADR-RES was highly resistant to different chemotherapeutic agents compared to its parental cell line OVCAR-8. As relevant examples, NCI/ADR-RES resisted a concentration of doxorubicin more than 500-fold higher or a concentration of paclitaxel nearly 230-fold higher than OVCAR-8 (Table 1). This cell line was also more resistant than OVCAR-8 to different chemotherapeutics that are not substrates for Pgp (cisplatin, carboplatin, and gemcitabine), although to a minor extent.
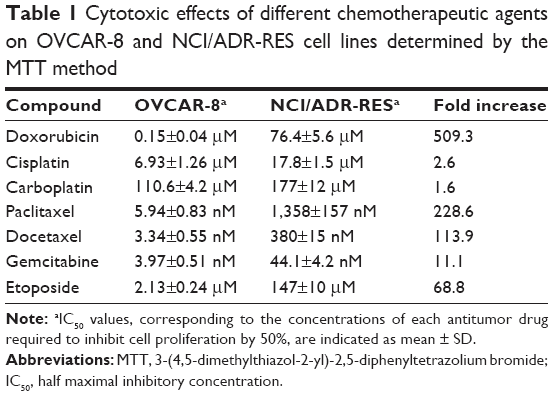 | Table 1 Cytotoxic effects of different chemotherapeutic agents on OVCAR-8 and NCI/ADR-RES cell lines determined by the MTT method |
Gene-expression changes
We used microarray-derived transcriptional profiling to identify differentially expressed genes in the NCI/ADR-RES human ovarian cancer cell line relative to OVCAR-8. The comparison of gene-expression profiles of NCI/ADR-RES and OVCAR-8 cells revealed 927 differentially expressed genes of 35,377 present in the microarray (2.62%). Among these, 50.2% were upregulated in NCI/ADR-RES cells compared to OVCAR-8 (increase ranging from two- to 135-fold), while 49.8% were downregulated (decrease ranging from two- to 130-fold) (Figure 1). Table 2 shows the top 20 up- and downregulated genes in NCI/ADR-RES cells relative to OVCAR-8. The most upregulated genes code for metabolic enzymes (GALC, PTGDS), transmembrane transporters and ion channels (ABCB1, CALHM3, SCN2B), cell-surface receptors (ITGB4, TACSTD2), secreted proteins (SEMA3D, FGFBP1, CST6), components of the ECM (LAMA4, NID2), and transcription regulators (NUPR1). The most downregulated genes are mainly receptors (OR7G1, OR8B8, OR4D6) and transcription regulators (ZNF699, ZNF781, HABP4, UCA1).
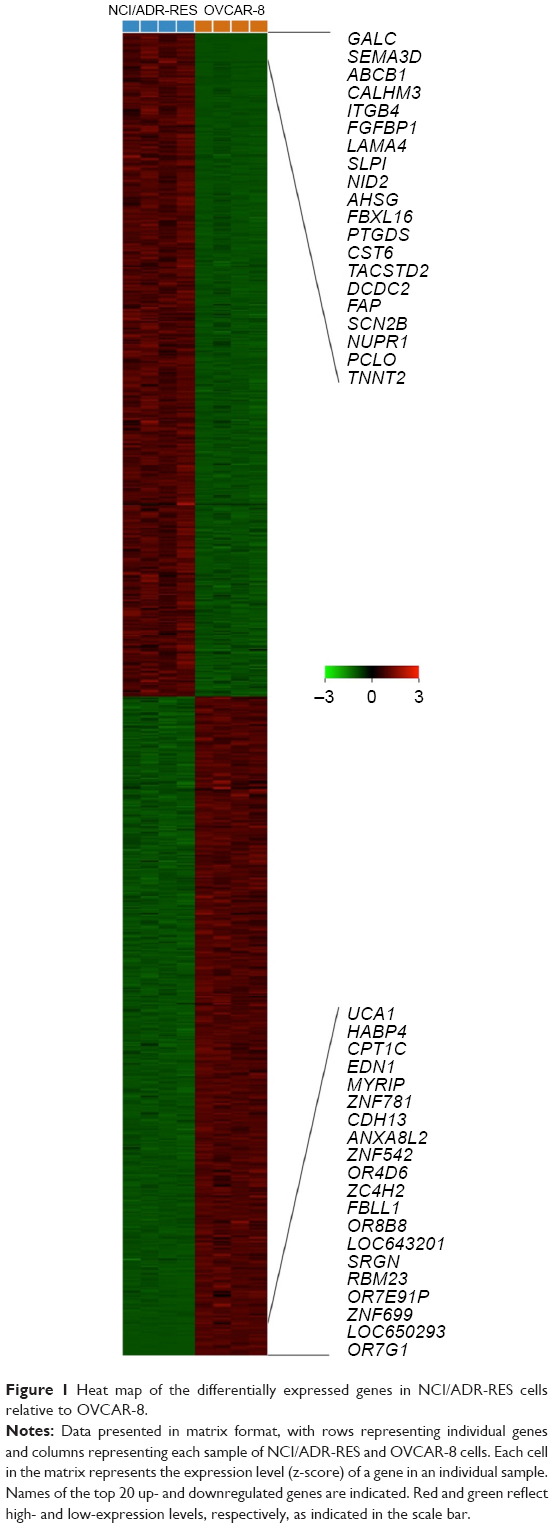 | Figure 1 Heat map of the differentially expressed genes in NCI/ADR-RES cells relative to OVCAR-8. |
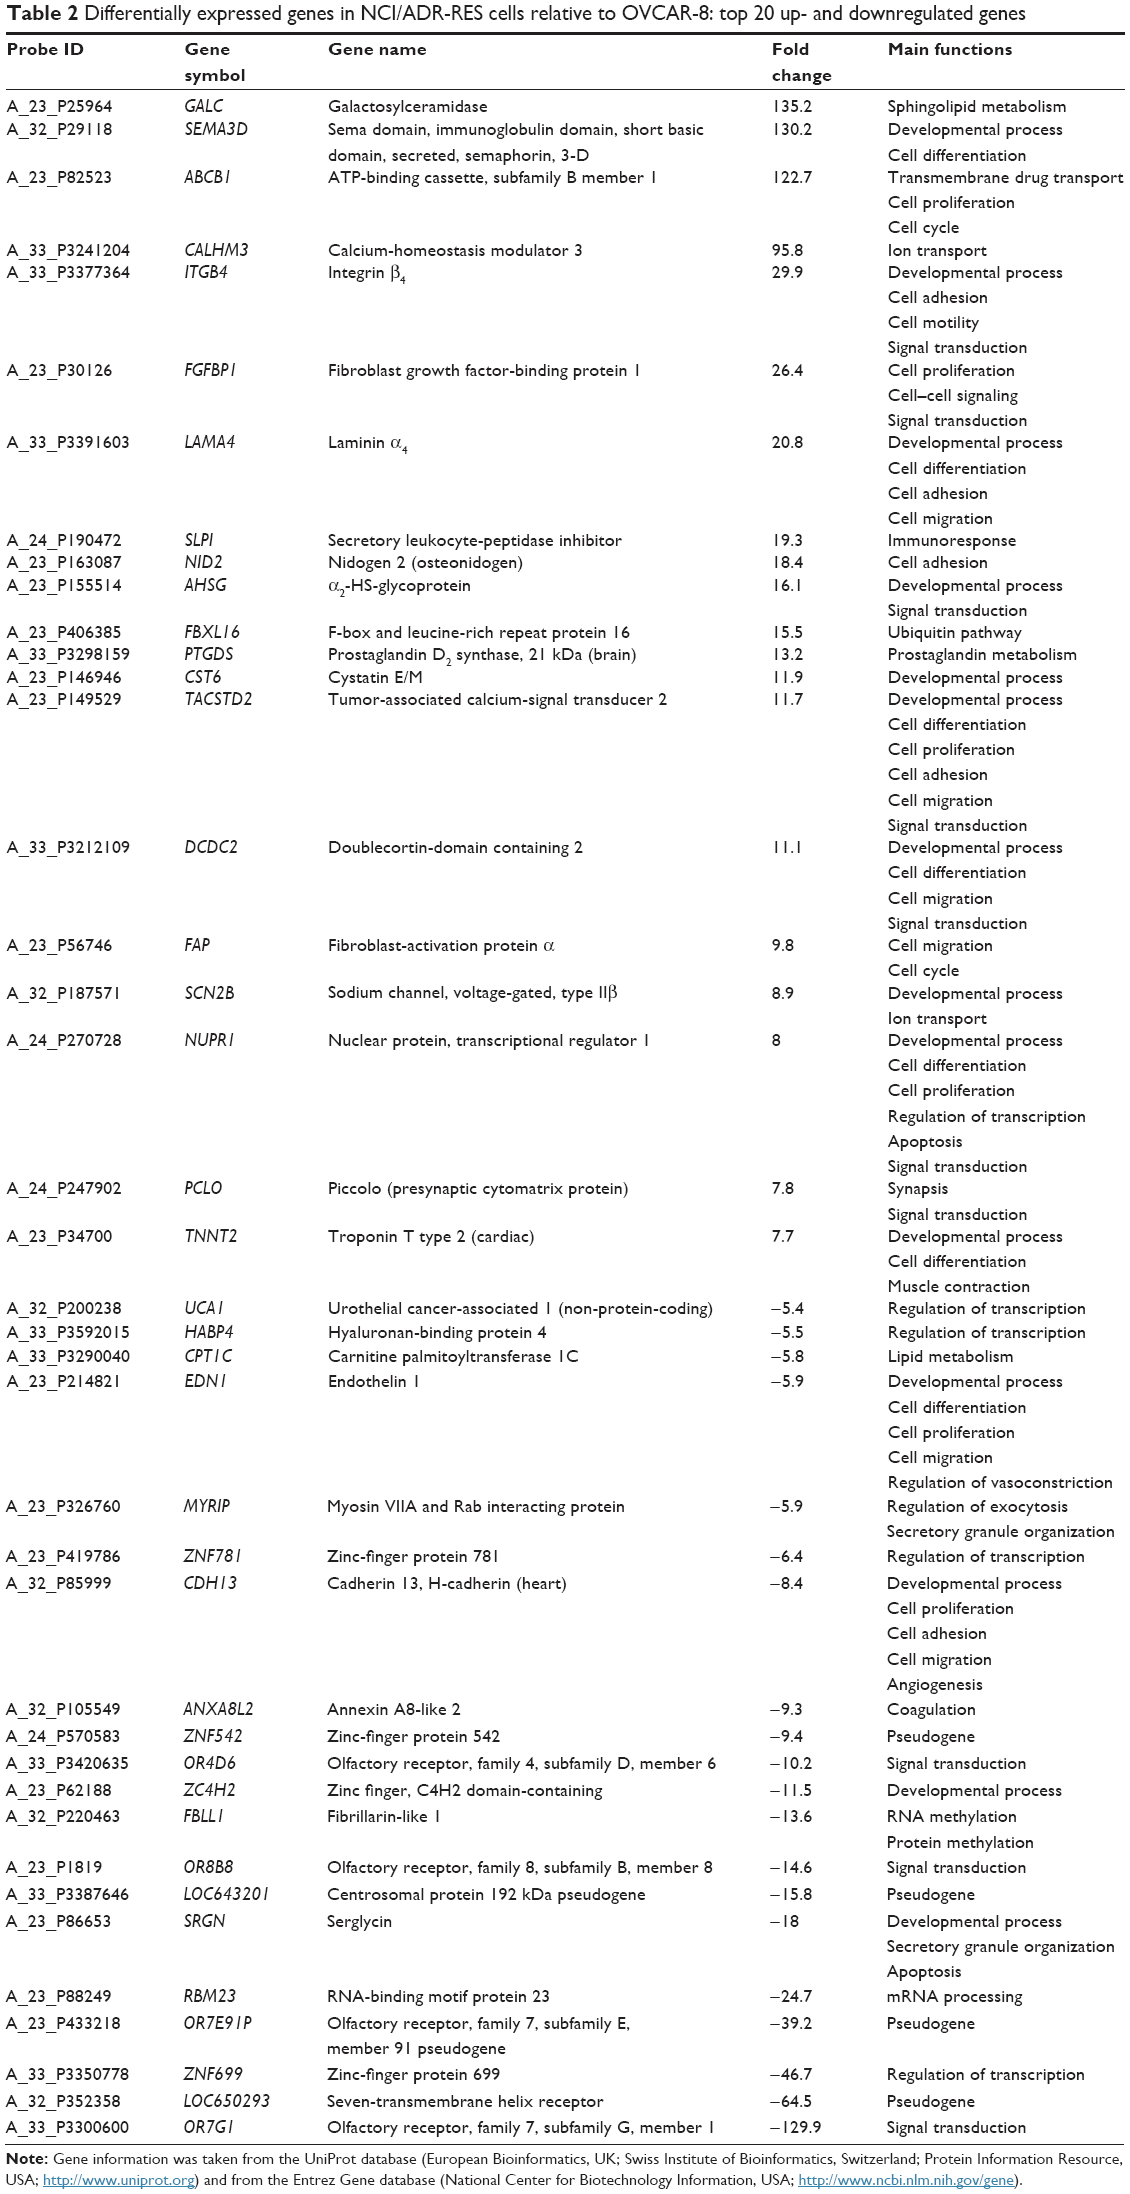 | Table 2 Differentially expressed genes in NCI/ADR-RES cells relative to OVCAR-8: top 20 up- and downregulated genes |
RT-qPCR analysis of gene expression
mRNA expression of four upregulated (GALC, WNT5A, NOTCH3, EPCAM) and two downregulated (TOP2A, DCK) genes in NCI/ADR-RES cells, representative of the foremost affected processes, was analyzed by RT-qPCR. Fold changes obtained by RT-qPCR, calculated as the ratio between RTA values for NCI/ADR-RES cells and RTA values for OVCAR-8 cells, were similar to those found in the microarray analysis (Figure 2). These results confirmed that the microarray experiments were fully valid.
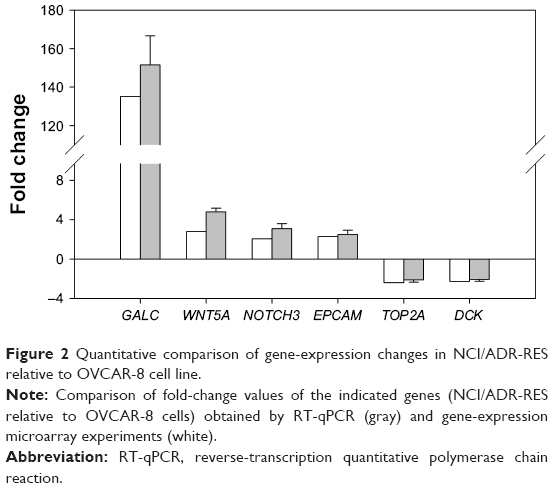 | Figure 2 Quantitative comparison of gene-expression changes in NCI/ADR-RES relative to OVCAR-8 cell line. |
Gene Ontology analysis and KEGG pathway annotation
To understand the functional relevance of the differentially expressed genes better, we performed a Gene Ontology analysis. Differentially expressed genes were used to find overrepresented Gene Ontology terms in the three broad ontology categories: “molecular function”, which captures knowledge on the functional activity of gene products; “biological process”, as part of which these specific functions collectively act; and “cellular component”, where all this occurs. To the same end, differentially expressed genes were mapped to the KEGG database to find overrepresented metabolic and regulatory pathways.
Gene Ontology analysis showed that up- and downregulated genes in NCI/ADR-RES cells were related to different cellular events (Table 3). Regarding biological process ontology, the terms with the highest number of genes were “developmental process”, “signal transduction”, “cell differentiation”, “small-molecule metabolic process”, “response to chemical stimulus”, and “cell proliferation”, whereas cellular component ontology favored “extracellular region”, “plasma membrane part”, and “cell surface”. In molecular function ontology, we can highlight the term “drug binding” for its relation to MDR. Analysis of the overrepresented pathways collected in the KEGG database showed several affected pathways (Table 3). Among these, “pathways in cancer” comprised the highest number of genes. We can also highlight the term “extracellular matrix–receptor interaction” for its involvement in MDR.
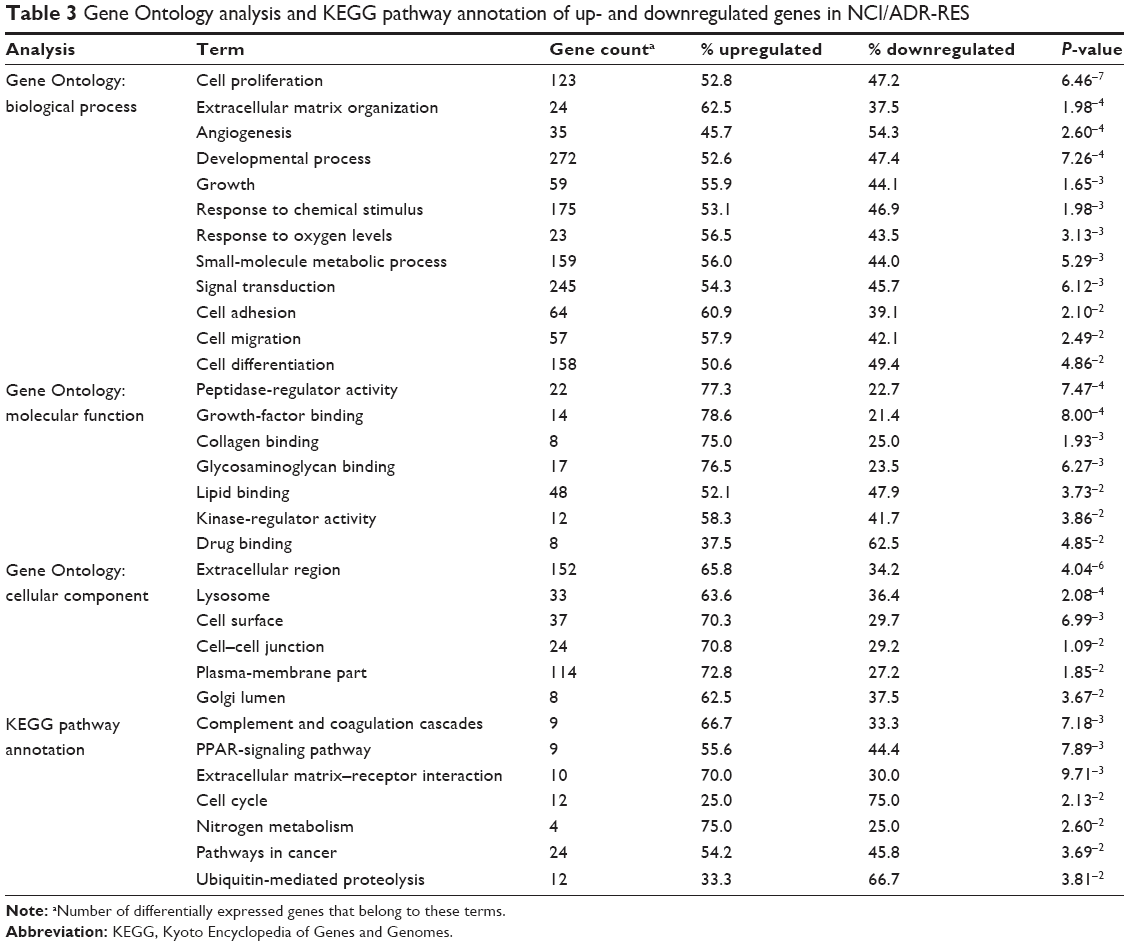 | Table 3 Gene Ontology analysis and KEGG pathway annotation of up- and downregulated genes in NCI/ADR-RES |
Identification of TFTs among genes with expression change in NCI/ADR-RES compared to OVCAR-8
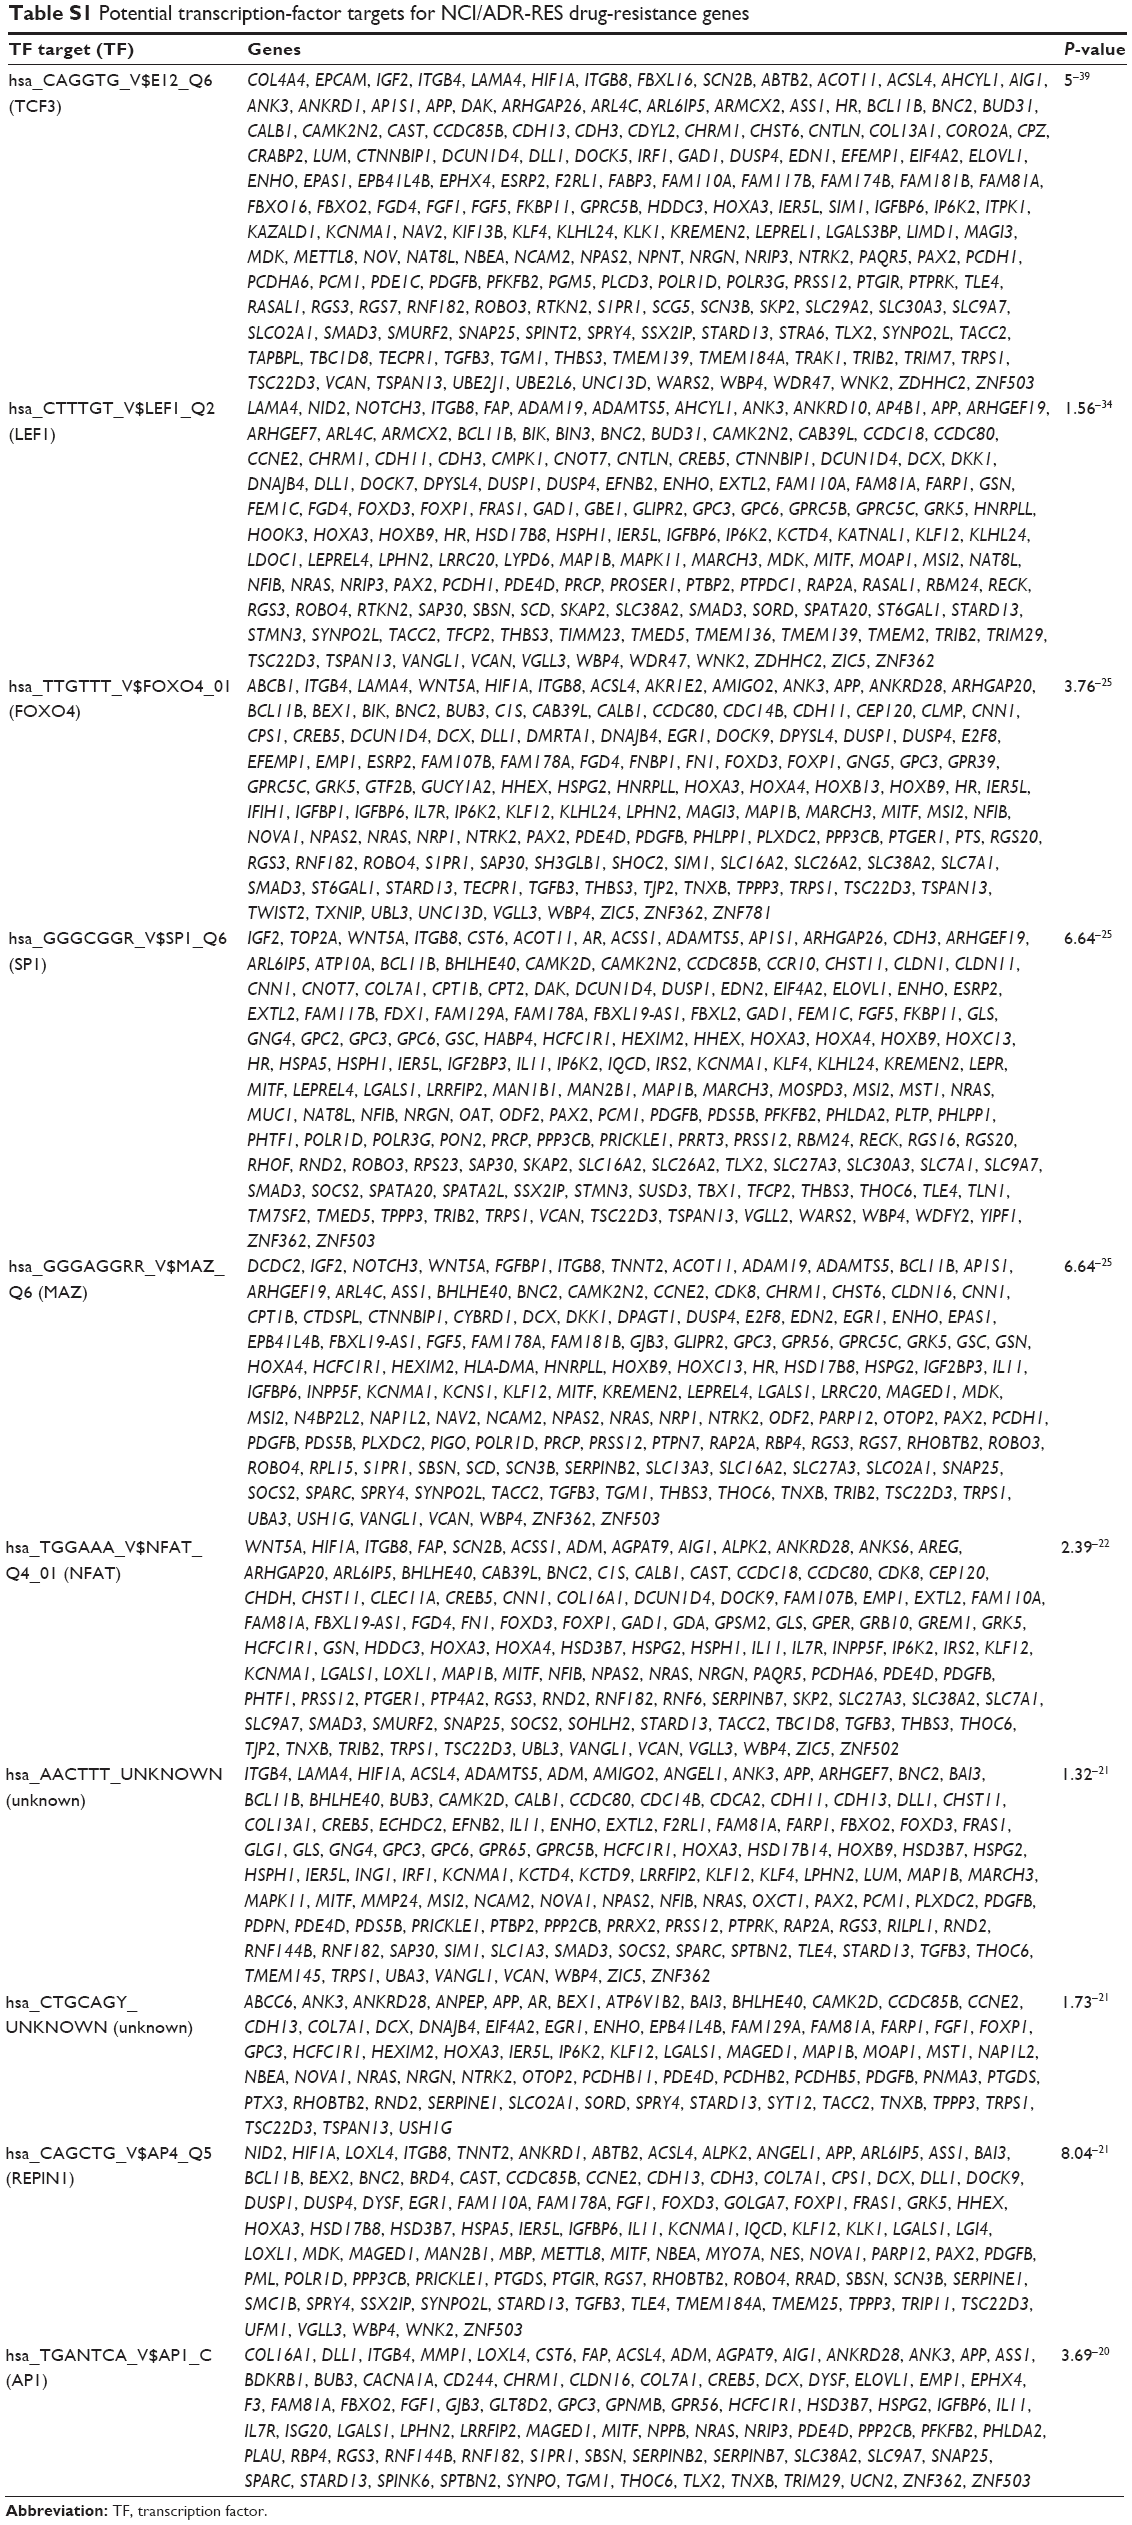
Using the TF target-analysis tool of WebGestalt, we searched for the presence of potential target sites for TFs on the upstream sequences of the differentially expressed genes. Table S1 depicts the ten most significant sets of genes regulated by a common TF (TFTs). The TFs involved in the regulation of the most significant TFTs were TCF3 and LEF1. Each of these TFs potentially regulates more than 140 genes by binding to the target sequences CAGGTG and CTTTGT, respectively. Interestingly, among the genes potentially regulated by TCF3 and LEF1, four and three, respectively, are found in the top 20 upregulated genes in NCI/ADR-RES.
Discussion
Gene Ontology analysis and KEGG pathway annotation of the 927 differentially expressed genes show interesting terms that may allow identifying the different strategies displayed by NCI/ADR-RES to maintain its MDR phenotype. Among the terms included in Table 3, “cell proliferation” has a low P-value, but other terms like “small-molecule metabolic process”, “signal transduction”, “response to chemical stimulus”, “drug binding”, or “ECM organization” help to identify those processes that allow this cell line to be highly resistant to different anticancer drugs.
Changes in expression of genes involved in drug extrusion
The Gene Ontology “cell proliferation” and “small-molecule metabolic process” terms include the ABCB1 gene coding for Pgp. Overexpression of this gene is the most known mechanism of MDR in NCI/ADR-RES cells.23 In our study, ABCB1 is the third-most upregulated gene in NCI/ADR-RES compared to OVCAR-8 (increment of approximately 123-fold, Table 2). The Pgp-efflux pump is responsible for decreased drug accumulation in cells of a broad spectrum of chemotherapeutic agents, such as doxorubicin, daunorubicin, paclitaxel, docetaxel, etoposide, irinotecan, vinblastine, vincristine, and actinomycin D, among many others.24 In addition to ABCB1, our study reveals that ABCC6 was upregulated in NCI/ADR-RES cells. ABCC6 confers resistance to etoposide, teniposide, doxorubicin, daunorubicin, actinomycin D, and cisplatin.25
The effect of Pgp may be enhanced by galactosylceramidase, encoded by the most upregulated gene (GALC) in NCI/ADR-RES cells, which catalyzes the hydrolysis of several glycosphingolipids to produce ceramide. Although in some cancers, reduced expression of GALC has been linked to cell survival,26 it has been proposed that ceramide, together with Pgp, contribute to DR. Pgp would be involved in the encapsulation of drugs into vesicles whose secretion would be stimulated by the presence of ceramide in the exosomes.27
Changes in genes involved in enhanced intracellular drug inactivation or efficacy
The NCI/ADR-RES cell line is much more resistant than OVCAR-8 to a wide panel of chemotherapeutic agents (Table 1). Among these drugs, cisplatin and gemcitabine are not substrates for Pgp. It is thus not surprising that ABCB1 is not the sole gene responsible for this resistance. In the “small-molecule metabolic process” and “drug binding” terms, we found other genes involved in MDR, particularly in enhancing intracellular drug inactivation. Among the genes involved in drug inactivation, we noted the overexpressed genes NNMT, CDA, and the underexpressed gene DCK. NNMT catalyzes the N-methylation of nicotinamide and other pyridines, and is involved in the biotransformation of many drugs and xenobiotics.28 Accordingly, it is overexpressed in numerous cancers, where it promotes tumorigenesis as well as resistance to chemotherapy and radiotherapy via regulating nicotinamide metabolism.29,30 CDA is involved in pyrimidine salvaging. It catalyzes the hydrolytic deamination of cytidine and deoxycytidine and inactivates, for example, gemcitabine by catalyzing its transformation into 2′,2′-difluoro-2′-deoxyuridine.31 DCK phosphorylates several deoxyribonucleosides and numerous nucleoside analogs widely employed as antiviral and chemotherapeutic agents. Of note, it catalyzes the first and rate-limiting step of the intracellular phosphorylation of gemcitabine to its active triphosphate form. Therefore, DCK downregulation is an important mechanism for acquisition of gemcitabine resistance.31
Interestingly, in the terms “small-molecule metabolic process” and “drug binding”, we can find genes whose expression levels influence drug efficacy, eg, DCDC2 and TOP2A, which are overexpressed and underexpressed, respectively. DCDC2 is overexpressed in prostate cancer, where it confers resistance to paclitaxel. This effect is due to its ability to bind tubulin through the doublecortin domains, interfering with paclitaxel-induced disruption of microtubule function.32 TOP2A is a DNA topoisomerase involved in such processes as chromosome condensation, chromatid separation, and the relief of torsional stress that occurs during DNA transcription and replication. It is the target of several anticancer agents like doxorubicin and etoposide. Treatment with these agents is thus more effective when TOP2A levels are high while suppressing TOP2A results in DR.33–35
MDR in NCI/ADR-RES is accompanied by architectural and functional reorganization of extracellular space
Interestingly, the ECM environment appeared in several terms of the Gene Ontology analysis, as well as in KEGG pathway annotation (Table 3). Alteration in the expression of genes encoding different ECM-related proteins has been associated with DR in other ovarian cancer cell lines.36–38 ECM may increase DR of a solid tumor by blocking the penetration of therapeutic drugs. Our results show that MDR in NCI/ADR-RES was accompanied by an architectural reorganization of the ECM. Therefore, in addition to the intracellular mechanisms responsible for MDR, NCI/ADR-RES seems to strengthen extracellular barriers against drug delivery. The remodeling of the cell microenvironment is revealed by changes in the expression of different collagen species and other ECM structural proteins. Compared to OVCAR-8, the MDR cell line presents higher expression of the LAMA4, NID2, and COL4A4 genes and lower expression of the COL4A2, COL4A1, and COL13A1 genes, among others. Upregulation of different collagen genes has been described in different resistant ovarian cancer cell lines, depending on the drug used to induce the resistance,36 although correlations between the kind of drugs that induce the MDR and the precise collagen gene over- or underexpressed in each case have not been found. Our results reinforce the hypothesis that collagen plays an important role in resistance to cancer drugs. Interestingly, LAMA4 and NID2 were among the 20 most upregulated genes in NCI/ADR-RES and were overexpressed in some ovarian cell lines during the acquisition of DR.37,38 The architecture of NCI/ADR-RES ECM may also be modified, because we detected the overexpression of several collagen-modifying enzymes like MMP1 and LOXL4, among others. These proteins have previously been related to the establishment of an MDR phenotype.39,40
The MDR phenotype can also result from the interaction of ECM proteins with cellular receptors, leading to resistance to drug-induced apoptosis, a phenomenon known as cell adhesion-mediated DR. Several studies have demonstrated that integrin–ECM signaling promotes cell adhesion-mediated DR and provides a survival advantage against numerous chemotherapeutic drugs.41 Integrins modulate many signaling pathways, including the PI3K–Akt, ERK, and NFκB pathways, thus implying that they may also be important factors in resistance to kinase-targeted agents. Interestingly, ITGB4 and ITGB8 are highly overexpressed in NCI/ADR-RES cells. ITGB4 confers resistance to various cytotoxic drugs, such as doxorubicin, tamoxifen, and etoposide, by activating the PI3K–Akt and the prosurvival NFκB pathways in different kinds of cancer,42–44 whereas ITGB8 enhances resistance to gefitinib, probably through interaction with the TGFβ pathway.45
Another interesting gene of the ECM that deserves consideration is TGFBI, which is one of the most downregulated genes in NCI/ADR-RES cells. TGFBI is a secreted protein that binds to many extracellular proteins and becomes part of the ECM, where it regulates cell adhesion. It has been described that the loss of this protein is sufficient to induce resistance to paclitaxel, etoposide, cisplatin, and gemcitabine in different cancers.46
Three of the most overexpressed genes in NCI/ADR-RES compared to OVCAR-8 code for proteins that are located in the extracellular space: SEMA3D, FGFBP1, and SLPI. These genes have been found overexpressed in different cancers, including ovarian cancer, where they play crucial roles ranging from tumor growth and angiogenic stimulation to invasiveness and metastasis.47–49 It is interesting to note that overexpression of SEMA3D compared to its parental cell line has also been observed in MDR resistant K562 leukemia cells47 and also that SLPI induces paclitaxel resistance.48 The overexpression of SEMA3D, together with that of ITGB4, has been recently confirmed on a global proteomic analysis of OVCAR-8 and NCI/ADR-RES cells.50
Finally, we found upregulation of EpCAM, a transmembrane glycoprotein with roles in cell–cell adhesion, migration, and proliferation.51 EpCAM is overexpressed in most human cancers including ovarian cancer.51,52 High expression of EpCAM is associated with increased resistance to different drugs, such as docetaxel, paclitaxel, doxorubicin, cisplatin, and 5-fluorouracil.53–55
NCI/ADR-RES overexpresses genes involved in pathways that trigger MDR
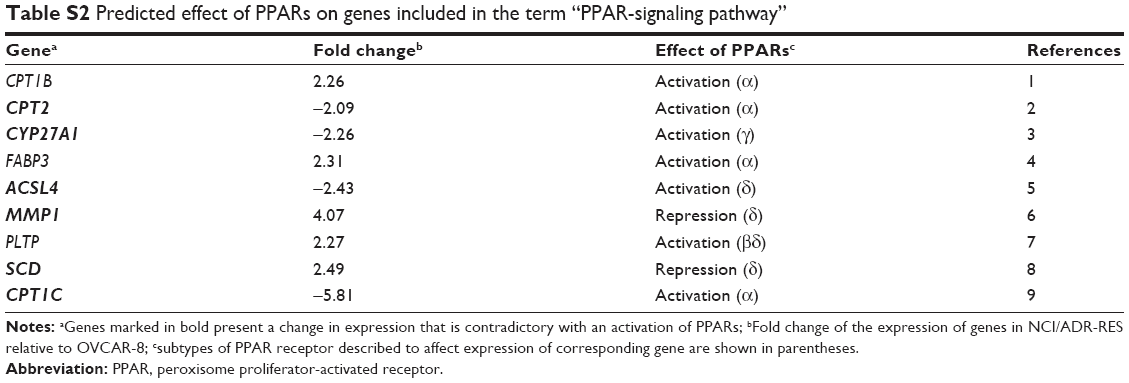
Our results show that NCI/ADR-RES cells display multiple mechanisms for DR, which would be difficult to tackle with a single antitumor strategy. Ontological and TFT analysis helps to understand how these multiple mechanisms are maintained in the cell. The KEGG analysis included nine genes in the term “PPAR-signaling pathway”. Among them, most of the genes that are overexpressed are repressed by some of the PPARs. Conversely, most of the genes that are underexpressed are activated by some of the PPARs (Table S2). Furthermore, the genes of the most significant set of TFTs are regulated by TCF3 (Table S1), which represses the PPAR signaling.56 Altogether, these observations may indicate that the PPAR-signaling pathway is less active in NCI/ADR-RES than in OVCAR-8. Of note, it has been described that the PPAR pathway could be a negative regulator of ABCB1 transcription57–59 which is in accordance with our results.
Among the genes grouped in the Gene Ontology terms “signal transduction” and “response to chemical stimulus”, we identified genes involved in the MAPK–Akt-, Wnt-, and Notch-signaling pathways. These pathways have previously been found to be related to DR.60–62 We detected different transducers involved in the activation of MAPK and PI3K–Akt signaling that are overexpressed in NCI/ADR-RES compared to OVCAR-8. Among them, we noted IGF2, TACSTD2, and NUPR1. IGF2 is overexpressed in ovarian cancer cells resistant to paclitaxel and other microtubule-stabilizing drugs, and its inhibition restores paclitaxel sensitivity both in vitro and in vivo.63 TACSTD2 is overexpressed in many cancers, including ovarian cancer, and its expression in cancer cells has been correlated with DR.64 NUPR1 is also overexpressed in several cancers.65 It confers resistance to multiple drugs, including gemcitabine, paclitaxel, and doxorubicin, by inhibiting stress-induced apoptosis and activating the PI3K–Akt signaling pathway.66,67
The Wnt–β-catenin pathway seems to be potentiated in NCI/ADR-RES by the overexpression of WNT5A and LGR4. WNT5A initiates β-catenin-independent Wnt signaling68 and can affect β-catenin–TCF signaling depending on receptor context.69 The overexpression of WNT5A in NCI/ADR-RES respective to OVCAR-8 cells has been previously reported.70 LGR4 potentiates both the β-catenin-dependent and independent Wnt-signaling pathways.71 The Wnt–β-catenin pathway has been involved in ABCB1 regulation in different cancers.72,73 Specifically, it has been shown that WNT5A upregulates ABCB1 expression in different MDR cancer cells, including NCI/ADR-RES,70 and plays a key role in inducing resistance to different chemotherapeutic drugs like paclitaxel, oxaliplatin, 5-fluorouracil, gemcitabine, epirubicin, doxorubicin, and etoposide.70,74 LGR4 is overexpressed in cancer cells, where it increases invasion, proliferation, survival, and resistance to 5-fluorouracil.75–77
The Notch pathway is also involved in DR.60 It seems activated in NCI/ADR-RES, since NOTCH3 and DLL1 are overexpressed. NOTCH3 is overexpressed in ovarian cancer, and its expression correlates with chemoresistance.78 Knockdown of NOTCH3 inhibits cell proliferation and migration, induces apoptosis, and enhances sensitivity to carboplatin, cisplatin, and paclitaxel.79,80 DLL1 is a transmembrane ligand of the Notch-signaling pathway. It is overexpressed in several cancers and linked to enhanced cell proliferation, survival, and metastasis.81,82 Moreover, DLL1 has been found to be expressed at high levels in patient-derived ovarian cancer xenografts with low sensitivity to cisplatin.83
It is widely recognized that multiple TFs are overactive in human cancer cells, which make them suitable targets for the study of cancer mechanisms. In addition, it is known that some of them are abnormally turned on in human cancer cells and that this activation occurs through multiple mechanisms besides increasing their expression. In the present study, common binding sites for TFs shared by sets of differentially expressed genes of NCI/ADR-RES have been identified (Table S1). Interestingly, four of the six more significant sets are regulated by TFs that are activated upon β-catenin-dependent or independent Wnt signaling (TCF3, LEF1, FOXO4, and NFAT) confirming the importance of this pathway in the maintenance of MDR.
TCF3 and LEF1 are members of the TCF/LEF family of TFs, which are involved in the Wnt-signaling pathway. In the canonical pathway, β-catenin activates transcription of target genes through association with the LEF1/TCF TF family. In the uncanonical Wnt–Ca2+ pathway, Wnt ligands interact with Fzd receptors, producing an increase in intracellular calcium level that subsequently activates the TF NFAT. It has also been shown that β-catenin enhances FOXO4 transcriptional activity.84 Interestingly, seven of the top 20 overexpressed genes in NCI/ADR-RES are targets of these TFs, including ABCB1.
Conclusion
Our results provide information about genes and pathways that contribute to the MDR of NCI/ADR-RES and about new targets for cancer treatment. Combined drug therapies are widely recognized as a fundamental tool in the treatment of cancer. However, attacking the same pathway at multiple points is not enough to overcome DR. Our findings highlight the importance of using orthogonal therapies that target completely independent pathways to overcome mechanisms of resistance to both standard chemotherapeutic agents and molecularly targeted drugs.
Abbreviations
ABCB1, ATP-binding cassette subfamily B member 1; ABCC6, ATP binding cassette subfamily C member 6; CDA, cytidine deaminase; COL4A1, collagen type IV alpha 1; COL4A2, collagen type IV alpha 2; COL4A4, collagen type IV alpha 4; COL13A1, collagen type XIII alpha 1; Ct, cycle threshold; DCDC2, doublecortin domain containing 2; dFdU, 2′,2′-difluoro-2′-deoxyuridine; DCK, deoxycytidine kinase; DLL1, delta-like 1 (Drosophila); DR, drug resistance; ECM, extracellular matrix; EPCAM, epithelial cell adhesion molecule; F, forward; FBS, fetal bovine serum; FGFBP1, fibroblast growth factor binding protein 1; GALC, galactosylceramidase; IGF2, insulin-like growth factor 2; ITGB4, integrin beta 4; ITGB8, integrin beta 8; KEGG, Kyoto Encyclopedia of Genes and Genomes; LAMA4, laminin alpha 4; LGR4, leucine-rich repeat containing G protein-coupled receptor 4; LOXL4, lysyl oxidase-like 4; MMP1, matrix metallopeptidase 1; MDR, multidrug resistance; NID2, nidogen 2; NNMT, nicotinamide N-methyltransferase; NUPR1, nuclear protein transcriptional regulator 1; PPAR, peroxisome proliferator-activated receptor; Pgp, P-glycoprotein; R, reverse; RTA, relative transcription abundance; RT-qPCR, reverse-transcription quantitative polymerase chain reaction; SEMA3D, semaphorin 3D; SLPI, secretory leukocyte peptidase inhibitor; TA, transcription abundance; TACSTD2, tumor-associated calcium signal transducer 2; TF, transcription factor; TFT, transcription factor target; TGFBI, transforming growth factor beta induced; TOP2A, topoisomerase (DNA) II alpha; WNT5A, Wnt family member 5A.
Data availability
The microarray data generated during the current study are available under the accession number GSE75494 in the Gene Expression Omnibus repository (83), (http://www.ncbi.nlm.nih.gov/geo). All analyses of these data are included in this published article and its supplementary information files.
Acknowledgments
We are very grateful to Dr M Figueras, Dr O Serra, and Dr P Boher from the Department of Biology, Universitat de Girona for their help with the RT-qPCR experiments. This work was supported by grants BFU2009-06935 and BIO2013-43517 from MINECO (Spain) and MPCU2016/18 and SING12/0 from UdG (Spain).
Author contributions
All authors contributed toward data analysis, drafting and critically revising the paper, gave final approval of the version to be published, and agree to be accountable for all aspects of the work.
Disclosure
The authors report no conflicts of interest in this work.
References
Ferlay J, Steliarova-Foucher E, Lortet-Tieulent J, et al. Cancer incidence and mortality patterns in Europe: estimates for 40 countries in 2012. Eur J Cancer. 2013;49:1374–1403. | ||
Agarwal R, Kaye SB. Ovarian cancer: strategies for overcoming resistance to chemotherapy. Nat Rev Cancer. 2003;3:502–516. | ||
Gottesman MM, Fojo T, Bates SE. Multidrug resistance in cancer: role of the ATP-dependent transporters. Nat Rev Cancer. 2002;2:48–58. | ||
Ganapathi RN, Ganapathi MK. Mechanisms regulating resistance to inhibitors of topoisomerase II. Front Pharmacol. 2013;4:89. | ||
Rodriguez-Antona C, Ingelman-Sundberg M. Cytochrome P450 pharmacogenetics and cancer. Oncogene. 2006;25:1679–1691. | ||
Baguley BC. Multiple drug resistance mechanisms in cancer. Mol Biotechnol. 2010;46:308–316. | ||
Nakagawa K, Saijo N, Tsuchida S, et al. Glutathione-S-transferase π as a determinant of drug resistance in transfectant cell lines. J Biol Chem. 1990;265:4296–4301. | ||
Fromm MF. The influence of MDR1 polymorphisms on P-glycoprotein expression and function in humans. Adv Drug Deliv Rev. 2002;54:1295–1310. | ||
Tannock IF, Lee CM, Tunggal JK, Cowan DS, Egorin MJ. Limited penetration of anticancer drugs through tumor tissue: a potential cause of resistance of solid tumors to chemotherapy. Clin Cancer Res. 2002;8:878–884. | ||
Di Paolo A, Bocci G. Drug distribution in tumors: mechanisms, role in drug resistance, and methods for modification. Curr Oncol Rep. 2007;9:109–114. | ||
St Croix B, Kerbel RS. Cell adhesion and drug resistance in cancer. Curr Opin Oncol. 1997;9:549–556. | ||
Wu CP, Calcagno AM, Ambudkar SV. Reversal of ABC drug transporter-mediated multidrug resistance in cancer cells: evaluation of current strategies. Curr Mol Pharmacol. 2008;1:93–105. | ||
Tsuruo T, Iida H, Tsukagoshi S, Sakurai Y. Overcoming of vincristine resistance in P388 leukemia in vivo and in vitro through enhanced cytotoxicity of vincristine and vinblastine by verapamil. Cancer Res. 1981;41:1967–1972. | ||
List AF, Spier C, Greer J, et al. Phase I/II trial of cyclosporine as a chemotherapy-resistance modifier in acute leukemia. J Clin Oncol. 1993;11:1652–1660. | ||
Gottesman MM. Mechanisms of cancer drug resistance. Annu Rev Med. 2002;53:615–627. | ||
Lage H. An overview of cancer multidrug resistance: a still unsolved problem. Cell Mol Life Sci. 2008;65:3145–3167. | ||
Liscovitch M, Ravid D. A case study in misidentification of cancer cell lines: MCF-7/AdrR cells (re-designated NCI/ADR-RES) are derived from OVCAR-8 human ovarian carcinoma cells. Cancer Lett. 2007;245:350–352. | ||
Castro J, Ribó M, Puig T, Colomer R, Vilanova M, Benito A. A cytotoxic ribonuclease reduces the expression level of P-glycoprotein in multidrug-resistant cell lines. Invest New Drugs. 2012;30:880–888. | ||
Vert A, Castro J, Ribó M, Benito A, Vilanova M. A nuclear-directed human pancreatic ribonuclease (PE5) targets the metabolic phenotype of cancer cells. Oncotarget. 2016;7:18309–18324. | ||
Edgar R, Domrachev M, Lash AE. Gene Expression Omnibus: NCBI gene expression and hybridization array data repository. Nucleic Acids Res. 2002;30:207–210. | ||
Duncan D, Prodduturi N, Zhang B. WebGestalt2: an updated and expanded version of the web-based gene set analysis toolkit. BMC Bioinformatics. 2010;11:P10. | ||
Pfaffl MW. A new mathematical model for relative quantification in real-time RT-PCR. Nucleic Acids Res. 2001;29:e45. | ||
Benderra Z, Trussardi A, Morjani H, Villa AM, Doglia SM, Manfait M. Regulation of cellular glutathione modulates nuclear accumulation of daunorubicin in human MCF7 cells overexpressing multidrug resistance associated protein. Eur J Cancer. 2000;36:428–434. | ||
Fletcher JI, Williams RT, Henderson MJ, Norris MD, Haber M. ABC transporters as mediators of drug resistance and contributors to cancer cell biology. Drug Resist Updat. 2016;26:1–9. | ||
Belinsky MG, Chen ZS, Shchaveleva I, Zeng H, Kruh GD. Characterization of the drug resistance and transport properties of multidrug resistance protein 6 (MRP6, ABCC6). Cancer Res. 2002;62:6172–6177. | ||
Peng J, Chen B, Shen Z, et al. DNA promoter hypermethylation contributes to down-regulation of galactocerebrosidase gene in lung and head and neck cancers. Int J Clin Exp Pathol. 2015;8:11042–11050. | ||
Soekmadji C, Nelson CC. The emerging role of extracellular vesicle-mediated drug resistance in cancers: implications in advanced prostate cancer. Biomed Res Int. 2015;2015:454837. | ||
Aksoy S, Szumlanski CL, Weinshilboum RM. Human liver nicotinamide N-methyltransferase. cDNA cloning, expression, and biochemical characterization. J Biol Chem. 1994;269:14835–14840. | ||
D’Andrea FP, Safwat A, Kassem M, Gautier L, Overgaard J, Horsman MR. Cancer stem cell overexpression of nicotinamide N-methyltransferase enhances cellular radiation resistance. Radiother Oncol. 2011;99:373–378. | ||
Peng Y, Sartini D, Pozzi V, Wilk D, Emanuelli M, Yee VC. Structural basis of substrate recognition in human nicotinamide N-methyltransferase. Biochemistry. 2011;50:7800–7808. | ||
Ueno H, Kiyosawa K, Kaniwa N. Pharmacogenomics of gemcitabine: can genetic studies lead to tailor-made therapy? Br J Cancer. 2007;97:145–151. | ||
Longoni N, Kunderfranco P, Pellini S, et al. Aberrant expression of the neuronal-specific protein DCDC2 promotes malignant phenotypes and is associated with prostate cancer progression. Oncogene. 2013;32:2315–2324. | ||
Burgess DJ, Doles J, Zender L, et al. Topoisomerase levels determine chemotherapy response in vitro and in vivo. Proc Natl Acad Sci U S A. 2008;105:9053–9058. | ||
Erriquez J, Becco P, Olivero M, et al. TOP2A gene copy gain predicts response of epithelial ovarian cancers to PEGylated liposomal doxorubicin: TOP2A as marker of response to PLD in ovarian cancer. Gynecol Oncol. 2015;138:627–633. | ||
Alpsoy A, Yasa S, Gündüz U. Etoposide resistance in MCF-7 breast cancer cell line is marked by multiple mechanisms. Biomed Pharmacother. 2014;68:351–355. | ||
Januchowski R, Swierczewska M, Sterzyńska K, Wojtowicz K, Nowicki M, Zabel M. Increased expression of several collagen genes is associated with drug resistance in ovarian cancer cell lines. J Cancer. 2016;7:1295–1310. | ||
Januchowski R, Zawierucha P, Ruciński M, Zabel M. Microarray-based detection and expression analysis of extracellular matrix proteins in drug-resistant ovarian cancer cell lines. Oncol Rep. 2014;32:1981–1990. | ||
Januchowski R, Zawierucha P, Ruciński M, Nowicki M, Zabel M. Extracellular matrix proteins expression profiling in chemoresistant variants of the A2780 ovarian cancer cell line. Biomed Res Int. 2014;2014:365867. | ||
Yang JM, Xu Z, Wu H, Zhu H, Wu X, Hait WN. Overexpression of extracellular matrix metalloproteinase inducer in multidrug resistant cancer cells. Mol Cancer Res. 2003;1:420–427. | ||
Deng H, Lv L, Li Y, et al. miR-193a-3p regulates the multi-drug resistance of bladder cancer by targeting the LOXL4 gene and the oxidative stress pathway. Mol Cancer. 2014;13:234. | ||
Aoudjit F, Vuori K. Integrin signaling in cancer cell survival and chemoresistance. Chemother Res Pract. 2012;2012:283181. | ||
Bhatia V, Mula RV, Weigel NL, Falzon M. Parathyroid hormone-related protein regulates cell survival pathways via integrin α6β4-mediated activation of phosphatidylinositol 3-kinase/Akt signaling. Mol Cancer Res. 2009;7:1119–1131. | ||
Folgiero V, Avetrani P, Bon G, et al. Induction of ErbB-3 expression by α6β4 integrin contributes to tamoxifen resistance in ERβ1-negative breast carcinomas. PLoS One. 2008;3:e1592. | ||
Weaver VM, Lelièvre S, Lakins JN, et al. β4 Integrin-dependent formation of polarized three-dimensional architecture confers resistance to apoptosis in normal and malignant mammary epithelium. Cancer Cell. 2002;2:205–216. | ||
Wang WW, Wang YB, Wang DQ, Lin Z, Sun RJ. Integrin beta-8 (ITGB8) silencing reverses gefitinib resistance of human hepatic cancer HepG2/G cell line. Int J Clin Exp Med. 2015;8:3063–3071. | ||
Ahmed AA, Mills AD, Ibrahim AE, et al. The extracellular matrix protein TGFBI induces microtubule stabilization and sensitizes ovarian cancers to paclitaxel. Cancer Cell. 2007;12:514–527. | ||
Lehne G, Grasmo-Wendler UH, Berner JM, et al. Upregulation of stem cell genes in multidrug resistant K562 leukemia cells. Leuk Res. 2009;33:1379–1385. | ||
Rasool N, LaRochelle W, Zhong H, Ara G, Cohen J, Kohn EC. Secretory leukocyte protease inhibitor antagonizes paclitaxel in ovarian cancer cells. Clin Cancer Res. 2010;16:600–609. | ||
Yang Z, Yang Z, Zou Q, et al. A comparative study of clinicopathological significance, FGFBP1, and WISP-2 expression between squamous cell/adenosquamous carcinomas and adenocarcinoma of the gallbladder. Int J Clin Oncol. 2014;19:325–335. | ||
Ji Y, Wei S, Hou J, et al. Integrated proteomic and N-glycoproteomic analyses of doxorubicin sensitive and resistant ovarian cancer cells reveal glycoprotein alteration in protein abundance and glycosylation. Oncotarget. 2017;8:13413–13427. | ||
Dollé L, Theise ND, Schmelzer E, Boulter L, Gires O, van Grunsven LA. EpCAM and the biology of hepatic stem/progenitor cells. Am J Physiol Gastrointest Liver Physiol. 2015;308:G233–G250. | ||
Schwab CL, English DP, Roque DM, Pasternak M, Santin AD. Past, present and future targets for immunotherapy in ovarian cancer. Immunotherapy. 2014;6:1279–1293. | ||
Ni J, Cozzi P, Hao J, et al. Epithelial cell adhesion molecule (EpCAM) is associated with prostate cancer metastasis and chemo/radioresistance via the PI3K/Akt/mTOR signaling pathway. Int J Biochem Cell Biol. 2013;45:2736–2748. | ||
Kimura O, Kondo Y, Kogure T, et al. Expression of EpCAM increases in the hepatitis B related and the treatment-resistant hepatocellular carcinoma. Biomed Res Int. 2014;2014:172913. | ||
Gao J, Yan Q, Liu S, Yang X. Knockdown of EpCAM enhances the chemosensitivity of breast cancer cells to 5-fluorouracil by downregulating the antiapoptotic factor Bcl-2. PLoS One. 2014;9:e102590. | ||
Nguyen H, Rendl M, Fuchs E. Tcf3 governs stem cell features and represses cell fate determination in skin. Cell. 2006;127:171–183. | ||
Chen Q, Zhou J, Jiang C, Chen J. Reversal of P-glycoprotein-mediated multidrug resistance in SGC7901/VCR cells by PPARγ activation by troglitazone. J Huazhong Univ Sci Technol Med Sci. 2010;30:326–331. | ||
Rajkumar T, Yamuna M. Multiple pathways are involved in drug resistance to doxorubicin in an osteosarcoma cell line. Anticancer Drugs. 2008;19:257–265. | ||
Wang Q, Chen X, Hai S, et al. [TNFα-induced reversal of multidrug resistance in human hepatocellular carcinoma cells]. Zhonghua Wai Ke Za Zhi. 2007;45:602–604. Chinese. | ||
Wang Z, Li Y, Ahmad A, et al. Targeting Notch signaling pathway to overcome drug resistance for cancer therapy. Biochim Biophys Acta. 2010;1806:258–267. | ||
Anastas JN, Moon RT. WNT signalling pathways as therapeutic targets in cancer. Nat Rev Cancer. 2013;13:11–26. | ||
LoPiccolo J, Blumenthal GM, Bernstein WB, Dennis PA. Targeting the PI3K/Akt/mTOR pathway: effective combinations and clinical considerations. Drug Resist Updat. 2008;11:32–50. | ||
Huang GS, Brouwer-Visser J, Ramirez MJ, et al. Insulin-like growth factor 2 expression modulates Taxol resistance and is a candidate biomarker for reduced disease-free survival in ovarian cancer. Clin Cancer Res. 2010;16:2999–3010. | ||
Shvartsur A, Bonavida B. Trop2 and its overexpression in cancers: regulation and clinical/therapeutic implications. Genes Cancer. 2015;6:84–105. | ||
Chowdhury UR, Samant RS, Fodstad O, Shevde LA. Emerging role of nuclear protein 1 (NUPR1) in cancer biology. Cancer Metastasis Rev. 2009;28:225–232. | ||
Clark DW, Mitra A, Fillmore RA, et al. NUPR1 interacts with p53, transcriptionally regulates p21 and rescues breast epithelial cells from doxorubicin-induced genotoxic stress. Curr Cancer Drug Targets. 2008;8:421–430. | ||
Vincent AJ, Ren S, Harris LG, et al. Cytoplasmic translocation of p21 mediates NUPR1-induced chemoresistance: NUPR1 and p21 in chemoresistance. FEBS Lett. 2012;586:3429–3434. | ||
Sherwood V, Chaurasiya SK, Ekström EJ, et al. WNT5A-mediated β-catenin-independent signalling is a novel regulator of cancer cell metabolism. Carcinogenesis. 2014;35:784–794. | ||
Mikels AJ, Nusse R. Purified Wnt5a protein activates or inhibits β-catenin-TCF signaling depending on receptor context. PLoS Biol. 2006;4:e115. | ||
Hung TH, Hsu SC, Cheng CY, et al. Wnt5A regulates ABCB1 expression in multidrug-resistant cancer cells through activation of the non-canonical PKA/β-catenin pathway. Oncotarget. 2014;5:12273–12290. | ||
Carmon KS, Gong X, Yi J, Thomas A, Liu Q. RSPO-LGR4 functions via IQGAP1 to potentiate Wnt signaling. Proc Natl Acad Sci U S A. 2014;111:E1221–E129. | ||
Flahaut M, Meier R, Coulon A, et al. The Wnt receptor FZD1 mediates chemoresistance in neuroblastoma through activation of the Wnt/β-catenin pathway. Oncogene. 2009;28:2245–2256. | ||
Corrêa S, Binato R, Du Rocher B, Castelo-Branco MTL, Pizzatti L, Abdelhay E. Wnt/β-catenin pathway regulates ABCB1 transcription in chronic myeloid leukemia. BMC Cancer. 2012;12:303. | ||
Peng C, Zhang X, Yu H, Wu D, Zheng J. Wnt5a as a predictor in poor clinical outcome of patients and a mediator in chemoresistance of ovarian cancer. Int J Gynecol Cancer. 2011;21:280–288. | ||
Zhang JT, Zhou WL, He C, Liu T, Li CY, Wang L. 5-Fluorouracil induces apoptosis of colorectal cancer cells. Genet Mol Res. 2016;15:15017326. | ||
Liang F, Yue J, Wang J, et al. GPCR48/LGR4 promotes tumorigenesis of prostate cancer via PI3K/Akt signaling pathway. Med Oncol. 2015;32:32–49. | ||
Wu J, Xie N, Xie K, et al. GPR48, a poor prognostic factor, promotes tumor metastasis and activates β-catenin/TCF signaling in colorectal cancer. Carcinogenesis. 2013;34:2861–2869. | ||
Groeneweg JW, Foster R, Growdon WB, Verheijen RH, Rueda BR. Notch signaling in serous ovarian cancer. J Ovarian Res. 2014;7:95. | ||
McAuliffe SM, Morgan SL, Wyant GA, et al. Targeting Notch, a key pathway for ovarian cancer stem cells, sensitizes tumors to platinum therapy. Proc Natl Acad Sci U S A. 2012;109:E2939–E2948. | ||
Kang H, Jeong JY, Song JY, et al. Notch3-specific inhibition using siRNA knockdown or GSI sensitizes paclitaxel-resistant ovarian cancer cells. Mol Carcinog. 2016;55:1196–1209. | ||
Irshad K, Mohapatra SK, Srivastava C, et al. A combined gene signature of hypoxia and Notch pathway in human glioblastoma and its prognostic relevance. PLoS One. 2015;10:e0118201. | ||
Purow BW, Haque RM, Noel MW, et al. Expression of Notch-1 and Its ligands, Delta-like-1 and Jagged-1, is critical for glioma cell survival and proliferation. Cancer Res. 2005;65:2353–2363. | ||
Ricci F, Fratelli M, Guffanti F, et al. Patient-derived ovarian cancer xenografts re-growing after a cisplatinum treatment are less responsive to a second drug re-challenge: a new experimental setting to study response to therapy. Oncotarget. 2014;5:7441–7451. | ||
Hoogeboom D, Essers MA, Polderman PE, Voets E, Smits LM, Burgering BM. Interaction of FOXO with β-catenin inhibits β-catenin/T cell factor activity. J Biol Chem. 2008;283:9224–9230. |
Supplementary materials
 | Figure S1 Validation of constitutive genes. |
 | Figure S2 Effect of different antitumor drugs on NCI/ADR-RES and OVCAR-8 proliferation. |
 | Table S1 Potential transcription-factor targets for NCI/ADR-RES drug-resistance genes |
 | Table S2 Predicted effect of PPARs on genes included in the term “PPAR-signaling pathway” |
References
Baldán A, Relat J, Marrero PF, Haro D. Functional interaction between peroxisome proliferator-activated receptors-α and Mef-2C on human carnitine palmitoyltransferase 1β (CPT1β) gene activation. Nucleic Acids Res. 2004;32:4742–4749. | ||
Sanderson LM, Degenhardt T, Koppen A, et al. Peroxisome proliferator-activated receptor β/δ (PPARβ/δ) but not PPARα serves as a plasma free fatty acid sensor in liver. Mol Cell Biol. 2009;29:6257–6267. | ||
Quinn CM, Jessup W, Wong J, Kritharides L, Brown AJ. Expression and regulation of sterol 27-hydroxylase (CYP27A1) in human macrophages: a role for RXR and PPARγ ligands. Biochem J. 2005;385:823–830. | ||
Kawabe K, Saegusa H, Seto K, Urabe H, Motojima K. Peroxisome proliferator-activated receptor α and its response element are required but not sufficient for transcriptional activation of the mouse heart-type fatty acid binding protein gene. Int J Biochem Cell Biol. 2005;37:1534–1546. | ||
Kan CF, Singh AB, Dong B, Shende VR, Liu J. PPARδ activation induces hepatic long-chain acyl-CoA synthetase 4 expression in vivo and in vitro. Biochim Biophys Acta. 2015;1851:577–587. | ||
Ham SA, Kang ES, Lee H, et al. PPARδ inhibits UVB-induced secretion of MMP-1 through MKP-7-mediated suppression of JNK signaling. J Invest Dermatol. 2013;133:2593–2600. | ||
Chehaibi K, Cedó L, Metso J, et al. PPAR-β/δ activation promotes phospholipid transfer protein expression. Biochem Pharmacol. 2015;94:101–108. | ||
Byagowi S, Farivar T, Najafipour R, et al. Effect of PPARδ agonist on stearoyl-CoA desaturase 1 in human pancreatic cancer cells: role of MEK/ERK1/2 pathway. Can J Diabetes. 2015;39:123–127. | ||
König B, Rauer C, Rosenbaum S, Brandsch C, Eder K, Stangl GI. Fasting upregulates PPARα target genes in brain and influences pituitary hormone expression in a PPARα dependent manner. PPAR Res. 2009;2009:801609. |
 © 2018 The Author(s). This work is published and licensed by Dove Medical Press Limited. The
full terms of this license are available at https://www.dovepress.com/terms
and incorporate the Creative Commons Attribution
- Non Commercial (unported, 3.0) License.
By accessing the work you hereby accept the Terms. Non-commercial uses of the work are permitted
without any further permission from Dove Medical Press Limited, provided the work is properly
attributed. For permission for commercial use of this work, please see paragraphs 4.2 and 5 of our Terms.
© 2018 The Author(s). This work is published and licensed by Dove Medical Press Limited. The
full terms of this license are available at https://www.dovepress.com/terms
and incorporate the Creative Commons Attribution
- Non Commercial (unported, 3.0) License.
By accessing the work you hereby accept the Terms. Non-commercial uses of the work are permitted
without any further permission from Dove Medical Press Limited, provided the work is properly
attributed. For permission for commercial use of this work, please see paragraphs 4.2 and 5 of our Terms.