Back to Journals » Journal of Inflammation Research » Volume 18
Topological Radiomics in Predicting Mucosal Healing and Activity Score of Crohn’s Disease Using Multi-Task Deep Learning
Authors Tang K, Wu X, Li J, Yu L, Yang L, Zhang Y, Zhang L, Wang Y, Li K ![]()
Received 7 August 2025
Accepted for publication 9 December 2025
Published 23 December 2025 Volume 2025:18 Pages 17895—17910
DOI https://doi.org/10.2147/JIR.S555403
Checked for plagiarism Yes
Review by Single anonymous peer review
Peer reviewer comments 3
Editor who approved publication: Dr Nadia Andrea Andreani
Kaiqiang Tang,1,* Xinyan Wu,1,2,* Junlin Li,3 Li Yu,1,4 Ling Yang,1 Yue Zhang,1,4 Lingfeng Zhang,1,2 Yazhou Wang,5 Kang Li1,4
1Department of Radiology, Chongqing General Hospital, Chongqing University, Chongqing, 401147, People’s Republic of China; 2North Sichuan Medical College, Nanchong, Sichuan, 637100, People’s Republic of China; 3Department of Radiology, The 13th People’s Hospital of Chongqing, Chongqing, 400050, People’s Republic of China; 4Chongqing Medical University, Chongqing, 400016, People’s Republic of China; 5Chongqing University, Chongqing, 400044, People’s Republic of China
*These authors contributed equally to this work
Correspondence: Kang Li, Department of Radiology, Chongqing General Hospital, Chongqing University, Chongqing, 401147, People’s Republic of China, Email [email protected]
Background: Endoscopic evaluation remains the gold standard for assessing Crohn’s disease (CD) activity and mucosal healing (MH), but it is invasive, expensive and time consuming. Therefore, there is an urgent need for a non-invasive quantitative alternative method.
Aim: To develop a topological radiomics-based multi-task deep learning model for simultaneous prediction of MH status and endoscopic activity scores in CD.
Methods: A total of 81 CD patients were stratified into training (n=60) and validation (n=21) groups at a 7:3 ratio. Topological radiomic features were extracted from multiphase CT enterography. A multi-task model was trained to predict MH (classification) and SES-CD (regression), integrating feature selection and SHAP-based interpretability.
Results: Three discriminative topological features were identified across arterial and portal phases. For MH prediction, the multi-task model achieved an AUC of 0.938 for training set and 0.875 for validation set. For SES-CD prediction, it showed lower MSE and MAE, with higher R2 and C-index than the single-phase models.
Conclusion: The multi-task topological radiomics framework enables accurate, non-invasive assessment of mucosal healing and endoscopic activity in CD, offering a clinically interpretable approach with strong translational potential. Future studies with larger cohorts are warranted to further validate its robustness.
Keywords: topological data analysis, Crohn’s disease, deep learning, mucosal healing
Introduction
Crohn’s disease (CD) is a chronic inflammatory disorder characterized by segmental and transmural intestinal inflammation, leading to progressive structural damage and disability. The global incidence of CD continues to increase, with the highest prevalence reported in North America and Europe. Meanwhile, the incidence in Asian populations has risen rapidly, driven by lifestyle transitions, reaching a level that can no longer be overlooked.1,2 Achieving mucosal healing (MH) has emerged as a key therapeutic goal, correlating with sustained remission and reduced surgical risk3 Currently, the mucosal status is commonly evaluated using the Simplified Endoscopic Score for Crohn’s Disease (SES-CD), which is one of the most validated and quantitative scoring systems for assessing CD activity. The SES-CD evaluates four parameters—ulcer size, ulcerated surface, affected surface, and the presence of narrowing—across five bowel segments, providing an objective measure of endoscopic disease activity. Although endoscopy remains the diagnostic gold standard for assessing MH and disease activity,4 its invasiveness, cost, and patient discomfort limit its longitudinal use.5,6 Therefore, there is a growing need for accurate, non-invasive imaging biomarkers to assess CD activity.
With the advancement of radiological imaging technologies, non-invasive evaluation of CD has become increasingly feasible. CT enterography (CTE), in particular, provides high resolution visualization of the bowel wall and extramural complications. Among its recent developments, dual-energy CTE (DECTE), which acquires datasets at two different energy levels, has shown great potential for tissue characterization and quantitative analysis. DECTE has been widely applied in vascular imaging, tumor differentiation, and prognostic evaluation, and is now gradually being adopted in the assessment of inflammatory bowel disease (IBD).7–9
Radiomics has recently been explored for quantitative evaluation of CD by extracting imaging-derived features from CT or MRI. However, most existing approaches rely on single-task learning (predicting one outcome at a time) and single-phase imaging, which inadequately capture the complex, multi-dimensional nature of CD inflammation.10 These limitations constrain generalization and predictive stability. Clinical observations have revealed that morphological alterations of the intestinal wall—such as irregularity, abnormal motility, and wall thickening—are strongly associated with Crohn’s disease activity. These findings suggest that topological features, which capture complex morphological and geometric variations, may hold promise for non-invasive assessment of disease activity in Crohn’s disease.11,12
Topological radiomics, an emerging branch of radiomics, applies topological data analysis (TDA) to characterize high-order geometric structures and spatial relationships in tissues.10,13 Unlike conventional radiomics that primarily quantify texture and intensity, topological descriptors capture deformation-invariant and connectivity-based information, which has shown enhanced discriminative power in lesion classification and morphological quantification. In parallel, Multi-Task Deep Learning (MTDL) has emerged as a powerful deep learning paradigm that enables shared representation learning across multiple related tasks, such as lesion segmentation and disease activity prediction. By leveraging inter-task correlations, MTDL improves model generalization, robustness, and computational efficiency.14,15 Integrating topological radiomics with MTDL may therefore provide a synergistic framework for accurate and non-invasive assessment of Crohn’s disease activity.
In this study, we propose a topological radiomics–based multi-task deep learning model for simultaneous prediction of mucosal healing status and endoscopic activity scores in Crohn’s disease. This approach aims to overcome the limitations of conventional radiomics and single-task models by jointly leveraging multi-phase imaging data and topological information, offering a more comprehensive, interpretable, and clinically applicable assessment tool.
Materials and Methods
Study Design and Patients
The study was conducted in accordance with the Declaration of Helsinki (as revised in 2013) and was approved by the ethics committee of Chongqing General Hospital (Ethical code: KY S2024-076-01). Given its retrospective design and the use of fully anonymized imaging and clinical data, the requirement for informed consent was waived by the ethics committee.
Patients with CD between July 2021 and October 2024 were enrolled, and all subjects underwent CTE scanning. The inclusion and exclusion criteria were defined to ensure clinical and therapeutic homogeneity among patients and to establish a stable correlation between imaging features and endoscopic activity. The inclusion criteria for candidate patients were as follows: (1) patients diagnosed with CD; (2) patients with ulcerative lesions in the colon, rectum or terminal ileum 6 to 12 months before CTE examination, was applied to minimize variability in disease activity over time; (3) patients who have received standardized biologic therapy for at least 6 months, as biologics represent the current therapeutic mainstay for moderate-to-severe Crohn’s disease and directly influence mucosal healing outcomes. The exclusion criteria are as follows: (1) patients who have not undergone endoscopy after treatment; (2) patients with a history of surgery on the terminal ileum and colon; (3) patients with poor image quality or inability to generate an iodograph. A total of 373 patients were initially screened according to the predefined inclusion and exclusion criteria. Among them, 281 patients were excluded due to missing DECT data or absence of colonoscopy examinations following biochemical treatment. An additional 10 patients were excluded because they underwent intestinal surgery during the treatment period, and 1 patient was excluded due to poor CT image quality that did not meet the requirements for radiomic feature extraction. The final cohort comprised 81 CD patients. Endoscopy-defined mucosal healing status (binary variable: MH/non-MH groups) and SES-CD scores (continuous variable) were recorded. The cohort comprised 25 MH group cases (30.9%) and 56 non-MH group cases (69.1%), with SES-CD scores ranging from 0 to 34. All patients were randomly divided into a training group (n = 60) and a test group (n = 21) in a 7:3 ratio. Figure 1 shows our study flow chart.
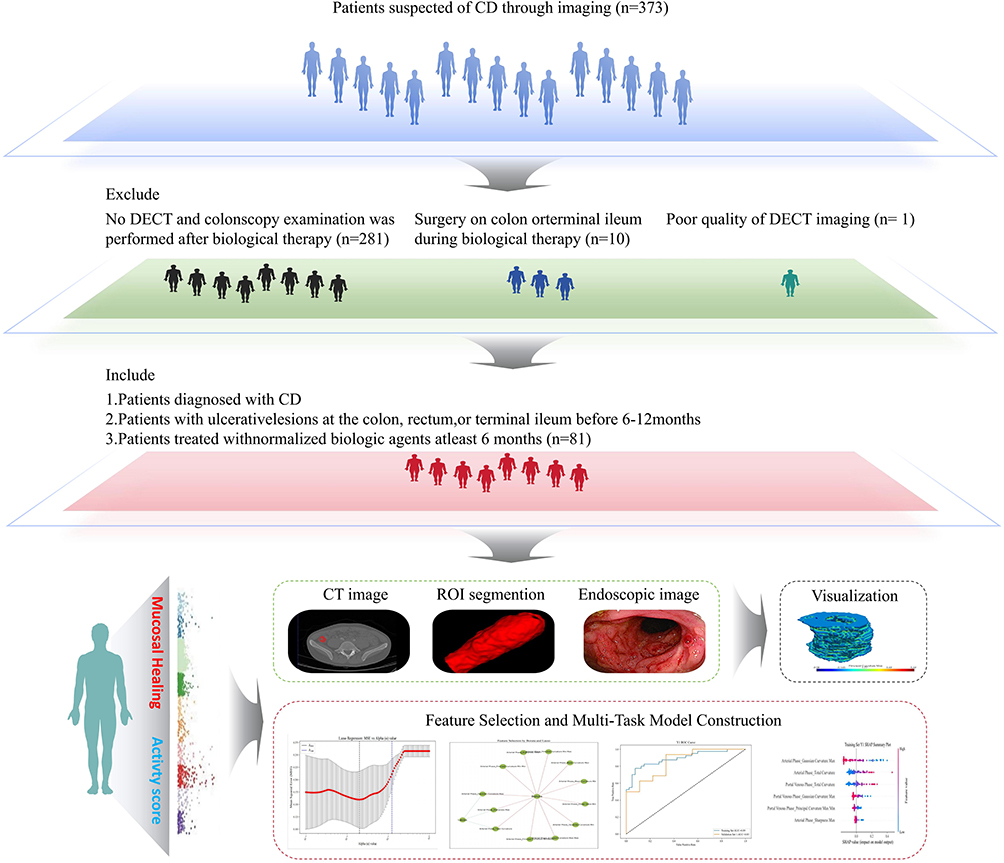 |
Figure 1 Workflow for the basic steps of setting up a radiomics model. |
DECT Imaging Technology and Post-Processing
All patients should fast for 12 hours and refrain from drinking before the DECT scan. 2000 mL of 2.5% isotonic mannitol should be administered 1 hour before the scan to fill the bowel (500 mL / 15 minutes). We used a dual-energy CT scanner (IQon Spectral CT, Philips Healthcare, Netherlands) for scanning. The tube voltage is fixed at 120 kVp, the tube current at 145 mAs, the pitch at 1.2, the rotation speed at 0.5 s and the reconstruction layer thickness at 1.00 mm. Contrast medium (Iopamidol, 350 mg (I)/mL, Jiangsu Hengrui medicine CO., LTD., China) was injected intravenously via a peripheral vein using a high-pressure syringe. The injection speed was 1.5 mL/kg and 3.0 mL/s. The scan time was monitored using a monitoring method. The abdominal aorta was monitored 10s after injection of the contrast medium, and the threshold was automatically triggered when 150 HU was reached. The arterial and venous phases of the CTE were collected approximately 30s and 80s after injection of the contrast medium, respectively.
Data on the Colonoscopy
Mucosal inflammation was assessed by blinded gastroenterologists (≥5 years’ endoscopic experience) using unified criteria.16 MH is defined as the disappearance of active ulcers after treatment in patients with CD who have a history of active ulcers or a SES-CD score of less than 3.16–19 The endoscopic activity score is based on the systematic examination of the inflamed areas of the intestine during the assessment process, and the score is given according to the number, size, depth and distribution of ulcers. A segment was considered to have achieved mucosal healing when it demonstrated the following imaging characteristics: (1) Normal bowel wall thickness (<3 mm); (2) Absence of mural hyperenhancement or stratified enhancement patterns; (3) Disappearance of ulcers or mucosal irregularity; (4) No perienteric fat stranding, vascular engorgement (comb sign), or mesenteric edema. For DECTE datasets, both virtual monochromatic images (at 70 keV) and iodine maps were additionally reviewed to confirm the absence of increased iodine uptake, which further supports the absence of active inflammation. All scoring results are recorded and analyzed in correlation with imaging data to ensure the accuracy and reliability of subsequent radiomics models.
Segmentation and Topological Radiomics Feature Extraction
Two radiologists with more than 5 years of experience in abdominal imaging independently performed semi-automatic segmentation using the Philips IntelliSpace Discovery 3.0 (ISD) platform. Both readers were blinded to the patients’ clinical and colonoscopic information. Segmentation was conducted on iodine density images obtained from both the arterial and portal venous phases. The segmentation process began with a region-growing algorithm automatically identifying the bowel wall based on attenuation thresholds, followed by manual refinement to exclude luminal contents, adjacent fat, and artifacts. The volume of interest (VOI) for each patient was selected according to the following criteria: (1) exclude intestinal contents; (2) for MH patients, select the segment that has completely healed; (3) for non-MH patients, select the segment with the thickest intestinal wall. (4) when multiple segments were involved, the most severely affected intestinal segment was delineated according to the overall endoscopic activity score. Finally, topological image features are extracted using Python (version 3.8.9), including six categories: Principal Curvature, Gaussian Curvature, Mean Curvature, Sharpness, Shape Index and Total Curvature. Figure 2 shows the workflow of the basic steps for building a radiomics model.
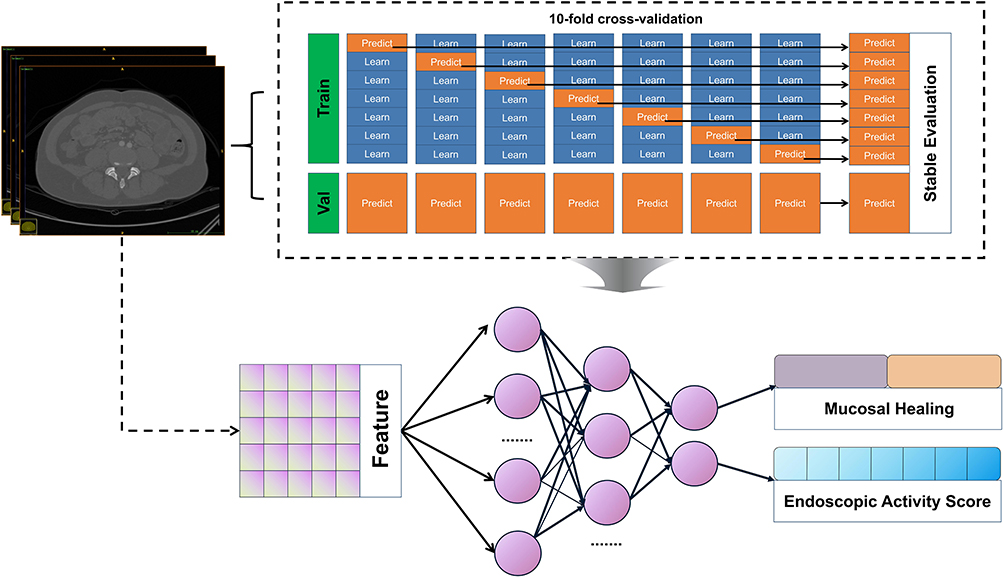 |
Figure 2 Schematic Diagram of a Multi-Task Deep Learning Model. This illustration delineates the comprehensive workflow of the model from image input to predictive output. Initially, topological radiomics features are extracted from arterial phase and portal venous phase CT images, which are subsequently fed into a multi-task neural network model. The model concurrently generates two outputs: mucosal healing (classification task) and intestinal activity score (regression task). To enhance the model’s generalization capability and evaluation stability, a 10-fold cross-validation approach is implemented, with result integration performed after each training and prediction cycle to ensure the robustness and reliability of model evaluation. |
Smote Oversampling
Patients with CD were stratified into MH and non-MH groups. Significant inter-group size imbalance was mitigated using Synthetic Minority Over-sampling Technique (SMOTE), exclusively applied to the training set to preserve biological plausibility. The validation set remained untouched and retained its original distribution to ensure that model performance evaluation reflects true generalization. Specifically, all topological radiomics features are first normalized to ensure that the feature values are in the same scale range, and then SMOTE is used to increase the number of minority class samples by generating synthetic samples in the feature space to achieve balanced group distribution prior to model training.
Feature Selection
Feature selection was performed in a multi-stage, nested manner within 10-fold cross-validation to prevent data leakage. In each training fold, univariate filtering using t-test and chi-square test (P<0.05) was first applied to remove statistically irrelevant features. Subsequently, the least absolute shrinkage and selection operator (LASSO) with internal 10-fold cross-validation was used to identify features with the strongest predictive contribution while enforcing sparsity. Finally, the Boruta algorithm, based on random forest–derived importance scores, was applied to verify feature stability and capture potential nonlinear associations. All feature selection steps were confined to the training subsets, ensuring complete independence from the validation data. Following feature selection using a combined LASSO and Boruta algorithm, four topological imaging features were identified as suitable for multitask deep learning modeling. This dimensionality reduction step ensured that only the most informative features were retained, thereby reducing overfitting risk in the limited-sample setting. Figure 3 provides a visual representation of these features: Figure 3A illustrates the distribution of Gaussian curvature; Figure 3B displays the sharpness distribution of the structured surface; Figure 3C presents the total curvature; and Figure 3D depicts the distribution of maximum principal curvature.
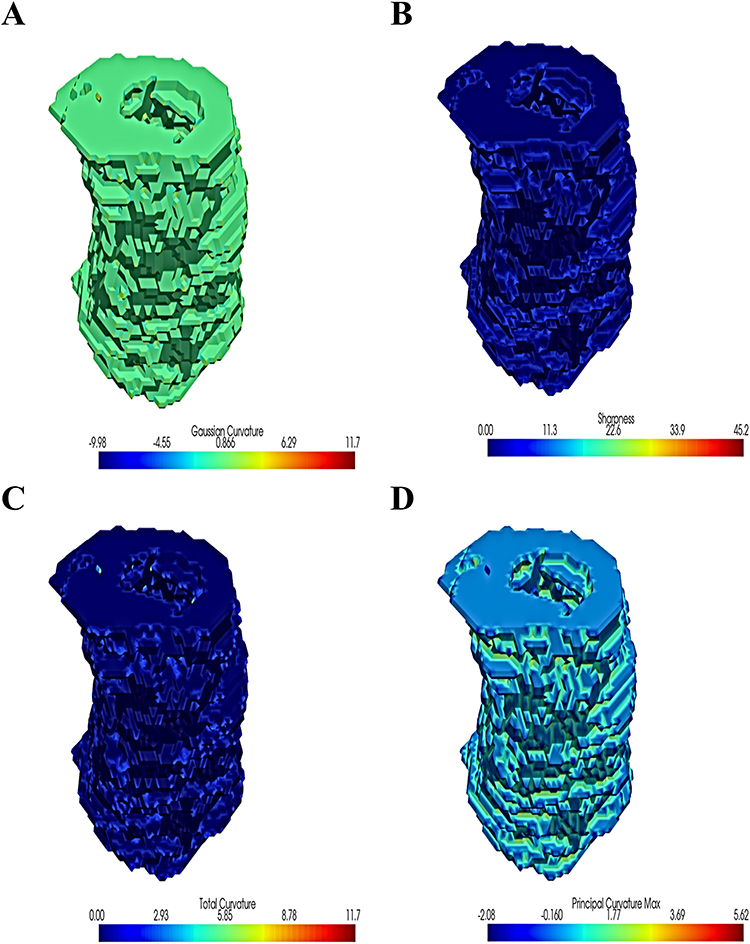 |
Figure 3 Visualisation of topological imaging features. (A) showed Gaussian curvature distribution. Gaussian curvature is a measure of the local surface curvature. The colour scale ranges from blue (negative curvature, saddle-shaped surface) to red (positive curvature, spherical convex surface), with green in the middle representing flat areas with near-zero curvature. (B) showed sharpness distribution of the structured surface. Sharpness is an indicator of the local sharpness of the surface. The higher the value, the more drastic the surface change in that area. The colour scale goes from blue to red, representing a change from smooth to sharp. (C) showed total curvature. This indicator reflects the overall curvature of the local surface. The larger the value, the more significant the surface curvature. The colour scale goes from blue to red, representing an increase in total curvature. (D) showed principal curvature max. This indicator shows the distribution of the maximum principal curvature. Principal curvature is the curvature of a surface at a point in two orthogonal directions. A larger value reflects the greatest curvature of the surface in a particular direction. The colour scale goes from blue to red, indicating a change in principal curvature from small to large. |
Multi-Task Deep Learning Model Building
This study constructs a multi-task deep learning architecture that includes a shared network and two task-specific networks. First, the dataset contains input features X, a binary classification task label Y1 (MH status) and a regression task label Y2 (SES-CD). During data loading, all features are converted to floating-point tensors to meet the input requirements of the deep learning model. The binary classification task uses BCEWithLogitsLoss and the regression task uses MSELoss. During forward propagation, the model outputs the predictions for both tasks simultaneously, calculates the respective losses, and finally takes the average of all task losses as the total loss for backpropagation. The shared network consists of a fully connected layer, a ReLU activation function and a dropout layer, which is used to extract a low-level representation of the input features. Task 1 network is responsible for the binary classification task and outputs the predicted result of mucosal healing; task 2 network is responsible for the regression task and outputs the predicted value of endoscopic activity score. To further control overfitting risk under limited sample conditions, the model was trained with a limited number of features (n = 4) selected through multi-step feature reduction procedures. The compact input dimension, combined with dropout and shared representations in the multitask setting, effectively reduced model complexity and enhanced generalization.
Deep Learning Architecture and Model Training Details
The multi-task learning model was implemented using Python 3.8.9 and PyTorch 1.12.1. The network architecture comprised a shared fully connected layer (input dimension = 4, hidden dimension = 256) followed by a ReLU activation and dropout layer (dropout probability = 0.3) to prevent overfitting. Two task-specific fully connected layers were constructed for MH classification and SES-CD regression, respectively. The classification head output logits optimized using binary cross-entropy loss (BCEWithLogitsLoss), and the regression head was optimized using mean squared error (MSELoss). The Adam optimizer was applied (learning rate = 0.001, epsilon = 1×10⁻⁷, weight decay = 1×10⁻⁵) with ReduceLROnPlateau scheduling (factor = 0.5, patience = 10 epochs). The model was trained for 1000 epochs with a batch size of 20. All experiments were performed on CPU hardware (Intel i7-11700, 16 GB RAM), and random seeds were fixed to ensure reproducibility. Model evaluation followed a 10-fold cross-validation procedure. Within each fold, feature selection, training, and testing were performed independently to avoid data leakage. Confidence intervals (95% CIs) for AUC and C-index metrics were computed using the compute_auc_ci function implemented in Python.
Multi-Task Deep Learning Model Evaluation
ROC curves and AUC values are used to evaluate binary classification tasks, while performance evaluation results are visually displayed using confusion matrices and performance histograms such as sensitivity and specificity. For regression tasks, the performance of the model in predicting continuous variables is assessed using feature importance analysis and performance histograms. Specific regression evaluation indicators include mean square error (MSE), mean absolute error (MAE), coefficient of determination (R2) and consistency index (C-index). During model training, a 10-fold cross-validation method is used to adjust the parameters to ensure the stability and generalisation ability of the model. Through a multi-task learning framework, the model can optimise two related tasks simultaneously, using the synergistic information between tasks to improve overall prediction performance.
SHAP Model Interpretation
This study introduces the SHAP (SHapley Additive exPlanations) method to interpret the prediction results of multi-task deep learning models. The SHAP method is based on game theory and provides a comprehensive feature importance analysis by calculating the contribution value of each feature to the prediction result. For MH) prediction (binary classification tasks), SHAP summary plots visualize per-patient feature contribution profiles. Concurrently, global feature importance was quantified by aggregating SHAP values across all samples. For SES-CD prediction (the regression task), a SHAP Summary plot is also generated to show the impact of each feature on the prediction of the continuous variable. Furthermore, the average SHAP value of each feature was calculated to further quantify the importance and assist clinicians identifying key radiomics features in disease assessment. By applying the SHAP method, the study not only provides a high-performance predictive model, but also ensures the transparency and interpretability of the model decision-making process.
Statistical Analyses
Statistical analysis was performed using R software 4.3.1 (https://www.rproject.org) and Python 3.8.3 (https://www.python.org). When the data follow a normal distribution, the independent samples t-test is used to compare continuous variables, otherwise the Mann–Whitney U-test is used. Test categorical variables using the chi-square or Fisher’s exact test. P < 0.05 is considered significant.
Results
Patient Characteristics
A total of 81 CD patients were included in this study, 46 males (56.7%) and 35 females (43.2%), with an average age of 29.345±10.022 years. MH was achieved in 25 patients (30.9%), while MH was not achieved in 56 patients (69.1%). The mean SES-CD score was 8.432±8.418, indicating some variation in the patients’ endoscopic activity. Furthermore, the mean duration was 52.358±37.082 months, and sixteen patients (19.8%) received adalimumab, 41 (50.6%) infliximab, 23 (28.4%) ustekinumab and 1 (1.2%) vedolizumab (Table 1).
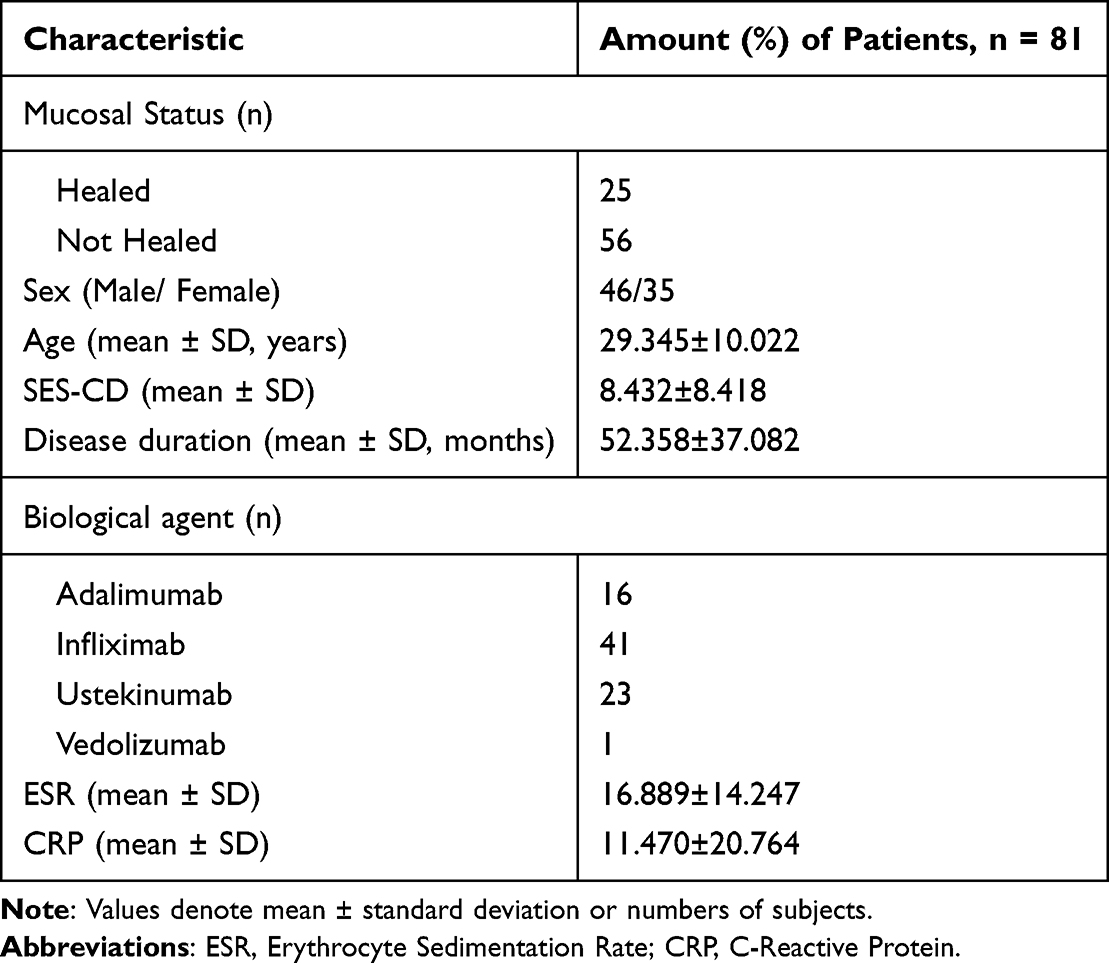 |
Table 1 Patient Characteristic |
Feature Selection and Radiomics Model Construction
During the arterial phase, a t-test was first performed, and a total of 12 significant features (p < 0.05) were selected. Subsequently, LASSO regression was used for further screening (Figure 4A and B), and in combination with the Boruta algorithm (Figure 4C), three key features were finally determined: Arterial Phase Total Curvature, Arterial Phase Sharpness Max and Arterial Phase Gaussian Curvature Max (Coefficient = 0.0656, −0.0708, −0.1079), as shown in Figure 4. Furthermore, A total of 8 significant features (p < 0.05) were selected by t-test in the portal vein phase. Subsequently, three key features were finally determined by combining LASSO regression (Figure 4D and E) and the Boruta algorithm (Figure 4F): Portal Venous Phase Total Curvature, Portal Venous Phase Gaussian Curvature Max and Portal Venous Phase Principal Curvature Max Min (Coefficient = −0.0483, −0.1699 and 0.0928), as shown in Figure 4. The features shared by both the arterial and portal venous phases are Total Curvature and Gaussian Curvature Max. After removing duplicates, a total of four features remain: Total Curvature, Gaussian Curvature Max, Sharpness Max, and Principal Curvature Max Min. To provide an intuitive understanding of these topological features, we visualized them in Figure 3. By performing a pre-fusion of the arterial and portal phases, we also continued to construct a topological radiomics model combining the arterial and portal phases.
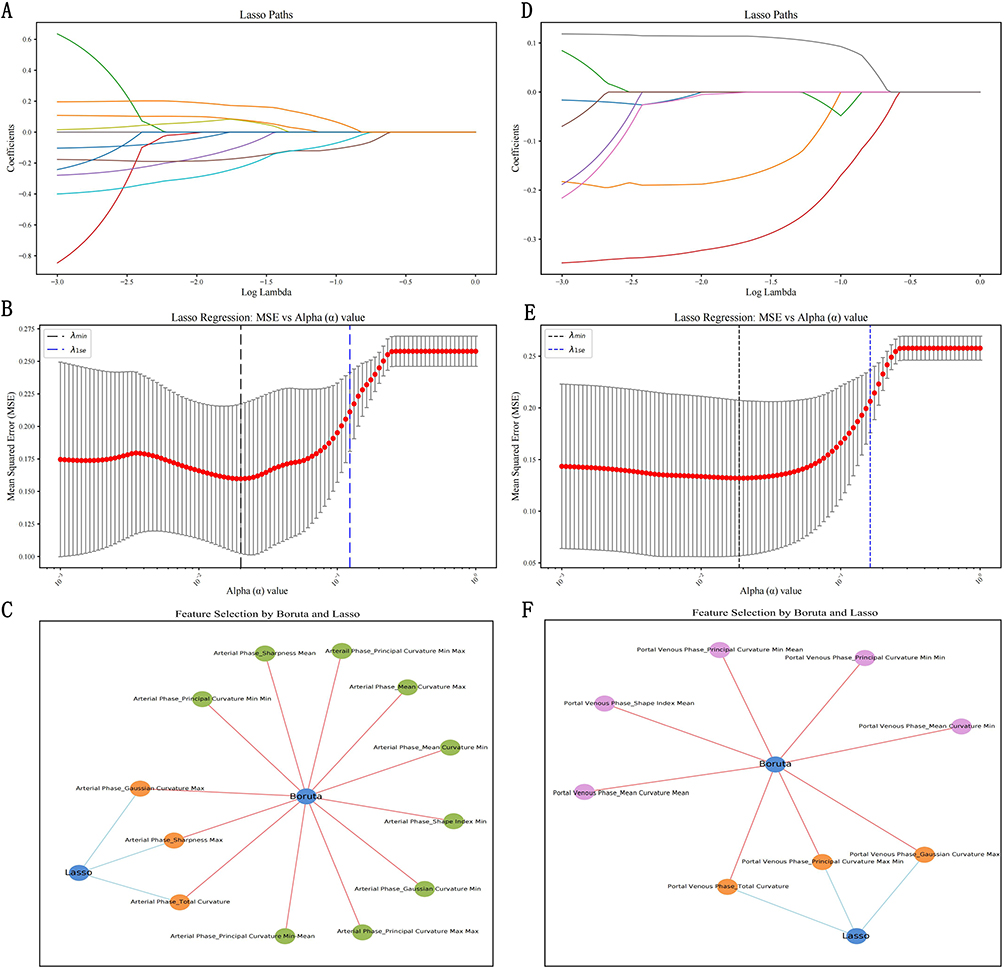 |
Figure 4 Lasso regression and Boruta algorithm for feature selection on CT topological image data from different periods. (A–C) show the arterial phase, (D–F) show the portal vein phase. Lasso path plots: (A and D) show the feature coefficient paths of Lasso regression with different regularization parameters λ for different phases of the data. As λ increases (constraints become stricter), more features are sparsified (the coefficients tend to zero). (B and E) show the Lasso regression error curves for different phases of the data, showing the mean square error (MSE) for different regularization strengths (α values). The red line shows the mean error, and the black and blue dotted lines show λmin and λ1SE, respectively, which are used to determine the optimal α value. (C and F) show that after combining Lasso and Boruta screening, three significant features (Gaussian Curvature Max, Sharpness Max, and Total Curvature) were selected in the arterial phase, and three significant features (Gaussian Curvature Max, Principal Curvature Max Min, and Total Curvature) were selected in the venous phase. |
Multi-Task Deep Learning Model Building
Model Loss
As shown in Figure 5, training and validation losses converged rapidly across all models without evidence of overfitting. Figure 5A showed loss curve in arterial phase model. Figure 5B showed loss curve in venous phase model. Figure 5C showed loss curve in joint model. On the validation set, the integrated arterial-portal model achieved significantly lower loss (about 15) versus arterial-phase (about 20) and joint models (both about 20). This demonstrates that feature fusion enhances predictive accuracy through synergistic phase integration. The integrated model has the lowest loss on the validation set and the best generalization performance.
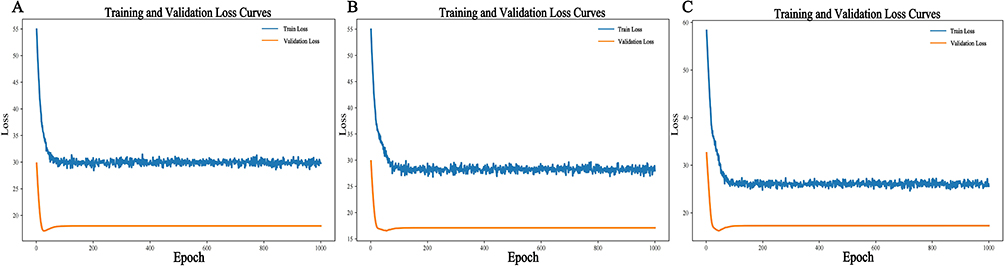 |
Figure 5 Loss curves in three models during training. (A) showed loss curve in arterial phase model. (B) showed loss curve in venous phase model. (C) showed loss curve in joint model. |
Prediction of Mucosal Healing
Comprehensive model evaluation revealed superior performance of the joint model versus single-phase models. On the training set, it achieved: sensitivity 0.85 (vs arterial 0.75, portal 0.825), specificity 0.875 (vs 0.925, 0.9), accuracy 0.8625 (vs 0.8375, 0.8625), and precision 0.8718 (vs 0.9091, 0.8919), demonstrating significant enhancement through phase integration. Furthermore, the joint model achieved the highest AUC (0.938) versus arterial-phase (0.892) and portal-phase (0.930) models as shown in Table 2, while the arterial + portal vein phase combination has the best predictive performance on the training set, as shown in Figure 6. On the validation set, the joint model achieved a sensitivity of 1. Although the specificity was still the same as the single model, the overall performance was more stable, demonstrating the significant advantages of the strategy of combining the arterial phase and venous phase in prediction. Furthermore, the AUCs of the arterial and arterial + portal phases were 0.854 and 0.875, respectively, both higher than the 0.833 of the portal phase models, as shown in Table 2. Consequently, the phase-fusion strategy demonstrated optimal overall performance, showing the smallest training-validation AUC differential. At the same time, the AUC differences of all models were within 0.1, indicating that the performance of the models on the training set and the validation set was not significantly different, and no significant overfitting was observed. These results do not allow a definitive conclusion about the absence of overfitting, and further validation in larger and more balanced cohorts is needed. (Figure 6).
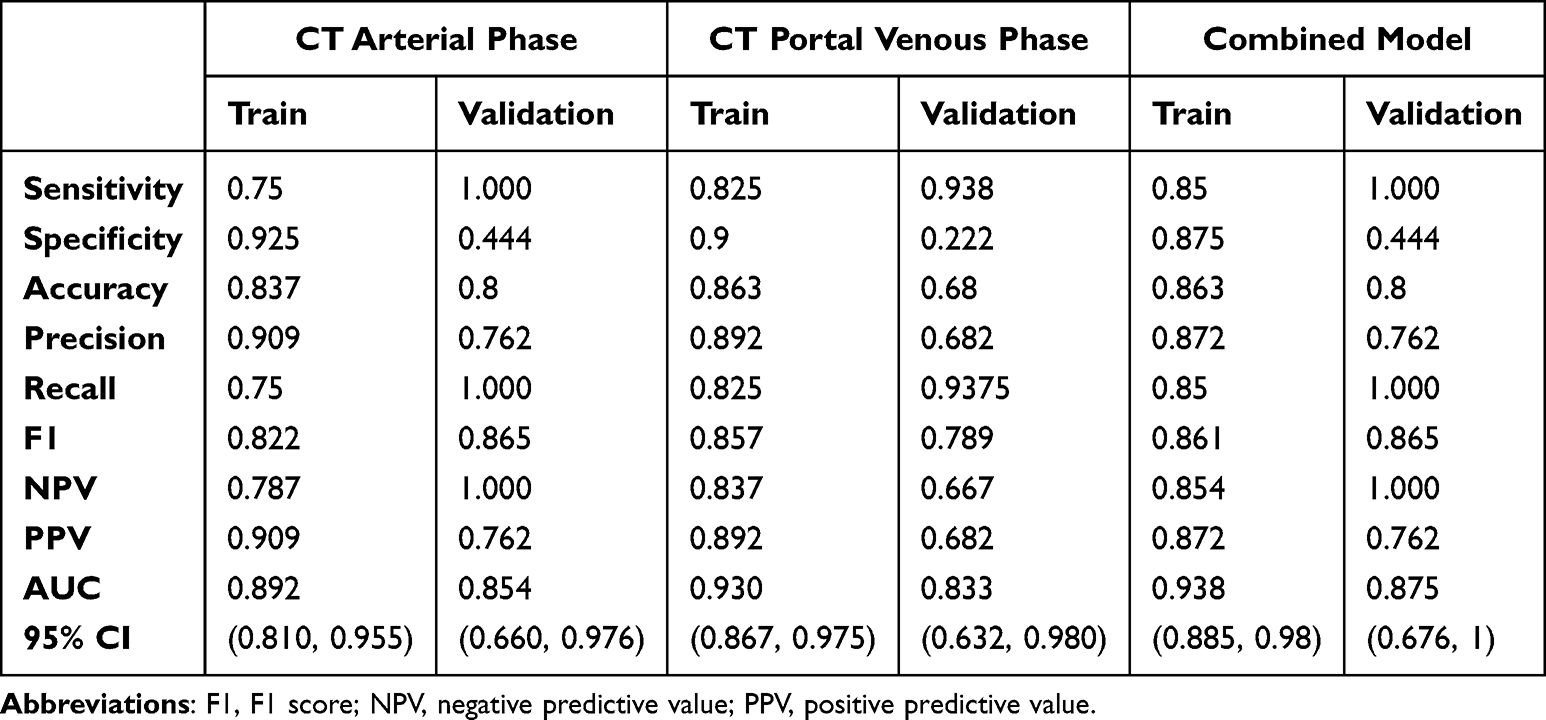 |
Table 2 Task 1: Model Performance for Predicting Mucosal Healing Tasks |
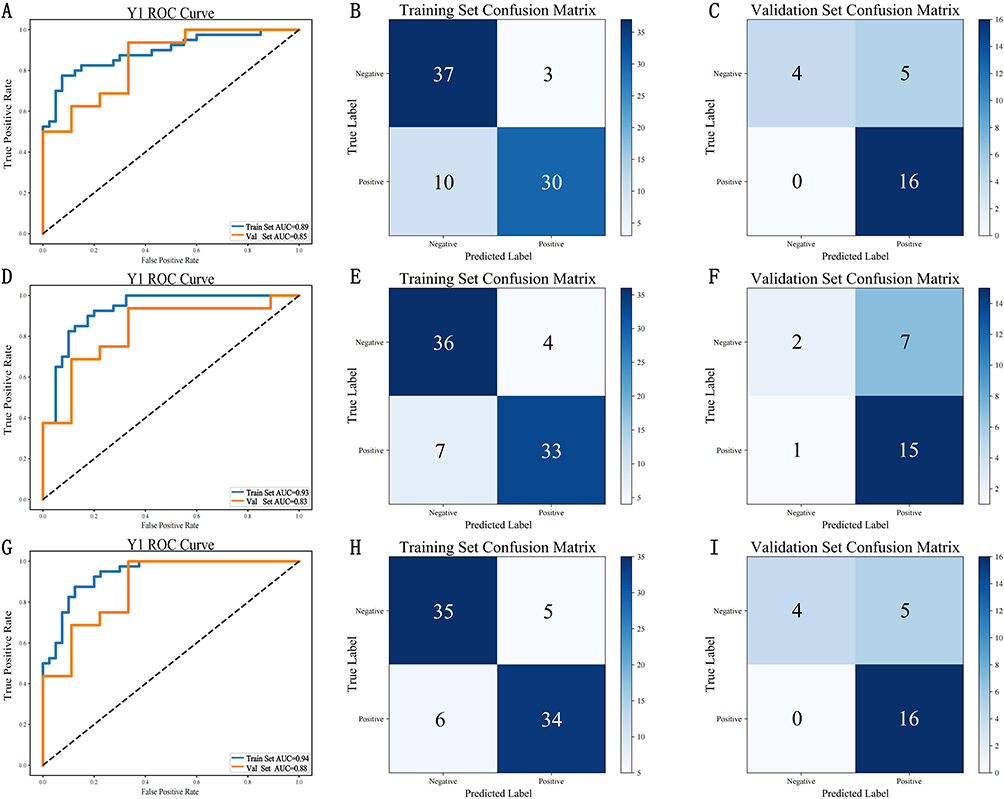 |
Figure 6 ROC curves and confusion matrix for each model of mucosal prediction. (A–C) ROC curve and confusion matrix for modelling of CT topological image data in the arterial phase; (D–F) ROC curve and confusion matrix for modelling of CT topological image data in the portal vein phase; (G–I) ROC curve and confusion matrix for modelling of CT topological image data in the arterial phase combined with the portal vein phase. The values presented in the confusion matrix indicate the number of cases assigned to each predicted class. |
Prediction of Intestinal Activity Score
The differences between training and validation MSE/MAE values were relatively small, suggesting no obvious overfitting; however, the limited sample size may reduce the reliability of these indicators. The minimal differentials between training and validation set MSE/MAE values indicate no substantial model overfitting. The joint model performed best in terms of MSE and MAE, with the MSE lower than the single model on both the training set (51.499 vs 59.204, 55.846) and the validation set (42.151 vs 47.685, 40.929). The MAE shows that the combined model has the lowest error on the training set (5.23 vs 5.634, 5.47), but is slightly higher on the validation set (5.436 vs 5.421, 5.31), reflecting a smaller prediction error. R2 shows that the combined model has the highest coefficient of determination on the training set (0.75 vs 0.68, 0.725) and the validation set (0.702 vs 0.584, 0.549), indicating better goodness of fit. Cindex shows that the combined model performs best compared to the separate arterial and venous phases on both the training set (0.746 vs 0.716, 0.639) and the validation set (0.679 vs 0.653, 0.646), as shown in Table 3. Overall, although the joint model shows consistent but modest performance gains, these findings do not constitute strong statistical evidence of superiority and warrant validation in larger datasets.
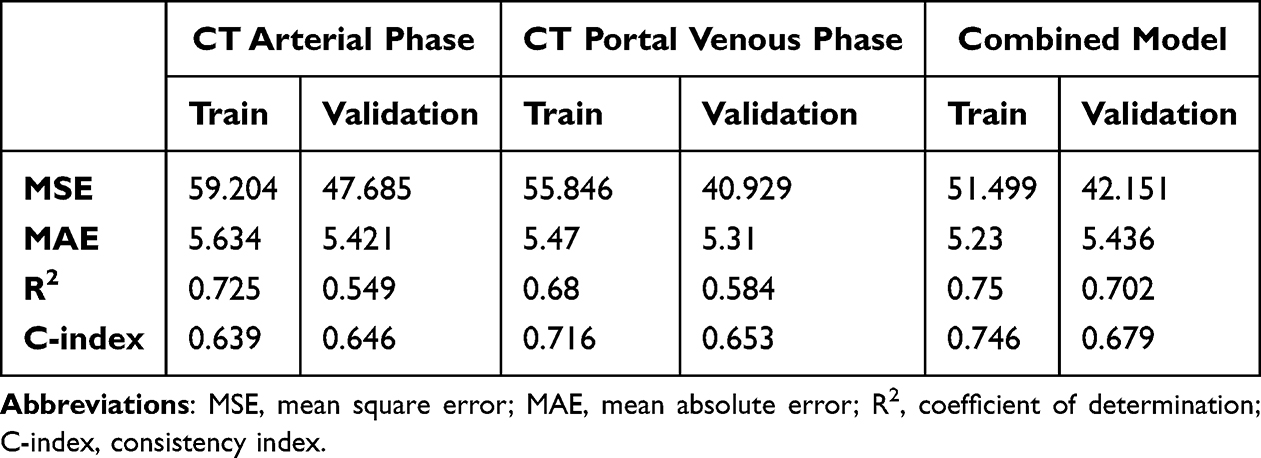 |
Table 3 Task 2: Model Performance for Predicting Gut Activity Scores |
SHAP Model Interpreter
SHAP values (SHapley Additive exPlanations) quantify the marginal contribution of each feature to the model’s predictive output, with higher values signifying a greater impact on the prediction outcome. The most important features in the mucosal healing prediction task are “Arterial Phase_Gaussian Curvature Max” and “Arterial Phase_Total Curvature”, both of which have a significant impact on the model output. The feature values (from blue to red) follow a certain pattern with the SHAP values. The most important feature for predicting the activity score becomes “Arterial Phase_Total Curvature”, followed by “Portal Venous Phase_Total Curvature”, which indicates that the activity score prediction is more dependent on these two features. Although the main features of the two tasks are consistent in Arterial Phase_Total Curvature, overall, the model’s prediction of Y1 is more dependent on the features related to “Arterial Phase”, while the prediction of Y2 places more emphasis on the features related to “Portal Venous Phase”. (Figure 7).
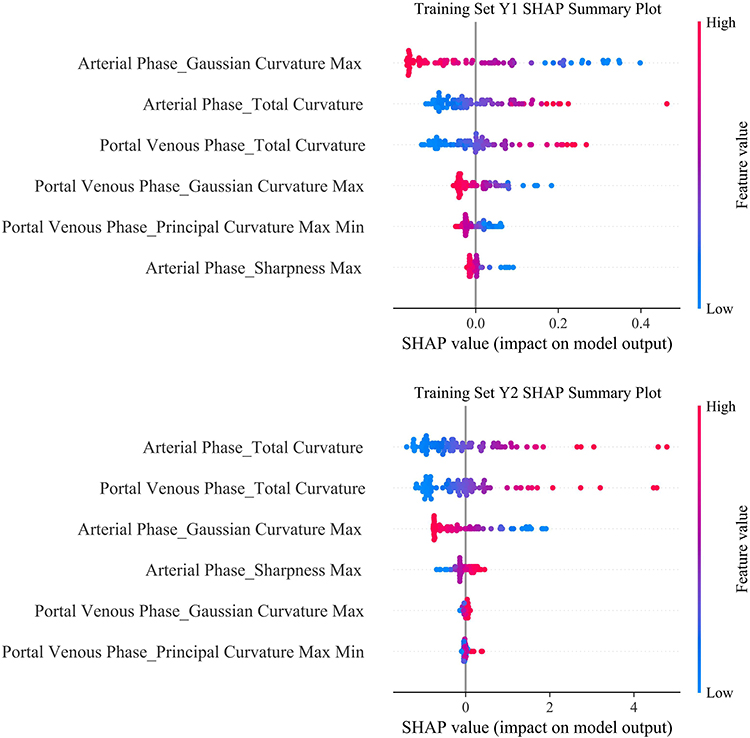 |
Figure 7 Difference in contribution of model characteristics in two different tasks. Y1 task: Mucosal prediction; Y2 task: Bowel activity score. Each row represents a feature, and each point denotes the SHAP value and original value of a sample for that feature. The color gradient from red to blue indicates the feature value from high to low. SHAP values (SHapley Additive exPlanations) quantify the marginal contribution of each feature to the model’s predictive output, with higher values signifying a greater impact on the prediction outcome. The horizontal axis represents the SHAP values, where a position further to the right indicates that the feature tends to drive the model toward a higher predicted value. |
Discussion
This study uses a method of fusing topological imaging omics through deep learning (Multi-Task Deep Learning, MTDL) to construct a model capable of simultaneous prediction of MH status and endoscopic activity scores in CD patients. Through multi-task learning strategies, the overall model performance is enhanced. Compared to models utilizing single-phase imaging features exclusively, the integrated model combining arterial-phase and portal-phase topological radiomics demonstrates superior AUC values and C-indexes across both training and validation sets. This result reflects the complementary nature of multi-sequence imaging data in capturing the morphological characteristics of complex intestinal lesions, which is of great significance for clinical precision diagnosis and treatment decisions.
Compared with previous studies,20 our research is the first to propose a multi-task deep learning model that integrates arterial phase and portal venous phase CT data combined with high-dimensional topological features, enabling simultaneous prediction of mucosal healing (binary classification) and SES-CD score (regression). Unlike previous studies that only utilized single-phase iodine density images and traditional radiomics features, and adopted single-task logistic regression for assessing mucosal healing, our model employs multi-task joint optimization, successfully overcomes class imbalance, integrates multiple feature selection methods, and introduces SHAP for feature-level interpretability.
The International Inflammatory Bowel Disease Group (STRIDE-II) guidelines prioritize MH in Crohn’s disease management, reflecting endoscopic resolution of inflammation that enables sustained disease control and improved prognosis.21 However, endoscopy is not recommended for monitoring mucosal status in moderate-to-severe active Crohn’s disease due to elevated risks of intestinal perforation, hemorrhage, and other complications.22 Non-invasive alternatives—CT, MR, and intestinal ultrasound—provide pan-enteric visualization.23,24 This study demonstrates CT enterography’s arterial-phase superiority in predicting MH, suggesting early perfusion differentials (arterially dominated) as key determinants.25,26 As inflammation progresses, portal-phase imaging provides enhanced visualization of structural and functional intestinal alterations induced by chronic or extensive lesions.24,25 Although the joint model integrating multi-task features showed only modest improvements in AUC and MAE compared with the single-task models, these incremental gains may stem from the complementary information provided by the arterial and portal venous phases. This complementary relationship between early (arterial-phase) and late (portal-phase) perfusion differentials enable more comprehensive disease characterization through joint modeling of dual-phase data, thereby facilitating more precise assessment of intestinal inflammatory states and structural remodeling. Nevertheless, given the limited evaluation cohort, these findings should be interpreted cautiously. Further validation with larger, multicenter datasets is required to more definitively determine the added value of the joint model.
Current diagnosis of Crohn’s disease activity primarily relies on endoscopic activity scores and complementary clinical parameters, including CT-based characteristics such as bowel wall thickness and segmental intestinal wall thickening.27–29 A study of anti-TNF drug therapy showed that while patients had a significant decrease in endoscopic activity scores after treatment, there was also a significant increase in the rate of mucosal healing.30 This indicates that mucosal healing is closely related to endoscopic activity scores. Compared with traditional single-task learning, multi-task deep learning captures the potential correlations between tasks by sharing underlying features, thereby achieving collaborative enhancement of information.31,32 In this study, a certain correlation was predicted between the two tasks of MH and endoscopic activity score: for the prediction of mucosal healing, arterial-phase topological features demonstrated dominant importance, potentially reflecting early-stage inflammatory activity predominantly driven by arterial blood supply at active foci; while in the prediction task of endoscopic activity score, the topological characteristics of the portal vein phase have a better ability to represent the overall activity of extensive lesions. This multi-task collaboration strategy has been reported as effective in other medical image analysis studies and, in our results, suggests potential advantages in model performance and clinical interpretability.33,34 Although the models showed similar AUC performance between the training and validation sets, the small validation cohort and the lower specificity observed in the validation set indicate that the current results should be interpreted with caution. These findings suggest that the model’s ability to generalize, particularly in identifying negative cases, may be limited under small-sample conditions. Future studies with larger and more diverse validation cohorts will be essential to more robustly assess and refine model performance.
The results of model interpretation based on SHAP (SHapley Additive exPlanations) further show that in the task of predicting mucosal healing, arterial phase features such as Gaussian Curvature Max and Total Curvature have the most significant impact on model decisions; while in predicting endoscopic activity scores, Total Curvature and Principal Curvature Max Min in the portal phase images play a more critical role. The topological imaging features employed in this study, including Gaussian curvature maximum and total curvature, provide quantitative descriptors for geometric abnormalities in the intestinal wall surface of Crohn’s disease patients. For instance, CTE can detect pathological alterations such as intestinal wall thickening, enhancement, and stratification, which reflect inflammatory activity and tissue remodeling in the affected intestinal segments.35 The impact of these pathological changes on the geometric structure of the intestinal wall can be quantitatively characterized through topological feature. Total Curvature comprehensively reflects the complexity of the overall morphology in the lesion area, while Gaussian Curvature Max distinctly highlights the extreme geometric distortions of local pathological foci. Together, they elucidate the geometric characteristics of morphological changes in the mucosa and submucosa during the pathological reconstruction process. Geometric quantifiers such as Gaussian curvature and total curvature sensitively capture alterations in complex morphological characteristics, including intestinal surface undulations, inflammatory exudates, and wall thickening. This confirms the value of topological data analysis in revealing intestinal wall structural and functional alterations in Crohn’s disease.17,18
There are still some limitations in this study. First, the relatively limited sample size may compromise the model’s generalizability and stability. Second, although the inclusion and exclusion criteria were designed to ensure clinical homogeneity and stable correlations between radiological and endoscopic activity, they may introduce potential selection bias. Specifically, restricting the time window of ulcerative lesions and requiring at least six months of biologic therapy may limit the external validity of the model, as these criteria exclude patients with early-stage disease, those receiving alternative therapies, or those with more heterogeneous clinical courses. Future studies should include a broader spectrum of patients from multiple centers to enhance representativeness and applicability. Third, to address the class imbalance between the mucosal healing and non-healing groups, the SMOTE oversampling technique was applied during model training. However, SMOTE-generated synthetic samples may not fully represent real biological variability, and this could potentially affect the model’s representation of true data distributions. In future work, we plan to expand the dataset through multi-center collaboration and explore more advanced class imbalance–handling methods, such as ensemble learning or cost-sensitive algorithms, to further improve model robustness. In addition, this study mainly relies on CT image data and does not combine other imaging modalities (such as magnetic resonance imaging) or clinical biomarkers. Future studies could integrate multimodal data fusion to enhance performance. Finally, although the interpretability of the model was partially revealed through SHAP analysis, its interpretability and visualization in practical clinical applications still need to be further optimized to enhance the trust and acceptance of medical staff.
This study constructed an effective and precise Crohn’s disease assessment model by integrating multi-task deep learning with topological radiomics analysis, enabling simultaneous prediction of mucosal healing status and endoscopic activity scores. The results indicated that combining arterial and portal venous phase topological features could improve model performance, and the multi-task learning strategy showed potential benefits for reducing overfitting. This work provides a methodological framework and exploratory tool for non-invasive CD assessment, suggesting possible clinical utility. However, further multi-center validation and optimization are required to facilitate broader clinical application.
Conclusion
By integrating arterial and venous phases topological radiomic features within a multi-task learning framework, this study improved model discrimination in evaluating CD. The findings highlight the potential of topology-based radiomics as a non-invasive imaging approach. However, its clinical applicability requires confirmation through larger, multicenter prospective studies.
Data Sharing Statement
The data that support the findings of this study are available from the corresponding author upon reasonable request.
Ethics Approval and Consent to Participate
The study was conducted in accordance with the Declaration of Helsinki (as revised in 2013). This study is a retrospective study approved by the ethics committee of Chongqing General Hospital (Ethical code: KY S2024-076-01). Given the retrospective design of this study, which involved analysis of pre-existing and fully anonymized imaging and clinical data without any direct patient contact or intervention, the requirement for informed consent was formally waived by the ethics committee
Acknowledgments
We would like to thank all the subjects involved in this study for their valuable contributions.
Author Contributions
All authors made a significant contribution to the work reported, whether that is in the conception, study design, execution, acquisition of data, analysis and interpretation, or in all these areas; took part in drafting, revising or critically reviewing the article; gave final approval of the version to be published; have agreed on the journal to which the article has been submitted; and agree to be accountable for all aspects of the work.
Funding
This work was supported by Science and Technology Innovation Key R&D Program of Chongqing (No.CSTB2024TIAD-STX0045).
Disclosure
The authors have no conflicts of interest to declare.
References
1. Torres J, Mehandru S, Colombel J-F, Peyrin-Biroulet L. Crohn’s disease. Lancet Lond Engl. 2017;389(10080):1741–1755. doi:10.1016/S0140-6736(16)31711-1
2. Ng SC, Tang W, Ching JY, et al. Incidence and phenotype of inflammatory bowel disease based on results from the Asia-pacific crohn’s and colitis epidemiology study. Gastroenterology. 2013;145(1):158–165.e2. doi:10.1053/j.gastro.2013.04.007
3. Cazzato G, Colagrande A, Andriola V, et al. Histological hallmarks of mucosal healing in inflammatory bowel diseases in the era of monoclonal antibodies therapy: new insights and perspectives. Diagn. 2021;11(9):1570. doi:10.3390/diagnostics11091570
4. Gajendran M, Loganathan P, Catinella AP, Hashash JG. A comprehensive review and update on crohn’s disease. Dis-a-Mon. 2018;64:20–57. doi:10.1016/j.disamonth.2017.07.001
5. Dolinger M, Torres J, Vermeire S. Crohn’s disease. Lancet Lond Engl. 2024;403(10432):1177–1191. doi:10.1016/S0140-6736(23)02586-2
6. Strohl M, Gonczi L, Kurt Z, Bessissow T, Lakatos PL. Quality of care in inflammatory bowel diseases: what is the best way to better outcomes? World J Gastroenterol. 2018;24(22):2363–2372. doi:10.3748/wjg.v24.i22.2363
7. Salch A, Regalski A, Abdallah H, Suryadevara R, Catanzaro MJ, Diwadkar VA. From mathematics to medicine: a practical primer on topological data analysis (TDA) and the development of related analytic tools for the functional discovery of latent structure in fMRI data. PLoS One. 2021;16(8):e0255859. doi:10.1371/journal.pone.0255859
8. Guo B, Liu H, Niu L. Integration of natural and deep artificial cognitive models in medical images: BERT-based NER and relation extraction for electronic medical records. Front Neurosci. 2023;17:1266771. doi:10.3389/fnins.2023.1266771
9. Zhao Y, Wang X, Che T, Bao G, Li S. Multi-task deep learning for medical image computing and analysis: a review. Comput Biol Med. 2023;153:106496. doi:10.1016/j.compbiomed.2022.106496
10. Li J, Zhang L, Tang W, et al. Radiomics nomogram based on dual-energy CT-derived iodine maps: evaluation of mucosal healing in patients with crohn’s disease. Abdom Radiol. 2025;50(4):1524–1532. doi:10.1007/s00261-024-04598-w
11. Yang X, Yu L, Yu W, et al. Intestinal wall thickness detected by multidetector spiral computed tomography enterography predicts the disease severity of crohn’s disease. Scand J Gastroenterol. 2014;49(7):807–813. doi:10.3109/00365521.2014.907336
12. Gücer FI, Senturk S, Özkanli S, Yilmabasar MG, Köroglu GA, Acar M. Evaluation of crohn’s disease activity by MR enterography: derivation and histopathological comparison of an MR-based activity index. Eur J Radiol. 2015;84(10):1829–1834. doi:10.1016/j.ejrad.2015.06.005
13. Garside K, Henderson R, Makarenko I, Masoller C. Topological data analysis of high resolution diabetic retinopathy images. PLoS One. 2019;14:e0217413. doi:10.1371/journal.pone.0217413
14. Centanni L, Bencardino S, D’Amico F, et al. Targeting mucosal healing in crohn’s disease: efficacy of novel pathways and therapeutic targets. Expert Opin Ther Targets. 2024;28(11):963–978. doi:10.1080/14728222.2024.2433124
15. Gergely M, Deepak P. Tools for the diagnosis and management of Crohn’s disease. Gastroenterol Clin North Am. 2022;51(2):213–239. doi:10.1016/j.gtc.2021.12.003
16. Lafeuille P, Hordonneau C, Vignette J, et al. Transmural healing and MRI healing are associated with lower risk of bowel damage progression than endoscopic mucosal healing in Crohn’s disease. Aliment Pharmacol Ther. 2021;53(5):577–586. doi:10.1111/apt.16232
17. Weinstein-Nakar I, Focht G, Church P, et al. Associations among mucosal and transmural healing and fecal level of calprotectin in children with Crohn’s disease. Clin Gastroenterol Hepatol. 2018;16(7):1089–1097.e4. doi:10.1016/j.cgh.2018.01.024
18. Eder P, Łykowska-Szuber L, Katulska K, et al. Intestinal healing after anti-TNF induction therapy predicts long-term response to one-year treatment in patients with ileocolonic Crohn’s disease naive to anti-TNF agents. Prz Gastroenterol. 2016;11(3):187–193. doi:10.5114/pg.2015.55185
19. Geyl S, Guillo L, Laurent V, D’Amico F, Danese S, Peyrin-Biroulet L. Transmural healing as a therapeutic goal in Crohn’s disease: a systematic review. Lancet Gastroenterol Hepatol. 2021;6(8):659–667. doi:10.1016/S2468-1253(21)00096-0
20. Deepak P, Fowler KJ, Fletcher JG, Bruining DH. Novel imaging approaches in inflammatory bowel diseases. Inflamm Bowel Dis. 2019;25(2):248–260. doi:10.1093/ibd/izy239
21. Shenoy-Bhangle AS, Gee MS. CT versus MR enterography: counterpoint-MR enterography is the primary imaging modality for assessing activity and therapeutic response in pediatric and adult Crohn disease. AJR Am J Roentgenol. 2023;220(6):789–790. doi:10.2214/AJR.22.28778
22. Gordon IO, Bettenworth D, Bokemeyer A, et al. Histopathology scoring systems of stenosis associated with small bowel crohn’s disease: a systematic review. Gastroenterology. 2020;158(1):137–150.e1. doi:10.1053/j.gastro.2019.08.033
23. Li R, Ye S, Zhou C, Liu F, Li X. A systematic review and meta-analysis of magnetic resonance and computed tomography enterography in the diagnosis of small intestinal tumors. Peer J. 2023;11:e16687. doi:10.7717/peerj.16687
24. Panes J, Bouhnik Y, Reinisch W, et al. Imaging techniques for assessment of inflammatory bowel disease: joint ECCO and ESGAR evidence-based consensus guidelines. J Crohns Colitis. 2013;7(7):556–585. doi:10.1016/j.crohns.2013.02.020
25. Hayano K, Desai GS, Kambadakone AR, Fuentes JM, Tanabe KK, Sahani DV. Quantitative characterization of hepatocellular carcinoma and metastatic liver tumor by CT perfusion. Cancer Imag. 2013;13(4):512–519. doi:10.1102/1470-7330.2013.0040
26. Tong J, Feng Q, Zhang C, Xu X, Ran Z. CT enterography for evaluation of disease activity in patients with ileocolonic Crohn’s disease. BMC Gastroenterol. 2022;22(1):324. doi:10.1186/s12876-022-02389-5
27. Vuyyuru SK, Nguyen TM, Murad MH, et al. Comparative efficacy of advanced therapies for achieving endoscopic outcomes in Crohn’s disease: a systematic review and network meta-analysis. Clin Gastroenterol Hepatol. 2024;22(6):1190–1199.e15. doi:10.1016/j.cgh.2023.12.023
28. Amyar A, Modzelewski R, Li H, Ruan S. Multi-task deep learning based CT imaging analysis for COVID-19 pneumonia: classification and segmentation. Comput Biol Med. 2020;126:104037. doi:10.1016/j.compbiomed.2020.104037
29. Minaee S, Boykov Y, Porikli F, Plaza A, Kehtarnavaz N, Terzopoulos D. Image segmentation using deep learning: a survey. IEEE Trans Pattern Anal Mach Intell. 2022;44(7):3523–3542. doi:10.1109/TPAMI.2021.3059968
30. Anthimopoulos M, Christodoulidis S, Ebner L, Christe A, Mougiakakou S. Lung pattern classification for interstitial lung diseases using a deep convolutional neural network. IEEE Trans Med Imaging. 2016;35(5):1207–1216. doi:10.1109/TMI.2016.2535865
31. Miao D, Zhao Y, Ren X, et al. A multi-task based deep learning framework with landmark detection for MRI couinaud segmentation. IEEE J Transl Eng Health Med. 2024;12:697–710. doi:10.1109/JTEHM.2024.3491612
32. Sakurai T, Katsuno T, Saito K, et al. Mesenteric findings of CT enterography are well correlated with the endoscopic severity of crohn’s disease. Eur J Radiol. 2017;89:242–248. doi:10.1016/j.ejrad.2016.10.022
33. Singh Y, Farrelly CM, Hathaway QA, et al. Topological data analysis in medical imaging: current state of the art. Insights Imag. 2023;14(1):58. doi:10.1186/s13244-023-01413-w
34. Manuchehrfar F, Li H, Tian W, Ma A, Liang J. Exact topology of the dynamic probability surface of an activated process by persistent homology. J Phys Chem B. 2021;125(18):4667–4680. doi:10.1021/acs.jpcb.1c00904
35. Daperno M, D’Haens G, Van Assche G, et al. Development and validation of a new, simplified endoscopic activity score for Crohn’s disease: the SES-CD. Gastrointest Endosc. 2004;60(4):505–512. doi:10.1016/s0016-5107(04)01878-4
 © 2025 The Author(s). This work is published and licensed by Dove Medical Press Limited. The
full terms of this license are available at https://www.dovepress.com/terms
and incorporate the Creative Commons Attribution
- Non Commercial (unported, 4.0) License.
By accessing the work you hereby accept the Terms. Non-commercial uses of the work are permitted
without any further permission from Dove Medical Press Limited, provided the work is properly
attributed. For permission for commercial use of this work, please see paragraphs 4.2 and 5 of our Terms.
© 2025 The Author(s). This work is published and licensed by Dove Medical Press Limited. The
full terms of this license are available at https://www.dovepress.com/terms
and incorporate the Creative Commons Attribution
- Non Commercial (unported, 4.0) License.
By accessing the work you hereby accept the Terms. Non-commercial uses of the work are permitted
without any further permission from Dove Medical Press Limited, provided the work is properly
attributed. For permission for commercial use of this work, please see paragraphs 4.2 and 5 of our Terms.
Recommended articles
Predicting Mucosal Healing in Crohn’s Disease: A Nomogram Model Developed from a Retrospective Cohort
Tang N, Chen H, Chen R, Tang W, Zhang H
Journal of Inflammation Research 2022, 15:5515-5525
Published Date: 23 September 2022