
Back to Journals » Diabetes, Metabolic Syndrome and Obesity » Volume 19
Topological Property Impairments of Brain Functional Network in Newly-Onset Overweight/Obese Patients with Type 2 Diabetes Mellitus
Authors Yu T  , Zhou F , Chen J, Gao L
Received 24 January 2026
Accepted for publication 29 April 2026
Published 10 June 2026 Volume 2026:19 592789
DOI https://doi.org/10.2147/DMSO.S592789
Checked for plagiarism Yes
Review by Single anonymous peer review
Peer reviewer comments 2
Editor who approved publication: Prof. Dr. Ernesto Maddaloni
Tingting Yu,1 Fen Zhou,2 Jun Chen,1 Ling Gao2
1Department of Radiology, Renmin Hospital of Wuhan University, Wuhan, People’s Republic of China; 2Department of Endocrinology, Renmin Hospital of Wuhan University, Wuhan, People’s Republic of China
Correspondence: Jun Chen, Email [email protected] Ling Gao, Email [email protected]
Purpose: Obesity can exacerbate metabolic dysfunction in patients with type 2 diabetes mellitus (T2DM), and the degree of various injuries to our body cannot be fully controlled. However, research on early brain function changes in overweight/obese patients with T2DM is not yet perfect. Herein, we studied the topological structure of brain networks and cognitive function alterations in newly-onset overweight/obese T2DM patients.
Methods: To investigate the changes in topological structure, we collected clinical data, cognitive scales, and resting-state functional magnetic resonance imaging (fMRI) data from 32 patients with newly-onset overweight/obese T2DM and 27 normal controls (NCs). The topological structure of the constructed network, derived from preprocessed fMRI data, was extracted and analyzed using graph theory methods by GRETNA. The relationships between changes in topological structure and clinical data as well as neurocognitive test scores in patients with newly-onset overweight/obese T2DM were analyzed.
Results: Within the set threshold range, both newly-onset T2DM and NC groups had global small-world (δ) values > 1.1, but the T2DM group showed lower δ values at each threshold. Compared to NC, T2DM had decreased δ (P = 0.0423, T = − 2.079), global efficiency (Eglob) (P = 0.0312, T = − 2.212), and increased characteristic path length (Lp) (P = 0.0253, T = 2.301). After multiple comparison corrections, local topological metrics showed no significant inter-group differences. For the sake of prudence, we employed a significance reference threshold of p < 0.005 for uncorrected analyses. Through exploratory investigation, we identified that, without multiple comparison corrections, there were inter-group nodal differences in specific brain regions for the metrics including nodal degree centrality (Dc), nodal clustering coefficient (NCp), and nodal local efficiency (NLe). Network-based statistic found no aberrant connections (P > 0.05). In the T2DN group, a positive correlation was observed between the Dc of left inferior parietal angular gyrus and BMI (P < 0.05).
Conclusion: The functional networks of patients with newly-onset T2DM have changes in network efficiency and brain region function. Brain function damage may exist in the early stage of overweight/obese T2DM. This study provides a new thought for the neurobiological mechanism of early brain function damage in overweight/obese T2DM. It is worth noting that the findings of this study suggest that the combined metabolic burden resulting from the coexistence of T2DM and overweight/obesity may jointly participate in mediating alterations in brain networks. However, constrained by the study design, this study failed to independently distinguish the specific effects of obesity. In the future, it is still necessary to conduct refined analyses stratified by BMI to further disentangle the independent and interactive effects of obesity and hyperglycemia on brain structure and function.
Keywords: newly-onset diabetes, obesity, brain function, graph theory
Introduction
Due to rapid economic development, lifestyle changes and other factors, the prevalence rate of diabetes mellitus shows an increasing trend, as is the proportion of obese and overweight people.1 The statistical data generated by the International Diabetes Federation in 2021 showed that the global prevalence rate of diabetes mellitus between people aged 20 to 79 was estimated to be 10.5% (536.6 million people), it was predicted that this figure will rise to 12.2% (783.2 million people) by 2045.2 For the local region, in 2023, the age-standardized prevalence of diabetes in China was 13.67%, and from 2005 to 2023, the number of diabetes cases increased significantly, with a 163% growth.3 A study conducted within the context of Shanghai communities reveals that, according to the findings of this research, the prevalence rates of diabetes and prediabetes were 15.1% and 52.3%, respectively.4 A cross-sectional study involving tens of millions of adults showed that the prevalence rate of overweight was 34.8%, and that of obesity was 14.1%.5
Type 2 diabetes mellitus (T2DM) is the most prevalent metabolic disorder all over the world, with insulin resistance and hyperglycemia as the main traits. Meanwhile, T2DM has a significant impact on brain cognitive impairments such as vascular dementia, which can cause a variety of cognitive injuries of brain, even increase the realistic possibility of developing dementia.6 In terms of structural morphology, atrophy of gray matter volume and leukoaraiosis were the main imaging manifestations in T2DM patients with moderate cognitive impairment or early dementia.7,8 Moreover, existing study had demonstrated that T2DM patients had abnormal brain functional networks, and it had been speculated that the brain might have compensatory behaviors to reduce cognitive impairment.9 Studies have shown that patients with T2DM exhibited abnormal functional connectivity in the default mode network, and abnormal changes in gray matter volume of brain regions related to vision.10 Another study, employing multiple brain imaging techniques, revealed that patients with T2DM exhibited significant alterations in gray matter structure, white matter integrity, and brain function, with the affected brain regions predominantly concentrated in the prefrontal cortex, which indeed occupied a central position in the cognitive and control functions. Specifically, these alterations included reduced cortical thickness in regions such as the bilateral superior frontal gyrus, enhanced functional connectivity within the prefrontal cortex, and decreased fractional anisotropy values in the midline region of the bilateral orbitofrontal cortex.11
Meanwhile, obesity was related to metabolic dysfunction, and obesity itself can also cause a certain degree of insulin resistance, which was a risk factor for T2DM and will further exacerbate T2DM-related metabolic abnormalities.12 Studies had found that obesity-related metabolic dysfunction can lead to brain changes,13 which may cause the cognitive impairment and increase the risk of developing dementia even further.14 A SPECT study of adults with different BMIs showed that in both resting and concentration states, high-BMI individuals had reduced cerebral perfusion in almost all brain regions, including the hippocampus vulnerable to Alzheimer’s disease.15 A meta-regression analysis including 20 studies on neurocognitive function revealed that BMI was negatively correlated with seven neurocognitive indicators.16 Preclinical animal studies have established that obesity can precipitate mild cognitive impairment, as reflected by increased anxiety-like behaviors and accelerated aging of the central nervous system in mice. Emerging evidence suggests that microglial activation may represent a critical mechanistic target underlying obesity-associated cognitive alterations.17,18
Impairments of functional connectivity in brain were closely associated with T2DM-related cognitive decline. Such impairments of brain functional connectivity may occur prior to the clinical onset of cognitive decline. Therefore, comprehending the potential effect of initial-stage overweight/obese T2DM on brain cognitive function is very important for the prevention of cognitive dysfunction in diabetes.
Research suggested that several metabolic dysfunctions, including insulin resistance, poor glycemic control, and inflammation, may be involved.19,20 However, the specific neurobiological mechanisms underlying brain changes associated with T2DM are not yet fully understood, which warrants further in-depth investigation. In order to prevent and manage brain function disorders related to T2DM, it is necessary to enhance awareness of the risks associated with overweight and obesity.
Over the years, graph theory-based network analysis methods have become used broadly and proposed as effective ways of characterizing differences in the structure and function of the brain.21–23 These methods have demonstrated outstanding capabilities in characterizing various aspects of the complex brain.24 Graph theory analysis can construct various topological features of structural and functional brain networks to reflect changes in separation and integration within the brain system. Common features include global small-world properties,25 community index,26 and nodal betweenness centrality,26 etc. The framework of topological features can be used to conduct large-scale network analysis, which is particularly useful for detecting brain internal connectivity and identifying interactions between its various subsystems.22
The primary objective of our study is to explore whether there exist abnormal functional connections and cognition impairments in patients with newly-onset overweight/obese T2DM. This will improve our understanding of the neuropathological mechanisms underlying the influence of obesity on the brain in the initial stages of diabetes.
In the field of T2DM research, understanding the brain changes associated with newly-onset T2DM, especially in the context of overweight/obesity, is of paramount importance. Our stated objective is to explore the brain alterations centered around the exacerbation of newly-onset T2DM by overweight/obesity. However, in our current study design, the comparison group consists of normal-weight, non-diabetic controls (BMI < 24 kg/m2). This two-group design poses a potential issue. Any inter-group effects observed could be attributed to a comprehensive metabolic phenotype (T2DM + overweight/obesity ± hospitalization-related factors). We do acknowledge this limitation in the conclusion/limitation section, but it is crucial to pre-load this information in the introduction. To address this issue, in our subsequent future research, we plan to conduct stratified analysis based on BMI within the newly-onset T2DM group. While our study compares newly-onset overweight/obese T2DM patients to normal-weight controls, this design limits our ability to isolate the effects of obesity within T2DM from the combined metabolic phenotype. Further stratification within the T2DM group is needed to clarify these relationships. We will include individuals with newly-onset T2DM who have normal body weight, as well as individuals with normal glucose tolerance who are obese or overweight in the next step of the research, so as to make the entire study more comprehensive.
Methods
This study adopts a cohort research design, with its specific procedures encompassing participant selection, data collection protocols, and detailed analysis methods. The specific implementation steps are as follows: Firstly, we complete the initial contact with participants by recruiting target individuals and fully explaining the research objectives, procedures, and potential risks to them. Subsequently, eligible participants are screened according to predefined criteria, and those with severe neuropsychiatric disorders or poor compliance are excluded. For participants who meet the inclusion criteria, a comprehensive and detailed informed-consent process is carried out. This process includes informing them of the specific research content, data usage methods, privacy protection measures, and their right to withdraw from the study. After obtaining their written informed consent, these participants are officially enrolled in the research cohort. Next, we collect raw DICOM-formatted imaging data and conduct a secondary screening and exclusion based on criteria such as the presence of scan artifacts, incomplete task performance, or voluntary withdrawal by participants. The retained data then undergo pre - processing, which involves checking the quality of registration and normalization and excluding participants with excessive head motion, representing a third round of screening and exclusion. Finally, for the data of participants included in the study, data analysis is completed by constructing graph theory properties and conducting statistical modeling. The specific details will be elaborated one by one in the following sections.
Participants
According to Chinese standards, BMI cutoff values defined normal weight (18.5–24 kg/m2), overweight (24–28 kg/m2), or obesity (≥28 kg/m2).27 According to WHO standards, BMI thresholds define normal weight (18.5–25 kg/m2), overweight (25–30 kg/m2), or obesity (≥30 kg/m2).28 Ultimately, 35hospitalized patients of newly-onset overweight/obese T2DM were enrolled using local standards. In the present study, newly-onset type 2 diabetes mellitus was explicitly defined as a condition in which individuals were diagnosed with T2DM for the first time, at an early stage of the natural disease course, and without any diabetes-related chronic complications. Inclusion criteria: age between 30 and 60 years, BMI ≥ 24 kg/m2, first-diagnosed with T2DM (confirmed by oral glucose tolerance test and meeting the diagnostic criteria published by the American Diabetes Association in 2014).29 Exclusion criteria: (1) Cardiac, pulmonary, hepatic, or renal insufficiency; (2) Systemic diseases such as hyperthyroidism, Thyroid function decreased; (3) Infections, ketoacidosis, hyperosmolar syndrome, severe hypoglycemic coma, or other urgent complications; (4) Neuropsychiatric disorders affecting cognitive function; (5) Cerebral hemorrhage, cerebral infarction, or other conditions causing central nervous system damage or a history thereof; (6) Recent (within two weeks) use of medications that may lead to cognitive dissonance; (7) Substance abuse or addiction such as alcohol, drugs; (8) Inability to finish the MRI examination due to claustrophobia or other factors; (9) MRI contraindications. At the same time, 29normal (non-type 2 diabetes mellitus) non-obesity controls matched in age, gender, education level, etc. were collected. The inclusion criteria were: not meeting the diabetes mellitus diagnostic criteria as mentioned above; age, gender, etc. matched with T2DM patients; BMI < 24 kg/m2; and normal Montreal Cognitive Assessment (MoCA) score. The exclusion criteria of NCs were the same as T2DM group.
Cognitive Scale Test
All participants completed the MoCA for neurocognitive function evaluation. The MoCA is selected for neurocognitive assessment primarily due to its high sensitivity to mild cognitive impairment, especially facilitating the early identification of subtle cognitive deficits in individuals with metabolic abnormalities such as obesity and T2DM. Compared with other brief cognitive screening tools, MoCA encompasses multiple cognitive dimensions including executive function, attention, and memory, making it well - suited for evaluating early cognitive changes associated with chronic metabolic disorders.
MRI Data Acquisition
All participants with type 2 diabetes mellitus completed magnetic resonance scanning within one week during their hospitalization. Participants underwent magnetic resonance data acquisition using the GE SIGNATM Architect 3.0T magnetic resonance imaging (MRI) system in resting state. Prior to scanning, we used foam sponges and noise-reducing earplugs to help protect their hearing. Participants were supposed to lie quietly inside the scanner with their eyes closed, remaining awake and calm, avoiding head movement and any intentional mental activity. All subjects first underwent routine magnetic resonance investigation to exclude organic damage before data collection. The scanning sequences and parameters used were as follows: (1) High-resolution structural images were collected by the three-dimensional brain volume imaging (3D BRAVO) sequence to obtain whole-brain T1-weighted images. The scanning parameters were as mentioned hereunder: TR 8.5 ms, TE 3.2 ms, slice thickness 1 mm, slice spacing 0 mm, field of view (FOV) 256 mm × 256 mm, matrix 256 × 256, flip angle 12. (2) Resting-state functional MRI was acquired by the gradient echo planar imaging sequence. The imaging parameters were as described below: TR 2000 ms, TE 30 ms, slice thickness 4.0 mm, slice spacing 0 mm, number of slices 36, FOV 240 mm × 240 mm, matrix 64 × 64, flip angle 90, and acquisition of 240 time points.
Data Preprocessing
Data preprocessing was conducted by the DIPABI software (https://www.rfmri.org/dpabi)30 in MATLAB 2013b (MathWorks, Natick, MA, USA) software. The procedure was as follows: (1) Convert DICOM format data to NIFTI; (2) Remove the images of the first 10 time points; (3) Perform head motion correction, the subject data with head motion translation >2 mm or rotation angle > 2° were eliminated;31,32 (4) Using the MNI-152 brain anatomy and topography standard template from the Montreal Neurological Institute of Canada, the DARTEL method was used to match the structural and functional images with the reconstructed data (voxel size 3 mm × 3 mm × 3 mm);33,34 (5) Apply Gaussian smoothing to the normalized images with a 4 mm full width at half maximum smoothing kernel; (6) Perform linear drift correction and low-frequency filtering (0.01–0.08 Hz); (7) Remove the effects of covariates such as head motion signals (Friston 24-parameter parameters, mean framewise displacement [FD]), global mean signals, white matter and cerebrospinal fluid signals.
Network Construction
Regarding the preprocessed images, the network construction was carried out using the GRETNA toolbox (https://www.nitrc.org/projects/gretna/)35 to further proceed with network analysis. At present, most brain network research uses image voxels or automated anatomical labeling templates to divide brain nodes, and defined the structural or functional connection relationship between nodes as edges. In our study, the cerebrums were divided into 90 regions of interest (ROIs) according to the anatomical automatic labeling (AAL) template,36 Then, the time-series signals of all ROIs were extracted to calculate the Pearson correlation coefficient as a measure of functional connectivity, ultimately resulting in a 90×90 whole-brain correlation matrix for each subject. The correlation coefficients were then transformed using Fisher’s r-to-z transformation to improve their normality, followed by thresholding to generate the network matrix, thereby reducing the influence of individual differences in group-level statistical comparisons.37 Negative functional connections were discarded, and only positive correlations were retained for subsequent network construction. To minimize the impact of weak spurious connections and focus on the topological architecture of the strongest functional connections, a binary network was constructed using a fixed sparsity threshold to eliminate spurious weak connections.
Threshold Selection
In this study, a threshold was set to construct this undirected network, and the threshold was set by sparsity to ensure that each subject’s cerebrum network contains identical numbers of edge. Sparsity S was defined as the ratio of the actual number of edges to the maximum potentially. The minimum threshold of sparsity should be greater than the average node degree 2log(N) of each network, where N was the number of nodes (N = 90), and the maximum value should satisfy the small-world characteristic with δ exceeding 1.1. The maximum threshold guaranteed full connection of the network, while the minimum threshold ensured the accuracy of small-world property estimation. According to these rules, the threshold range was set from 10% to 34% with an interval of 1%.37–39 The range of sparsity thresholds was rigorously selected to ensure that all constructed networks maintained small-world properties (δ > 1.1) across all thresholds. Meanwhile, adopting a uniform sparsity interval guaranteed consistent network density among all subjects and groups, enabling fair and standardized comparison of topological properties and enhancing the reliability of inter-group difference analysis. Subsequent network analyses were all carried out based on the above-mentioned binary matrix under the threshold conditions.
Network Property Measurement
The measurement of brain network topological properties aimed to quantify the effects of complex organizations including brain structure and function. These metrics were extracted by the GRETNA software, which divided the brain into nodes and edges and analyzed its topological characteristics. Global property metrics described the macroscopic features of the whole brain network, including small-world parameters (clustering coefficient (Cp), characteristic path length (Lp), normalized clustering coefficient (γ), normalized characteristic path length (λ), and “small-world” property (δ))38 and network efficiency (local efficiency (Eloc) and global efficiency (Eglob)).40,41 In our study, normalization was performed by comparing small-world network metrics to those from 100 matched random networks. Specifically, the clustering coefficient (Cp) and characteristic path length (Lp) were divided by their respective averages from the random networks to obtain γ (normalized Cp ratio) and λ (normalized Lp ratio), which accurately reflect the network’s deviation from randomness. Small-world characteristics are indicated by γ > 1 and λ ≈ 1. Local property metrics focused on the characteristics of nodes or small-scale subnetworks, including nodal efficiency (Ne), nodal shortest path length (NLp), nodal clustering coefficient (NCp), nodal local efficiency (NLe), nodal degree centrality (Dc), etc.42 To mitigate the effects and bias of S threshold, the area under the curve (AUC) value was utilized for further calculation for each parameter among the sparsity ranges.9,43 AUC can be employed to detect variations in brain topological features, exhibiting high sensitivity in mapping alterations in brain topological properties, which has been extensively utilized in brain network-related research.37,39,42,43
Statistic Analysis
To explore the differences in clinical data and the area under the curve (AUC) for each parameter between the two groups in terms of global features, the ANCOVA was conducted (P < 0.05). Specifically, to control for the influence of potential confounding factors, we incorporated factors such as age, gender, years of education, and mean framewise displacement (FD) into the model as covariates. Among them, the local metrics analysis adopted the Family Wise Error (FWE) multiple comparison correction, with P < 0.05 as the statistical index.
The network-based statistic (NBS) (https://www.nitrc.org/projects/nbs) method was taken to localize brain regions showing differences in functional connectivity.44
Pearson correlation analysis was employed to demonstrate the correlations between topological property alterations in newly-onset T2DM group and their clinical characteristics (including BMI, HbA1c, and MoCA scores) (P < 0.05). To avoid false-positive results caused by multiple comparisons, pairwise indicators were included in the analysis sequentially.
The researchers utilized the electronic medical record database of Renmin Hospital of Wuhan University, gaining access to blood glucose-related test results for hospitalized patients admitted after 2020, while medication records were excluded from the analysis. When collecting clinical data, few patients had missing data due to various reasons. For the very few instances of missing HbA1c and MoCA data, mean imputation was employed.
Results
Clinical Data Analysis of Participants
After excluding two patients who were unable to complete the examination due to intolerance and three patients whose head movements exceeded the standard range, participants consisted of 32 hospitalized patients with newly-onset overweight/obese T2DM and 27 voluntarily recruited NCs matched in age, gender, education level, etc, which were recruited from Renmin Hospital of Wuhan University within the year 2024. Both the newly -onset overweight/obese T2DM group and the NC group were right-handed. There were no significant differences between the two groups in terms of age, gender, years of education, or MoCA scores, etc. There was a difference in BMI value between the two groups (P<0.001). To exclude the confounding effect of head motion, a between-group comparison of the mean FD was conducted for the two subject groups. The results revealed no significant between-group differences (P = 0.113, T = 1.608), indicating that head motion was evenly distributed between the two groups and would not introduce bias into subsequent functional connectivity and topological analyses. The details are shown in Table 1.
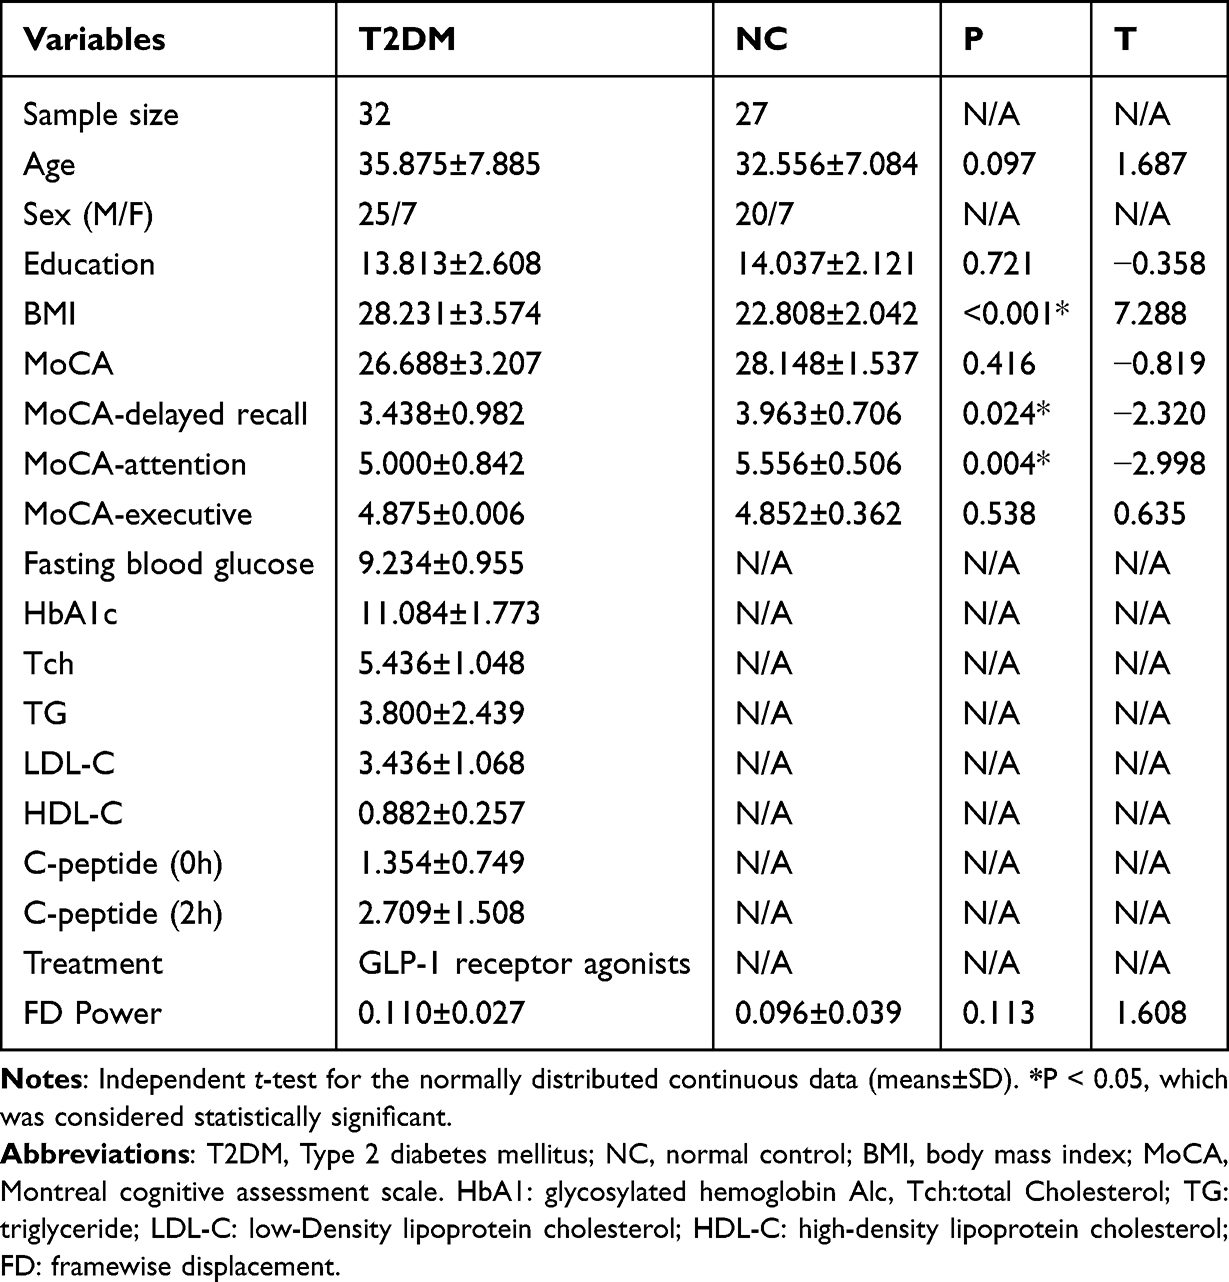 |
Table 1 Demographics and Neuropsychological Results Between Two Groups |
Global Topological Alterations of the Constructed Network
Beyond the γ, both the T2DM group and NC group exhibited decreasing trends in other small-world parameters as the sparsity increased. Within the threshold range, the δ values for both groups consistently exceeded 1.1. However, the δ values for the newly-onset T2DM group were lower than those of the NC group corresponding to each sparsity. The two-sample t-test for global property metrics revealed significant intergroup differences (P < 0.05) in the AUC for δ, Lp, and Eglob (hereafter denoted as aLp and aEglob). Compared to the NC, the T2DM group exhibited decreased δ (P = 0.0423, T = −2.079), decreased Eglob (P = 0.0312, T = −2.212), and increased Lp (P = 0.0253, T = 2.301). See Figure 1 for global topological property variations with sparsity and Table 2 for detailed between-group comparison results.
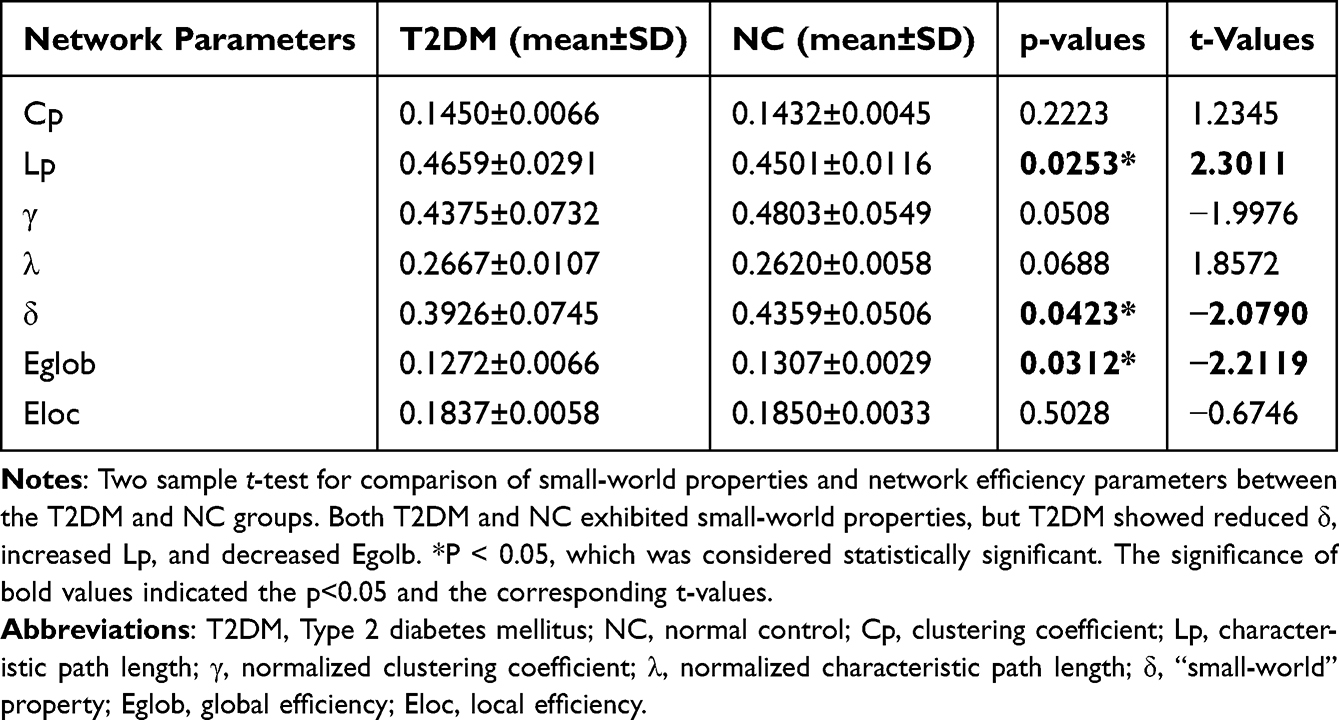 |
Table 2 Significant Differences in Integrated Global Network Parameters Between Two Groups |
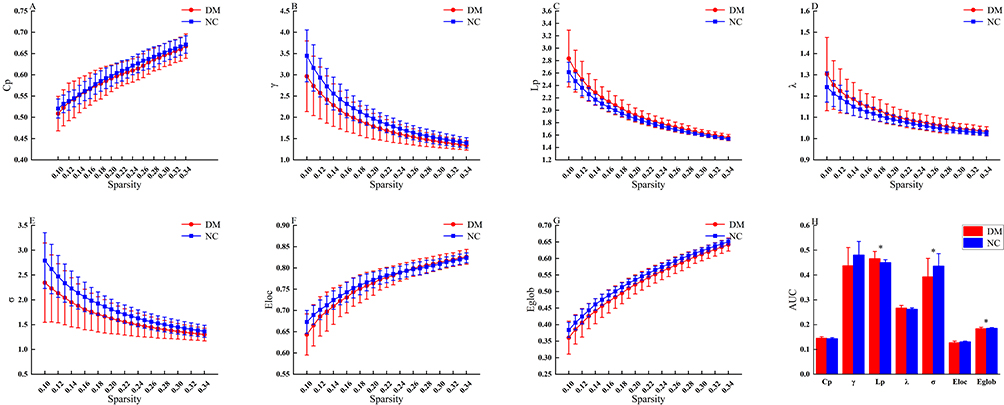 |
Figure 1 Global property metrics of the whole brain network over the defined sparsity values of T2DM patients and normal controls. Within the threshold range (0.1<S<0.34), the δ values of the newly-onset T2DM group and the NC group were always greater than 1.1, both showing typical small-world characteristics. However, the small-world characteristics of the newly-onset T2DM group were significantly lower than those of the NC group. The circles and squares corresponded to the average values of DR and NC respectively, and the error bars corresponded to the standard errors of the groups in each parameter metric (A–G). The AUC of small-world properties and global network efficiency was shown in histogram graphs (H). The symbol “*” denotes statistical significance. Abbreviation: T2DM, type 2 diabetes mellitus; NC, normal control; Cp, clustering coefficient; Lp, characteristic path length; γ, normalized clustering coefficient; λ, normalized characteristic path length; δ, “small-world” property; Eglob, global efficiency; Eloc, local efficiency; AUC, area under the curve. |
Nodal Topological Alterations of the Functional Network
After FWE multiple comparison correction, the two-sample t-test for local property metrics revealed no significant differences (P < 0.05, FWE-corrected) between the newly-onset T2DM group and the NC group. Meanwhile, we were fully aware of the objective constraint posed by the relatively small sample size in this study. To interpret and present the results more cautiously, we adopted p < 0.005 as the reference threshold for uncorrected significance. Based on this criterion, without applying multiple comparison correction, we observed between-group differences in certain brain region nodes concerning Dc, NCp, and NLe (Puncorrected<0.005). Compared to the NC group, the newly-onset T2DM group exhibited a decreased degree centrality in the left gyrus rectus (P = 0.00376, T=−3.02929), an increased degree centrality in the left inferior parietal supramarginal and angular gyri (P = 0.00341, T = 3.06349), and along with increases in both NCp (P = 0.00155, T = 3.33534) and NLe (P = 0.00384, T = 3.02127) in the left inferior frontal gyrus orbital part. See Figure 2 and Table 3 for details.
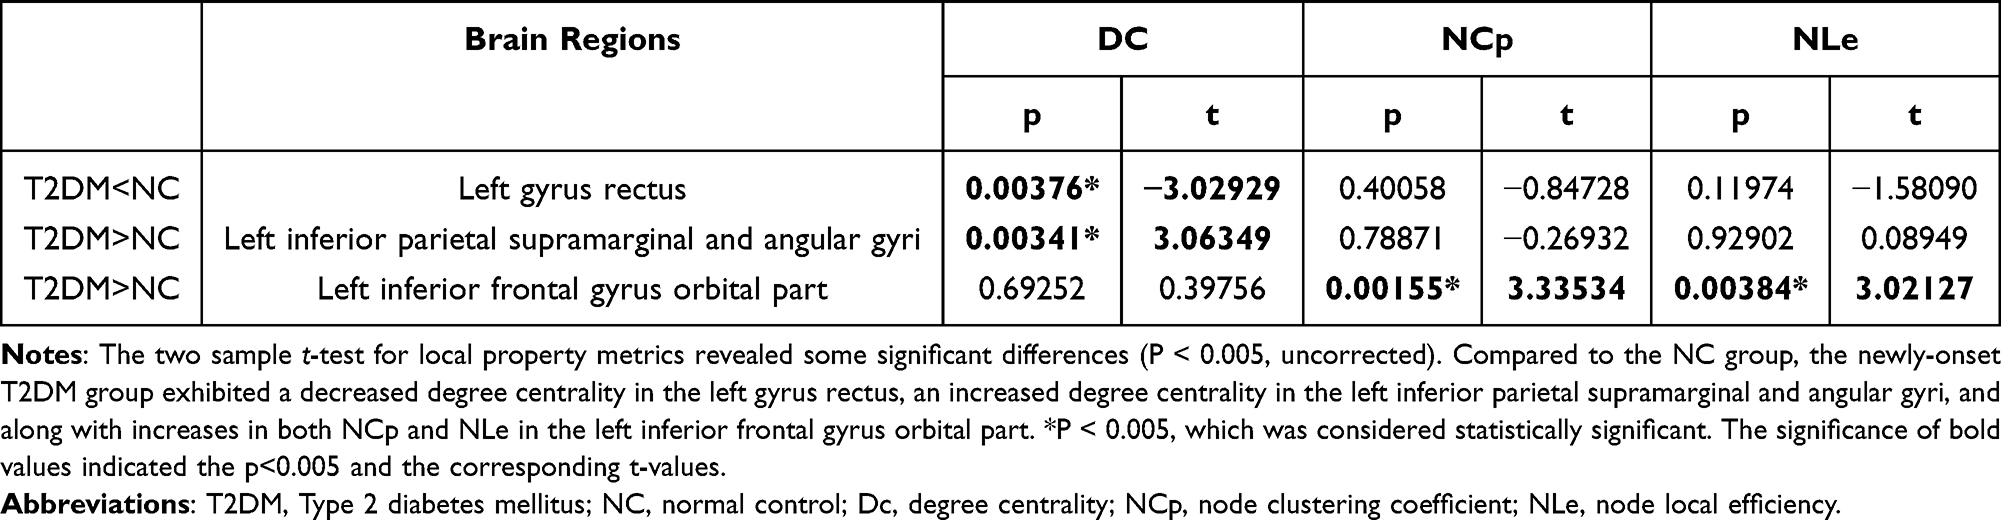 |
Table 3 Detailed Information on the Uncorrected Significant Differences of the Node in the T2DM Group |
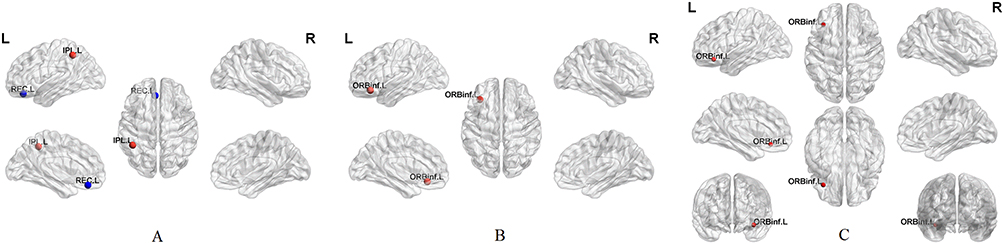 |
Figure 2 Distribution of altered network measures in T2DM. The distribution of abnormal nodes is separately presented in terms of degree centrality (A), node clustering coefficient (B), and node local efficiency (C). Here, red dots indicated an increase in node attributes within the newly-onset T2DM group (T2DM > NC) with a significance level of p < 0.005 (uncorrected). Conversely, blue dots represented a decrease in node attributes in the newly-onset T2DM group (T2DM < NC) with the same significance level of p < 0.005 (uncorrected). Notably, NCp and NLe were presented based on identical brain region with similar t values, inherently leading to highly similar brain maps. To avoid duplicate figures, multi-view stereoscopic visualization including extra coronal and ventral views was adopted for NLe (Panel C) to visually distinguish from NCp maps (Panel B). Abbreviation: T2DM, type 2 diabetes mellitus; NC, normal control; ORBinf.L, inferior frontal gyrus orbital part; REC.L, gyrus rectus; IPL.L, Inferior parietal supramarginal and angular gyri. |
Alterations in Functional Connections
The NBS method failed to identify abnormal network connections (P > 0.05, FWE-correction).
Correlation Analysis
In the T2DN group, the AUC of global topological metrics, including δ, Lp, and Eglob in the newly-onset T2DM group showed no correlation with MoCA, HbA1c, or BMI (P > 0.05). A positive correlation was observed between the Dc of left inferior parietal angular gyrus and BMI (P < 0.05). See Figure 3 for details.
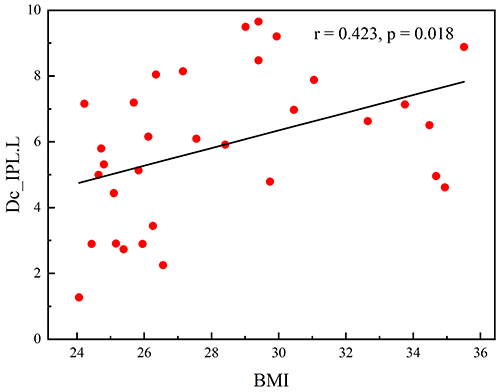 |
Figure 3 Correlations among altered Dc and BMI in T2DM patients. For the newly-onset T2DM group, there existed a linear link between the degree centrality of the left inferior parietal supramarginal and angular gyrus and BMI (r = 0.423, p = 0.018). Abbreviation: BMI, body mass index; Dc, degree centrality; IPL.L, Inferior parietal, but supramarginal and angular gyri. |
Discussion
In this study, graph theory methods were performed to investigate the differences in the topological structure of the neural connectivity between overweight/obese patients with T2DM and normal non-diabetic patients. Compared to the NC group, the topological structures of global and local properties in the overweight/obese T2DM group were disordered.
The brain is a complex system for information processing that involves the reception, further analysis, and integration of vast amounts of information. Analyzing the topological characteristics of the brain can provide deeper insights into the mechanisms underlying information integration and segregation. Networks were categorized into three primary types: regular networks, random networks, and small-world networks. Random networks represent a state of high integration, characterized by rapid global information transmission but lacking local modular structures and exhibiting poor stability, which is primarily manifested by low Cp, low γ, low Eloc, short Lp, low λ, and high Eglob. Regular networks represent a state of high segregation, featuring strong local information processing but low efficiency in global information integration, which is mainly manifested by high Cp, high γ, high Eloc, long Lp, high λ, and low Eglob. The brain cannot exhibit information integration or information separation in isolation. The healthy brain demonstrates small-world characteristics, which support both rapid global information integration and coordination alongside efficient local information transformation capabilities. It achieves an optimal balance between information separation and integration, primarily characterized by high Cp, high γ, high Eloc, short Lp, low λ, and high Eglob. The small-world network represents the optimal architecture for the healthy brain networks.22,45 When brain function is impaired, deviations toward randomized or regularized network patterns may occur.46,47
The results of this study indicated that the small-world property of the newly-onset overweight/obese T2DM was reduced, with Eglob decreased and Lp increased, although T2DM patients showed the characteristics of small-world properties similar to NCs. These findings suggested a transition of the brain network from a small-world network to a more regular network, indicating an impairment in brain integration ability, which were consistent with previous research literature.48–50 However, other study had found that T2DM had a higher Cp and a lower Lp, while both Eglob and Eloc were increased, showing stronger small-world characteristics. Researchers interpreted this phenomenon of excessive activation of the brain network in T2DM patients as a compensatory behavior, believing that it may reduce cognitive disorder and thereby maintain the normal function of the brain by mobilizing additional neuron activity.9 This finding aligned with another study, which reported increased λ and Eloc alongside decreased Lp in the T2DM group. But the network metrics in the prediabetes group fell between those of the T2DM group and the healthy controls. The study indicated that alterations in brain networks emerged prior to clinical diagnosis, suggesting that compensatory reorganization mechanisms might be activated in the brain during the early stages of the disease to maintain normal function.51
The varying results of these researches on the brain topological properties in T2DM patients might be caused by individual subjects and different stages of the disease, etc. Although these research results suggested that the brain function changes were not completely consistent, they collectively indicated that the topological properties of the brain network are abnormal in patients with T2DM. This was beyond doubt. For our study results, abnormal δ values indicated that brain networks of T2DM patients had lost their normal small-world property and fail to balance functional segregation integration. Increased Lp prolonged inter-regional information transmission paths, reducing speed and efficiency. Abnormal Eglob further confirmed impaired whole-brain integration and weakened inter-regional synergy. Essentially, these topological changes reflected a potential neural mechanism of decreased connection efficiency and insufficient functional synergy in brain networks of T2DM patients, providing direct topological evidence for understanding the impact of metabolic disorders on brain function.
In our study, without multiple comparison correction (P < 0.005), significant differences were found in Dc, NCp, and NLe of brain functional networks in multiple brain regions between newly-onset T2DM and NC group. This suggested that regional abnormalities in the topological properties of brain functional networks could occur in the early stage of newly-onset T2DM, which may be the early neuroimaging basis for its vulnerability to cognitive dysfunction. The lack of multiple comparison correction in this study had its feasibility but also has limitations. The feasibility is mainly reflected in two aspects: exploratory research positioning and the capture of early abnormal signals. This study focused on the early changes in brain functional networks in newly-onset overweight/obese T2DM patients, which falled into the category of exploratory research. Its core aim was to preliminarily screen brain region nodes that may have inter-group differences, providing clear targets and directions for subsequent confirmatory research. Although multiple comparison correction could effectively control Type I errors (false positive results), it significantly increases the risk of Type II errors (false negative results), especially in exploratory studies with limited sample sizes and small effect sizes, where over-correction may mask subtle differences with potential biological significance. The abnormal node properties observed in the left rectus gyrus, inferior parietal lobule angular gyrus, and orbital part of the inferior frontal gyrus in this study were located in key brain regions related to cognitive function and emotion regulation. This further confirmed that the differential signals captured without correction had certain rationality and biological value, providing an important exploratory basis for subsequent large-sample, multi-center confirmatory studies.
Multiple studies have consistently demonstrated that individuals with T2DM exhibited abnormalities in node Dc. One study revealed that patients with early-onset T2DM showed increased degree centrality across multiple nodes, involving brain regions such as the temporal lobe and hippocampus. This phenomenon may represent the neurobiological mechanism underlying cognitive dysfunction in patients with early-onset T2DM.52 A study employed degree centrality analysis to investigate the topological alteration patterns of brain functional hubs in patients with T2DM. Compared to the healthy control group, T2DM patients exhibited a significant increase in the left anterior cingulate gyrus, while showing a marked decrease in the bilateral lateral occipital cortices and the right precentral gyrus.53 Our research findings demonstrated that, compared to the NC group, the newly-onset T2DM group exhibited a significant reduction in Dc within the left rectus gyrus, while concurrently showing an elevation in Dc in the left inferior parietal angular gyrus. These observed alterations in Dc, characterized by a combination of both increased and decreased connectivity patterns, were largely consistent with the aforementioned trends. Such changes may have reflected the brain’s early compensatory response in T2DM, wherein local network connectivity was adjusted to offset functional impairments in other brain regions, thereby preserving fundamental cognitive and sensory integration capabilities.
In addition, our study results revealed that the NCp and NLe in the left inferior frontal gyrus orbital part were significantly elevated in the newly-onset T2DM group. The inferior frontal gyrus orbital part is a core region of the orbitofrontal cortex and is involved in multiple cognitive-related functions. A study based on arterial spin labeling technology disclosed that, compared with the healthy control group, patients with T2DM exhibited a marked reduction in cerebral blood flow (CBF) in the right inferior frontal gyrus orbital part. Further analysis indicated that there was a negative correlation between CBF changes in the right inferior frontal gyrus orbital part and the duration of diabetes, meaning that a longer disease course was associated with more pronounced decreases in CBF in this region. Moreover, a positive correlation was observed between CBF changes in the right inferior frontal gyrus orbital part and scores on the Self-Rating Depression Scale, suggesting that abnormal CBF in this area might be related to depressive symptoms in patients.54 A voxel-based morphometry analysis showed that the gray matter density in the left inferior frontal gyrus orbital part was significantly lower in the T2DM with cognitive impairment group compared with the T2DM group.55 This study exploratorily found that the simultaneous elevation of NCp and NLe in the left inferior frontal gyrus orbital part might, on the one hand, reflect an enhanced mediating role of this region in information transmission, turning it into an abnormal functional bottleneck in the brain network; on the other hand, the increased local efficiency might imply a compensatory rise in the internal information processing efficiency of this region to cope with early brain functional impairment in T2DM.
Despite the aforementioned feasibility of the uncorrected analyses, the limitations of this study warrant particular attention. Firstly, the absence of multiple comparison correction exposed the research findings to the risk of Type I errors. Specifically, some of the observed differences in brain region nodes may represent false-positive results, and the influence of random errors cannot be entirely ruled out. This constituted the primary limitation in studies focusing on local nodes. Secondly, the exploratory nature of this study meant that the results can only be regarded as preliminary findings and cannot be directly interpreted as definitive conclusions regarding brain functional abnormalities in newly-onset T2DM. Therefore, subsequent studies should expand the sample size and employ multiple comparison correction to further validate the reliability of the observed differences.
The abnormal topological properties of brain regions identified in this study were predominantly located in key areas involved in cognitive control and higher-order integration, such as the prefrontal and parietal lobes, which were highly consistent with the neuroanatomical basis of T2DM-related cognitive impairment. Taken together, while the decision not to perform multiple comparison correction in this exploratory phase was a reasonable choice that effectively captured potential early brain functional abnormalities, it is essential to acknowledge the associated limitations, including the risk of false positives and insufficient comparability. Future research should adopt a large-sample design and utilize multiple comparison correction methods to verify the current findings. Additionally, integrating clinical indicators will facilitate a deeper analysis of the relationship between brain functional abnormalities and disease severity, providing crucial insights into the pathogenesis of T2DM-related brain injury and enabling early intervention strategies.
For analysis of the connections between nodes, our study strictly followed the standard procedures to conduct Network-Based Statistic on the inter-group differential connectivity pathways and employed multiple comparison correction methods to control for false positives. Ultimately, no statistically significant differential connectivity pathways were identified. In light of the study design and sample characteristics, the following speculations were made regarding this result: Firstly, the sample size in this study was relatively small (27–32 cases), resulting in insufficient statistical power to detect subtle inter-group connectivity differences. Secondly, the brain network abnormalities associated with newly-onset T2DM may exhibit a diffuse and widespread distribution pattern rather than being concentrated in specific local pathways, making it difficult for the NBS method to detect local significant differences. Thirdly, the impact of metabolic disorders on brain connectivity may be a weak effect. Given the current sample size, this weak effect was masked by individual differences and did not reach statistical significance. Moreover, this result further suggested that brain network damage associated with T2DM might primarily manifest as alterations in global topological properties rather than specific damage to local pathways, providing a reference for the direction of subsequent research.
According to the aforementioned research of T2DM patients, brain network dysfunction all indicated that the brain structure and function of T2DM patients were impaired, which had an undeniable connection with cognitive decline. We sought to clarify the independent impact of obesity on brain function and cognition in patients with newly-onset T2DM. Nevertheless, no real-life cognitive impairment was observed in the newly-onset overweight/obese T2DM patients in our, as well as an association between brain alterations and cognition. This finding might be interpreted in light of the limitations inherent to the MoCA scale.
In our study, the total score of the MoCA in the NC group was generally at a high level, with a relatively narrow score distribution range, and the mean score reached 28.148 ± 1.537. This situation demonstrated a significant ceiling effect, resulting in low variability in the total scores. In contrast, although the total MoCA score in the T2DM group did not decrease significantly, being 26.688 ± 3.207, the score losses were mainly concentrated in cognitive subdomains such as delayed recall and attention. The above research findings suggest that although the overall cognitive scores of T2DM patients are currently within the normal range, some of their cognitive sub-functions may have already shown early signs of impairment. Moreover, the total MoCA score has certain limitations in the assessment process, as it to some extent restricts the ability to identify and detect subtle cognitive differences between the two groups. It is advisable to consider using more detailed and sensitive cognitive assessment tools to comprehensively and profoundly uncover early cognitive changes associated with T2DM. Future studies could employ more sensitive domain-specific cognitive tasks to track how these early network abnormalities progress into real-life cognitive impairments, enabling earlier risk identification and intervention.
Our study successfully revealed a significant positive correlation between the degree centrality of the left inferior parietal angular gyrus and body mass index in newly-onset overweight/obese T2DM group. Another research had found positive correlations between BMI and local nodal metrics of certain regions, including the right inferior temporal gyrus, as well as the right superior temporal gyrus in T2DM individuals.9 Local nodal metrics are crucial for understanding the local connectivity and functional characteristics of individual brain nodes. The findings of this study, combined with our own, further emphasized the complex relationship between BMI and brain structural and functional alterations in T2DM.
Returning to the research topic, obesity exerted multifaceted effects on the human brain, leading to various structural alterations in both gray and white matter.56 The research had long indicated a relationship between overweight/obesity and T2DM, which raised the risk of developing diabetes57 However the underlying mechanism remains unclear. Obesity significantly impacted glycemic and metabolic control in T2DM. The research had demonstrated that obese patients with T2DM exhibit severe brain structural and cognitive abnormalities in the early stages of the disease.58,59 These studies all focused on discovering morphological differences in the brains of patients with T2DM, but the functional changes within the brain are currently unknown.
Conclusion and Limitations
By analyzing the brain topological properties in newly-onset overweight/obese T2DM patients, we observed that the small-world property was weakened, the information transmission capacity of the brain overall network was decreased, while certain node regions were enhanced. These nodes were distributed across multiple brain regions and involved various functional systems. The functional impairment of the brain in T2DM results from the combined effects of multiple factors. Overweight/obese T2DM patients may compensate for the adverse effects of overall brain damage during the early stage of disease by hyperactivating specific brain regions.
Through magnetic resonance imaging techniques, we have demonstrated that overweight/obese T2DM individuals exhibit brain heterogeneous dysfunction even at the newly-onset of the disease. This discovery provides a novel point for early detection of diabetes-related alterations of brain and establishes an early model for assessing potential improvements in brain dysfunction following subsequent weight management. The multilevel changes in small-world properties, particularly at the local nodal levels, offer more robust insights into the mechanisms underlying brain network dysfunction in T2DM by characterizing alterations at both global and local scales. These facilitate the early diagnosis, timely intervention and treatment for overweight/obese T2DM patients.
This study also has several limitations. Most notably, our current research did not enroll normal-weight individuals with newly-onset T2DM, thereby failing to investigate the specific linkages between brain functional alterations and obesity. Consequently, we are unable to ascertain the independent potential impact of obesity on brain and cognitive function in newly-onset T2DM individuals. In the meantime, BMI was not corrected in the statistical analysis, which was a targeted choice made after careful consideration. BMI is closely related to the grouping and serves as a key component of the “combined metabolic burden of T2DM and excessive obesity,” rather than an independent confounding variable separate from the core exposure factors of the study. Forcibly correcting BMI in the statistical model might overly offset or obscure its genuine impact, in synergy with T2DM, on brain network topology, diluting the core effects of the study. This could prevent an accurate reflection of the potential mechanisms underlying brain changes mediated by the combined metabolic burden and might even introduce statistical bias, affecting the authenticity and rationality of result interpretation. However, we also acknowledge objectively that not correcting BMI has certain limitations. As an important metabolic indicator, BMI may independently influence brain functional networks through pathways such as inflammatory responses and microvascular lesions. Failing to correct for it means we cannot fully rule out its independent effects as potential interference in the study results. In the future, more refined research designs, such as BMI stratification analysis and multifactor interaction analysis, can be employed to further disentangle the independent and synergistic effects of BMI and T2DM and clarify their respective contributions to brain network alterations.
Furthermore, regarding the measurement of brain network topological properties, in addition to graph theory analysis, multivariate models could be comprehensively employed to enable a more thorough assessment of the interactive influences of brain topological structure and functional connectivity.
Data Sharing Statement
The data that support the findings of this study are available from the corresponding author (LG), upon reasonable request.
Ethics Approval and Informed Consent
Our experiments were in accordance with the ethical standards formulated in the Helsinki Declaration. The study was approved by the Clinical Research Ethics Committee of Renmin Hospital of Wuhan University (WDRY2024-K214). All subjects were informed of the trial content and the precautions for MR examination, and all participated voluntarily and signed the informed consent form.
Author Contributions
All authors made significant contributions to the report work, whether in conception, research design, implementation, data collection, analysis and interpretation, or all of these areas. All authors gave final approval of the version to be published; have agreed on the journal to which the article has been submitted; and agreed to be accountable for all aspects of the work. The CRediT authorship taxonomy is followed to outline the contributions of each author to the article.
Tingting Yu: Data curation; Formal analysis; Investigation; Software; Validation; Writing – original draft.
Fen Zhou: Data curation; Investigation; Resources; Visualization; Writing – original draft.
Jun Chen: Conceptualization; Methodology; Project administration; Supervision; Writing – review and editing.
Ling Gao: Methodology; Project administration; Resources; Supervision; Writing – review and editing.
Funding
No funding was received.
Disclosure
The authors report that they do not have any competing interests in this work.
References
1. Li Y, Teng D, Shi X, et al. Prevalence of diabetes recorded in mainland China using 2018 diagnostic criteria from the American Diabetes Association: national cross sectional study. BMJ. 2020;369:m997. doi:10.1136/bmj.m997
2. Sun H, Saeedi P, Karuranga S, et al. IDF Diabetes Atlas: global, regional and country-level diabetes prevalence estimates for 2021 and projections for 2045. Diabetes Res Clin Pract. 2022;183:109119. doi:10.1016/j.diabres.2021.109119
3. Zhou Y, Liu J, Zhao Z, et al. The national and provincial prevalence and non-fatal burdens of diabetes in China from 2005 to 2023 with projections of prevalence to 2050. Military Medical Research. 2025;1(12):28. doi:10.1186/s40779-025-00615-1
4. Yan Z, Cai M, Han X, et al. The interaction between age and risk factors for diabetes and prediabetes: a community-based cross-sectional study. Diab Metabol Syndr Obesit. 2023;16:85–15. doi:10.2147/DMSO.S390857
5. Chen K, Shen Z, Gu W, et al. Prevalence of obesity and associated complications in China: a cross-sectional, real-world study in 15.8 million adults. Diab Obesit Metabol. 2023;25(11):3390–3399. doi:10.1111/dom.15238
6. Karvani M, Simos P, Stavrakaki S, et al. Neurocognitive impairment in type 2 diabetes mellitus. Hormones. 2019;18(4):523–534. doi:10.1007/s42000-019-00128-2
7. Groeneveld O, Reijmer Y, Heinen R, et al. Brain imaging correlates of mild cognitive impairment and early dementia in patients with type 2 diabetes mellitus. Nutr Metab Cardiovasc Dis. 2018;28(12):1253–1260. doi:10.1016/j.numecd.2018.07.008
8. Yuan CL, Yi R, Dong Q, et al. The relationship between diabetes-related cognitive dysfunction and leukoaraiosis. Acta Neurol Belg. 2021;121(5):1101–1110. doi:10.1007/s13760-021-01676-4
9. Xu J, Chen F, Liu T, et al. Brain functional networks in type 2 diabetes mellitus patients: a resting-state functional MRI study. Front Neurosci. 2019;13:239. doi:10.3389/fnins.2019.00239
10. He D, Hao Z, Zhao M, et al. Structural and functional brain abnormal alteration in patients with type 2 diabetes mellitus: a coordinate-based meta-analysis. Translat Psych. 2025;15(1):269. doi:10.1038/s41398-025-03488-z
11. Gao M, Gong L, Zeng Y, et al. A study on appetite of overweight/obese patients with type 2 diabetes mellitus based on multimodal magnetic resonance imaging. Front Neuroimag. 2025;4(4):1615654. doi:10.3389/fnimg.2025.1615654
12. Isomaa B, Henricsson M, Almgren P, et al. The metabolic syndrome influences the risk of chronic complications in patients with type II diabetes. Diabetologia. 2001;44(9):1148–1154. doi:10.1007/s001250100615
13. Debette S, Wolf C, Lambert JC, et al. Abdominal obesity and lower gray matter volume: a Mendelian randomization study. Neurobiol Aging. 2014;35(2):378–386. doi:10.1016/j.neurobiolaging.2013.07.022
14. Pedditzi E, Peters R, Beckett N. The risk of overweight/obesity in mid-life and late life for the development of dementia: a systematic review and meta-analysis of longitudinal studies. Age Ageing. 2016;45(1):14–21. doi:10.1093/ageing/afv151
15. Amen DG, Wu J, George N, et al. Patterns of regional cerebral blood flow as a function of obesity in adults. J Alzheimer’s Dis. 2020;77(3):1331–1337. doi:10.3233/JAD-200655
16. Hovens IB, Dalenberg JR, Small DM. A brief neuropsychological battery for measuring cognitive functions associated with obesity. Obesity. 2019;27(12):1988–1996. doi:10.1002/oby.22644
17. Zhuang H, Yao X, Li H, et al. Long-term high-fat diet consumption by mice throughout adulthood induces neurobehavioral alterations and hippocampal neuronal remodeling accompanied by augmented microglial lipid accumulation. Brain Behav Immun. 2022;100:155–171. doi:10.1016/j.bbi.2021.11.018
18. Lei Y, Chen Y, Zhang S, et al. Qingzhuan dark tea Theabrownin alleviates hippocampal injury in HFD-induced obese mice through the MARK4/NLRP3 pathway. Heliyon. 2024;10(5):e26923. doi:10.1016/j.heliyon.2024.e26923
19. Strachan MW, Reynolds RM, Marioni RE, et al. Cognitive function, dementia and type 2 diabetes mellitus in the elderly. Nat Rev Endocrinol. 2011;7(2):108–114. doi:10.1038/nrendo.2010.228
20. Mccrimmon RJ, Ryan CM, Frier BM. Diabetes and cognitive dysfunction. Lancet. 2012;379(9833):2291–2299. doi:10.1016/S0140-6736(12)60360-2
21. Cao H, Plichta MM, Schafer A, et al. Test-retest reliability of fMRI-based graph theoretical properties during working memory, emotion processing, and resting state. Neuroimage. 2014;84:888–900. doi:10.1016/j.neuroimage.2013.09.013
22. Suo XS, Lei DL, Li LL, et al. Psychoradiological patterns of small-world properties and a systematic review of connectome studies of patients with 6 major psychiatric disorders. J Psychiatry Neurosci. 2018;43(6):427.
23. Long Y, Li X, Cao H, et al. Common and distinct functional brain network abnormalities in adolescent, early-middle adult, and late adult major depressive disorders. Psychol Med. 2024;54(3):582–591. doi:10.1017/S0033291723002234
24. Farahani FV, Karwowski W, Lighthall NR. Application of graph theory for identifying connectivity patterns in human brain networks: a systematic review. Front Neurosci. 2019;13:585. doi:10.3389/fnins.2019.00585
25. Liao X, Vasilakos A V, He Y. Small-world human brain networks: perspectives and challenges. Neurosci Biobehav Rev. 2017;77:286–300. doi:10.1016/j.neubiorev.2017.03.018
26. Sporns O. Graph theory methods: applications in brain networks. Dialogues Clin Neurosci. 2018;20(2):111–121. doi:10.31887/DCNS.2018.20.2/osporns
27. Pan XF, Wang L, Pan A. Epidemiology and determinants of obesity in China. Lancet Diabetes Endocrinol. 2021;9(6):373–392. doi:10.1016/S2213-8587(21)00045-0
28. Obesity: Identification, assessment and management. London: National Institute for Health and Care Excellence (NICE). 2023.
29. American Diabetes Association. Diagnosis and classification of diabetes mellitus. Diabetes Care. 2014;37(1):S81–S90. doi:10.2337/dc14-S081
30. Yan CG, Wang XD, Zuo XN, et al. DPABI: data processing & analysis for (Resting-state) brain imaging. Neuroinformatics. 2016;14(3):339–351. doi:10.1007/s12021-016-9299-4
31. Power JD, Barnes KA, Snyder AZ, et al. Spurious but systematic correlations in functional connectivity MRI networks arise from subject motion. Neuroimage. 2012;59(3):2142–2154. doi:10.1016/j.neuroimage.2011.10.018
32. Parkes L, Fulcher B, Yucel M, et al. An evaluation of the efficacy, reliability, and sensitivity of motion correction strategies for resting-state functional MRI. Neuroimage. 2018;171:415–436. doi:10.1016/j.neuroimage.2017.12.073
33. Goto M, Abe O, Aoki S, et al. Diffeomorphic anatomical registration through exponentiated Lie Algebra provides reduced effect of scanner for cortex volumetry with atlas-based method in healthy subjects. Neuroradiology. 2013;55(7):869–875. doi:10.1007/s00234-013-1193-2
34. Goto M, Abe O, Aoki S, et al. Influence of parameter settings in voxel-based morphometry 8. Using DARTEL and region-of-interest on reproducibility in gray matter volumetry. Methods Inf Med. 2015;54(2):171–178. doi:10.3414/ME14-01-0049
35. Wang J, Wang X, Xia M, et al. GRETNA: a graph theoretical network analysis toolbox for imaging connectomics. Front Hum Neurosci. 2015;9:386. doi:10.3389/fnhum.2015.00386
36. Tzourio-Mazoyer N, Landeau B, Papathanassiou D, et al. Automated anatomical labeling of activations in SPM using a macroscopic anatomical parcellation of the MNI MRI single-subject brain. Neuroimage. 2002;15(1):273–289. doi:10.1006/nimg.2001.0978
37. Zhang J, Wang J, Wu Q, et al. Disrupted brain connectivity networks in drug-naive, first-episode major depressive disorder. Biol Psychiatry. 2011;70(4):334–342. doi:10.1016/j.biopsych.2011.05.018
38. Watts DJ, Strogatz SH. Collective dynamics of ‘small-world’ networks. Nature. 1998;393(6684):440–442. doi:10.1038/30918
39. Wu B, Li X, Zhou J, et al. Altered whole-brain functional networks in drug-naïve, first-episode adolescents with major depression disorder. J Magn Reson Imaging. 2020;52(6):1790–1798. doi:10.1002/jmri.27270
40. Achard S, Bullmore E. Efficiency and cost of economical brain functional networks. PLoS Comput Biol. 2007;3(2):e17. doi:10.1371/journal.pcbi.0030017
41. Latora V, Marchiori M. Efficient behavior of small-world networks. Phys Rev Lett. 2001;87(19):198701. doi:10.1103/PhysRevLett.87.198701
42. Ge S, Liu J, Jia Y, et al. Topological alteration of the brain structural network in Parkinson’s disease with apathy. Brain Res Bull. 2024;208:110899.
43. Lei D, Li K, Li L, et al. Disrupted functional brain connectome in patients with posttraumatic stress disorder. Radiology. 2015;276(3):818–827. doi:10.1148/radiol.15141700
44. Zalesky A, Fornito A, Bullmore ET. Network-based statistic: identifying differences in brain networks. Neuroimage. 2010;53(4):1197–1207. doi:10.1016/j.neuroimage.2010.06.041
45. Zhou Y, Long Y. Sex differences in human brain networks in normal and psychiatric populations from the perspective of small-world properties. Front Psychiatry. 2024;15:1456714. doi:10.3389/fpsyt.2024.1456714
46. Tan W, Ouyang X, Huang D, et al. Disrupted intrinsic functional brain network in patients with late-life depression: evidence from a multi-site dataset. J Affective Disord. 2023;323:631–639. doi:10.1016/j.jad.2022.12.019
47. Yang H, Chen X, Chen Z, et al. Disrupted intrinsic functional brain topology in patients with major depressive disorder. Mol Psych. 2021;26(12):7363–7371. doi:10.1038/s41380-021-01247-2
48. Reijmer YD, Leemans A, Brundel M, et al. Disruption of the cerebral white matter network is related to slowing of information processing speed in patients with type 2 diabetes. Diabetes. 2013;62(6):2112–2115. doi:10.2337/db12-1644
49. Zhang J, Liu Z, Li Z, et al. Disrupted white matter network and cognitive decline in type 2 diabetes patients. J Alzheimers Dis. 2016;53(1):185–195. doi:10.3233/JAD-160111
50. Chen GQ, Zhang X, Xing Y, et al. Resting-state functional magnetic resonance imaging shows altered brain network topology in Type 2 diabetic patients without cognitive impairment. Oncotarget. 2017;8(61):104560–104570.
51. Van Bussel FCG, Backes WH, Van Veenendaal TM, et al. Functional brain networks are altered in type 2 diabetes and prediabetes: signs for compensation of cognitive decrements? The maastricht study. Diabetes. 2016;65(8):2404–2413. doi:10.2337/db16-0128
52. Feng Y, Li Y, Tan X, et al. Altered gray matter volume, functional connectivity, and degree centrality in early-onset type 2 diabetes mellitus. Front Neurol. 2021;12:697349. doi:10.3389/fneur.2021.697349
53. Liu D, Duan S, Zhou C, et al. Altered brain functional hubs and connectivity in type 2 diabetes mellitus patients: a resting-state fMRI study. Front Aging Neurosci. 2018;10:55. doi:10.3389/fnagi.2018.00055
54. Luo W, Wang J, Chen M, et al. Alterations of cerebral blood flow and its connectivity in olfactory-related brain regions of type 2 diabetes mellitus patients. Front Neurosci. 2022;16:904468. doi:10.3389/fnins.2022.904468
55. He Y, Li L, Liu J. The whole-brain voxel-based morphometry study in early stage of T2DM patients. Brain Behav. 2022;12(3):e2497. doi:10.1002/brb3.2497
56. Majumder S, Menon K, Borotikar B. Impact of obesity on brain structure: a critical review of the evidence from magnetic resonance imaging studies. Brain Res. 2025;1865:149823. doi:10.1016/j.brainres.2025.149823
57. Maggio CA, Pi-Sunyer FX. Obesity and type 2 diabetes. Endocrinol Metab Clin North Am. 2003;32(4):805–822. doi:10.1016/S0889-8529(03)00071-9
58. Yoon S, Cho H, Kim J, et al. Brain changes in overweight/obese and normal-weight adults with type 2 diabetes mellitus. Diabetologia. 2017;60(7):1207–1217. doi:10.1007/s00125-017-4266-7
59. Yau PL, Javier DC, Ryan CM, et al. Preliminary evidence for brain complications in obese adolescents with type 2 diabetes mellitus. Diabetologia. 2010;53(11):2298–2306. doi:10.1007/s00125-010-1857-y
 © 2026 The Author(s). This work is published and licensed by Dove Medical Press Limited. The
full terms of this license are available at https://www.dovepress.com/terms
and incorporate the Creative Commons Attribution
- Non Commercial (unported, 4.0) License.
By accessing the work you hereby accept the Terms. Non-commercial uses of the work are permitted
without any further permission from Dove Medical Press Limited, provided the work is properly
attributed. For permission for commercial use of this work, please see paragraphs 4.2 and 5 of our Terms.
© 2026 The Author(s). This work is published and licensed by Dove Medical Press Limited. The
full terms of this license are available at https://www.dovepress.com/terms
and incorporate the Creative Commons Attribution
- Non Commercial (unported, 4.0) License.
By accessing the work you hereby accept the Terms. Non-commercial uses of the work are permitted
without any further permission from Dove Medical Press Limited, provided the work is properly
attributed. For permission for commercial use of this work, please see paragraphs 4.2 and 5 of our Terms.