Back to Journals » Psychology Research and Behavior Management » Volume 16
To Binge Watch TV Series: How a Leisure Activity May Affect Sleep, Mood and Quality of Life
Authors Forte G ![]() , Favieri F
, Favieri F ![]() , Tambelli R, Casagrande M
, Tambelli R, Casagrande M
Received 9 February 2023
Accepted for publication 12 June 2023
Published 1 July 2023 Volume 2023:16 Pages 2395—2405
DOI https://doi.org/10.2147/PRBM.S407854
Checked for plagiarism Yes
Review by Single anonymous peer review
Peer reviewer comments 2
Editor who approved publication: Dr Igor Elman
Giuseppe Forte,* Francesca Favieri,* Renata Tambelli, Maria Casagrande
Department of Dynamic and Clinical Psychology and Health, “Sapienza” University of Rome, Rome, Italy
*These authors contributed equally to this work
Correspondence: Giuseppe Forte; Maria Casagrande, Department of Dynamic and Clinical Psychology and Health, “Sapienza” University of Rome, Via degli Apuli 1, 00185, Rome, Italy, Email [email protected]; [email protected]
Objective: New TV-watching patterns increased the practice of binge-watching (BW). Considering the adaptive-maladaptive continuum of BW, the relationship between BW and health outcomes is still unclear. This study aimed to analyze some features of BW related to quality of life, focusing on sleep quality.
Methods: Four-hundred eighty-two young adults were classified into four groups according to their BW approach. Then, sleep quality, mood, and quality of life were assessed.
Results: All the investigated variables were associated with problematic and moderate BW. No differences emerged between BW as a leisure activity and not watching TV series. Moreover, quality of life is directly affected by BW.
Conclusion: Accordingly, BW should be considered a continuum of behavioral patterns from a leisure activity characterized by positive outcomes to a maladaptive behavior characterized by negative outcomes for sleep, mood, and quality of life.
Keywords: behavioral addiction, leisure activity, sleep quality, health status, psychological well-being
Graphical Abstract:

Introduction
The last years were characterized by profound changes in the access and fruition of TV content. New technologies (eg, mobile devices) and global access to the world wide web drastically changed how to watch television and multimedia content with the increasing use of streaming services and higher quality and quantity of offers.1 In this context, viewers watch TV content in larger doses, and a common viewing style adopted by the general population was observed, ie, Binge-Watching (BW). BW was commonly defined as watching multiple episodes of the same series in one sitting, representing a switch from the classical vision of TV content to a more intensive use due to the higher availability of TV series. It is characterized by a continuum pattern from leisure activity, associated with positive effects on well-being, to problematic behavior that presents addictive features2–6 and negative psychological outcomes. Problematic BW is typically characterized by compulsive overwatching associated with social impairments, isolation, high depression, anxiety, and affective dysregulation.7,8 In binge-watchers, these psychological conditions are linked to sedentary habits and reduction in physical activity, unhealthy eating behavior, change in habits and loss of sleep.7,9–11 Despite previous studies reporting an increase in negative outcomes of BW, no study differentiated them considering the adaptive-maladaptive continuum of TV series viewing. Most studies conceptualized binge-watching as a unitary construct characterized in quantitative terms (ie, considering the intensity and quantity of viewing time). However, preliminary evidence suggested that BW is a heterogeneous and multidetermined phenomenon involving different subprofiles.3,12,13 Nevertheless, few studies investigated BW from this point of view.
An important variable to consider in BW is sleep quality. Adequate duration of sleep and sleep quality are commonly associated with better health conditions and general well-being, confirming the relationship between sleep and quality of life.14,15 Sleep alterations were associated with worse psychological conditions16,17 and cognitive impairment.18 In young adults, sleep quality worsens with the increase in the use of technological devices, social media, and the phenomenon of BW.4,9,19 Several studies reported the role of screen media use in adverse sleep outcomes.20 Some authors showed that a higher binge-viewing frequency was related to poorer sleep quality and insomnia.9 People enacting BW behaviors postpone their usual bedtime in order to watch another series episode and lose from two to eight hours (ie, a full night) of sleep time. Moreover, BW appears to increase pre-sleep arousal,9 influencing sleep quality during nighttime. Watching TV series with often complex strings of actions keeps the brain busy, making it difficult to fall asleep.
Since the quality of sleep is a main dimension of the quality of life, BW may indirectly affect the quality of life due to its impact on sleep (eg, sleep quality/duration). Moreover, the frame that characterizes problematic BW (eg, mood alterations, loss of interest in work or social activities, isolation, and neglecting responsibilities) directly affects quality of life. The current study examined the relationship between binge-watching and sleep, considering the previously reported continuum adaptive-maladaptive pattern of BW3 and individuals’ activation. Moreover, the relationship with the quality of life is explored, considering a possible predictive role of BW, sleep quality, and mood activation in influencing the general quality of life.
Materials and Methods
Participants
Four-hundred eighty-two young adults participated voluntarily in the study (age range: 18–35; mean age = 21.63; dev.st= 3.20; 320 Females and 153 Males). All participants were recruited via social networks and completed an online survey.
According to self-reported TV series viewing (ie, viewers, non-viewers) and the Binge-Watching Addiction Questionnaire (BWAQ)3 results, the respondents will be classified in a BW continuum from non-TV series viewers to problematic binge-watchers.
Questionnaire
Demographic and Lifestyles Questions
A short questionnaire collected general demographic information from each respondent (eg, gender, age, educational levels, occupational and relational status) as well as self-reported indices of body condition (weight and height) and lifestyles (eg, physical activity). Moreover, some watching-related habits were requested (eg, eating habits).
Binge-Watching Behavior
The Binge-Watching Addiction Questionnaire (BWAQ)3 was adopted to assess BW behavior. Different components of the addictive nature of BW, such as Craving, Dependency, Anticipation, and Avoidance, were evaluated via 24-items on a 5-point Likert scale (ie, from 0 = never to 4 = always). In addition to the subscale scores, a global score was provided to define moderate or problematic BW behavior. A value higher than 69 indicates problematic behavior, while a value equal to or higher than 51 and lower than 69 indicates moderate BW (Forte et al, 2021). This scale was adopted to classify BW behavior in a continuum considering compulsive aspects associated with TV viewing. The BW continuum allows us to avoid a dichotomous classification delineating different ways of viewing TV and avoid over-pathologizing BW behavior.
Sleep Quality
The Pittsburgh Sleep Quality Index (PSQI)21 is a self-report measure that assesses sleep quality over the past month. The index consists of 7 component scores (sleep duration, subjective sleep quality, sleep efficiency, sleep latency, sleep disturbances, daytime dysfunction, and use of sleep medication) ranging between 0 and 3, with a higher score indicating more problems in that component. An overall sleep quality score is computed, and respondents with a score higher than 5 are categorized as poor sleepers.
Mood Scales
A Numerical Rating Scale (NRS) was adopted to evaluate mood.22 Nine questions about sensation feeling were proposed to reflect the intensity of the self-evaluation (ie, 0 = not at all to 100 = very much). The following adjectives were used: sleepy (SLE), energetic (ENE), tired (TIR), concentration (CON), calm (CAL), happy (HAP), irritable (IRR), tense (TEN), and sad (SAD). Two different scores were calculated: Affective Tone (AT = (CAL+HAP+300)-(IRR+TEN+SAD)) and Energetic Activation (EA = (ENE+CON+200)-(SLE+TIR)).22
Quality of Life
A Numerical Rating Scale (NRS) was adopted to evaluate the quality of life. Ten questions (ie, 0 = not at all to 100 = very much) about personal life satisfaction were proposed (ie, social relationships, daily activities, emotional relationships, sex life, life in general, health, external appearance, yourself, economic resources, environment). The reliability of each dimension of the scale was higher than 0.89 (Cronbach’s Alpha).
Procedure
An online survey was disseminated via main social network platforms from September to December 2019 to collect data from the general Italian population. Before starting the survey, the respondents were informed about the general aim of the study, and informed consent was requested. No personal information was collected to guarantee anonymity. After the short screening questionnaire collecting general information on gender, age, marital status, as well as on daily habits (physical activities, BW habits) and eventual medical or psychiatric diagnosis, participants completed the psychological questionnaires. All the procedures were approved by the ethical committee of the Department of Dynamic and Clinical Psychology and Health (“Sapienza” University of Rome; protocol number: 0000801) and conformed to the Helsinki Declaration.
The data supporting the findings of this study are available from the corresponding authors, upon reasonable request.
Statistical Analysis
Means and standard deviations of continuous variables and frequency and percentage of categorical variables were computed.
Analyses of Variances (ANOVAs) were performed to investigate the association between groups (Non-viewers, No-BW, Moderate BW, Problematic BW) and the investigated variables (sleep characteristics, quality of life, affective tone, and energetic activation). Moreover, regression analyses (hierarchical and logistic) were conducted to test the relationship between variables. Significance was set at p < 0.05. Bonferroni adjustments for multiple comparisons were adopted.
Results
BW Classification
Participants were classified into four groups: 1) non-TV series viewers (Non-Viewers: 78); 2) non-problematic binge-watchers (No-BW= 180); 3) moderately problematic binge-watchers (Moderate BW = 180); 4) problematic binge-watchers (Problematic BW = 44). The main characteristics of the groups are shown in Table 1.
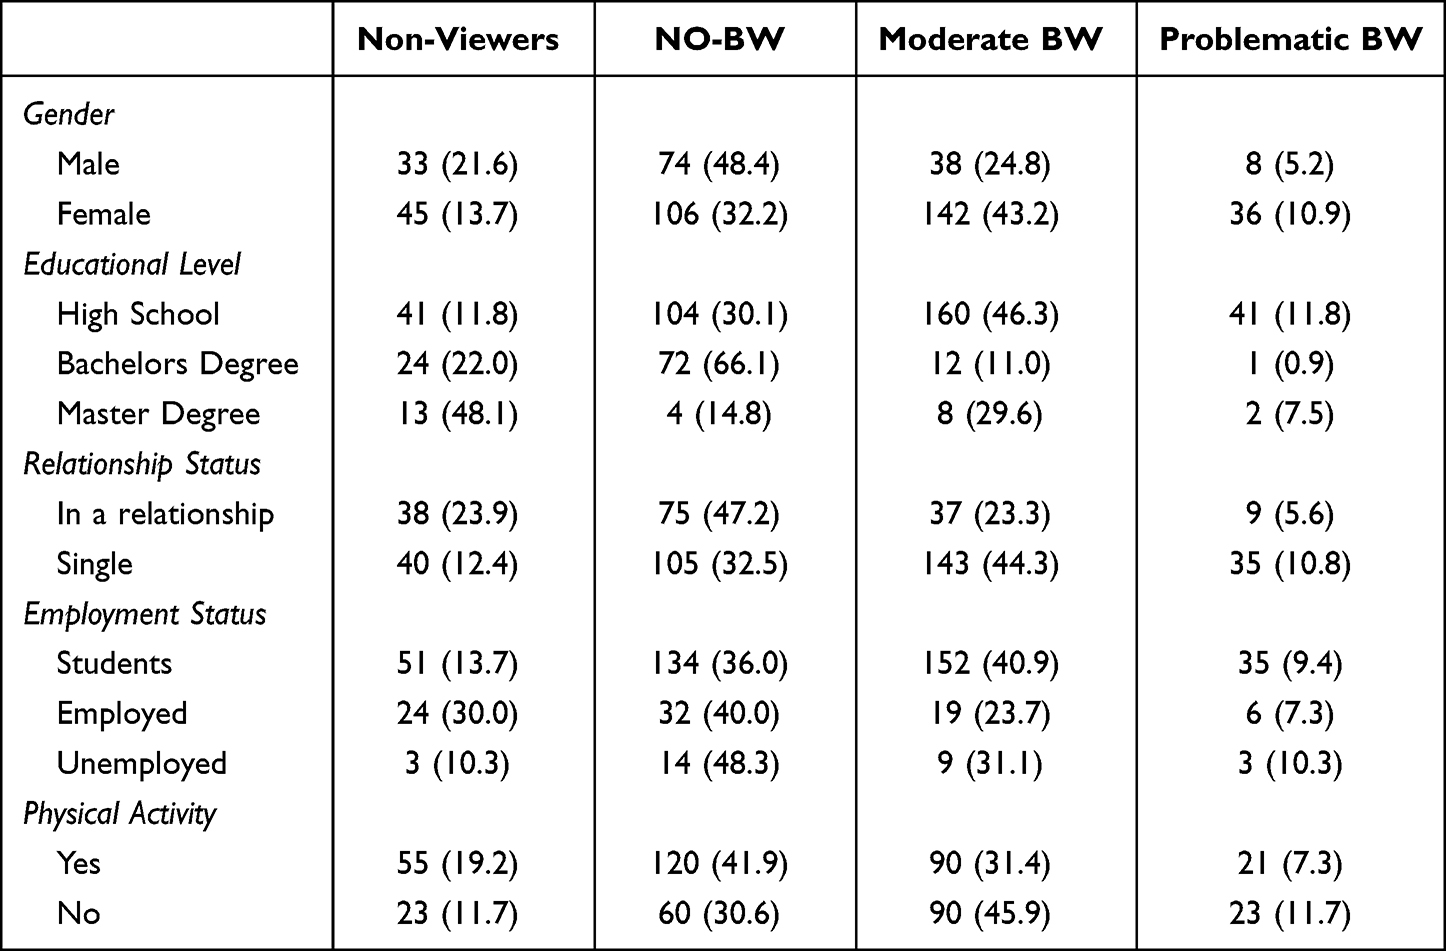 |
Table 1 Sociodemographic Characteristics of the Groups (Sample Distribution, n and %) |
General Dimensions
The ANOVA on the age reported a significant difference between the groups. The Problematic and moderate BW groups were younger than No-BW (problematic vs No-BW: mean difference = −2.87, t = −6.25, p < 0.0001; moderate vs No-BW: mean difference = −2.80; t = −9.71; p < 0.0001) and Non-viewers (problematic vs Non-viewers: mean difference = −4.27, t = −8.29, p < 0.0001; moderate vs Non-viewers: mean difference = −4.19; t = −11.33; p < 0.0001). No difference was reported between problematic and moderate BW (mean difference = −0.07; t = −0.16; p = 0.87). Finally, No-BW was younger than Non-viewers (mean difference = −1.39; t = −3.77; p < 0.0001).
No significant differences between groups emerged for BMI (F3478< 1; p = 0.62) (see Table 2).
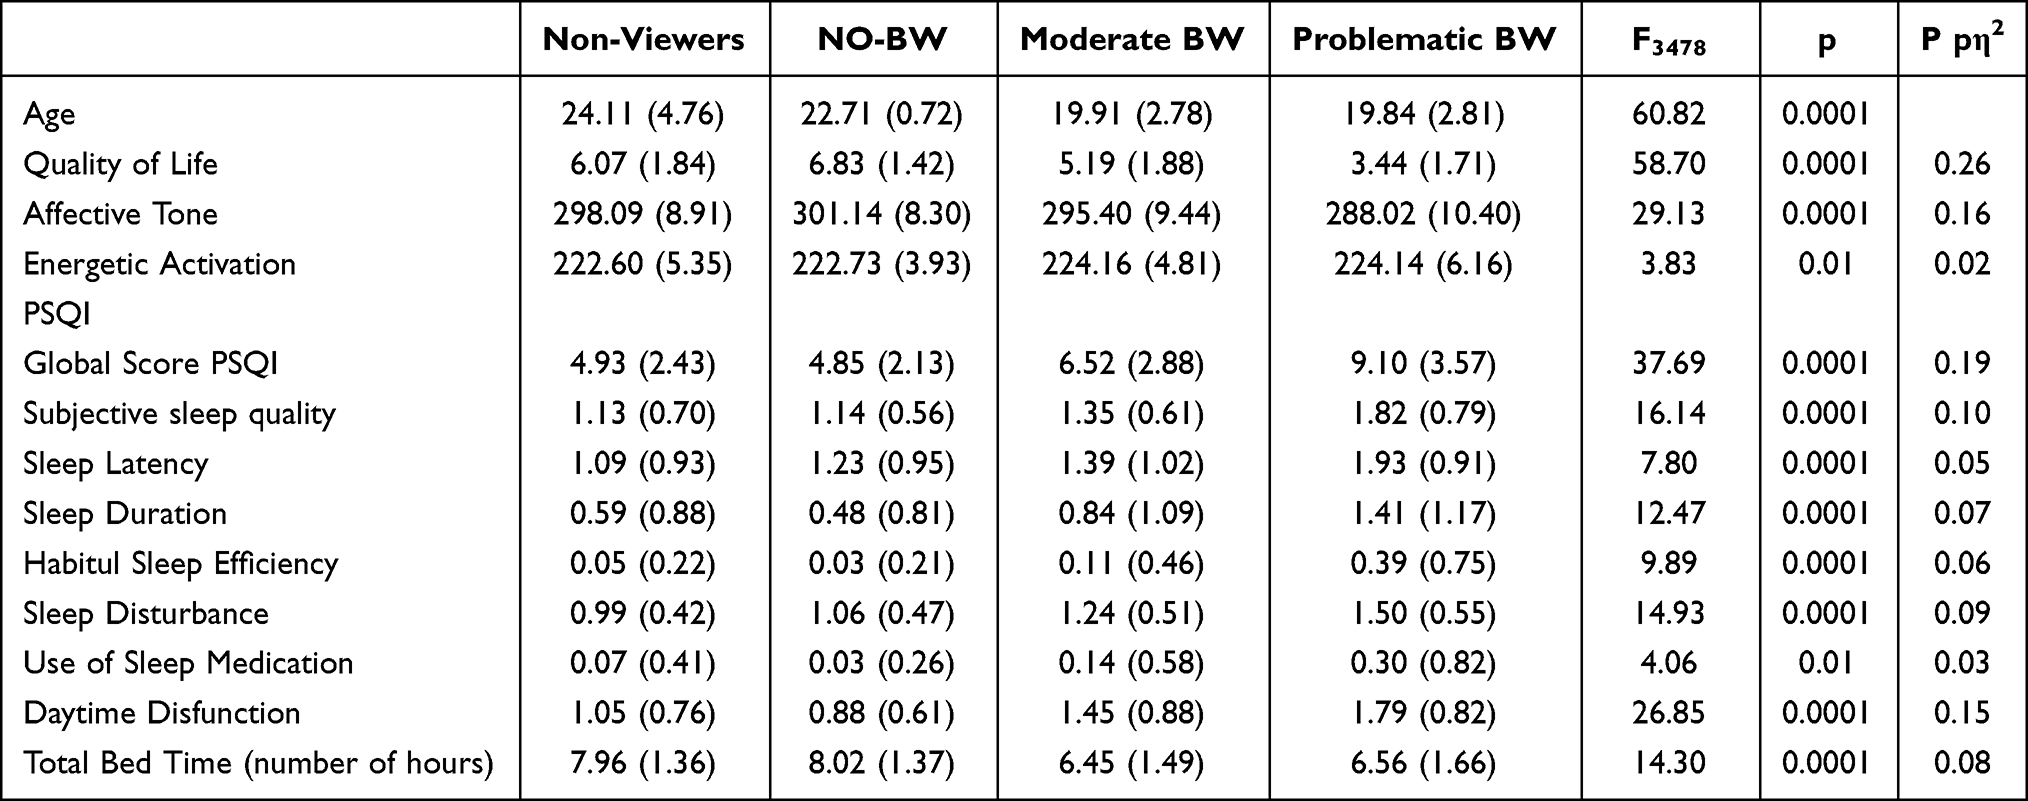 |
Table 2 Mean and Standard Deviation in Quality of Life, Activation-Deactivation Scales, and SPQI Indices by the Four Groups (Mean) |
Results on Groups Comparison (ANOVAs)
Sleep Quality
The overall Sleep Quality Index indicated poor sleep quality in Problematic BW compared to the other groups (vs Moderate BW: mean difference = 2.57 t = 5.79, p < 0.0001; vs No-BW: mean difference = 4.24, t = 9.56, p < 0.0001; vs Non-viewers: mean difference = 4.16, t = 8.30, p < 0.0001). Moderate BW showed worse sleep quality than both No-BW (mean difference = 1.67, t = 6.02) and Non-viewers (mean difference = 1.59, t = 4.58, p = 0.0001). No differences emerged between Non-BW and Non-viewers (mean difference = 0.08, t = 0.23, p = 0.81). This pattern was generally confirmed in the other indices of the PSQI (see Figure 1). The ANOVAs on the indices of the PSQI reported significant between-group differences considering all the sleep dimensions (see Table 2).
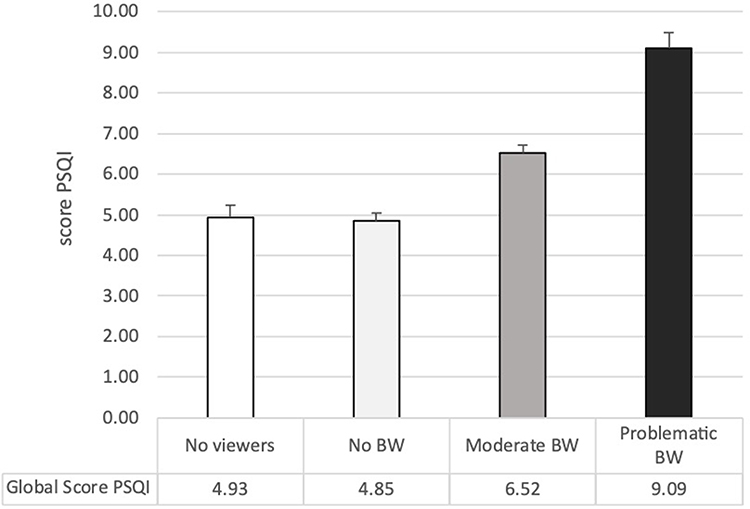 |
Figure 1 Groups’ mean and Std.Err. of the global score of PSQI. |
Considering subjective sleep quality, individuals with Problematic BW reported worse conditions compared to all the other groups (vs Moderate BW: mean difference= 0.47 t= 4.45, p< 0.0001; vs No-BW: mean difference= 0.68, t= 6.47, p< 0.0001; vs Non-viewers: mean difference= 0.68, t= 5.80, p< 0.0001), Moderate BW showed lower subjective sleep quality than both No-BW (mean difference= 0.21, t= 3.21, p= 0.001) and Non-viewers (men difference= 0.22; t= 2.56, p= 0.01) while no differences emerged between No-BW and Non-viewers (mean difference= 0.007, t= 0.08, p= 0.93). Sleep latency index was higher in Problematic BW than in the other groups (vs Moderate BW: mean difference= 0.54 t= 3.30, p= 0.001; vs No-BW: mean difference= 0.70, t= 4.26, p< 0.0001; vs Non-viewers: mean difference= 0.84, t= 4.59, p< 0.0001) indicated longer falling asleep time, Moderate BW showed higher sleep latency than Non-viewers (mean difference= 0.29, t= 2.18, p= 0.03) while they did not differ from No-BW (mean difference= 0.16, t= 1.54, p= 0.13). Also, no differences were highlighted between No-BW and Non-viewers (mean difference= 0.13, t= 1.01, p= 0.31). Sleep duration score, indicating less time of sleep, was higher in Problematic BW compared to all the other groups (vs Moderate BW: mean difference= 0.56, t= 3.47, p< 0.0001; vs No-BW: mean difference= 0.92, t= 5.69, p< 0.0001; vs No-view: mean difference= 0.82, t= 4.46, p< 0.0001), moderate BW showed higher sleep duration than No-BW (mean difference= 0.36, t= 3.54, p< 0.001) but not than Non-viewers (mean difference= 0.25, t= 1.91, p= 0.06), and no difference emerged between Non-viewers and No-BW (mean difference= 0.11, t= 0.82, p= 0.41). The Sleep efficiency index was higher, indicating reduced sleep efficiency, in Problematic BW than in the other groups (vs Moderate BW: mean difference= 0.28, t= 4.16, p< 0.0001; vs No-BW: mean difference= 0.35, t= 5.33, p< 0.0001; vs Non-viewers: mean difference= 0.33, t= 4.47, p< 0.0001). However, individuals with Moderate BW did not differ from both Non-viewers (mean difference= 0.06, t= 1.09, p= 0.28) and No-BW (mean difference= 0.08, t= 1.87, p= 0.06), and no differences emerged between Non-viewers and No-BW (mean difference= 0.02, t= 0.36, p= 0.72). Sleep disorders were more frequent in Problematic BW than in the other groups (vs Moderate BW: mean difference= 0.25, t= 3.12, p= 0.002; vs No-BW: mean difference= 0.44, t= 5.43, p< 0.0001; vs Non-viewers: mean difference= 0.51, t= 5.57, p< 0.0001). Furthermore, Moderate BW showed higher sleep disorders than both No-BW (mean difference= 0.19, t= 3.68, p< 0.0001) and Non-viewers (mean difference= 0.26, t= 3.87, p= 0.0001). No differences were highlighted between Non-viewers and No-BW (mean difference= −0.07, t= −1.03, p= 0.30). Participants with Problematic BW used Sleep medications more than No-BW (mean difference= 0.26, t= 3.19, p= 0.001) and Non-viewers (mean difference= 0.23, t= 2.48, p= 0.01). However, Problematic BW did not differ from Moderated BW (mean difference= 0.15, t= 1.84, p= 0.07). Moreover, Moderate BW showed higher use of sleep medication compared to No-BW (mean difference= 0.11, t= 2.16, p= 0.03), but they did not differ from Non-viewers (mean difference= 0.07, t= 1.18, p= 0.24). No differences emerged between No-viewers and No-BW (mean difference= 0.03, t= 0.49, p= 0.63). Considering daytime dysfunction, Problematic BW showed higher scores than the other groups (vs Moderate BW: mean difference= 0.34 t= 2.68, p< 0.01; vs No-BW: mean difference= 0.91, t= 7.13, p< 0.0001; vs Non-viewers: mean difference= 0.74, t= 5.12, p< 0.0001), Moderate BW showed higher daytime dysfunctions than Non-viewers (mean difference= 0.40, t= 3.80, p= 0.0001) and No-BW (mean difference= 0.57, t= 7.09, p< 0.0001). No difference emerged between Non-viewers and No-BW (mean difference= 0.17, t= 1.67, p= 0.10). Figure 2 shows the differences between the groups considering all the sleep indices of PSQI. Table 3 reports the distribution of total sleep disturbance in the groups.
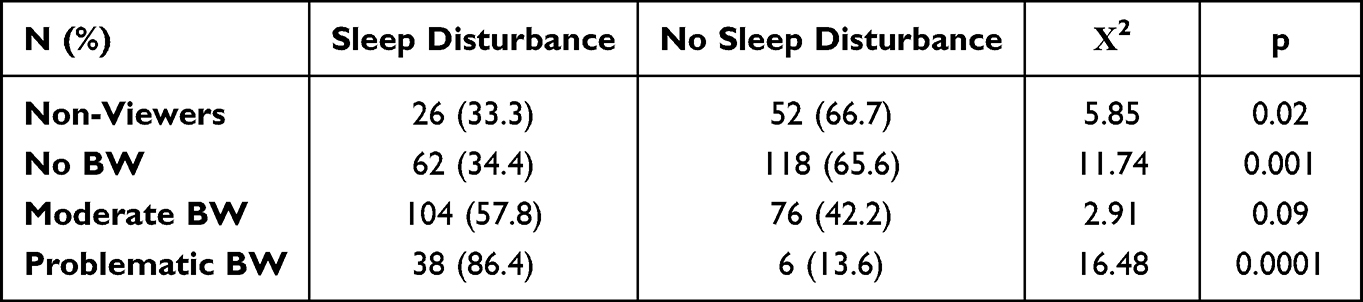 |
Table 3 Contingency Table of Distribution of Sleep Disorders (Over the Threshold of 5 in SPQI) Among the Groups |
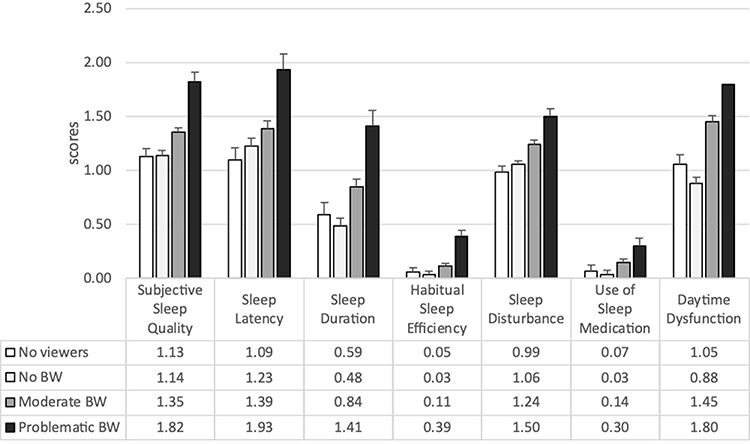 |
Figure 2 Groups’ mean and Std.Err. of the PSQI indices. |
Mental Health Dimensions
Quality of Life
The ANOVA on the quality of life showed significant differences between the groups. Specifically, Problematic BW reported lower quality of life compared to all the other groups (vs Moderate BW: mean difference = −1.75, t = −6.15, p < 0.0001; vs No-BW: mean difference = −3.39, t = −11.87, p < 0.0001; vs No-viewers: mean difference = −2.63, t = −8–23, p < 0.0001). Moreover, Moderate BW reported lower quality of life than both No-BW (mean difference: −1.63, t = −9.13, p < 0.0001) and No-viewers (mean difference = −0.87, t = −3.81, p < 0.0001). Finally, No-BW reported better quality of Life than No-viewers (mean difference = 0.75, t = 3.28; p = 0.006) (See Table 2 and Figure 3).
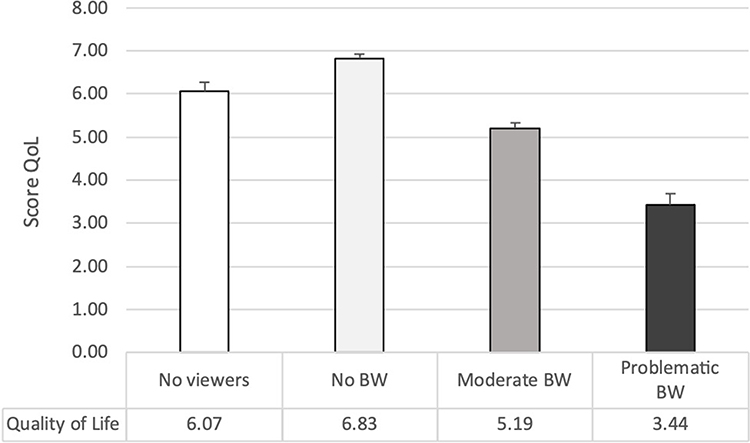 |
Figure 3 Groups’ mean and Std.Err. of the Quality-of-Life index. |
Mood
The ANOVAs on Affective Tone and Energetic Activation reported significant between-groups differences (see Table 2). Considering Affective Tone, Problematic BW reported lower score compared to all the other groups (vs Moderate BW: mean difference = −7.38, t = −4.85, p < 0.0001; vs No-BW: mean difference = −13.12, t = −8.63, p < 0.0001; vs No-viewers: mean difference = −10.07, t = −5.91, p < 0.0001). Moreover, Moderate BW reported lower score than No-BW (mean difference = −2.69, t = −6.02, p < 0.0001) and No-Viewers (mean difference = −2.69, t = −2.20, p = 0.03); finally, No-viewers showed lower Affective Tone than No-BW (mean difference = −3.05, t = −2.49, p = 0.02). Considering Energetic Activation, only Moderate BW differed from No-BW (mean difference = 1.43, t = 2.87, p = 0.004) and No-viewers (mean difference = 1.56, t = 2.42, p = 0.02), reporting higher activation. No other significant differences emerged between the groups considering Energetic Activation (see Figure 4).
 |
Figure 4 Groups’ mean and Std.Err. of the indices of Affective Tone and Energetic Activation. |
Regression Analysis
The multiple regression analysis (F = 58.56; p < 0.0001; R2 = 0.54, Adjusted R2 = 0.53), after the adjustment for some demographic characteristics (gender, age, marital status, BMI), indicated that quality of life was significantly associated with BWAQ score (β = - 0.34, p < 0.001), global PSQI score (β = - 0.18, p < 0.001), affective tone (β = 0.37, p < 0.001) and energetic activation (β = 0.19, p < 0.001).
Discussion
The current study underlined a relationship between sleep pattern, quality of life, and BW behavior. Problematic binge-watchers showed poor sleep, a higher frequency of sleep disorders, and lower quality of life than individuals who reported moderate or no BW habits. Moderate binge-watchers presented worse quality of life and poor sleep quality than both individuals who adopted BW as a leisure activity without reporting critical issues and participants who did not approach TV series. Moreover, as reported by regression analysis, BW habits, sleep quality, energetic activation, and affective tone represent predictors of quality of life and satisfaction.
Previous studies indicated BW as a compulsive behavior associated with negative consequences on individuals’ quality of life, habits, and general well-being. These aspects affect social relationships and psychological dimensions.3,4,7,23 For these reasons, some authors highlighted the pathological feature of BW, comparing this pattern to other maladaptive habits and suggesting including it in the pool of behavioral addictions.4 In a recent systematic review, Flayelle et al attempted to explain the positive relationship between negative affect and problematic binge-watching, considering this behavior a dysfunctional emotion-focused coping strategy. The authors adopted the Interaction of Person-Affect-Cognition-Execution (I-PACE) model24,25 to describe the processes involved in developing and maintaining the problematic viewing pattern. The authors considered relevant for the triggering and the chronicity of BW the predisposing variables representing core characteristics of the person, the cognitive and affective responses to external or internal stimuli, and the executive functioning (eg, inhibitory control, decision-making). In line with these assumptions, our study focused on underlining some aspects of problematic BW and furnishing the other side pictures resulting from BW as a leisure activity associated with positive well-being.4
We adopted a questionnaire able to differentiate the BW continuum from adaptive to problematic activity. On the one hand, the results underline that problematic BW was associated with lower quality of life considering different life dimensions (ie, social and emotional relationships, daily activities, sexual activity, health, economic and environmental resources). On the other hand, BW as a leisure activity makes people more satisfied than non-viewers. These findings support previous evidence of positive features associated with the BW phenomenon.26 In particular, watching tv series would satisfy the need for entertainment, increase distraction capacity, and promote cognitive reserve and social exchanges.27
One of the main objectives of the study was to investigate the association between BW and sleep quality. Although some studies focused on the effect of television viewing on sleep quality,9 no previous studies explicitly analyzed the association between the BW continuum and sleep quality. Sleep quality is typically impaired in behavioral addictions (eg, internet addiction, smartphone addiction, gambling).28,29 Sleep disorders have a bidirectional relationship with addiction due to the brain hyperactivation associated with addiction, craving, and withdrawal processes. However, the reasons and processes by which quality and quantity alterations of sleep occur in individuals with behavioral addictions are not yet well understood. Previous evidence highlighted that sleep disturbances occur associated with the abuse of technologies.30 According to these assumptions, we confirmed an alteration of sleep habits in individuals who adopted problematic BW. Particularly, different impaired sleep characteristics (ie, subjective sleep quality, sleep latency, sleep duration, habitual sleep efficiency, sleep disturbances, use of sleep medication, and daytime dysfunctions) emerged. Furthermore, a higher prevalence of sleep disturbance in problematic BW emerged, with values over the pathological cut-off. While watching as a leisure activity was associated with good sleep quality. These results confirmed the findings of Exelmans and Van Den Bulck, who reported a 98% chance of presenting poor sleep quality in binge-watchers, further suggesting as the severity of the pattern influences the negative outcome of sleep. The prevalence of sleep disorders in non-problematic and adaptive BW and non-viewers of TV series is significantly lower and with a similar distribution. Several explanations may justify these results: (1) the continuous viewing of TV series may increase cognitive pre-sleep arousal; this could be due to high cognitive involvement in the plot aspects of the series9,31 that would provoke the maintenance of a high activation because of the fantasizing on the storyline evolution. (2) Another explanation could be the general increase in physiological arousal due to exposure to highly engaging multimedia content (colors, lights, and sounds), replicating the results of the studies on the use of devices, such as smartphones and PC, before sleep.32 (3) The repeated viewing of TV series until late at night could lead to continuous episodes of falling asleep and awakenings, exacerbating the alternating wakefulness-sleep pattern that physiologically characterizes the sleep onset process; this pattern could lighten sleep and worsen sleep quality. (4) It could be ascribable to the reward systems processes, although it would be necessary to investigate these aspects further. Lower sleep quality was previously reported in association with alteration in reward system activity during receipt of reward.33 However, the direction of this association should be further investigated, especially considering other behavioral addictions. Regarding results on individuals who adopt BW as a leisure activity, the pleasurable behavior could restore physiological homeostasis, relaxing the person and accompanying a more pleasant and lasting sleep. Further studies should include an analysis of habits in the moments before falling asleep to understand whether the role of BW is associated with other maladaptive habits that can influence sleep quality (eg, eating behavior, gaming, etc.). (5) Finally, poor sleep could depend on the association between problematic BW and worse mental health conditions (Favieri et al, submitted); in fact, a strong association between poor health psychological conditions and poor sleep quality is well known.34,35
Finally, the most interesting insight is the overall frame emerging by the regression model. It allows us to suggest an association between BW negative effects and other indirect outcomes associated with problematic BW (ie, sleep problems, mood inflection, hyperarousal) as predictors of the general quality of life. Quality of life is a complex collection of interacting objective and subjective dimensions. Habits affect life negatively and positively, and binge-watching influence individuals accordingly. However, as this study highlights, BW per se is not a unique predictor of the quality of life, but compulsive adoption of this behavior is harmful, representing a risk factor for mental health with adverse consequences, especially in younger people. This evidence would suggest both a direct and indirect effect of BW on the quality of life and general well-being, which should be further investigated through more complex path models.
In sum, this study confirms our hypothesis about different patterns of BW distributed in a continuum (see graphical abstract). In fact, BW is characterized by two diverse patterns. One can be defined as a pleasure activity that does not negatively affect other life aspects but can improve them; the other is a maladaptive activity with typical characteristics of behavioral addictions.
This is the first study to have tested the continuum hypothesis of binge-watching behavior and mental health with a particular interest in sleep quality, mood, and quality of life, and one of the first that examined problematic binge-watching in the context of Italy. Although a valid and reliable scale was adopted to measure binge-watching, this study has several limitations. First, the cross-sectional study design could not establish causal inference. Second, the participants were recruited online, generating a selection bias. This bias can be suggested by the general low sleep quality in the overall sample ascribable to a target population probably characterized by high use of electronic devices or online services. For these reasons, the study sample might not be representative of the entire population. Another limit could be the adoption of a self-report assessment of sleep quality, which did not allow detection of the physiological alteration generated by the reduction of sleep quality. Also, the adoption of a not validated measure of the quality of life could represent a limit in this study, as well as the absence of some variables that can influence the relationship (eg, distress, quality of life). Although some confounding variables were controlled, the respondents’ physical and mental health status was not examined representing another limit in the generalization of the results. This aspect may have influenced the participants’ responses, so the results should be interpreted cautiously.
Conclusion
Despite some limitations, our study underlines that problematic binge-watching was positively associated with poor sleep and lower quality of life. These results can be a good starting point to outline binge-watching characteristics, which need to be better detected and characterized by low clarity regarding its definition and measurement. Surely, more evidence is needed to improve the understanding of binge-watchers and related aspects. For example, furnishing an “identikit” of the binge-watcher would be interesting. The analysis of visions styles, preferences, and habits linked to BW experience may provide more insight about the continuum of leisure-problematic habit. However, the strongest aspect of this study is having found that BW can be considered a continuum rather than an “all or nothing” behavior.
Disclosure
The authors report no conflicts of interest in this work.
References
1. Damratoski KJ, Field AR, Mizell KN, Budden MC. An investigation into alternative television viewership habits of college students. J Appl Bus Res. 2011;27(1). doi:10.19030/jabr.v27i1.911
2. Billieux J, Schimmenti A, Khazaal Y, Maurage P, Heeren A. Are we overpathologizing everyday life? A tenable blueprint for behavioral addiction research. J Behav Addict. 2015;4(3):119–123. doi:10.1556/2006.4.2015.009
3. Forte G, Favieri F, Tedeschi D, Casagrande M. Binge-watching: development and validation of the binge-watching addiction questionnaire. Behav Sci. 2021;11(2):27. doi:10.3390/bs11020027
4. Flayelle M, Maurage P, Di Lorenzo KR, Vögele C, Gainsbury SM, Billieux J. Binge-watching: what do we know so far? A first systematic review of the evidence. Curr Addict Repo. 2020;7(1):44–60. doi:10.1007/s40429-020-00299-8
5. Panda S, Pandey SC. Binge watching and college students: motivations and outcomes. Young Consu. 2017;18(4):425–438. doi:10.1108/YC-07-2017-00707
6. Walton-Pattison E, Dombrowski SU, Presseau J. “Just one more episode”: frequency and theoretical correlates of television binge watching. J Health Psychol. 2018;23(1):17–24. doi:10.1177/1359105316643379
7. Flayelle M, Maurage P, Vögele C, Karila L, Billieux J. Time for a plot twist: beyond confirmatory approaches to binge-watching research. Psychol Pop Media Cult. 2019;8(3):308. doi:10.1037/ppm0000187
8. Starosta JA, Izydorczyk B. Understanding the phenomenon of binge-watching—A systematic review. Int J Environ Res Public Health. 2020;17(12):4469. doi:10.3390/ijerph17124469
9. Exelmans L, Van den Bulck J. Binge viewing, sleep, and the role of pre-sleep arousal. J Clin Sleep Med. 2017;13(8):1001–1008. doi:10.5664/jcsm.6704
10. Hernández Pérez JF, Díaz MÁ M, Nuevos modelos de consumo audiovisual: los efectos del binge-watching sobre los jóvenes universitarios [New patterns of audiovisual consumption: the effects of binge-watching on young college students]. adComunica. 2017;13:201–221. doi:10.6035/2174-0992.2017.13.11
11. Vaterlaus JM, Spruance LA, Frantz K, Kruger JS. College student television binge watching: conceptualization, gratifications, and perceived consequences. Soc Sci J. 2019;56(4):470–479. doi:10.1016/j.soscij.2018.10.004
12. Flayelle M, Maurage P, Billieux J. Toward a qualitative understanding of binge-watching behaviors: a focus group approach. J Behav Addict. 2017;6(4):457–471. doi:10.1556/2006.6.2017.060
13. Shim H, Kim KJ. An exploration of the motivations for binge-watching and the role of individual differences. Comput Human Behav. 2018;82:94–100. doi:10.1016/j.chb.2017.12.032
14. Strine TW, Chapman DP. Associations of frequent sleep insufficiency with health-related quality of life and health behaviors. Sleep Med. 2005;6(1):23–27. doi:10.1016/j.sleep.2004.06.003
15. Kido K, Hatakeyama S, Imai A, et al. Sleep disturbance has a higher impact on general and mental quality of life reduction than Nocturia: results from the community health survey in Japan. Eur Urol Focus. 2019;5(6):1120–1126. doi:10.1016/j.euf.2018.04.017
16. Tsuno N, Besset A, Ritchie K. Sleep and depression. J Clin Psychiatry. 2005;66(10):1254–1269. doi:10.4088/JCP.v66n1008
17. Fang F, Ran S, Fang Z, Song P, Wang H. Improved flame resistance and thermo-mechanical properties of epoxy resin nanocomposites from functionalized graphene oxide via self-assembly in water. Compos Part B. 2019;165:406–416. doi:10.1016/j.compositesb.2019.01.086
18. Pini L, Wennberg A, Mitolo M, et al. Quality of sleep predicts increased frontoparietal network connectivity in patients with mild cognitive impairment. Neurobiol Aging. 2020;95:205–213. doi:10.1016/j.neurobiolaging.2020.07.026
19. Levenson JC, Shensa A, Sidani JE, Colditz JB, Primack BA. Social media use before bed and sleep disturbance among young adults in the United States: a nationally representative study. Sleep. 2017;40(9). doi:10.1093/sleep/zsx113
20. Amez S, Vujić S, Soffers P, Baert S. Yawning while scrolling? Examining gender differences in the association between smartphone use and sleep quality. J Sleep Res. 2020;29(6):e12971. doi:10.1111/jsr.12971
21. Curcio G, Tempesta D, Scarlata S, et al. Validity of the Italian version of the Pittsburgh Sleep Quality Index (PSQI). Neurol Sci. 2013;34(4):511–519. doi:10.1007/s10072-012-1085-y
22. Maccari L, Martella D, Marotta A, et al. Effects of sleep loss on emotion recognition: a dissociation between face and word stimuli. Exp Brain Res. 2014;232(10):3147–3157. doi:10.1007/s00221-014-3995-9
23. Sun -J-J, Chang Y-J. Associations of problematic binge-watching with depression, social interaction anxiety, and loneliness. Int J Environ Res Public Health. 2021;18(3):1168. doi:10.3390/ijerph18031168
24. Brand M, Laier C, Young KS. Internet addiction: coping styles, expectancies, and treatment implications. Front Psychol. 2014;5:1256. doi:10.3389/fpsyg.2014.01256
25. Brand M, Wegmann E, Stark R, et al. The Interaction of Person-Affect-Cognition-Execution (I-PACE) model for addictive behaviors: update, generalization to addictive behaviors beyond internet-use disorders, and specification of the process character of addictive behaviors. Neurosci Biobehav Rev. 2019;104:1–10. doi:10.1016/j.neubiorev.2019.06.032
26. Granow VC, Reinecke L, Ziegele M. Binge-watching and psychological well-being: media use between lack of control and perceived autonomy. Commun Res Rep. 2018;35(5):392–401. doi:10.1080/08824096.2018.1525347
27. Brajša-žganec A, Merkaš M, Šverko I. Quality of life and leisure activities: how do leisure activities contribute to subjective well-being? Soc Indic Res. 2011;102(1):81–91. doi:10.1007/s11205-010-9724-2
28. Kumar VA, Chandrasekaran V, Brahadeeswari H. Prevalence of smartphone addiction and its effects on sleep quality: a cross-sectional study among medical students. Ind Psychiatry J. 2019;28(1):82. doi:10.4103/ipj.ipj_56_19
29. Parhami I, Siani A, Rosenthal RJ, Fong TW. Pathological gambling, problem gambling and sleep complaints: an analysis of the National Comorbidity Survey: replication (NCS-R). J Gamb Stud. 2013;29(2):241–253. doi:10.1007/s10899-012-9299-8
30. Shochat T. Sleep patterns and daytime sleep-related behaviors in male and female Arab and Jewish adolescents in Israel. Sleep Biol Rhythms. 2013;11(2):82–89. doi:10.1111/sbr.12008
31. Rubenking B, Bracken CC. Binge-watching: a suspenseful, emotional, habit. Commun Res Rep. 2018;35(5):381–391. doi:10.1080/08824096.2018.1525346
32. Schneider L. Neurobiology and neuroprotective benefits of sleep. CONTINUUM. 2020;26(4):848–870.
33. Wieman ST, Hall KAA, MacDonald HZ, et al. Relationships among sleep disturbance, reward system functioning, anhedonia, and depressive symptoms. Behav Ther. 2022;53(1):105–118. doi:10.1016/j.beth.2021.06.006
34. Corbo I, Forte G, Favieri F, Casagrande M. Poor sleep quality in aging: the association with mental health. Int J Environ Res Public Health. 2023;20(3):1661. doi:10.3390/ijerph20031661
35. Casagrande M, Forte G, Tambelli R, Favieri F. The coronavirus pandemic: a possible model of the direct and indirect impact of the pandemic on sleep quality in Italians. Nat Sci Sleep. 2021;13:191–199. doi:10.2147/NSS.S285854
 © 2023 The Author(s). This work is published and licensed by Dove Medical Press Limited. The
full terms of this license are available at https://www.dovepress.com/terms
and incorporate the Creative Commons Attribution
- Non Commercial (unported, 3.0) License.
By accessing the work you hereby accept the Terms. Non-commercial uses of the work are permitted
without any further permission from Dove Medical Press Limited, provided the work is properly
attributed. For permission for commercial use of this work, please see paragraphs 4.2 and 5 of our Terms.
© 2023 The Author(s). This work is published and licensed by Dove Medical Press Limited. The
full terms of this license are available at https://www.dovepress.com/terms
and incorporate the Creative Commons Attribution
- Non Commercial (unported, 3.0) License.
By accessing the work you hereby accept the Terms. Non-commercial uses of the work are permitted
without any further permission from Dove Medical Press Limited, provided the work is properly
attributed. For permission for commercial use of this work, please see paragraphs 4.2 and 5 of our Terms.
Recommended articles
Impact of Sleep and Psychological Well-Being on the Academic and Clinical Performance of Nursing Students in Saudi Arabia
Benjamin LS, Pasay-an E, Pangket P, Alqarni AS, Gonzales F, Sacgaca L, Mahmoud DA, Mohsen MM, Ali Hamdi YS, Shanmugam SR
Psychology Research and Behavior Management 2024, 17:1355-1364
Published Date: 21 March 2024