Back to Journals » HIV/AIDS - Research and Palliative Care » Volume 15
Time to Viral Load Suppression and Its Predictors Among Adult Patients on Antiretro Viral Therapy in Nigist Eleni Mohammed Memorial Comprehensive Specialized Hospital, Hossana, Southern Ethiopia
Authors Erjino E, Abera E ![]() , Lemma Tirore L
, Lemma Tirore L ![]()
Received 3 March 2023
Accepted for publication 16 April 2023
Published 20 April 2023 Volume 2023:15 Pages 157—171
DOI https://doi.org/10.2147/HIV.S408565
Checked for plagiarism Yes
Review by Single anonymous peer review
Peer reviewer comments 2
Editor who approved publication: Prof. Dr. Olubunmi Akindele Ogunrin
Eshetu Erjino, Ermias Abera, Lire Lemma Tirore
Department of Public Health, College of Medicine and Health Sciences, Wachemo University, Hossana, Sothern Ethiopia
Correspondence: Lire Lemma Tirore, Email [email protected]
Background: Unsuppressed viral load count in patients on anti-retroviral therapy is linked to poorer survival and increased transmission of the virus. Despite efforts made in Ethiopia, the viral load suppression rate is still low.
Objective: To estimate time to viral load suppression and predictors of viral load suppression among adults on anti-retroviral therapy in Nigist Elen Mohamed Memorial Comprehensive Specialized Hospital, 2022.
Materials and Methods: A retrospective follow-up study was conducted among 297 adults on anti-retroviral therapy from January 1, 2016, to December 31, 2021. A simple random sampling technique was used to select study participants. The data were analyzed using STATA 14. Cox regression model was used. The adjusted hazard ratio with 95% CI was estimated.
Results: A total of 296 records of patients on anti-retroviral therapy were included in this study. The incidence of viral load suppression was 9.68 per 100-person months. The median time for viral load suppression was 9 months. Patients with baseline CD4 ≥ 200 cell/mm3 (AHR: 1.87; 95% CI = 1.34, 2.63), who had no opportunistic infections (AHR = 1.84; 95% CI = 1.34, 2.52), who were on WHO clinical stage-I or II (AHR = 2.12; 95% CI = 1.18, 3.79) and who have taken tuberculosis preventive therapy (AHR = 2.24; 95% CI = 1.66, 3.02) had higher hazards of viral load suppression.
Conclusion: The median time for viral load suppression was 9 months. Patients who had no opportunistic infection, with higher CD4 count, on WHO clinical stage-I or II, who have taken tuberculosis preventive therapy had higher hazards of viral load suppression. Careful monitoring and counseling of patients with CD4 levels lower than 200 cells/mm3 are necessary. Careful monitoring and counseling of patients in advanced WHO clinical stages, with lower CD4 count levels and with opportunistic infections is crucial. Strengthening the provision of tuberculosis preventive therapy is warranted.
Keywords: anti-retroviral therapy, viral load suppression, predictor
Introduction
The disease known as AIDS targets the human immune system, harming or impairing its ability to operate. By sharing contaminated sharp items, transfusions of contaminated blood, sexual activity, and vertical transmission from mother to child, the virus can be spread from one person to another.1
Around 37.7 million PLWHA were living in the world by the end of 2020. Of these, 36 million were adults.2 Anti-retroviral therapy (ART) was advised by the World Health Organization (WHO) as a means of treating the sickness. The three ART medications Dolutegravir (DTG), Nevirapine, and Efavirenz are utilized in combination in Ethiopia.3
In 2020, over 26 million PLHIV were receiving ART, and 66% of people worldwide had viral suppression.4
In East and southern Africa 16 million people receiving ART.4
Since the beginning of the epidemic, 36.3 million individuals have died from AIDS-related illnesses, and 680,000 died in the year 2020.4 Sub-Saharan Africa (SSA) accounts for 75% of AIDS-related deaths despite having just 12% of the world’s population, with ten countries including Ethiopia representing 80% of those deaths.5 Additionally, higher rates of death (26%) have been recorded in SSA, particularly in Ethiopia, particularly in the first year of ART treatment.6 Eleven thousand (11,000) died in Ethiopia in the year 2020.4
WHO recommended the regular measurements of viral load (VL); which is defined as the number of copies of HIV RNA in a milliliter of blood7 as the gold standard to monitor the patient’s responses to ART.8 WHO recommended VL monitoring regularly; the first VL test six months and twelve months after ART begins and annual testing thereafter.9
Viral load suppression was defined as VL of less than 1000 copies/mL after at least six months of first-line ART treatment.7 According to the Centers for Disease Control and Prevention (CDC), when the VL is considered “durably undetectable” and remains undetectable for at least six months after the first undetectable result, an HIV-positive patient is considered virally suppressed and at “effectively no risk” of transmission to an HIV-negative person.10 The degree of VL reduction after starting ART provides prognostic information on the likelihood of disease progression.11
Unsuppressed VL count (>1000 copies/mL) in patients on ART occurs when ART treatment fails to suppress a person’s VL and is linked to poorer survival and increased HIV transmission. It suggests that the virus is resistant to the current antiretroviral treatment. As a result, patients with an unsuppressed VL count had a higher risk of morbidity and mortality.12
However, the proportion of first-line regimen failure and the demand for second-line ART is growing rapidly. According to a mathematical model developed in SSA 2.9–15.6% required second-line ART in 2020 and 6.6–19.6% of PLHIVA will require second-line ART in 2030.13
The Joint United Nations Programme on HIV/AIDS (UNAIDS) had set “90-90-90” target to achieve by 2020.2 However, this target was not achieved in 2020,14 the lowest achievement rates were in low- and middle-income countries.15 By the end of 2020, 66% were virally suppressed,14 and in Ethiopia, 72% were virally suppressed.16 A systematic review done in Ethiopia also showed that 15.9% of PLHIV had experienced first-line regimen failure and required to switch to second-line therapy.17 Poverty, other global pandemics such as COVID-19, and inequalities within countries were some of the challenges that prevented the UNAIDS target of 2020 from being met. As a result, the 2021 Political Declaration on AIDS includes bold new global commitments and targets for 2025 that are ambitious but attainable if countries and communities follow the UNAIDS Strategy’s evidence-based guidance. The third Sustainable Development Goal (SDG-3) is also aims to end the epidemic of HIV/AIDS by 2030.18
Ethiopia began implementing a test and treats all policy in 2017 in testing and preventing target populations to increase HIV prevention, monitoring, and response by continuing to scale up HIV treatment. Despite this, persons with severe HIV disease continue to present themselves to health-care facilities.19
Different studies have identified the following factors of time to VL suppression: baseline VL, baseline CD4 count, exposure to preventative interventions such as cotrimoxazole preventive therapy (CPT) and isoniazid preventive therapy (IPT), and adherence to ART medicines;20 marital status and baseline CD4.21
A better understanding of the time to viral load suppression and context-specific predictors allows us to craft more appropriate interventions, thus improving health outcomes.
However, little is known about the time to viral suppression and its predictors after ART initiation in the study area. Moreover, studies showed variations and inconsistencies in time to viral load suppression. It was 50 days in the study done in New York;22 180 days in the study done at Arbaminch General Hospital and 181 days in the study done in the East Shewa zone.7,20,21 The predictors of time to viral suppression have not yet been well understood in resource-limited settings like Ethiopia including the study area. Therefore, this study aimed to estimate the time to viral suppression and predictors of VL suppression among adult HIV-positive patients on ART in NEMMCSH, Southern Ethiopia.
Materials and Methods
The study was conducted at Nigist Elen Mohamed Memorial Comprehensive Specialized Hospital, which is located in Hosanna town. Hosanna town is 232 Kilometer West of Addis Ababa, the capital city of Ethiopia. The hospital started delivering ART services in 2006 both for children and adults. Currently, there are 1439 HIV-positive children and adults enrolled in anti-retroviral therapy. Of these, 1326 were adults. The study was conducted from January 1, 2016, to December 31, 2021, and the data extraction period was from May 01 to June 30, 2022.
An institution-based retrospective cohort study was conducted. The Source population were all HIV-positives enrolled on ART at NEMMCSH from January 1, 2016, to December 31, 2021. The study population were all selected HIV-positive enrolled on ART from January 1, 201,6 to December 31, 2021.
All adult HIV patients enrolled on ART at NEMMCSH from January 1, 2016 to December 31, 2021, and with viral load test results which was taken after six months of enrolment were included. Clients enrolled on ART from January 1, 20, 16 to December 31, 2021, but had no VL test result until June 30, 2022 were excluded. Transfer-in patients without baseline information were excluded.
Sample Size Determination
The sample size for the first objective was calculated using the Schoenfeld formula from a recent retrospective cohort study in Arbaminch general hospital.20
The sample size was determined using Stata software Version 15. A hazard ratio of covariates was predetermined to obtain the maximum sample size. A hazard ratio of 0.683 for baseline CD4 count when other covariates held constant was found to be a covariate of interest that maximized the sample size. Other parameters were standard deviation (1.005), probability of success observed (0.809), 1% margin of error, and 80% power. The total sample size required was 297 with the number of events required to be observed in the study, E = 211.


Where,
E=number of required events
n=sample size
HR is the hazard ratio of selected covariates= HR=0.68320
P1 is proportion of subjects under exposure group=53.9%=0.53920

 Is the probability of an event from the previous study=80.9%=0.80920


Sampling Procedures
A simple random sampling technique was used for the selection of participants. Initially, HIV patients’ follow-up charts (viral load registration book) were revised. Then, those who fulfilled the inclusion criteria from January 1, 2016, to December 31, 2021, were listed. Finally, after recording all eligible clients by their unique ART numbers, records were selected randomly using computer-generated random numbers (Figure 1). Unfortunately, one of the randomly selected observation was incomplete for almost all independent variables and was excluded from the analysis. Finally, 296 observations were included in the analysis.
 |
Figure 1 Diagrammatic presentation of the sampling procedures. |
Study Variables
Dependent Variable
Viral load suppression.
Independent Variables
- Socio-demographic factors: Age, sex, marital status, educational status, occupation, religion, residence.
- Behavioral factors: Disclosure status, cigarette smoking, chat chewing, and alcohol drinking.
- Clinical factors: Baseline CD4 count, baseline viral load, WHO clinical stage, baseline weight, BMI, baseline hemoglobin level, functional status, baseline TB status, baseline opportunistic infections.
- Treatment-related characteristics: CPT, TPT, FPT, nutritional supplements, additional medications, initial ART regimen, and ART adherence level.
Operational Definitions and Term Definitions
Event: Viral load suppression.
Censored: ART patients who either died before VL test status, transferred out before VL test status, lost from follow-up before VL test status, and failed to suppress until the end of follow-up.
Time to viral load suppression: It is the time from initiation of ART to the first of at least one viral load measurement below 1000 copies/mL. It was calculated from the first date of ART initiation to the first viral load suppression.
Transfer in: If a diagnosis was made outside NEMMCSH.
Transfer out: Moving by taking the full medical record from NEMMCSH to other health institutions for care and treatment.
Opportunistic infections: Illnesses caused by various organisms, which usually cause disease in persons with lowered immune systems. It is classified as yes or no.
Functional Status: Focus on the patient’s abilities to perform basic activities of daily living, which include basic self-care such as feeding, toileting, cooking, shopping, bathing, and managing one’s affairs. It was classified as working/ambulatory and bedridden.
Adherence level: The percentage of ARV drugs taken was used as a criterion to classify drug adherence level (good is defined as ≥95% of doses taken as prescribed, fair is defined as 85–94% of doses taken, and poor is defined as <85% of doses taken).
Baseline CD4 counts: This is the CD4 count at the initiation of ART. It is classified as <200 cells/mm3 or ≥<200 cells/mm3.
Body mass index (BMI): is determined by dividing the weight in kilograms with height in meters squared and classified using CDC into underweight (<18.5 kg/m2), normal or healthy weight (≥18.5 kg/m2).
Viral load suppression: It is a viral load of <1000 RNA copies/mL after a first-line ART.23
HIV-positive adult: patients on ART who are older than 15 years.
WHO clinical stage: It is one of the indicators of patient status and classified as I, II, III and IV depending on some clinical parameters. In this study, we have classified as I or II and III or IV.
Incidence density of VL suppression: number of cases experienced VL suppression during follow-up period per sum of the lengths of time each study participant was observed and at risk of experiencing VL suppression.
Patient-months of observations: is the sum of the lengths of time each study participant was observed and at risk of experiencing VL suppression.
Data Collection Procedures and Measurement
Data were collected using a structured data-abstraction tool customized by the Federal Ministry of Health ARV-therapy patient-intake forms, follow-up charts, and registers.20,21 A retrospective review of routinely collected HIV information and viral load test data from January 1, 2016, to December 31, 2021, G.C. was done. The most recent laboratory results before starting ART were used as a baseline value. If there is no pretreatment laboratory test; the result obtained within one month of ART initiation was used. Data were collected by two trained data clerks.
Data Quality Management
Before data collection, one-day training was given to data collectors and supervisors on the contents of tools, the data-collection process, and the general aims of the study. Completeness, consistency, missing data, and outliers were checked.
Data Processing and Analysis
The data were checked for completeness, coded, and then entered in EpiData version 4.6, and exported to STATA 14 software™ for analysis. Descriptive statistics like frequency distribution and percentages were performed to describe the characteristics of the study participants. Time to VL suppression was determined from the date of ART initiation to the date the event occurred. Months were used as a time scale to calculate VL suppression time. The Kaplan-Meier and Log rank tests of survival estimates were used to investigate the difference in VL suppression experience among different categories of study subjects. Before running the regression model, multi-colinearity was checked. The proportional hazard assumption was checked based on the Schoenfeld residual. Model goodness of fit test was also checked by Cox Snell residual plots (cumulative hazard function). The model was adequate because the baseline distribution cumulative hazard function of residuals against Cox-Snell residuals is a straight line (45 degrees). Variables at bivariate analysis with a p-value less than 0.25 were a candidate and included in the final multivariable Cox-regression analysis to identify independent predictors of viral load suppression. Multivariable Cox analysis was done, and a hazard ratio with 95% CI and P-value was used to assess the association and statistical significance. A variable with a p-value less than 0.05 in a final model was considered a statistically significant predictor.
Results
Socio-Demographic Characteristics
The median age of respondents was 35 years (IQR: 29 years to 43.75 years) and nearly one-third (32.8%) of the study participants were in the age group of 25–34 years. More than half (51.7%) of the study participants were male and 155 (52.4%) were married. One hundred fifteen (38.9%) of the study participants completed secondary education. Concerning religious status, 114 (38.5%) of the study participants were protestant religious followers. More than two-thirds (69.3%) of the study participants were urban residents (Table 1).
 |
Table 1 Distribution of Socio-Demographic Characteristics of Patients Among Adult Patients on ART in NEMMCSH, Southern Ethiopia from January 1, 2016, to December 31, 2021 (n = 296) |
Behavioral Factors
Two hundred sixty (87.8%) of the respondents disclosed their HIV status to their family members. Less than one-third (28.4%) of the study participants were cigarette smokers, eighty-six (29.1%) were chat chewers and more than one-third (41.6%) were alcohol drinkers during initiation of ART (Table 2).
 |
Table 2 Distribution of Behavioral Factors Among Adult Patients on ART in NEMMCSH, Southern Ethiopia from January 1, 2016, to December 31, 2021 (n = 296) |
Clinical Characteristics
The median baseline CD4 count was 246 cells/mm3 (IQR: 197 to 295 cells/mm3). The media HIV viral load was 5623.5 copies/mL (IQR: 4004.25 to 7791.75 RNA copies/mL). Less than three-fourths of the study participants (72%) had a baseline CD4 count greater than or equal to 200 cells/mm3. Two hundred seventy-one (91.6%) of the study participants had a baseline viral load below 10,000 RNA copies/mL. More than three-fourths (85.8%) of the study participants were on baseline WHO clinical stages I and II. More than two-third (69.9%) of the study participants had a baseline BMI greater than or equal to 18.5 kg/m2. Three-fourths (74.7%) of them were able to work. About one-third (30.7%) were positive for TB and ninety-seven (32.8%) had a history of opportunistic infections during the initiation of ART (Table 3).
 |
Table 3 Distribution of Clinical Characteristics Among Adult Patients on ART in NEMMCSH, Southern Ethiopia from January 1, 2016, to December 31, 2021 (n = 296) |
Treatment-Related Characteristics
Nearly two-third (67.9%) of the study participants were on cotrimoxazole preventive therapy and one hundred ninety-eight (66.9%) were on tuberculosis preventive therapy but nearly one-third (33.8%) of them were on fluconazole preventive therapy. Eighty-five (28.7%) of the study participants used additional medications. About two-thirds (62.8%) of the study participants were on TDF/3TC/DTG ART treatment regimen and one hundred eighty-four (62.2%) of them had a good adherence level to the ART medications (Table 4).
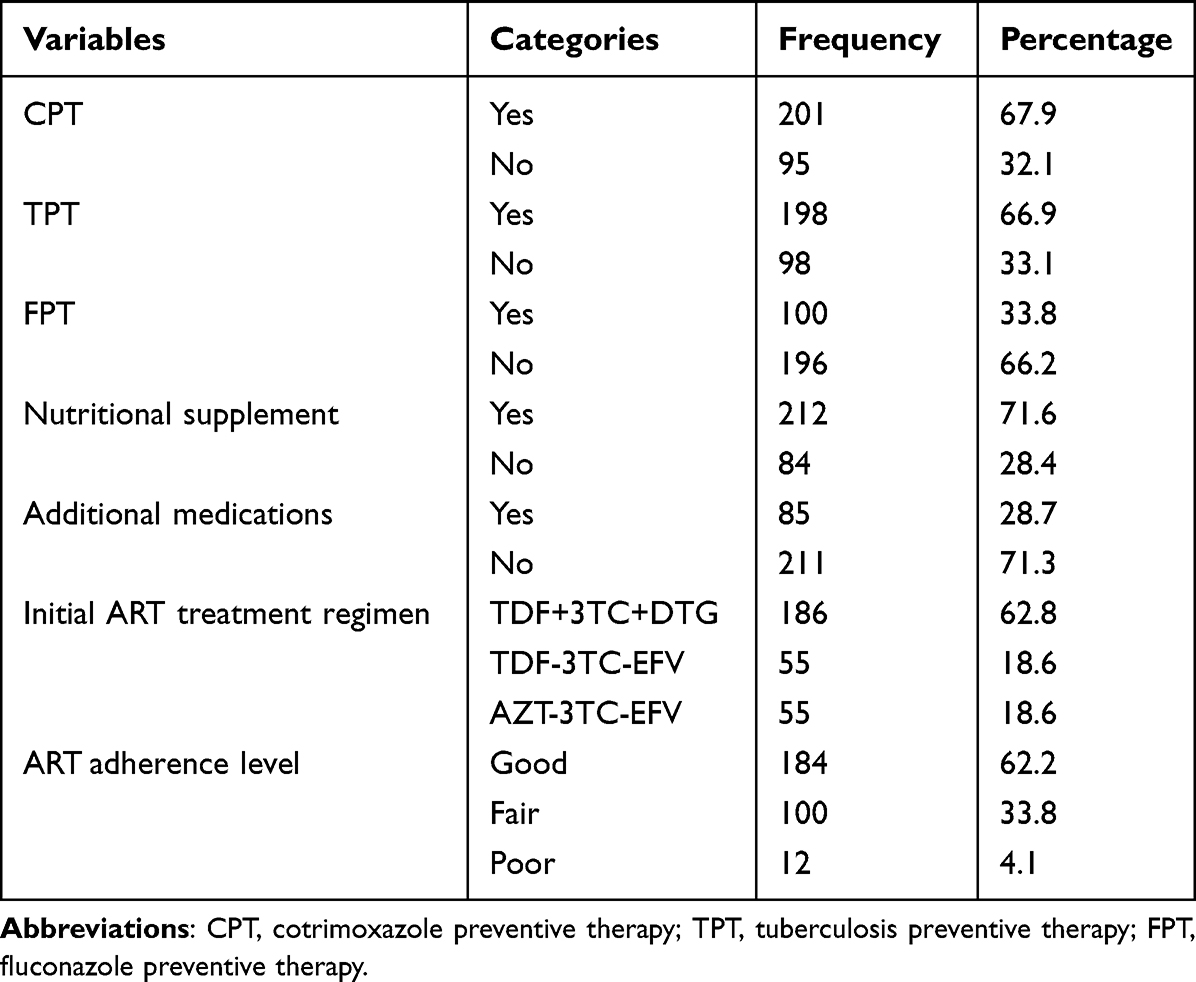 |
Table 4 Distribution of Treatment-Related Characteristics Among Adult Patients on ART in NEMMCSH, Southern Ethiopia from January 1, 2016, to December 31, 2021 (n = 296) |
Treatment Outcome
In this study, all of the 296 patients were followed for a median of 9 months (IQR: 6 to 12 months) with a total of 2633 person-months. During this period, 255 (86.1%) of the patients were virally suppressed and forty-one of the participants were censored.
The suppression probability of patients at the end of 6 months was 30%, at the end of 8 months was 18.9%, at the end of 10 months was 12.5%, at the end of 12 months was 24.3% and at the end of 13 months was 0.34%.
The overall incidence rate of viral load suppression was 9.68 per 100 person-months (95% CI = 8.56, 10.94) after ART treatment initiation.
Kaplan–Meier Estimates of Time to Viral Load Suppression
The overall median viral load suppression time of this study was 9 months (95% CI: 8.22, 9.78) (Figure 2).
 |
Figure 2 Shows overall Kaplan-Meier estimation of time to viral load suppression among adult patients on ART in NEMMCSH, Southern Ethiopia from January 1, 2016, to December 31, 2021. |
In the Kaplan-Meier there was a difference in viral load suppression on time based on differences in the category of baseline CD4 count, baseline WHO clinical stage, opportunistic infection status, and tuberculosis preventive therapy status.
The time to viral load suppression was shorter for those with a CD4 count greater than or equal to 200 cell/mm3 than those with a CD4 count <200 cell/mm3 (Figure 3).
 |
Figure 3 Kaplan-Meier survival curves comparing time to viral load suppression between patients by category of baseline CD4 count among adult patients on ART in NEMMCSH, Southern Ethiopia from January 1, 2016, to December 31, 2021. Notes: Baseline CD4 = <200 cells/mm3; Baseline CD4 >200 cells/mm3. |
Patients with WHO clinical stage-I and II had shorter viral load suppression time than patients in WHO clinical stage-III and IV (Figure 4).
 |
Figure 4 Kaplan-Meier survival curves comparing time to viral load suppression between patients by category of baseline WHO clinical staging among adult patients on ART in NEMMCSH, Southern Ethiopia from January 1, 2016 to December 31, 2021. Note: WHO clinical stages I and II. WHO clinical stages III and IV. |
Patients with baseline opportunistic infections had longer median viral load suppression time than those without opportunistic infections (Figure 5).
 |
Figure 5 Kaplan-Meier survival curves comparing time to viral load suppression between patients by category of baseline opportunistic infection status among adult patients on ART in NEMMCSH, Southern Ethiopia from January 1, 2016, to December 31, 2021. Notes: With Opportunistic infection Without Opportunistic infection. |
Patients on tuberculosis preventive therapy had a shorter time for viral load suppression than those without tuberculosis preventive therapy (Figure 6).
 |
Figure 6 Kaplan-Meier survival curves comparing time to viral load suppression by category of TPT among adult patients on ART in NEMMCSH, Southern Ethiopia from January 1, 2016 to December 31, 2021. Notes: On tuberculosis preventive therapy not on tuberculosis preventive therapy. |
Predictors of Viral Load Suppression
In bivariate analysis, variables such as age, sex, marital status, educational status, residence, cigarette smoking, chat chewing, alcohol drinking, baseline CD4 count, baseline viral load count, baseline WHO clinical staging, baseline weight, baseline body mass index, baseline hemoglobin level, functional status, baseline TB status, baseline opportunistic infections, tuberculosis preventive therapy, fluconazole preventive therapy, nutritional supplement, additional medications, initial ART regimen, ART adherence level were significant. In multivariable analysis, variables such as baseline CD4 level, baseline WHO clinical staging, baseline opportunistic infections, and tuberculosis preventive therapy were statistically significant predictors of viral load suppression.
The hazard of viral load suppression was 1.87 times higher among patients with CD4 count greater than or equal to 200 cell/mm3 than those patients with CD4 count less than 200 cell/mm3 (AHR: 1.87; 95% CI = 1.33, 2.63).
The hazard of viral load suppression was two times higher among patients who were in WHO clinical stage-I and stage II than those patients who were in WHO clinical stages III and IV (AHR = 2.12; 95% CI = 1.18, 3.79).
Patients who did not have opportunistic infections at the start of ART had 1.84 times higher hazards of viral load suppression than those patients with opportunistic infections at baseline (AHR = 1.84; 95% CI = 1.34, 2.52).
Patients who had taken tuberculosis preventive therapy had 2.24 times higher hazards of viral load suppression than those patients who had not taken tuberculosis preventive therapy (AHR = 2.24; 95% CI = 1.66, 3.02) (Table 5).
 |
Table 5 Predictors of Time to Viral Load Suppression Among Adult Patients on ART in NEMMCSH, Southern Ethiopia from January 1, 2016 to December 31, 2021 (n = 296) |
Model Diagnostics
Global Test of Proportional-Hazards Assumption
The proportional hazard assumption was satisfied based on the global test (p- value = 0.463).
Assessment of Adequacy of the Cox-Regression Model
The adequacy of a final fitted model was assessed with Cox–Snell residual. The plot of the cumulative hazard function of the Cox-Snell residuals against maximum likelihood estimation with cumulative hazard functions is presented in Figure 7. The plot shows that the cumulative hazard function of residuals against Cox-Snell residuals was approximately a straight line; hence, the model fits the data (Figure 7).
 |
Figure 7 Cox-Snell residuals plot of Cox regression. |
Discussion
The goal of the study was to estimate the time to viral load suppression among adult patients on ART. The overall incidence rate of viral load suppression was 9.68 per 100 person months (95% CI = 8.56, 10.94). This finding is lower than the incidence rate found in the study conducted in the study done in West Gojjam zone, Amhara region (11.17 per 100 person-months),24 but higher than the study conducted in Kenya (3.9 per 100 person month).11 The differences in socioeconomic status, quality of care provided, type of ART treatment regimen, ART treatment adherence level, and some co-morbidity might explain the variation in incidence rate among studies.
The median time to viral load suppression was 9 months (95% CI: 8.22, 9.78). This was longer than studies conducted in Arbaminch hospital, Southern Ethiopia (3 months);20 Oromia, Ethiopia (181 days);21 west Gojjam zone, Amhara region (5 months)24 and New York (50 days).7 This difference in might be due to the difference in the quality of care, the patients’ behavior like adherence, and clinical characteristics of the patient.
Baseline CD4 level, baseline WHO clinical staging, baseline opportunistic infections, and tuberculosis preventive therapy were statistically significant predictors of viral load suppression.
Baseline CD4 count was a significant predictor of viral load suppression. Those patients who had a CD4 count greater than or equal to 200 cells/mm3 had higher hazards of viral load suppression compared to those with a CD4 count less than 200 cells/mm3. This finding is supported by studies conducted in Southern Ethiopia; the East Shewa zone and Canada.19–21 This might be because CD4 are white blood cells that fight infection and play an important role in the immune system that hastened the suppression time.
Patients with baseline WHO clinical stage-I and II had higher hazards of viral load suppression than those patients who were in stages III and IV. This is supported by studies done in Northern Ethiopia.25 The effect of the WHO stage on viral load suppression might be because as the WHO stage goes from the stage–I to the next, the patient’s immune status may decline, which increases viral replication.
The hazard of viral load suppression was higher among patients who had no opportunistic infections at the start of ART than those patients who had opportunistic infections at baseline. This is supported by the studies conducted in South Africa and Uganda.26,27 This is because those patients who had developed opportunistic infection had low immunity. As patients’ immune status declines, the rate of viral replication increases as compared to their immune-competent counterparts.
The hazards of viral load suppression were higher among patients who have taken tuberculosis preventive therapy than those patients who have not taken tuberculosis preventive therapy. This finding was supported by a study done in southern Ethiopia, which showed that patients with IPT at a baseline have 3 times more likely to have VL suppression than those without baseline IPT.20 This might be due to the fact that early initiation of tuberculosis prophylaxis has a significant reduction in the reactivation of serious bacterial infections, which affect the human immune system. So, early initiation of tuberculosis prophylaxis prevents co-morbidity, which in turn results in substantial success in early viral load suppression.
The study comprises different years of admission/observations which may increase the number of events. Because of its retrospective nature, it was merely based on secondary data, so analysis of associated factors for viral load suppression was limited by the information that could be obtained from the patient’s records. Hence, data on some demographic characteristics (economic status) and other clinical-related factors could not be available in the record of the patient.
Conclusion
The incidence of viral load suppression was lower than the UNAIDs target of 90-90-90. The median time for viral load suppression was 9 months. The absence of opportunistic infection, high baseline CD4 count level, baseline WHO clinical stage-I & II, and patients on tuberculosis preventive therapy were significant predictors of viral load suppression. Careful monitoring and counseling of patients with lower CD4 levels especially for those with lower than 200 cells/mm3 are necessary. Careful monitoring and counseling of patients in advanced WHO clinical stages, with lower CD4 count levels and with opportunistic infections is crucial. Strengthening the provision of tuberculosis preventive therapy is warranted.
Data Sharing Statement
The datasets used and analyzed during the current study are available from the corresponding author upon reasonable request.
Ethical Considerations
Ethical clearance was obtained from the ethical review committee of Wachemo University. Study participants’ informed consent was waived by the review board as the data source of the patient’s medical record numbers was anonymously registered using codes without personal identifiers. Permission letters were obtained from the NEMMCSH administration. The study complies with the Declaration of Helsinki.
Acknowledgments
We would like to thank Wachemo University for providing this opportunity to carry out this work. We would like to extend our thanks to study participants for their willingness to participate in the study.
Author Contributions
All authors made a significant contribution to the work reported, whether that is in the conception, study design, execution, acquisition of data, analysis and interpretation, or in all these areas; took part in drafting, revising or critically reviewing the article; gave final approval of the version to be published; have agreed on the journal to which the article has been submitted; and agree to be accountable for all aspects of the work.
Disclosure
The authors report no conflicts of interest in this work.
References
1. Gallo RC, Salahuddin SZ, Popovic M, et al. Frequent detection and isolation of cytopathic retroviruses (HTLV-III) from patients with AIDS and at risk for AIDS. Science. 1984;224(4648):500–503. doi:10.1126/science.6200936
2. UNAIDS. 90-90-90 an Ambitious Treatment Target to Help End the AIDS Epidemic. Geneva, Switzerland: UNAIDS; 2017.
3. Ministry of Health E. National Consolidated Guidelines for Comprehensive HIV Prevention, Care and Treatment. Addis Ababa: MoH; 2018.
4. UNAIDS. Fact sheet - global HIV statistics; 2021. Available from: https://www.unaids.org/sites/default/files/media_asset/UNAIDS_FactSheet_en.pdf.
5. UNAIDS. UNAIDS DATA 2017. UNAIDS; 2017. Available from: https://www.unaids.org/sites/default/files/media_asset/20170720_Data_book_2017_en.pdf.
6. Stephen D, Anthony D, Xavier A, Landon M, Robin W. Early mortality among adults accessing antiretroviral treatment program in sub-Saharan Africa. NIH AIDS. 2008;22:15.
7. Pyngottu A, Scherrer AU, Kouyos R. Predictors of virological failure and time to viral suppression of first-line integrase inhibitor–based antiretroviral treatment. Clin Infect Dis. 2021;73(7):e2134–e2141. doi:10.1093/cid/ciaa1614
8. World Health Organization. WHO Consolidated Guidelines on the Use of Antiretroviral Drugs for Treating and Preventing HIV Infection. Geneva, Switzerland: World Health Organization; 2013.
9. World Health Organization. Guideline on When to Start Antiretroviral Therapy and on Pre-Exposure Prophylaxis for HIV. Geneva, Switzerland: World Health Organization Press; 2015.
10. Chakraborty H, Iyer M, Duffus WA, Samantapudi AV, Albrecht H, Weissman S. Disparities in viral load and CD4 count trends among HIV-infected adults in South Carolina. AIDS Patient Care STDS. 2015;29(1):26–32. doi:10.1089/apc.2014.0158
11. Maina E, Mureithi H, Adan A, Muriuki J, Lwembe R, Bukusi E. Incidences and factors associated with viral suppression or rebound among HIV patients on combination antiretroviral therapy from three counties in Kenya. Int J Infect Dis. 2020;97:151–158. doi:10.1016/j.ibid.2020.05.097
12. WHO. Consolidated guidelines on the use of antiretroviral drugs for treating and preventing HIV infection. In: Recommendations for a Public Health Approach. Geneva, Switzerland: WHO; 2014.
13. Mayo Clinic. Definition of HIV; 2015. Available from: http://www.mayoclinic.org/diseasesconditions/HIV-AIDS/basics/definition/con-20013732.
14. A collaboration of UNAIDS UaW. Global factsheets AIDSinfo; 2021. Available from: https://aidsinfo.unaids.org/.
15. Levi J, Alice R, Anton P, Pietro V, Philipp K, Andrew H. Can the UNAIDS 90-90-90 target be achieved? A systematic analysis of national HIV treatment cascades. BMJ Glob Health. 2016;1(2):e000010. doi:10.1136/bmjgh-2015-000010
16. UNAIDS. Country factsheets Ethiopia AIDSinfo; 2020. Available from: https://aidsinfo.unaids.org/.
17. UNAIDS. An ambitious treatment target to help end the AIDS epidemic. 2014.
18. UNAIDS. Global AIDS update; 2021. Available from: https://aidsinfo.unaids.org/.
19. Palmer A, Gabler K, Rachlis B, et al. Viral suppression and viral rebound among young adults living with HIV in Canada. Medicine. 2018;97(22):e10562. doi:10.1097/MD.0000000000010562
20. Hussein S, Mama M, Mekonnen B, et al. Predictors of time to viral load suppression of adult PLWHIV on ART in Arba Minch General Hospital: a follow-up study. Ethiop J Health Sci. 2019;29(6):751–758. doi:10.4314/ejhs.v29i6.12
21. Ali JH, Yirtaw TG. Time to viral load suppression and its associated factors in a cohort of patients taking antiretroviral treatment in East Shewa zone, Oromiya, Ethiopia, 2018. BMC Infect Dis. 2019;19:1084. doi:10.1186/s12879-019-4702-z
22. Panel on Antiretroviral Guidelines for Adults and Adolescents. Guidelines for the use of antiretroviral agents in adults and adolescents with HIV. Department of Health and Human Services. C6. Available from: https://clinicalinfo.hiv.gov/sites/default/files/guidelines/documents/AdultandAdolescentGL.pdf.
23. Ethiopia MoHo. National Guidelines for Comprehensive HIV Prevention Care and Treatment, 2019. Addis Ababa, Ethiopia: Ethiopia MoHo; 2019.
24. Atnafu GT, Moges NA, Wubie M, Gedif G. Incidence and predictors of viral load suppression after enhanced adherence counseling among HIV-positive adults in West Gojjam Zone, Amhara Region, Ethiopia. Infect Drug Resist. 2022;15:261–274. doi:10.2147/IDR.S341392
25. Desta AA, Woldearegay TW, Futwi N, et al. HIV virological non-suppression and factors associated with non-suppression among adolescents and adults on antiretroviral therapy in northern Ethiopia: a retrospective study. BMC Infect Dis. 2020;20(1):4. doi:10.1186/s12879-019-4732-6
26. Ssemwanga D, Asio J, Waters C, et al. Prevalence of viral load suppression, predictors of virological failure and patterns of HIV drug resistance after 12 and 48 months on first-line antiretroviral therapy: a national cross-sectional survey in Uganda. J Antimicrob Chemother. 2020;75:1280–1289. doi:10.1093/jac/dkz561
27. Steegen K, Bronze M, Papathanasopoulos MA, et al. HIV-1 antiretroviral drug resistance patterns in patients failing NNRTI-based treatment: results from a national survey in South Africa. J Antimicrob Chemother. 2017;72:210–219. doi:10.1093/jac/dkw358
 © 2023 The Author(s). This work is published and licensed by Dove Medical Press Limited. The
full terms of this license are available at https://www.dovepress.com/terms
and incorporate the Creative Commons Attribution
- Non Commercial (unported, 3.0) License.
By accessing the work you hereby accept the Terms. Non-commercial uses of the work are permitted
without any further permission from Dove Medical Press Limited, provided the work is properly
attributed. For permission for commercial use of this work, please see paragraphs 4.2 and 5 of our Terms.
© 2023 The Author(s). This work is published and licensed by Dove Medical Press Limited. The
full terms of this license are available at https://www.dovepress.com/terms
and incorporate the Creative Commons Attribution
- Non Commercial (unported, 3.0) License.
By accessing the work you hereby accept the Terms. Non-commercial uses of the work are permitted
without any further permission from Dove Medical Press Limited, provided the work is properly
attributed. For permission for commercial use of this work, please see paragraphs 4.2 and 5 of our Terms.
Recommended articles
Magnitude of Viral Load Suppression and Associated Factors among Clients on Antiretroviral Therapy in Public Hospitals of Hawassa City Administration, Ethiopia
Anito AA, Lenjebo TL, Woticha E, Solomon F
HIV/AIDS - Research and Palliative Care 2022, 14:529-538
Published Date: 18 November 2022