Back to Journals » HIV/AIDS - Research and Palliative Care » Volume 14
Time to Nutritional Recovery and Its Predictors Among Undernourished Adult Patients Living with Human Immune Deficiency Virus Attending Anti-Retroviral Therapy at Public Health Facilities in Southwest Ethiopia. A Multicenter Study
Authors Alemu S ![]() , Zenu S
, Zenu S ![]() , Tsegaye D
, Tsegaye D ![]()
Received 16 March 2022
Accepted for publication 8 June 2022
Published 14 June 2022 Volume 2022:14 Pages 285—296
DOI https://doi.org/10.2147/HIV.S366655
Checked for plagiarism Yes
Review by Single anonymous peer review
Peer reviewer comments 2
Editor who approved publication: Prof. Dr. Olubunmi Akindele Ogunrin
Soresa Alemu, Sabit Zenu, Dereje Tsegaye
Departments of Public Health, College of Health Science, Mettu University, Mettu, Ethiopia
Correspondence:, Soresa Alemu, Email [email protected]
Background: Infection with the human immunodeficiency virus is one of the factors that contribute to malnutrition. Several initiatives have been launched in Ethiopia to improve HIV patients’ nutritional status and achieve early recovery when malnourished patients are found. Despite these efforts, adult HIV patients’ malnutrition recovery remains poor.
Objective: The objective of this study was to assess the time to recovery from undernutrition and associated factors among adult HIV patients on ART at public health facilities in Ilu Aba Bor zone, Southwest Ethiopia, 2021.
Methods: An institution-based retrospective cohort study of 374 adult HIV patients with undernutrition receiving ART at public health institutions in Southwest Ethiopia was conducted. Data were extracted from the patient’s record and entered into Epi-Data version 3.1 before being exported to STATA version 14. The Kaplan–Meier method was used to estimate the time to recovery, and the difference in survival time between predictor variables was tested using the Log rank test. Weibull regression models, both bivariable and multivariable, were fitted. A p-value of 0.05 was declared statistically significant.
Results: The recovery rate was 67.7% and the median recovery time was 65 days (95% CI = 61.6– 68.4) and 145 days (95% CI = 130.7– 159) for MAM and SAM, respectively. Marital status (Married) (AHR = 0.61; CI = (0.43,0.86)), ART status (pre ART) AHR = 0.492; CI = (0.305,0.793), CD4 (200-350c/m3, AHR = 2.116;CI = (1.447,3.21), type of malnutrition (AHR = 0.22; CI= (0.156,0.307)), ART adherence level (AHR = 3.33, CI = (1.997,5.56)) WHO clinical staging (AHR = 0.685, CI = (0.485,0.948)), sex (male), (AHR = 0.678; CI = (0.509,0.901)) and age (35– 54), (AHR = 1.86; CI = (1.408,2.47)) were predictors of recovery time.
Conclusion: Compared to previous studies, the recovery rate was high. SAM, advanced clinical stage, sex, and marital status were all negatively associated with nutritional recovery time, whereas ART adherence, CD4 count, and age were predictors. As a result, a therapeutic feeding program should focus on factors that slow recovery time.
Keywords: time to nutritional recovery, malnutrition, adult HIV patients, Weibull regression model
Background
HIV/AIDS remains a global health concern. According to the 2020 global AIDS update, 38 million people are infected with HIV worldwide, with 25.4 million receiving treatment.1 Of the total number of patients, over 67% are found in sub-Saharan Africa.2 There are 710,000 HIV patients in Ethiopia. In Ethiopia, about 1.1% of adults aged 15 to 49 had been infected with HIV.3
The Oromia region is home to 26% of Ethiopia’s estimated HIV patients.12 The prevalence of malnutrition in adult HIV patients in Asian countries ranges from 18.3%to 59%.4,5 Malnutrition is found to be prevalent in South Africa, Uganda, and Zimbabwe at rates of 13%, 10.8%, and 10%, respectively.6–8 Ethiopia is one of the countries most affected by HIV and malnutrition. Undernutrition affects 15.15% to 42.9% of adult HIV patients in Ethiopia.9–11
Patients living with HIV (PLHIV) are more likely to become malnourished due to decreased food intake, poor nutrient absorption, increased energy needs, and changes in the way the body uses nutrients. Malnutrition contributes to immune system degeneration, making the body susceptible to recurring illness and increasing its energy and nutrient requirements, thus hastening disease progression.13 Evidence suggests that people living with HIV are at a higher risk of malnutrition, which can lead to rapid disease progression and death. It increases the risk of death in HIV-positive adults by up to twofold, especially in severely malnourished individuals.14 Undernutrition at the start of ART increases the risk of death, particularly in the first three months, and it remains the most important prognostic indicator of survival in developing countries such as Ethiopia.15,16
Several studies have identified CD4 count, WHO clinical stage, sex, age, residency, educational status, ART adherence level, ART status, months on ART, opportunistic infection, facility type, and types of malnutrition as predictors of recovery in undernourished adult HIV patients.17–20 Across studies, the average time to recover from malnutrition after food supplementation varies. According to some reviews, the average stay in Ethiopia under the therapeutic feeding program ranges between 63 and 84 days for MAM and 128–175 days for SAM.19,20
National HIV/AIDS and nutrition guidelines, training materials, and a management protocol were created. Furthermore, nutrition intervention for HIV patients in Ethiopia has been ongoing for 11 years. Despite these efforts, a recent study discovered that the rate of recovery following nutritional supplementation is unacceptably low, ranging from 24% to 62.2%.18,19,21,22 The Ethiopian Federal Ministry of Health and other stakeholders want proof of the program’s progress in order to improve national nutritional intervention guidelines and patients’ quality of life.23
Researchers in Ethiopia attempted to investigate the prevalence of undernutrition in adult HIV patients as well as treatment outcomes after food supplementation. However, the time to recovery and its associated factors received insufficient attention. Based on the best available literature search, there is only one recently published article that evaluated the time to nutritional recovery and its predictors among undernourished HIV positive adults treated with ready-to-use foods.24 As a result, the purpose of this study was to determine the time to recovery and its predictors among undernourished adult HIV patients in the Ilu Aba Bor Zone of Southwest Ethiopia.
Methods
Study Setting and Period
The study was conducted at the Ilu Aba Bor zone public health institutions. Ilu Aba Bor is one of the zones of the Oromia region located in the Southwest part of Ethiopia, at a distance of 600 Kms from Addis Ababa. Ilu Aba Bor is considered as one of the cash crop areas of Ethiopia, with an estimated population of 1,036,663. In this zone, 15 ART centers are providing treatment for HIV patients including a therapeutic feeding program. The study was conducted from June 19 –July 19, 2021.
Study Design, Population, and Sample Size
An institution-based retrospective cohort study was conducted. All randomly selected HIV-infected adult patients with moderate and severe acute malnutrition enrolled in a therapeutic feeding program from January 1, 2014 to December 31, 2019 at ART centers in the Ilu Aba Bor zone were the study population.
The required sample size was calculated using Epi Info, version 7, statistical software considering a 95% confidence interval, an 80% power, and a ratio of 1:1 exposed-to-non-exposed, and using the percentage of recovery in the non-exposed group (educated) is 61.3% from a recent study conducted at Finote Selam Hospital in Northwest Ethiopia.19 After accounting for the design effect of two and a 10% contingency for missing and incomplete data, the final sample size was calculated to be 374. The participants were selected using a multi-stage sampling technique. In the first stage, the selection of ART centers was carried out by using a simple random sampling technique. Accordingly, eight ART centers were selected from all the 15 ART centers. Following a review of HIV patients’ follow-up charts and food by prescription registration books, those who met the inclusion criteria were listed in each selected ART center. Samples were distributed proportionally to selected ART centers based on the number of malnourished adult patients seen between January 1st, 2014 and December 31st, 2019. Finally, after recording all eligible clients using their unique ART numbers, 374 participants were selected using simple random sampling (computer-generated list method by Excel) in each health facility.
Eligibility Criteria
Inclusion Criteria
All malnourished adult HIV-infected people with documented nutritional treatment outcomes were included.
Exclusion Criteria
Those patients who were edematous started a therapeutic feeding program in other ART centers (transferred in) and the first document of readmitted patients in the therapeutic feeding program were excluded.
Operational Definitions
Recovered – Participant reached a BMI of ≥18.5 kg/m2 for two consecutive visits within three or six months after starting TFP, depending on nutritional status at baseline (MAM or SAM, respectively).
Not recovered – Participant who did not reach a BMI of ≥18.5 kg/m2 for two consecutive visits within three (MAM) or six (SAM) months.
Defaulter – Client who were lost for more than three consecutive months of the visit from the nutritional care program.
Lost follows – Client who were lost for one or two months of the visit from a nutritional program
Died – Participant who died during program participation, and death was documented by clinic staff in the register book.
Transferred out – Participant transferred out of the program at the clinic where they first enrolled.
Censored – It includes all cases who failed to recover, defaulted from treatment, lost to follow-up, died or transferred out.
Data Collection Tools and Procedures
Data abstraction format was developed after reviewing different literature and national guidelines for HIV/AIDS and nutrition.17–19 Variables such as socio-demographic factors, clinical related factors, and type of malnutrition, final outcome, and starting and ending time of therapeutic feeding program were extracted from ART registration and food by prescription books. The records were reviewed for completeness prior to data collection. Following medical records and food by prescription registration books of malnourished adult HIV patients who met the inclusion criteria were reviewed retrospectively by the data collectors. The baseline diagnosis of malnutrition served as the starting point for that, all the follow-up, and the endpoint was the date of nutritional recovery or another outcome.
Height and weight, as well as BMI, were calculated by the ART Clinic focal person prior to the start of the therapeutic feeding program using standard measurements and recorded on the ART registration and food by prescription book. Those diagnosed with acute malnutrition will be admitted to a therapeutic feeding program, where patients with moderate malnutrition (BMI 16–18.49 kg/m2) will be given two sachets of ready-to-use therapeutic feeding (RUTF) every day until their BMI exceeds 18.5 kg/m2, or for three months. Those suffering from severe acute malnutrition (BMI <16 kg/m2) are given four sachets per day until they recover, or for a maximum of six months.23
Supervisors and card reviewers received two days of training on the data collection process. Before the actual data collection, the prepared checklist was pretested (5%). The supervisor and principal investigator checked the data for proper categorization and coding, completeness, and consistency on a regular basis during data collection.
Data Processing and Analysis
Before data entry, it was checked for consistency and completeness. The data were entered into Epi-Data version 3.1 and exported to STATA version 14 for analysis. The nutritional recovery time was calculated from the date of malnutrition diagnosis to the date of the event. To calculate the nutritional recovery time, days were used as a time scale. The Kaplan–Meier and log rank tests of survival estimates were employed to investigate the significance of the difference in nutritional recovery experience among different categories of study participants after diagnosis of malnutrition and TFP initiation (ie to conclude whether there was a significant difference between different survival curves). Before running the regression model, multi-collinearity was checked. The proportional hazard assumption was checked using the Schoenfeld residuals. Cox Snell residual plot (cumulative hazard function) was used for model diagnosis.
As variable selection precedes model diagnostics, all variables in the bivariate analysis at p values less than 0.25 were included in the multivariable survival model. The AIC and BIC of Cox regression and parametric regression (exponential, Weibull, and Gompertz) models were compared, and the distribution with the lowest AIC or BIC was considered the best model. The Weibull regression model was chosen to fit the data set based on AIC. The association between the independent variables and the outcome variable (time to recovery) was assessed by the Weibull regression model.
The Likelihood Ratio and the Cox-Snell residual plot were used to diagnose the model. Since the likelihood ratio test was significant (p-value 0.05), and the Weibull baseline distribution cumulative hazard function of residuals against Cox-Snell residuals is a straight line, the model was adequate (45 degrees). The hazard ratio was used as a measure of association with a 95% confidence level.
Results
Socio-Demographic Characteristics of the Study Participants
The study included records of 368 patients who had a complete record with a response rate of 98.4%. Nearly two-thirds (65.2%) of the study participants were females and more than half (51.6%) were urban residents. The ages of patients ranges from 18 to 75 years with a median age of 36 years and more than half (53.3%) of the study participants were between 35 and 54 years of age. One hundred forty-nine (40.5%) of the study participants attended primary education. Two hundred thirty-two (63.0%) of the participants were married. Nearly two-thirds (64.1%) were not employed (Table 1).
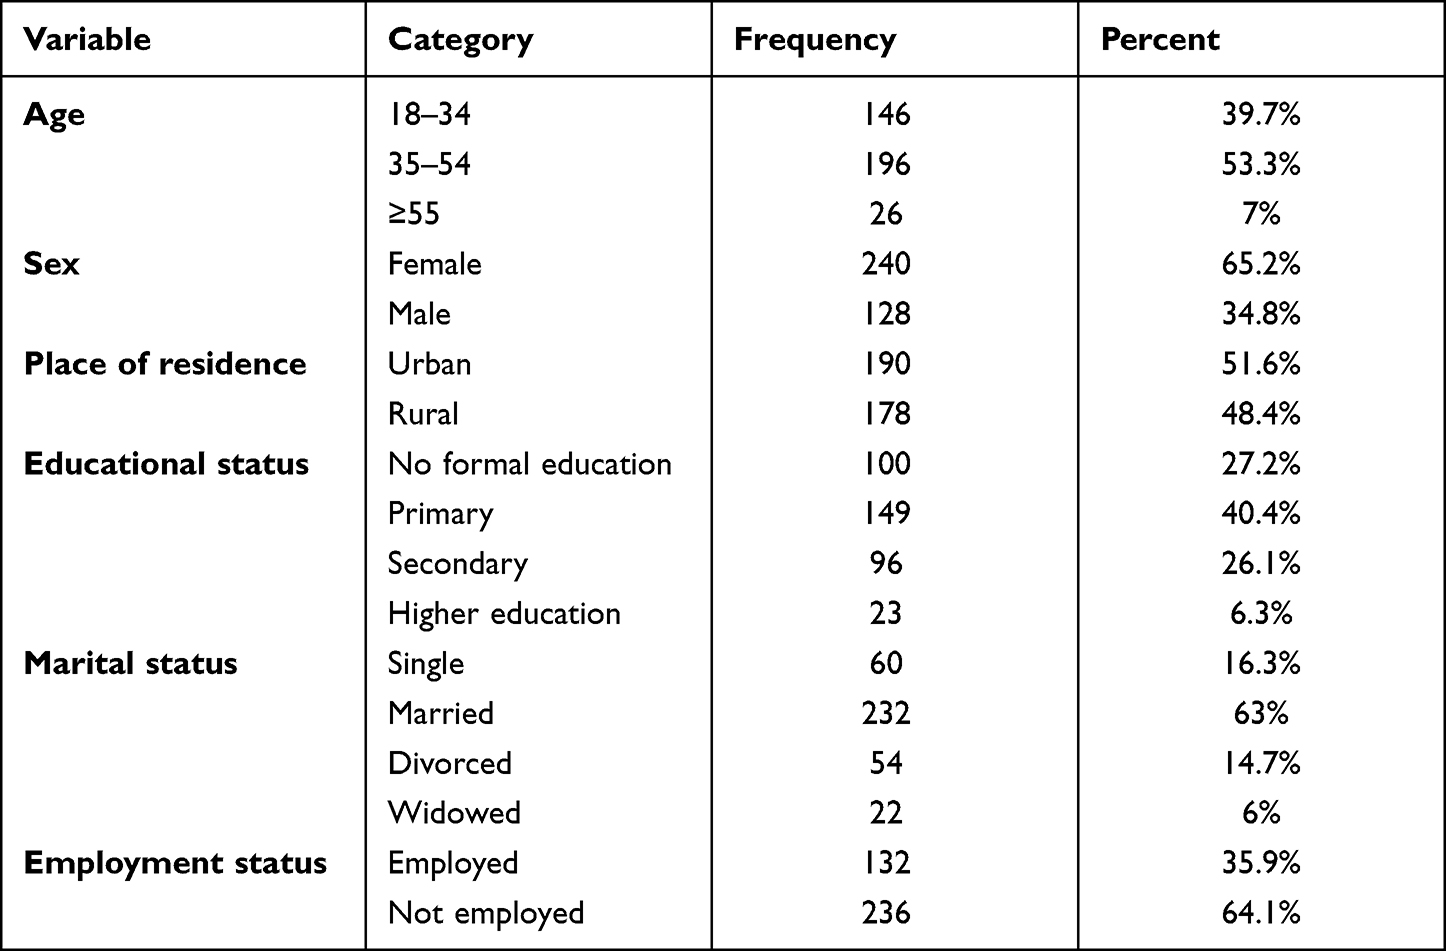 |
Table 1 Socio-Demographic Characteristics of the Participants in Ilu Aba Bor Zone ART Centers, Southwest Ethiopia, January 1, 2014 to December 31, 2019 |
Treatment Outcome
Overall, 249 (67.7%; 95% CI = 62.8, 72.6) of patients were recovered from malnutrition. Nearly a third (32.3%) where censored from which 25.8% not recovered, 18 (4.9%) defaulted, 2(0.5%) loss to follow-up and 4(1.1%) died. From patients that had follow-up in hospitals, 160 (70.7%) recovered from malnutrition, whereas 89 (69%) of patients who had follow-up in health centers were recovered. Nearly three-quarter (73%) of participants in WHO clinical staging I and II and 62% of participants in WHO clinical staging III and IV were recovered from malnutrition (Table 2).
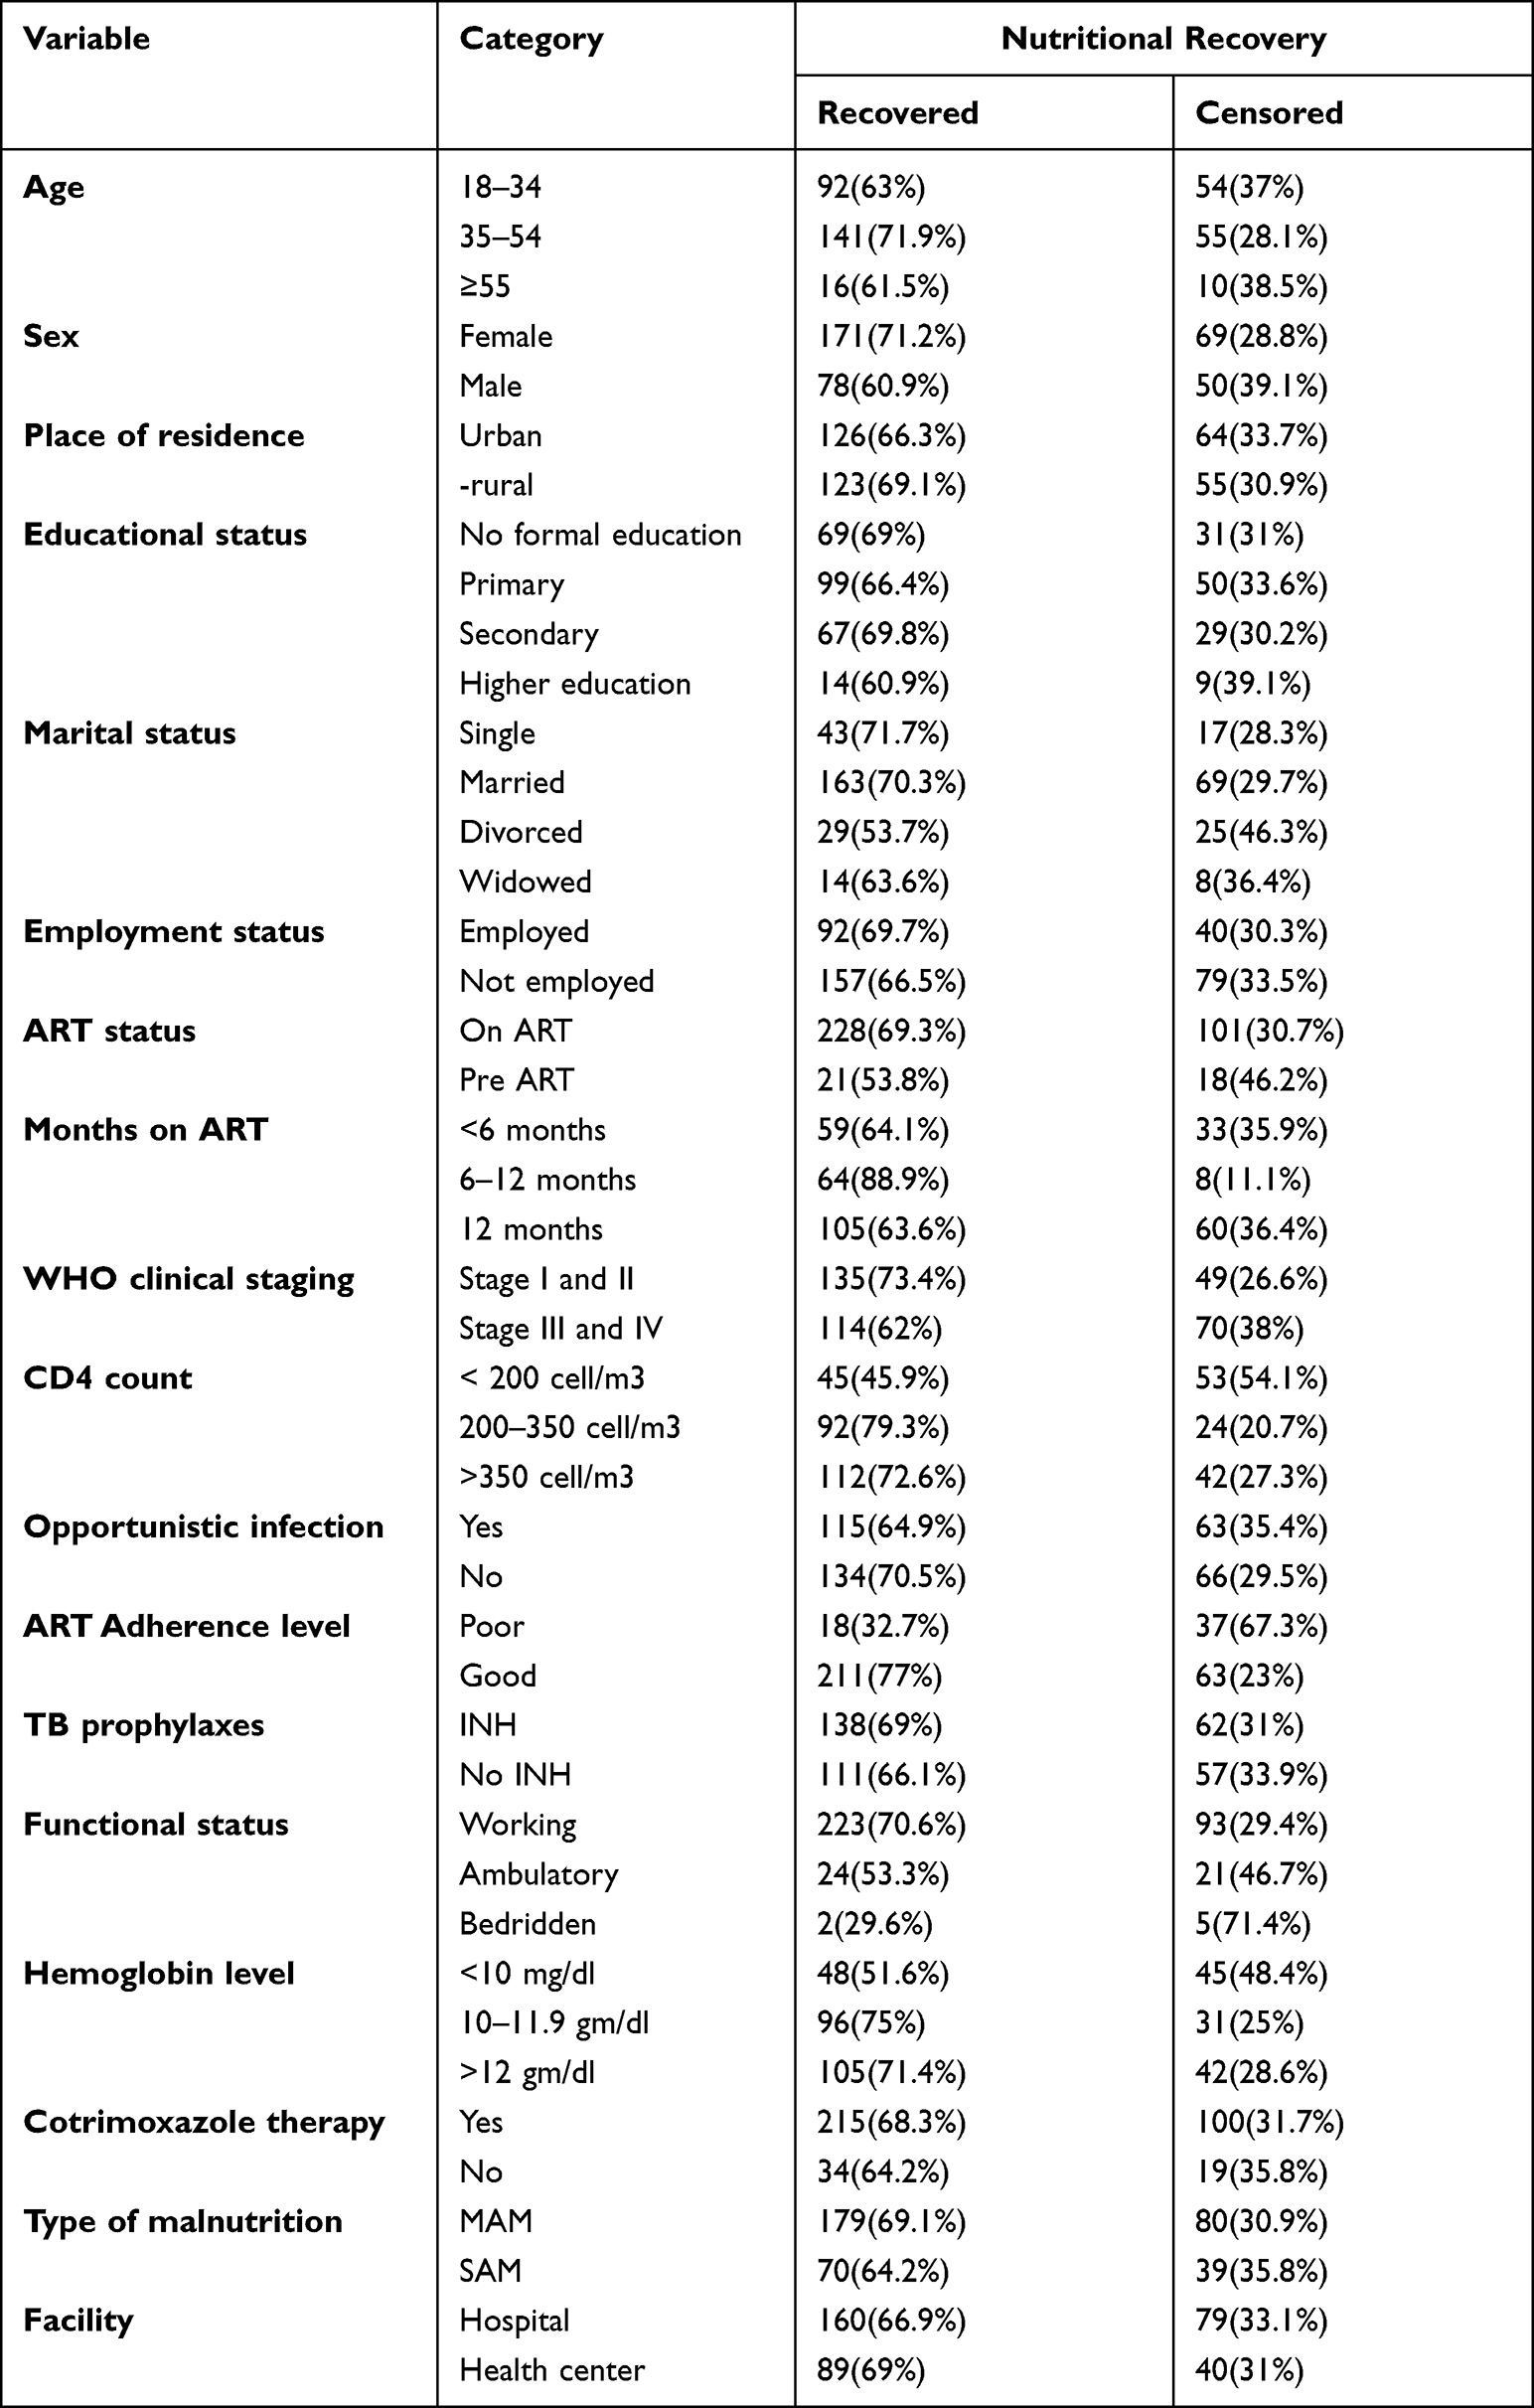 |
Table 2 Treatment Outcome of the Study Participants in Ilu Aba Bor Zone ART Centers, Southwest Ethiopia, January 1, 2014 to December 31, 2019 |
Kaplan–Meier Survival Estimates of Recovery Time from Undernutrition
The nutritional recovery rate was 7.113 per 1000 person-days (CI = 6.3, 8.1) among the entire study participants in the cohort. It was 8.821 per 1000 person-days (CI = 7.45, 10.4) for non-advanced and 5.78621 per 1000 person-days (CI = 4.82, 6.95) person-days for advanced diseases. The overall person time was 35,007 per person for the entire observation. The median nutritional recovery time of the entire cohort was 65 days (CI: 61.6–68.4) for moderate malnutrition and 145 days for severe malnutrition (CI: 130.7–159) (Figure 1).
 |
Figure 1 Shows overall Kaplan-Meier estimation of survival time to recover from under nutrition among adult HIV patients at Ilu Aba Bor from January 1, 2014, to December 31, 2019. |
Similarly, there was a substantial variation in nutritional recovery time with CD4 count. The median recovery time for MAM patients with a CD4 count of less than 200 cell/m3 was 88 days, 62 days for those with a CD4 count of 200–350 cell/m3, and 64 days for those with a CD4 count of greater than 350 cell/m3, respectively (Chi-square: 22.6, p < 0.01), while it was 185 days, 123 days, and 143 days for SAM patients with CD4 counts of less than 200, 200–350 cell/m (Figure 2).
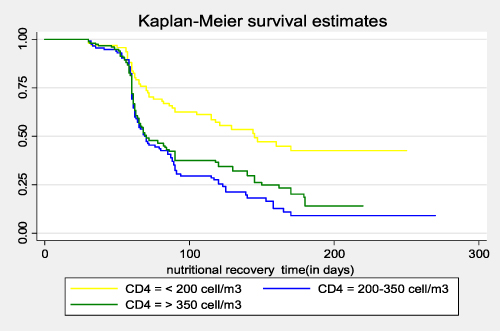 |
Figure 2 Kaplan-Meier survival curves comparing recovery time between patients by category of CD4 count at Ilu Aba Bor ART centers from January 1, 2014, to December 31, 2019. |
The WHO clinical staging had a significant impact on the median nutritional recovery time. Patients with WHO clinical stage I and II with MAM had a median recovery time of 62 days, while patients on stage III and IV had a median recovery time of 70 days. Furthermore, SAM patients with WHO clinical stage I and II had a recovery time of 121 days and patients with stage III and IV had a recovery time of 170 days (Chi-square: 7.67, p = 0.006) (Figure 3) (Table 3).
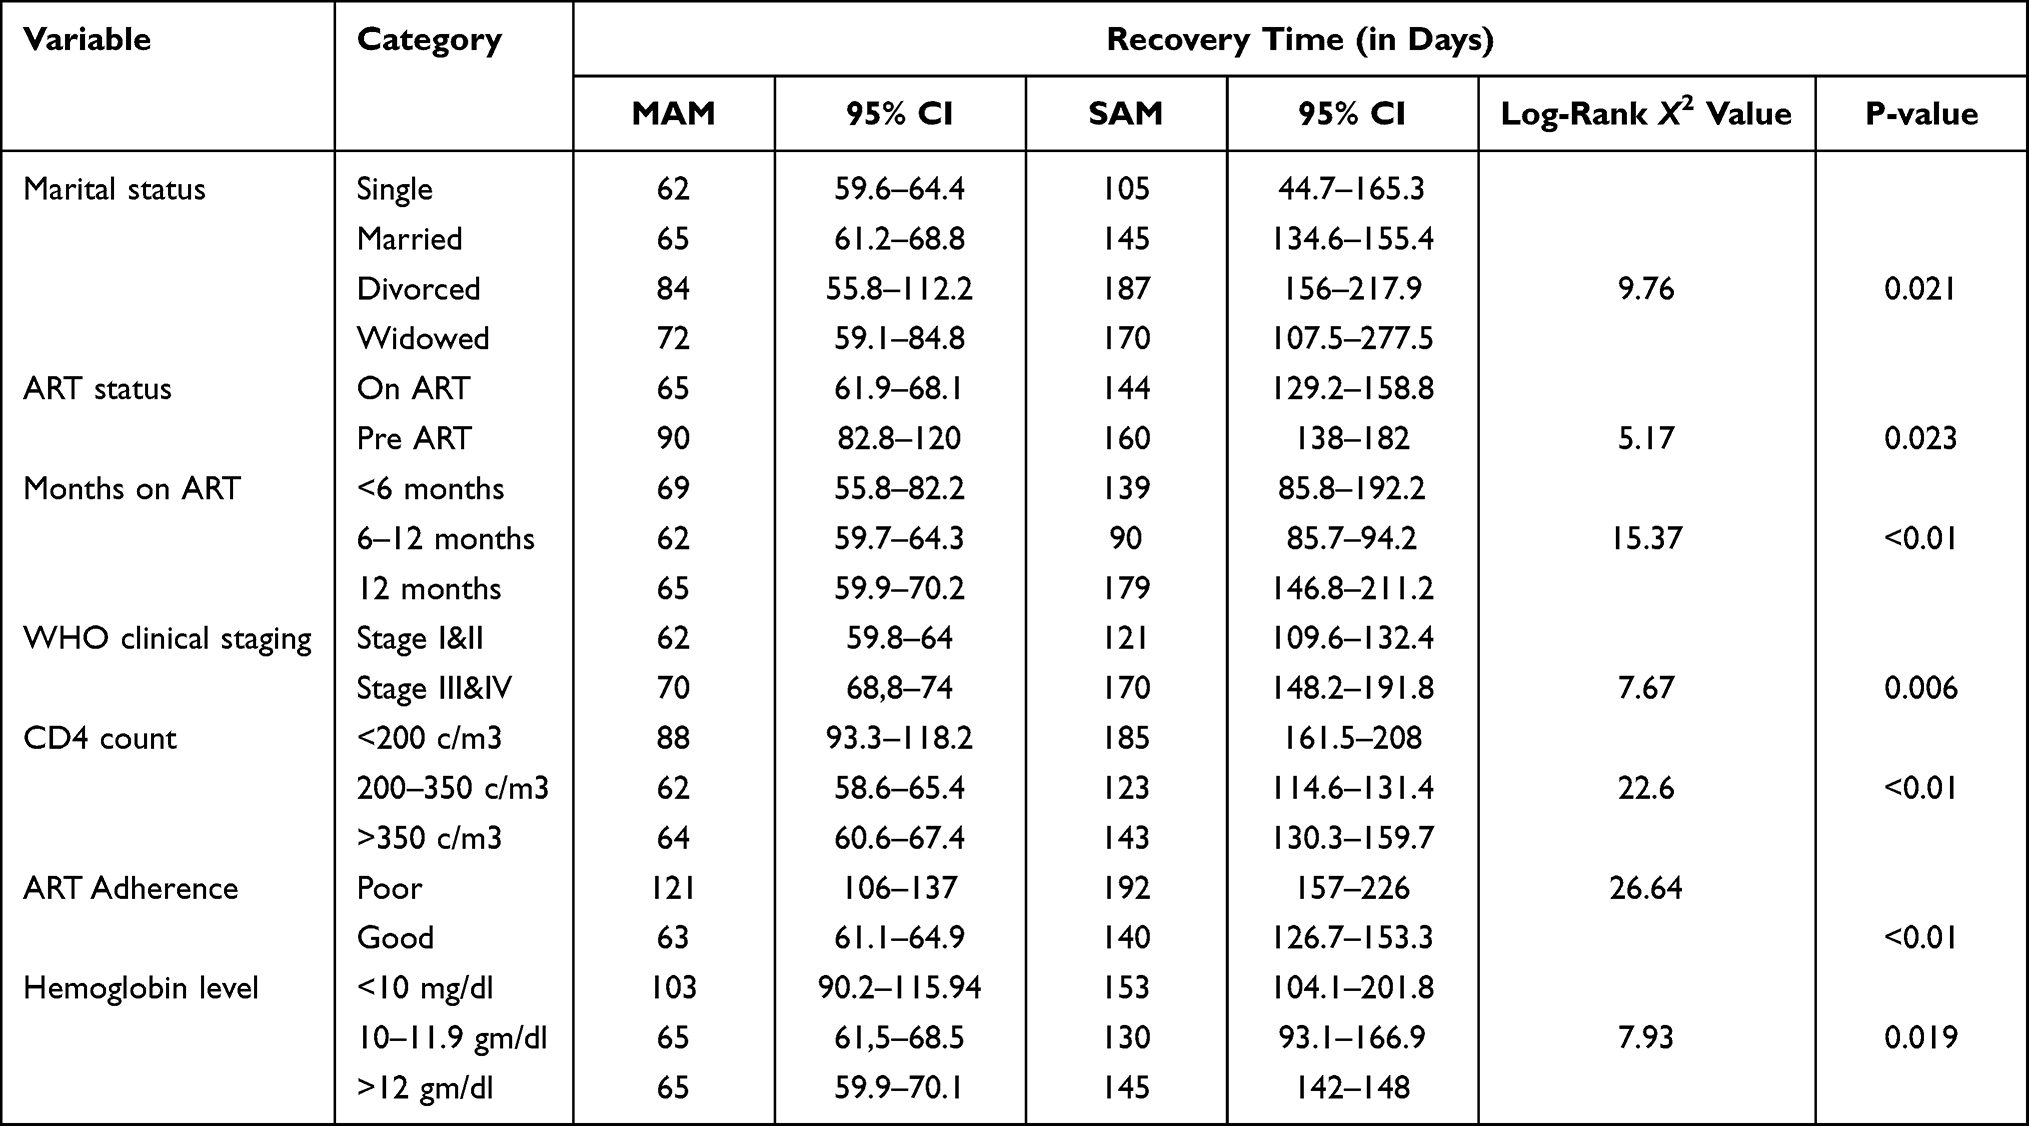 |
Table 3 Kaplan-–Meier Survival Estimates of Recovery Time for Severe and Moderate Acute Malnutrition Among Adult HIV Patients with Different Covariates in Ilu Aba Bor Zone ART Centers, Southwest Ethiopia from January 1, 2014, to December 31, 2019 |
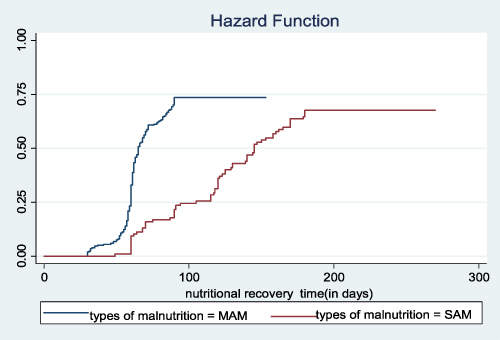 |
Figure 3 Shows a cumulative estimation of the chance of recovery among adult undernourished HIV patients by Type of malnutrition in Ilu Aba Bor, southwest Ethiopia from January 1, 2014 to December 31, 2019. |
Factors Associated with Time to Recovery
Eighteen independent variables were analyzed in bivariate Weibull regression analysis with the dependent variable. Thirteen variables, which have a P-value of <0.25 in the bivariate Weibull regression analysis, were entered into a multivariable Weibull regression analysis. However, eight variables: age, sex, CD4 level, marital status, ART status, adherence level, type of malnutrition, and WHO clinical staging (advanced diseases) were independent predictors. Male patients were 32% less likely to recover than females (AHR = 0.68, CI = 0.51, 0.9). Patients on pre-ART at the time of diagnosis were 51% less likely to recover than those on ART at baseline (HR = 0.49, CI = 0.31, 0.79). Regarding ART adherence level, patients who had good ART adherence recovered 3.33 times more likely than those who had poor ART adherence (HR = 3.33, CI = 1.99,5.56). Depending on the types of malnutrition, severely malnourished patients (BMI <16 kg/m2) were about 78% less likely to recover than those who were moderately malnourished at baseline (AHR = 0.22, CI = 0.15, 0.31). In addition, patients who were in the advanced clinical stage (WHO clinical stage III and IV) were 32% less likely to recover than those who were in the non-advanced stage (WHO clinical stage I and II) (AHR = 0.68, CI = 0.49, 0.95).
Patients who had CD4 count between 200 and 350 cell/m3 were about 2 times more likely to recover than those who had less than 200 cells/m3 Furthermore, patients who had CD4 count of greater than 350 cell/m3 were 1.4 times more likely to recover than their counterparts (200 cell/m3) (for 200–350 cell/m3 AHR = 2.16, CI = 1.45, 3.21; for >350 cell/m3: AHR = 1.6, CI = 1.07, 2.36). Regarding marital status, patients who were married, divorced and widowed had 39%, 67%, 60.5% less likely to recover than those who were single, respectively (AHR = 0.61, CI = 0.43,0.86; AHR = 0.33, CI = 0.20,0.54; AHR = 0.39, CI = 0.21,0.75). Those patients who were in the age group of 35–54 had 1.87 times more likely to recover than those who were 18–34 age (AHR = 1.876, CI = 1.41, 2.47) (Table 4).
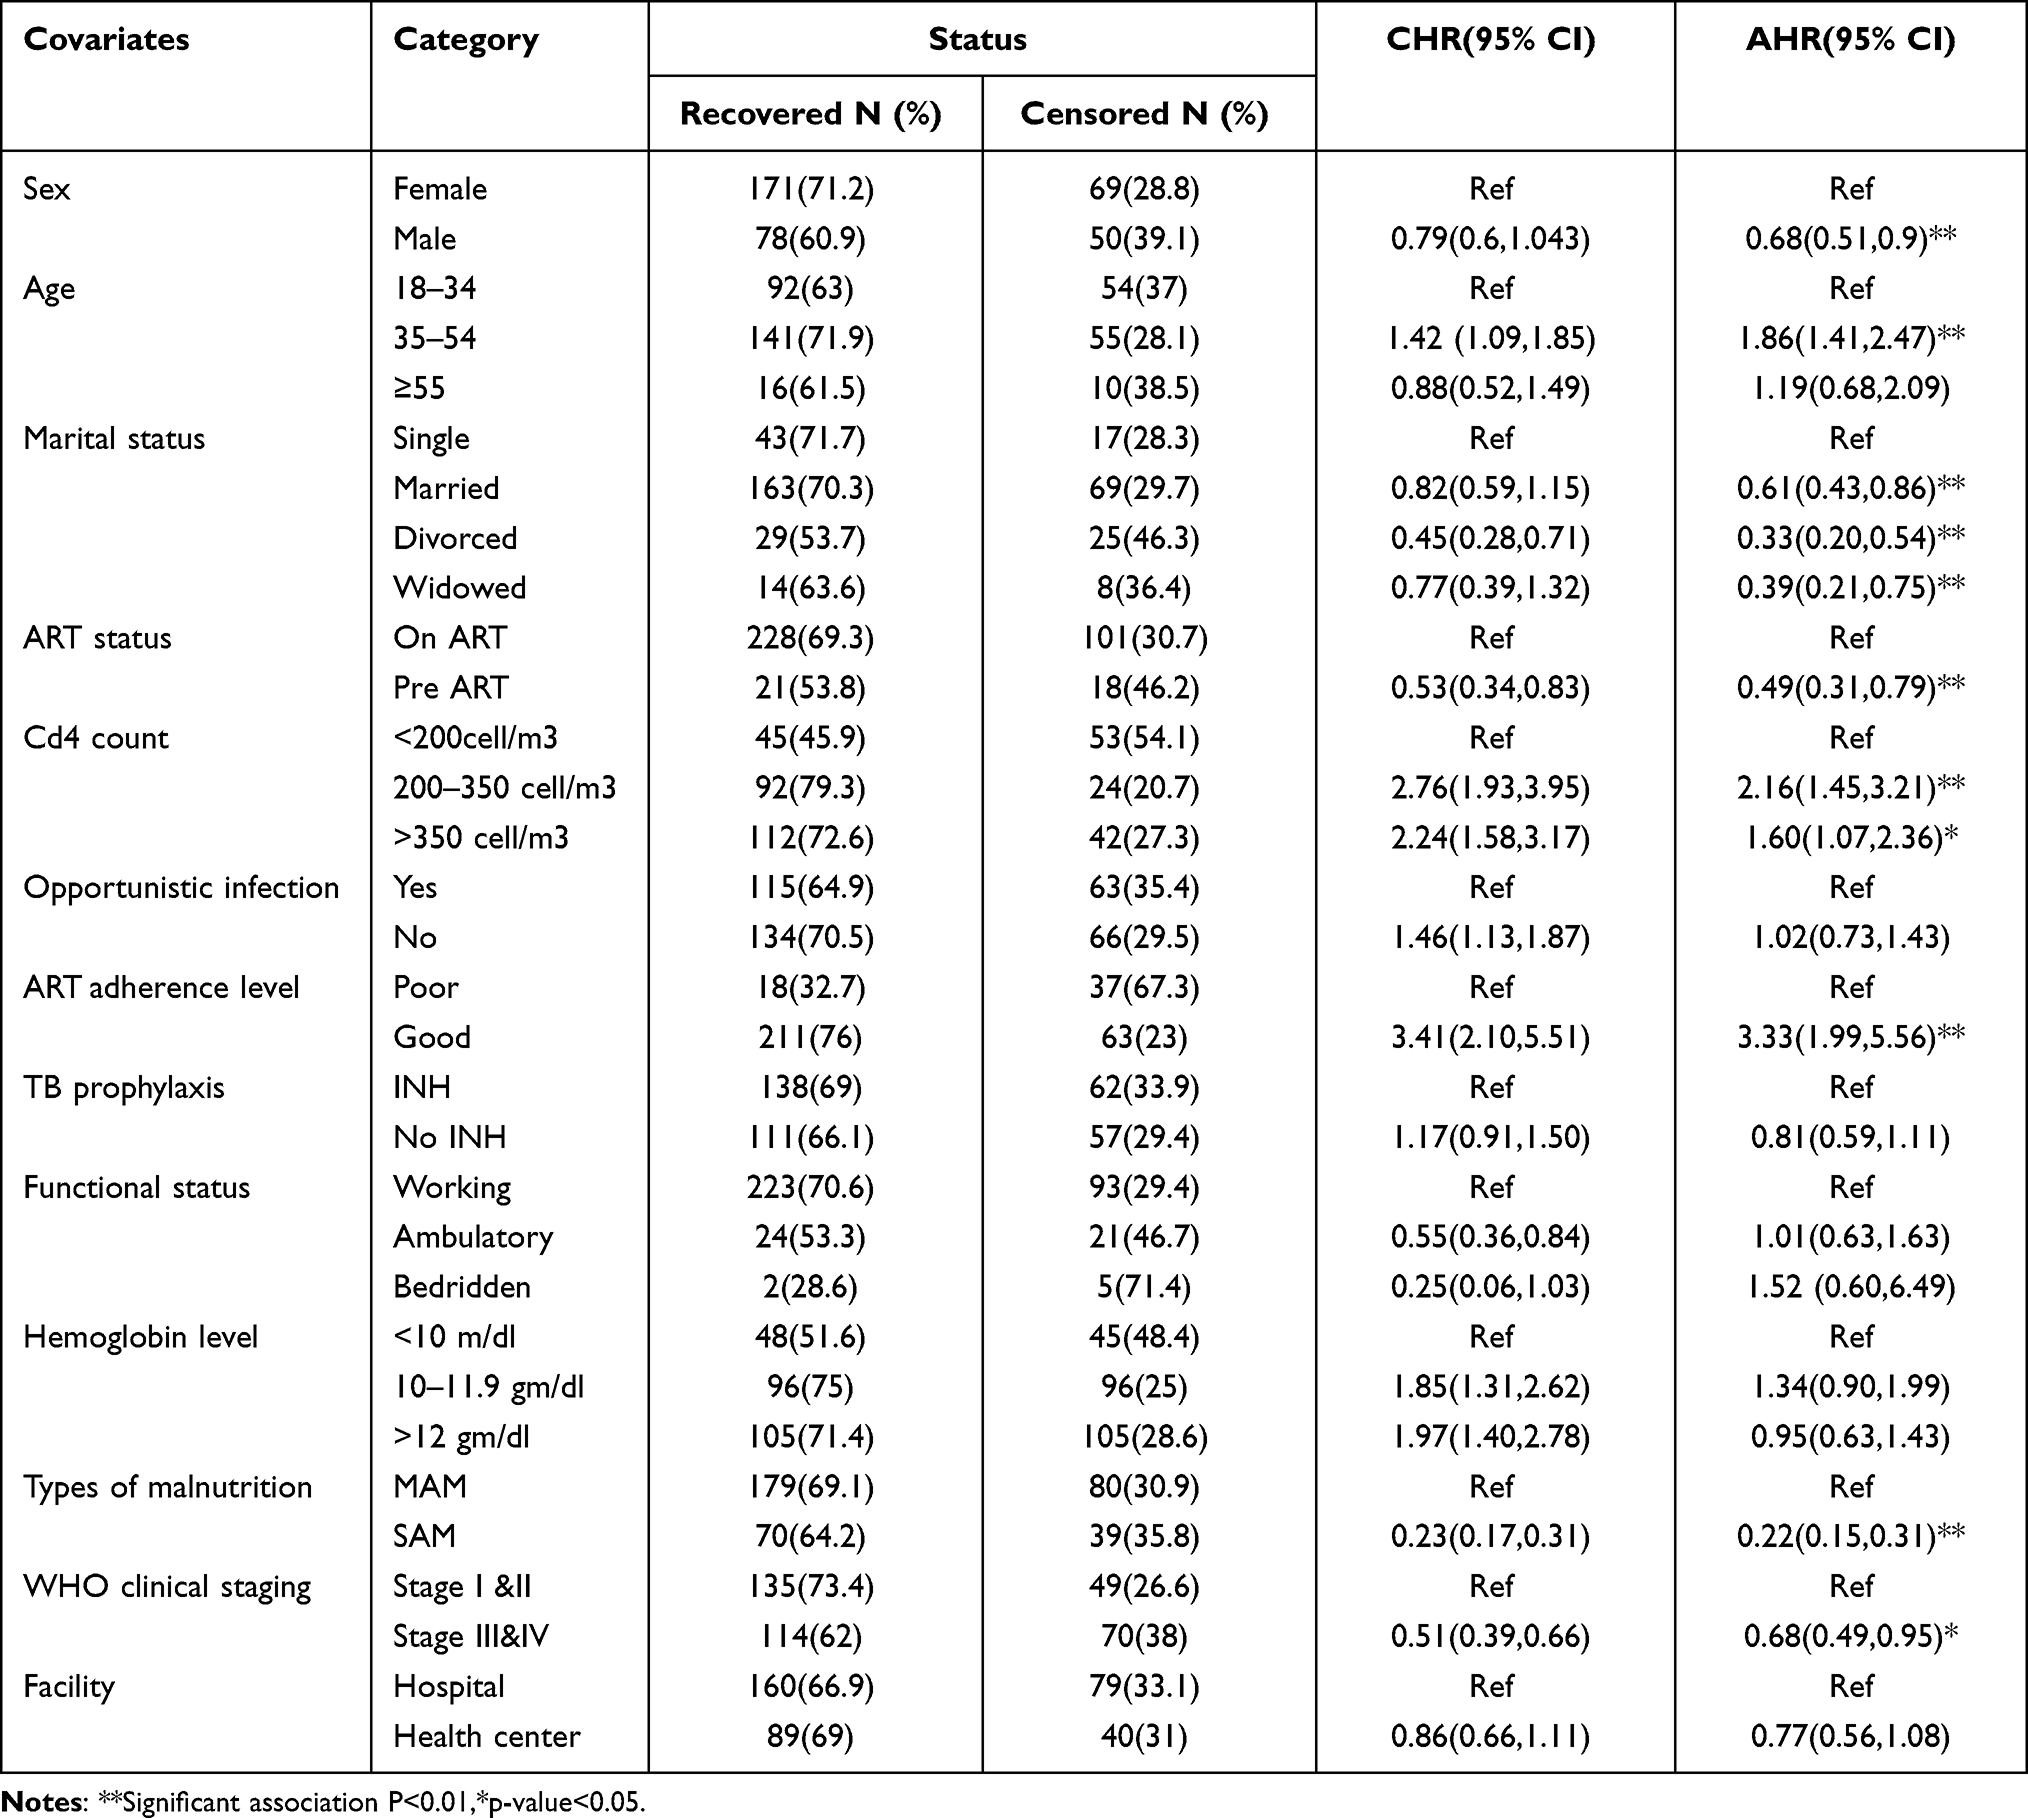 |
Table 4 Factors Associated with Recovery Time Among Undernourished Adult HIV Patients in Ilu Aba Bor Zone ART Centers, Southwest Ethiopia, January 1, 2014 to December 31, 2019 |
Discussion
This study aimed to assess the time to recovery from acute malnutrition as well as the predictors of recovery time among HIV patients. Overall, 249 patients (67.7%; 95% CI = 62.8, 72.6) recovered from malnutrition. The recovery rate in this study was higher than studies conducted in Kenya, Uganda, and Ethiopia.17–20,25 The differences could be attributed to the variations in study setting and period.
The overall recovery time from malnutrition, as well as the differences in recovery time between different patient groups, was evaluated. In this study, the overall median recovery time for moderate and severe malnutrition was estimated to be 65 days and 145 days, respectively. The median recovery time is consistent with the median recovery time reported in an Ethiopian study.20 However, the findings are better than a report from a study conducted at Finote Selam hospital, which were 12 and 25 weeks for MAM and SAM, respectively.19
In a multivariable Weibull regression analysis, sex was one of the predictors of time to recovery from malnutrition. Male patients required more time to recover than female patients. This could be due to men entering ART programs at a more advanced stage of the disease than women.26 It could also be due to differences in energy requirements between men and women. A study conducted in Ethiopia and sub-Saharan Africa supports this finding.18,20,27
Age was also a significant predictor of time to recovery from acute malnutrition. Patients between the ages of 35 to 54 were more likely to recover from acute malnutrition. This finding contradicts the findings of studies conducted in Kenya and Ethiopia.17,21,27 In this study, more than half of the patients were between 35 and 54 years of age. This observed proportion might have played a role in the difference in recovery of this age group compared to other age groups. Furthermore, 85% of patients in this age group had good ART adherence, indicating that they had a high chance of recovery.
Another socio-demographic factor associated with time to recovery from acute malnutrition was marital status. When compared to single participants, married, divorced, and widowed participants had a higher risk of slow recovery. This finding may be attributed to the fact that single people are usually free of worrying about dependent children at home and financial problems because they have fewer social responsibilities that may have a short recovery time. Patients who have been divorced or widowed may be food and financial insecurity, resulting in a lengthy recovery period. Those patients who are married may share their therapeutic feeding (RUTF) with their spouse or children, causing them to not adhere to TFP and thus affecting nutritional recovery time. However, no other study has reported the effect of marital status on nutritional recovery time.
ART status at the time of diagnosis was another predictor of time to recovery from acute undernutrition. HIV patients who did not start ART as soon as they were diagnosed with malnutrition recovered slower than those who started ART immediately after being diagnosed with malnourished. This is because ART effectively suppresses viral replication while also restoring the immune system and halting the onset and progression of illnesses, which may contribute to a faster recovery time from acute malnutrition.28 A study conducted in Ethiopia backs this finding.20 In contrast to this study's findings, a retrospective cohort study in Kenya found that patients on pre-ART have a shorter recovery time.17 The disparity could be related to the sample size in that the study in Kenya involved larger sample size.
Another factor associated with nutritional recovery time was CD4 count. Those patients who had a higher CD4 level (more than 200 cells/m3) recovered faster. This might be because CD4 are white blood cells that fight infection and play an important role in the immune system that hasten the recovery time. Another study in Ethiopia supported our findings, which revealed that lower CD4 count affected nutritional recovery.25 However, studies done in Kenya, in Finote Selam and Mekelle in Ethiopia did not show any association between CD4 count and nutritional recovery.17–19 The reason for the variation could be differences in health care setup and sample size as well as socio-demographic characteristics.
The study also discovered that the type of undernutrition at the baseline was linked to the length of time it takes to recover nutritionally. This is because under nutrition enhances infection vulnerability by promoting immunological malfunction. As the severity of the under-nutrition increases, immunological status deteriorates, causing recovery to be delayed. This finding is in line with findings from Ethiopia18,21 and Kenya.17
WHO clinical stage was another factor that was significantly associated with time to recovery. Patients with non-advanced disease (stages I and II) were more likely to recover from undernutrition. This may be due to the fact that advanced diseases cause immune impairment and decrease the nutrition intake causing patients to have a longer nutritional recovery time. This finding is also supported by evidence from retrospective cohort studies conducted in Ethiopia’s Finote Selam hospital and Mekelle.18,19
ART adherence was another predictor of nutritional recovery time. Patients with good adherence to ART regimens were more likely to recover from malnutrition than patients with poor adherence. This may be due to the nutritional effect of non-compliance, which may result in virologic, immunologic, and clinical failure. Evidence from a study in Ethiopia supports the current findings.19
Conclusion
In this study, the recovery rate was higher than the reports from most studies conducted in Ethiopia and other sub-Saharan countries. According to the multivariate Weibull regression model, sex (male), marital status, ART status at diagnosis, severe malnutrition, and advanced stage of the disease (WHO III and IV) were all negatively associated with nutritional recovery time, whereas having a higher CD4 count, good ART adherence, and age (between 35 and 54 years) were found to be positively associated. Based on the study findings, we recommend that ART clinicians, therapeutic feeding programs and health authorities give due emphasis to people with poor adherence, advanced WHO clinical stage, low CD4 count, and severe acute malnutrition. In addition, attention should be given to male, widowed and divorced, and young patients. Further, immediate enrollment into the ART has to be strengthened.
Limitation of the Study
Because it was based on secondary data due to its retrospective nature, the analysis of associated factors for nutritional recovery time was limited by the information obtained from the patients’ charts. As a result, data on some demographic characteristics (food insecurity, economic status) and other clinically related factors were not available in the patient’s record, and these variables were not included in the study. Because this is a secondary data analysis, future researchers should use a prospective cohort study design to obtain more information by incorporating additional factors not included in this study.
Abbreviations
AHR, adjusted hazard ratio; AIC, Akaike information criterion; AIDS, acquired immune deficiency syndrome; ART, antiretroviral therapy; BMI, body mass index; BIC, Bayesian information criterion; CD4, cluster of differentiation four; CHR, crude hazard ratio; CI, confidence interval; CNS, central nerves system; EFMOH, Ethiopian federal ministry of health; HIV, human immune deficiency virus; HR, hazard ratio; MAM, moderate acute malnutrition; PLHIV, people living with HIV; RUTF, ready to use therapeutic feeding; SAM, severe acute malnutrition; SNNPR, South nation, nationalities, and peoples region; TB, Tuberculosis; TFP, therapeutic feeding program; WHO, World Health Organization.
Ethics Approval and Consent to Participate
This study was conducted according to the principles of Declaration of Helsinki.29 Ethical clearance was obtained from the Ethical Review Committee of Mettu University, college of health sciences, and department of public health, on 01/11/2021 with reference number: RPG-57-2013. And permission was taken from the administrations of selected ART centers. Because this was a retrospective study, the patient’s verbal or written consent was not required. The patient names and unique ART numbers were not included in the data collection format to maintain confidentiality. Furthermore, before data entry, the collected data were coded and locked away in a separate room. Furthermore, none other than the principal investigator was given access to the data. Finally, all the collected data were kept strictly confidential and would not be used for any purpose other than the stated research objective.
Data Sharing Statement
Data will be available upon the request of the corresponding author.
Acknowledgments
We would like to thank Mettu University College of Health Sciences and the Department of Public Health. We are also very glad to forward our special thanks for the unlimited assistance of hospital and health center managers, ART clinic and patient card department staff. Our sincere thanks also go to data collectors, supervisors and the study participants for their contribution to this work.
Author Contributions
All authors made a significant contribution to the work reported, whether that is in the conception, study design, execution, acquisition of data, analysis and interpretation, or in all these areas; took part in drafting, revising or critically reviewing the article; gave final approval of the version to be published; have agreed on the journal to which the article has been submitted; and agree to be accountable for all aspects of the work.
Disclosure
The authors report no conflicts of interest in this work.
References
1. UNAIDS. Global AIDS update, seizing the moment; 2020.
2. Research Institute (IFPRI) IFP. Global Nutrition Report 2016 from Promise to Impact Ending Malnutrition by 2030 Summary. International Food Policy Research Institute; 2016.
3. World Health Organization. Ethiopia HIV country profile: 2016; 2020:1–13.
4. Thapa R, Amatya A, Pahari DP, Bam K, Newman MS. Nutritional status and its association with quality of life among people living with HIV attending public anti-retroviral therapy sites of Kathmandu. AIDS Res Ther. 2015;12(1):14. doi:10.1186/s12981-015-0056-9
5. Murray J, Whitehouse K, Ousley J, et al. High levels of viral repression, malnutrition and second-line ART use in adolescents living with HIV: a mixed methods study from Myanmar. BMC Infect Dis. 2020;20(20):241. doi:10.1186/s12879-020-04968-x
6. Odwee A, Kasozi KI, Acup CA, et al. Malnutrition amongst HIV adult patients in selected hospitals of Bushenyi district in Southwestern Uganda. Afr Health Sci. 2020;20(1):122–131. doi:10.4314/ahs.v20i1.17
7. Takarinda KC, Mutasa-Apollo T, Madzima B, et al. Malnutrition status and associated factors among HIV-positive patients enrolled in ART clinics in Zimbabwe. BMC Nutr. 2017;3(3):15. doi:10.1186/s40795-017-0132-8
8. Mahlangu K, Modjadji P, Madiba S. The nutritional status of adult antiretroviral therapy recipients with a recent HIV diagnosis; A cross-sectional study in primary health facilities in Gauteng, South Africa. Health Care. 2020;8(3):290. doi:10.3390/healthcare8030290
9. Mitiku A, Ayele TA, Assefa M, Tariku A. Undernutrition and associated factors among adults living with human immune deficiency virus in Dembia District, northwest Ethiopia: an institution based cross-sectional. Study Arch Public Health. 2016;74(1):33. doi:10.1186/s13690-016-0143-y
10. Hailemariam S, Bune GT, Ayele HT. Malnutrition: prevalence and its associated factors in People living with HIV/AIDS, in Dilla University Referral Hospital. Arch Public Health. 2013;71(1):13. doi:10.1186/0778-7367-71-13
11. Alemayehu Kenea M. Assessment of adult nutritional status and associated factors among ART users in nekemte referral hospital and health center, East Wollega Zone, Ethiopia. J Food Nutr Sci. 2015;3(2):55. doi:10.11648/j.jfns.20150302.15
12. Federal HIV/AIDS Prevention and Control Office. HIV prevention in Ethiopia: national road map. Epidemiol Synth. 2018;2018:1–43.
13. EFDR MOH. The federal democratic republic of Ethiopia ministry of health, National Guidelines for HIV/AIDS and nutrition; 2008:1–73.
14. Alebel A, Demant D, Petrucka P, Sibbritt D. Effects of undernutrition on mortality and morbidity among adults living with HIV in sub-Saharan Africa: a systematic review and meta-analysis. BMC Infect Dis. 2021;21(1):1–20. doi:10.1186/s12879-020-05706-z
15. Tesfamariam K, Baraki N, Pre KH. ART nutritional status and its association with mortality in adult patients enrolled on ART at Fiche Hospital in North Shoa, Oromia region, Ethiopia: a retrospective cohort study. BMC Res Notes. 2016;9(5):1–9. doi:10.1186/s13104-016-2313-y
16. Audain KA, Zotor FB, Amuna P, Ellahi B. Food supplementation among HIV-infected adults in Sub-Saharan Africa: impact on treatment adherence and weight gain. Proc Nutr Soc. 2015;74(4):517–525. doi:10.1017/S0029665115000063
17. Nagata JM, Cohen CR, Young SL, et al. Descriptive characteristics and health outcomes of the food by prescription nutrition supplementation program for adults living with HIV in Nyanza Province, Kenya. PLoS One. 2014;9(3):1–9. doi:10.1371/journal.pone.0091403
18. Maldey B, Haile F, Shumye A. Outcome of ready to use food therapy among patients on HIV/AIDS care in Mekelle Hospital, Northern Ethiopia: retrospective cohort study. J AIDS Clin Res. 2014;5(1):1. doi:10.4172/2155-6113.1000268
19. Diress G, Moges NA. Nutritional recovery and its predictors among adult HIV patients on therapeutic feeding program at finote-selam general hospital, Northwest Ethiopia: a retrospective cohort study. Hindawi AIDS Res Treat. 2020;2020(1):6. doi:10.1155/2020/8861261
20. Sadler K, Bontrager E, Rogers B, et al. Measuring the impact and cost-effectiveness of prescribed food on recovery from malnutrition and HIV disease progression among HIV + adult clients in Ethiopia a partnership study between Tufts University and Save the Children US in Ethiopia for USAID/FB; 2012:29–72.
21. Maiti B. Treatment out comes of food by prescription and associated factors among adult HIV/AIDS patients in Gondar University Hospital, north west Ethiopia, 2015. J Chem Inf Model. 2015;53(9):1689–1699.
22. Gedefaw M, Tariku M. Determinates of regain in body mass index among malnourished aids patients on therapeutic food in Amhara National Regional State, Northwest Ethiopia: a Retrospective Cohort Study. Open J Epidemiol. 2015;5(2):122–128. doi:10.4236/ojepi.2015.52016
23. FMOH. National consolidated guidelines for comprehensive HIV prevention, care and treatment; 2018.
24. Woldie HG, Ketema DB, Ayana M, Alebel A. Predictors of recovery rate among undernourished HIV-positive adults treated with ready-to-use therapeutic food at Debre Markos Comprehensive Specialized Hospital: a retrospective cohort study. PLoS One. 2021;16(8):e0255465. doi:10.1371/journal.pone.0255465
25. Article O, Bhagavathula AS, Tegegn HG, Dawson A, Elnour AA, Shehab A. Retention and treatment outcomes of an undernutrition program for HIV patients involving Ready-to-use therapeutic food at Gondar University Hospital, Ethiopia: a Cross-Sectional Study. J Clin Diagn Res. 2016;10(8):2–8. doi:10.7860/JCDR/2016/19875.8294
26. Ac M. Expanding HIV care in Africa: making men matter. J Expand HIV Care Afr. 2021. doi:10.1016/S0140-6736(09)60616-4
27. Ahoua L, Umutoni C, Huerga H, et al. Nutrition outcomes of HIV-infected malnourished adults treated with ready-to-use therapeutic food in sub-Saharan Africa: a longitudinal study. J Int AIDS Soc. 2011;14(1):2. doi:10.1186/1758-2652-14-2
28. World Health Organization. World Health Organization brief on antiretroviral treatment (ART) in HIV and TB prevention; 2011:1–7.
29. World Health Organization. World Medical Association Declaration of Helsinki. Ethical principles for medical research involving human subjects. Bull World Heal Organ. 2001;79:373–374.
 © 2022 The Author(s). This work is published and licensed by Dove Medical Press Limited. The
full terms of this license are available at https://www.dovepress.com/terms
and incorporate the Creative Commons Attribution
- Non Commercial (unported, 3.0) License.
By accessing the work you hereby accept the Terms. Non-commercial uses of the work are permitted
without any further permission from Dove Medical Press Limited, provided the work is properly
attributed. For permission for commercial use of this work, please see paragraphs 4.2 and 5 of our Terms.
© 2022 The Author(s). This work is published and licensed by Dove Medical Press Limited. The
full terms of this license are available at https://www.dovepress.com/terms
and incorporate the Creative Commons Attribution
- Non Commercial (unported, 3.0) License.
By accessing the work you hereby accept the Terms. Non-commercial uses of the work are permitted
without any further permission from Dove Medical Press Limited, provided the work is properly
attributed. For permission for commercial use of this work, please see paragraphs 4.2 and 5 of our Terms.