Back to Journals » Pediatric Health, Medicine and Therapeutics » Volume 14
Time to Death and Its Predictors Among Infants in Ethiopia: Multilevel Mixed-Effects Parametric Survival Analysis Using the 2019 Ethiopian Mini Demographic Health Survey
Authors Oyato B ![]() , Zakir H
, Zakir H ![]() , Hussein D
, Hussein D ![]() , Lemma T, Awol M
, Lemma T, Awol M ![]()
Received 11 January 2023
Accepted for publication 12 May 2023
Published 23 May 2023 Volume 2023:14 Pages 169—183
DOI https://doi.org/10.2147/PHMT.S402154
Checked for plagiarism Yes
Review by Single anonymous peer review
Peer reviewer comments 2
Editor who approved publication: Professor Roosy Aulakh
Befekadu Oyato,1 Husen Zakir,1 Dursa Hussein,2 Tasfaye Lemma,3 Mukemil Awol1
1Department of Midwifery, College of Health Sciences, Salale University, Fitche, Ethiopia; 2Department of Public Health, College of Health Sciences, Salale University, Fitche, Ethiopia; 3Department of Nursing, College of Health Sciences, Salale University, Fitche, Ethiopia
Correspondence: Befekadu Oyato, Department of Midwifery, College of Health Sciences, Salale University, Fitche, Ethiopia, Email [email protected]
Introduction: Three years ahead of the plan, Ethiopia has met Millennium Development Goal 4 of reducing under-five mortality. Additionally, the nation is on track to achieve the Sustainable Development Goal of putting an end to preventable child mortality. Despite this, recent data from the nation showed that there were 43 infant deaths for every 1000 live births. Moreover, the country has fallen short of the 2015 Health Sector Transformation Plan goal, with an anticipated infant mortality rate of 35 deaths per 1000 live births in 2020. Thus, this study aims to identify the time to death and its predictors among Ethiopian infants.
Methods: This study used the 2019 Mini-Ethiopian Demographic and Health Survey data set to conduct a retrospective study. The analysis used survival curves and descriptive statistics. Multilevel mixed-effects parametric survival analysis was applied to identify the predictors of infant mortality.
Results: The estimated mean survival time of infants was 11.3 months (95% CI: 11.1, 11.4). Women’s current pregnancy status, family size, age of women, previous birth interval, place of delivery, and mode of delivery were significant individual-level predictors of infant mortality. Infants born with less than 24 months’ birth interval had a 2.29 times higher estimated risk of death (AHR = 2.29, 95% CI: 1.05, 5.02). Infants born at home were 2.48 times more likely to die than those born in a health facility (AHR = 2.48, 95% CI: 1.03, 5.98). At the community level, women’s education was the only statistically significant predictor of infant death.
Conclusion: The risk of infant death was higher before the first month of life, typically shortly after birth. Healthcare programs should put a strong emphasis on efforts to space out births and make institutional delivery services more readily accessible to mothers in Ethiopia to address the infant mortality challenges.
Keywords: predictors, infant mortality, multilevel-mixed effects, parametric survival analysis, Ethiopia
Introduction
Infant Mortality Rate (IMR) measures the likelihood that a child will not reach their first birthday for every 1000 live births born in a given year.1 Infant mortality rates reflect the social, economic, and environmental conditions in which children live, including their health care.2 A high infant death rate may be an indication of substandard care or a lack of access to care.3
The Sustainable Development Goals (SDGs) target for child mortality is to eliminate preventable deaths of newborns and children under the age of five by 2030, with all nations striving to reduce neonatal and under-five mortality to lower than 12, and 25 deaths per 1000 live births correspondingly.4 Accordingly, the Health Sector Transformation Plan (HSTP) in Ethiopia has set ambitious targets intending to lower the under-five, infant, and neonatal mortality rates to as low as 30, 20, and 10 per 1000 live births respectively by the end of 2020.5
Infant mortality rates have decreased globally, from an estimated rate of 65 deaths per 1000 live births in 1990 to 27 deaths per 1000 live births in 2020.2,6 Despite this global gain, 3.8 million children worldwide lost their lives before reaching their first birthday in 2020 alone, making up 76% of all deaths of children under the age of five.6 The majority of those 2.4 (2.2–2.6) million deaths happened among neonates.6,7 Furthermore, the large majority of these fatalities could have been prevented.6
According to reports, SSA has an infant mortality rate of 51 fatalities per 1000 live births,6,8 which is unacceptably high compared to other areas and roughly double the global burden.6 In SSA nations, the infant mortality rate ranges from 12 in Cabo Verde and Seychelles to 80, 77, 73, and 72 in Sierra Leone, Somalia, the Central African Republic, and Nigeria, respectively.6
Infant mortality in Ethiopia is still high, even though there has been considerable progress over the past 25 years. The 2019 Ethiopian Mini Demographic and Health Survey (EMDHS) reported that there were 43 infant deaths for every 1000 live births.9 Additionally, the nation fell short of the 2015 HSTP goal, with an anticipated infant mortality rate of 35 deaths per 1000 live births in 2020.6
Studies conducted across the world found that factors such as mother’s education level,3,8 smoking during pregnancy,10 use of Ante-Natal Care (ANC) during pregnancy,11 size of the child at birth,3,8,10 preceding birth interval,3,8,11 plurality,3,8 place of delivery,8,11 source of water,8 child’s sex,3,8,11 and family size12 were important determinants of mortality.
Ethiopia has achieved the Millennium Development Goal 4 (MDG), lowering under-five mortality, three years ahead of schedule.5 This is partly due to the Health Extension Program’s (HEP) launch and the country’s rapid socioeconomic growth. High-impact public health interventions are now more widely accessible and covered in the nation, thanks in large part to the HEP. The dramatic improvement in health outcomes in Ethiopia can be attributed to several factors, including access to primary healthcare, increased ANC attendance, increased skilled delivery, improved malaria control efforts, access to safe drinking water, improved sanitary conditions, and vaccination against childhood diseases.5,13
Although there were limited population-based studies on this topic conducted in Ethiopia, it is essential to take into account community-level characteristics when designing health intervention programs to accomplish the Sustainable Development Goal of ending preventable child mortality. Therefore, this study undertook a retrospective analysis based on the 2019 Ethiopian Mini Demographic and Health Survey (EMDHS) data set, to assess the time to death and its predictors among infants in Ethiopia.
Methods
Study Areas and Settings
A retrospective cohort study from April 8 to April 30, 2022, based on the 2019 EMDHS, was conducted in this study. The study was conducted in Ethiopia, which is located on the Eastern tip of Africa and bordered by Eritrea to the North, Djibouti, and Somalia to the East, the Republic of Sudan and South Sudan to the West, and Kenya to the South.14 It is the second most populous nation in Africa, with over 110 million populations.15 Nine geographical regions and two administrative cities make up Ethiopia’s administrative divisions.14 Ethiopia is home to about 15.5 million children under 5 years of age – approximately 18% of the total population.16 In Ethiopia, infant mortality had declined from 77 deaths per 1000 live births in 2005 to 43 deaths per 1000 live births in 2019.9
Data Sources and Population
The 2019 Mini-EDHS employed a two-stage stratified sampling technique to select respondents. Each region was stratified into urban and rural areas, yielding 21 sampling strata. A community cluster or Enumeration Area (EA) was defined as a geographical area covering an average of 131 households (HH). The sampling frame used for the 2019 EMDHS was a complete list of 149,093 EAs created for the 2019 Ethiopia Population and Housing Census (PHC), which is yet to occur.9
In the first stage, a total of 305 enumeration areas (EAs) or clusters (93 in urban areas and 212 in rural areas) were selected with a probability proportional to EA size and with independent selection in each sampling stratum. A household listing operation was then carried out in all selected EAs. In the second stage of selection, a fixed number of 30 households per cluster were selected with an equal probability of systematic selection from the newly created household listing. Therefore, 9150 HHs were selected, and 8885 women aged 15–49 were interviewed.9
The data was collected from March 21, 2019, to June 28, 2019. Information on infant mortality was taken from the birth history section of the Woman Questionnaire, which was included in the survey. All live births that occurred in the five years prior to the survey period across the nation made up the source population. All infants born in the five years prior to the survey period in the selected clusters, or EAs were the study populations. As a result, 1520 infants born between 2015 and 2019 who were followed up for a year during the five years prior to the survey were included in this study.9 The detailed sampling procedure is presented in Figure 1. The data sources were extracted from the under-five children’s (KR) file from the standard DHS dataset.
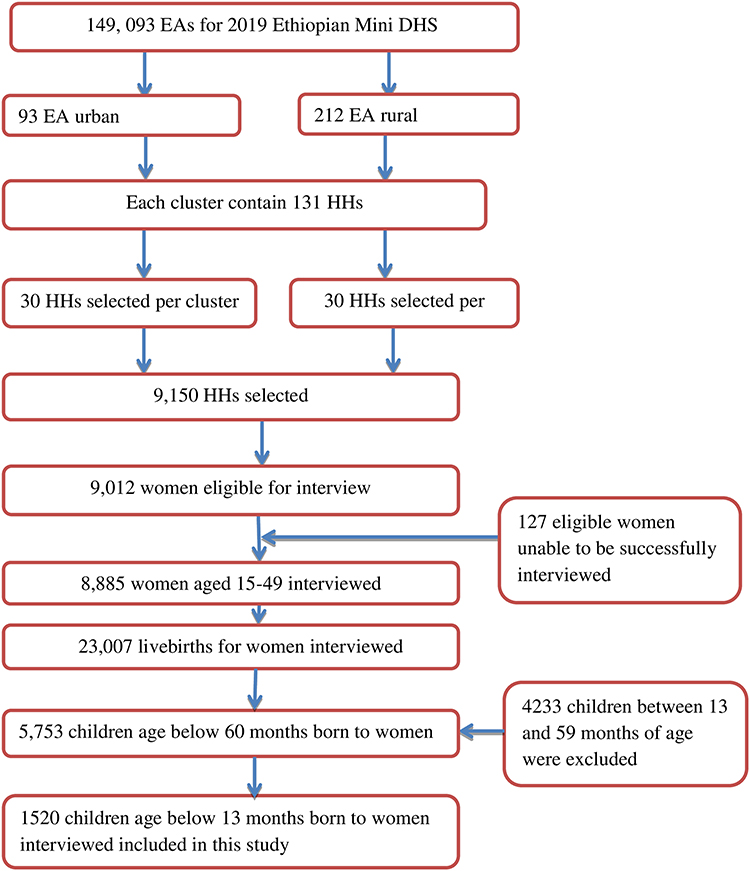 |
Figure 1 Sampling procedure for infant mortality from the 2019 Ethiopian mini-demographic and health survey, 2022. |
Ethical Consideration
The study used secondary data analysis of publicly available survey data from the Measure DHS Program. Ethical approval and participant consent were not required for this study. A written letter of permission was secured from the Institution Review Board of Demographic and Health Survey (DHS) program data archivists to download and use the data for this study from https://www.dhsprogram.com. The DHS data were kept confidential, and any identifying information was removed. The data was only used for this particular, authorized research project, and it would not be shared with any researchers.
Data Abstraction and Selection of Variables
Dependent Variable
The outcome variable was the time to death of an infant, measured in months from birth to the end of the follow-up period. Infant deaths between birth and 12 months were classified as an event (1 = death). Infants who were still alive and did not reach their first birthday at the end of the follow-up period were considered censored (0 = alive).
Explanatory Variables
The individual-level factors in this study were socio-demographic characteristics (mothers’ educational status, marital status of mothers, source of drinking water, type of toilet facility, type of cooking fuel, floor material, wall material, roof material, access to electricity, access to mass media, sex of HH head, family size or the number of HH members, wealth index, mother’s age group), maternal-obstetric factors (place of delivery, age of mothers at first birth, use of a contraceptive method, mother’s health checked in a health facility after delivery and before discharge, Post-Natal Care (PNC) at home, route of delivery, ANC utilization, and maternal pregnancy status at the time of the survey), and child characteristics (ever breastfed history, birth order, vaccination of child, child’s health checked before discharge from health facility, child’s health checked within 2 months of birth, sex of a child, and preceding birth interval).
The community-level variables taken into account in this study included ANC utilization, improved water use, education of women in the community, media access, residence, and region. The community-level data were generated by aggregating the individual characteristics with our interest in a cluster. The proportion of a given variable’s subcategory in a particular cluster was used to construct the aggregates. The aggregate value for all newly created variables had a non-normal distribution, so it was split into two categories (low and high proportions) based on their median values. Community media access was measured as the proportion of women in the cluster who had access to either radio or television or both. Community women’s education is measured as the proportion of women in the cluster with secondary or higher education. Community-level poverty was defined as the proportion of women in the bottom 2 household wealth quantiles (poorer and poorest) in the cluster. Community-improved water utilization was measured as the proportion of women using improved drinking water sources in the cluster. The percentage of women in a cluster who utilize ANC was used to define community ANC utilization. Place of residency and region were used as they were categorized in the EMDHS data set. The independent variables explored in this study were based on the existing literature and availability in the original data set.
Operational Definitions
Improved drinking water sources include piped water, public taps, standpipes, tube wells, boreholes, protected dug wells, protected springs, and rainwater collection.17
Antenatal care utilization was defined as women who attended a minimum of four prenatal care appointments.18
Data Quality Control and Assurance
The data set for the original work was collected by using structured and pretested comprehensive standard questionnaires. Data were collected by face-to-face interviewing women that met the eligibility criteria. The woman’s questionnaire, the household questionnaire, and the Health Facility Questionnaire were employed to gather essential information. The finalized English versions of the questionnaires were then translated into Amarigna, Tigrigna, and Afaan Oromo. In addition to this, the gathered data was back-translated into English to keep consistency. The quality of the dataset has been maintained by testing its completeness. Moreover, the quality of the original data set was maintained by giving training to interviewers, and interviewers used tablet computers to record responses during the interviews.
To ensure that the data were representative and to obtain a trustworthy estimate and standard error, the data were weighted using sampling weight before conducting any statistical analysis. The weighted results from the analysis were reported in this study. Multicollinearity between independent variables was checked using the Variance Inflation Factor (VIF) and the mean VIF was 1.14. The proportional hazards (PH) assumption was also checked using Scaled Schoenfeld residuals and found to be satisfied, with a global test value of 0.0645. The data was also assessed for an interaction factor.
Data Management and Analysis
STATA version 14 software was used for cleaning, recording, and analyzing the data. Descriptive statistics were applied using frequencies and percentages. Estimation of survival probability was done by using the Kaplan–Meier survival curve. Survival curves were compared by Log rank test. Bivariate survival regression was fitted for explanatory variables and those having a p-value ≤0.20 level of significance were considered for the multivariable analysis. Then, the study applied a stepwise variable selection procedure to obtain the final reduced model. Finally, a multivariable mixed-effects parametric Weibull distribution survival regression model was fitted. Adjusted hazard ratio (AHR) with its 95% confidence interval (CI) was applied, and covariates with a P-value <0.05 in the multivariable analysis were considered predictors of infant mortality.
Survival Analysis
Survival analysis deals with the analysis of survival data, which is used to measure the time to an event of interest, such as recovery, relapse, or death.19 The survival times for subjects who left the study early or who finished it without experiencing the event of interest are censored. Each uncensored observation is taken to indicate an event or death.20
Let T denote the random variable for the survival time of a subject. Assume f(t), t ≥ 0, denote the probability density function (pdf) of T, and let F(t)=P(T≤t), t ≥ 0, be the cumulative distribution function (CDF) of T. The distribution of T is called the survival time distribution. The survival function, S(t), is defined as the probability that a subject survives up to time t:19–21

Mixed-Effects Parametric Survival Analysis
The EMDHS employed a multistage cluster sampling method, resulting in hierarchical data. Mothers and infants were nested within households, and households were nested within clusters.22 Considering the hierarchical nature of EMDHS data, a two-stage multivariable mixed-effects parametric survival regression analysis was used to estimate the effects of individual and community-level determinants on infant mortality.
Mixed-effect survival models contain both fixed effects and random effects. Random effects are useful for modeling intracluster correlations; that is, observations in the same cluster are correlated because they share common cluster-level random effects. Mixed-effects parametric survival model makes the often more plausible assumption that random effects are normally distributed, meaning frailties are lognormal. It also helps to extend the types of models that we can fit beyond two-level models with random intercepts.23
Parametric survival mixed-effects models use a trivariate response variable (t0; t; d), where each response corresponds to a period under observation (t0; t) and results in either failure (d = 1) or right censoring (d = 0) at time t. PH model is a model used for adjusting survivor functions for the effects of covariates. In the PH model, the covariates have a multiplicative effect on the hazard function:24
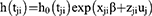
for j = 1, …, M clusters with cluster j consisting of i = 1, …, nj observations. The vector xji contains the covariates for the fixed effects, with regression coefficients (fixed effect) β. The vector zji contains the covariates corresponding to the random effects uj. h0(t) is a baseline hazard function. The functional form of h0(t) determines the regression model. The exponential and Weibull models are implemented in mixed-effects parametric survival analysis for the PH parameterization.24 Therefore, this study fitted a random-effects Weibull model with normally distributed random effects. This model can be viewed as a shared frailty model with lognormal frailty.
Four models were fitted to identify community and individual-level factors associated with infant death. The first model (Model 1 or empty model) contained no explanatory variables. The second model (Model 2) considered only the individual-level variables to examine the individual-level effect. The third model (Model 3) considered only the community-level variables to examine the effect of community-level factors on infant death, independent of other factors. The fourth model (Model 4) is the full model that incorporated all individual and community-level variables into the multilevel analysis. Backward stepwise parametric survival regression analysis was performed to select individual and community-level variables for each model, and then all those selected variables were incorporated into the multilevel modeling.
The fixed effect sizes of individual and community-level predictors of infant mortality were expressed as AHRs with 95% CI. The P-value <0.05 has been considered statistically significant. The Intraclass Correlation Coefficient (ICC), Median Hazard Ratio (MHR), and Proportional Change in Variance (PCV) were used to present the measure of variance (random effects).
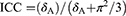
ICC is a measure of within-cluster variation, the variation between individuals within the same cluster, and it was calculated using the formula:25
Where δA is the estimated variance in each model. The proportional change in variance (PCV) was used to quantify the overall variation in each model that was attributed to individual and /or community-level factors, and it was calculated as:26

Where δA = variance of the initial model, and δB = variance of the model with more terms. The MHR is a measure of the unexplained cluster heterogeneity or variation between clusters, and it is calculated by comparing two individuals from two separate randomly selected clusters.20 It is the median hazard ratio between the individuals of higher propensity and the individuals of lower propensity. It was computed using the formula:26

Where δA is the cluster-level variance. The MHR measure is always greater than or equal to 1. If the MHR is 1, there is no variation between clusters.26
The Best-Fit Model Selection
Model fitness was checked using Akakian Information Criteria (AIC) and Deviance Information Criteria (DIC). The lowest AIC and DIC values declare the best-fit model.20
Results
Socio-Demographic Characteristics of the Study Participants
The total number of births considered for this study was 1520 (unweighted). Half (699) of the infants were delivered to women with no education, of whom 140 (20%) died. Nearly half (45.8%) of the infants were from households with a poor wealth index; of those, 131 (20.4%) died. Another 45 (16.3%) infants from a household with a medium wealth index died before attaining age one.
Over ninety percent of infants were delivered to women who were already in a union, and 226 (17.3%) of those infants passed away before becoming one year old. Of the total number of births, 141 (12.1%) and 5 (4.4%) infant deaths have occurred for mothers who did not have PNC at home and for those who did.
One-fourth (288 (24.5%)) of infants initiated breastfeeding not immediately at birth, and of those 19 (6.6%) were forced to die before celebrating their first birthday. Cesarean-delivered infants accounted for 6.9% of the total infants but represented 24.1% of the total cases of infant deaths.
About a third (30.9%) of the communities had a high proportion of community-educated women, with 14.4% of infants dying before one year of age. Women in urban regions had 23.2% of births but comprised 17.9% of infant deaths overall, whereas women in rural areas gave birth to 76.8% of infants and accounted for 82.1% of all infant mortality cases. Infants living in Somalia regional states (29.2%) were at a higher risk of death, whereas those residing in Addis Ababa (8.8%) were at a lower risk of mortality before celebrating their first birthday (Table 1).
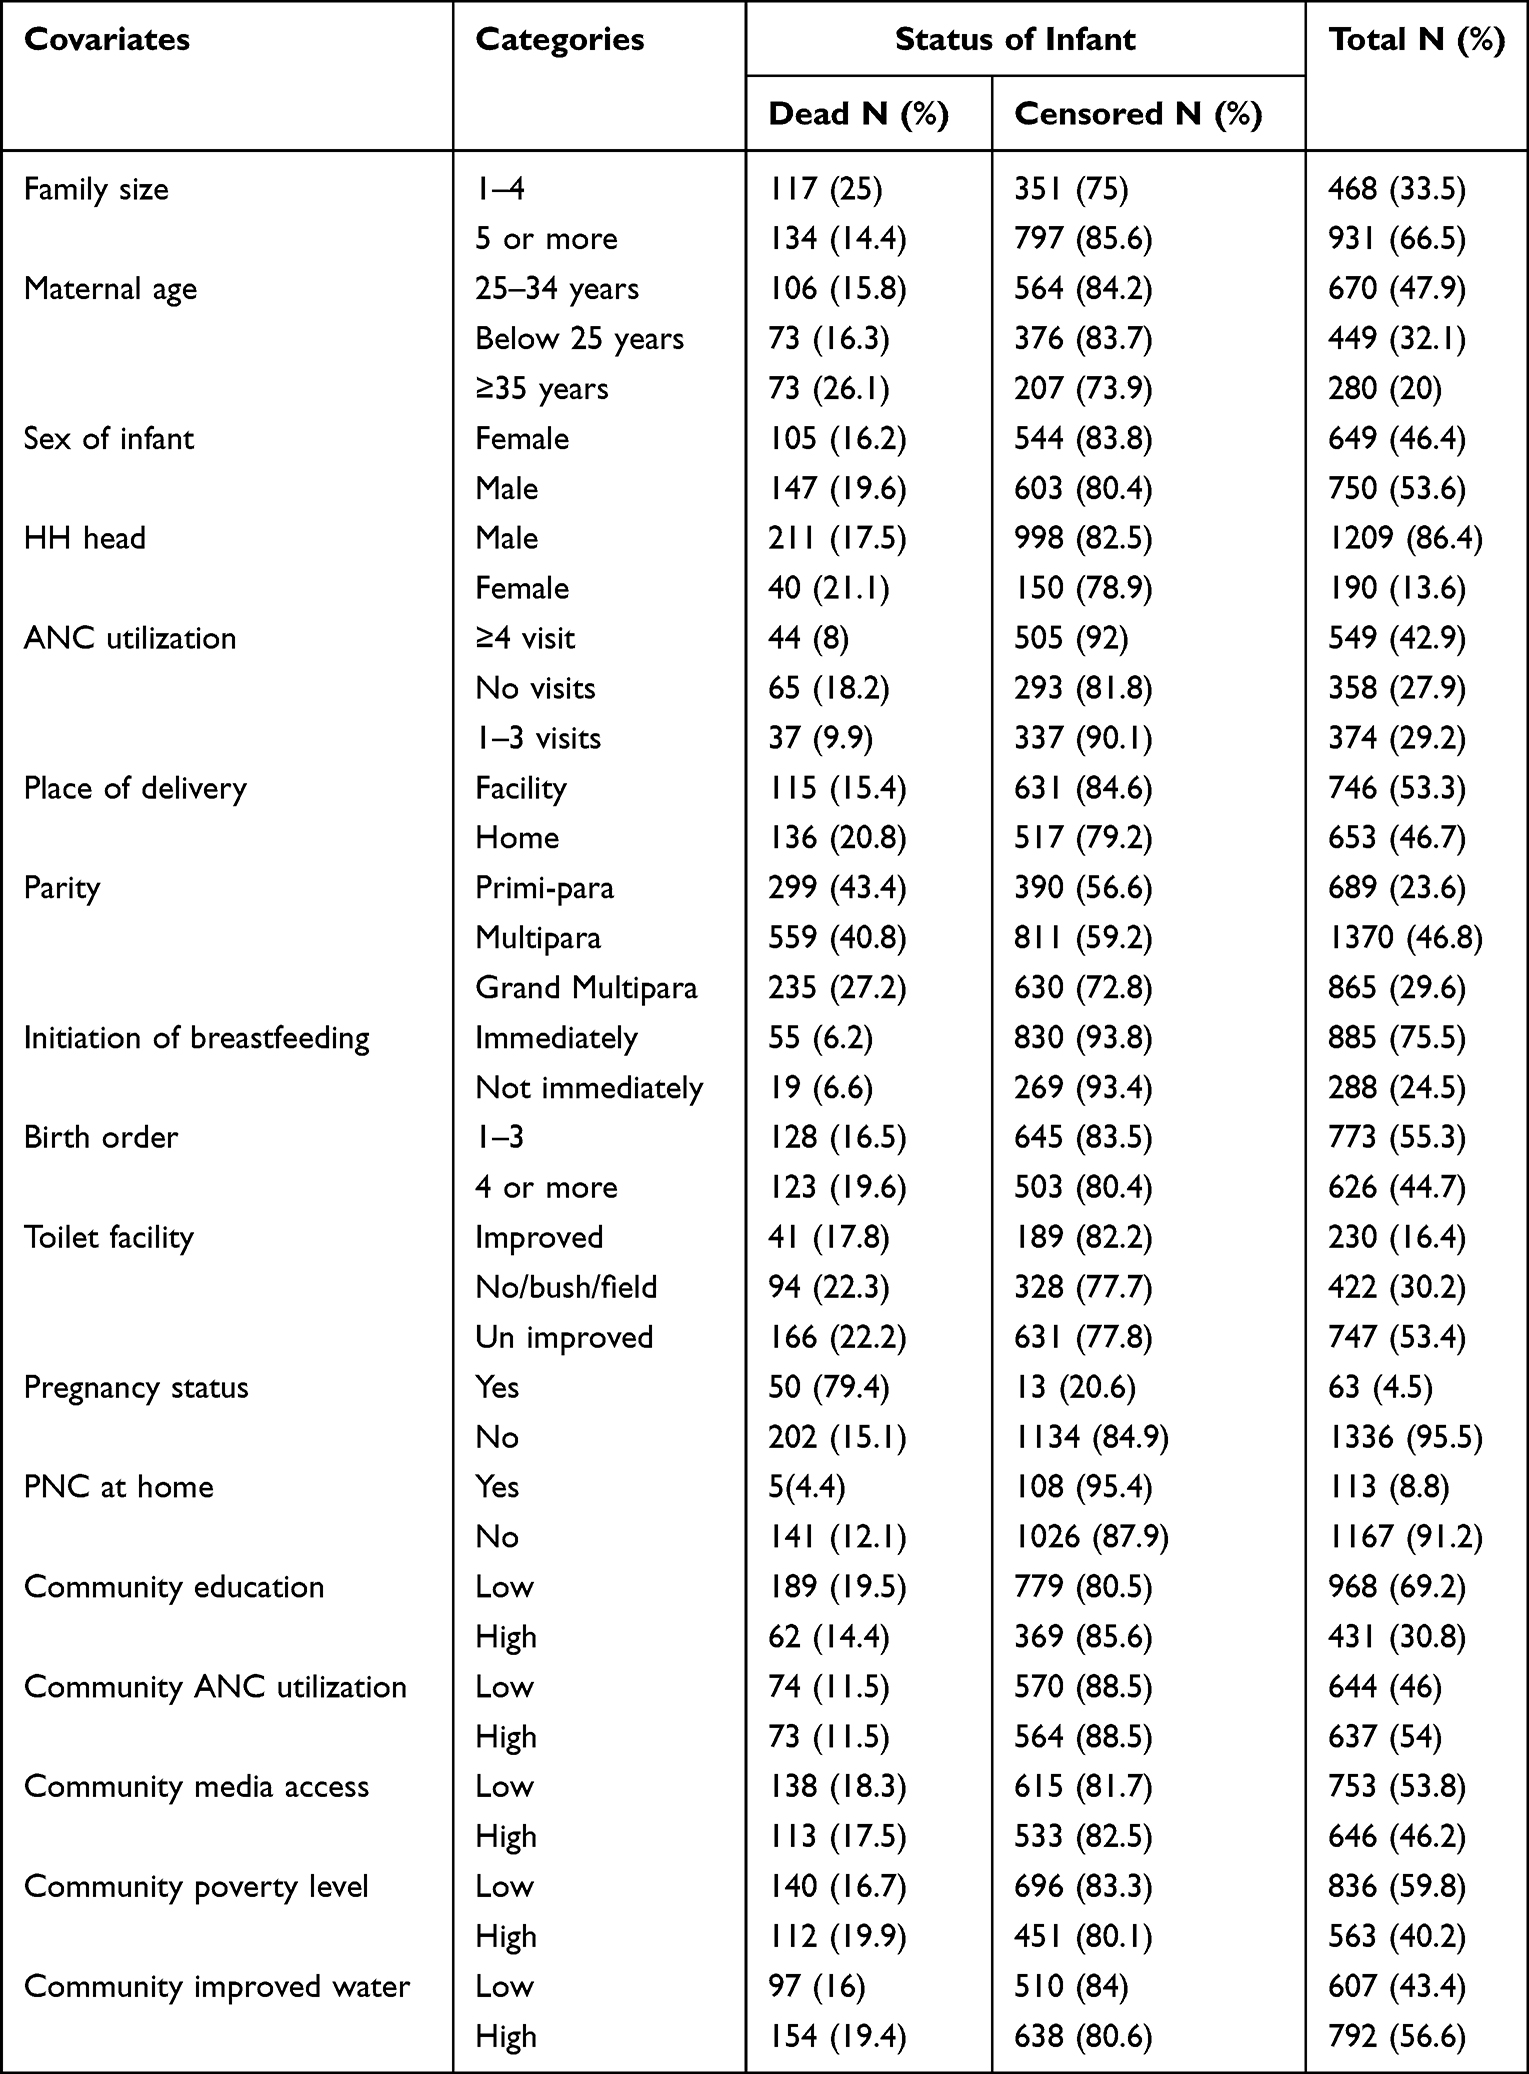 |
Table 1 Summary of Individual and Community-Level Factors of Study Participants (1399), 2022 |
Survival Status of Infants
Three hundred eleven (311) of the 1520 live births (unweighted) who were observed for a full year passed away before entering one year of age. About 4.3% of the babies did not make it past their first year of life. Two-thirds (66.9%) of infant deaths occurred during the neonatal period, usually right after birth (Figure 2).
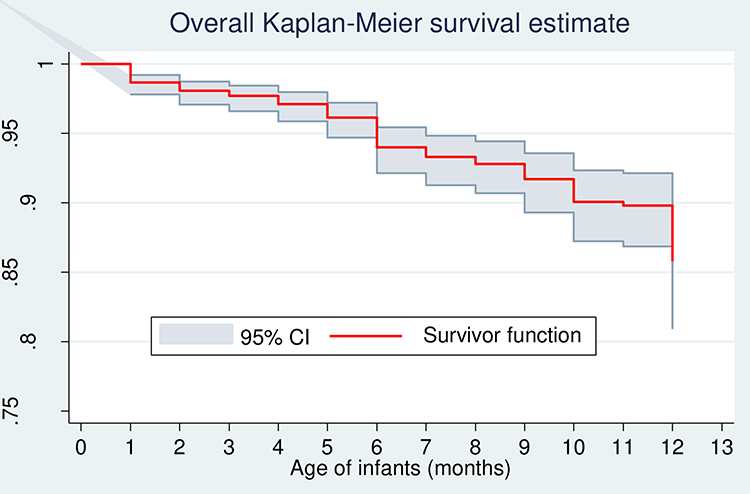 |
Figure 2 Overall Kaplan–Meier survival estimate. |
The estimated mean (restricted) survival time was 11.3 months (95% CI: 11.1, 11.4) at the end of the follow-up period, and the cumulative probability of survival was 66.0% (95% CI: 0.63, 0.69). The cumulative survival probability of infants before 1 month of age and at the end of 6 months was 85.8% (95% CI: 0.84, 0.87), and 76.8% (95% CI: 0.74, 0.79), respectively. The overall incidence rate was found to be 10 per 1000 person month of observation.
There was a statistically significant difference in the likelihood of survival between infants delivered vaginally and by cesarean. The risk of death among cesarean-section-delivered infants was significantly higher and different from their counterparts (Figure 3).
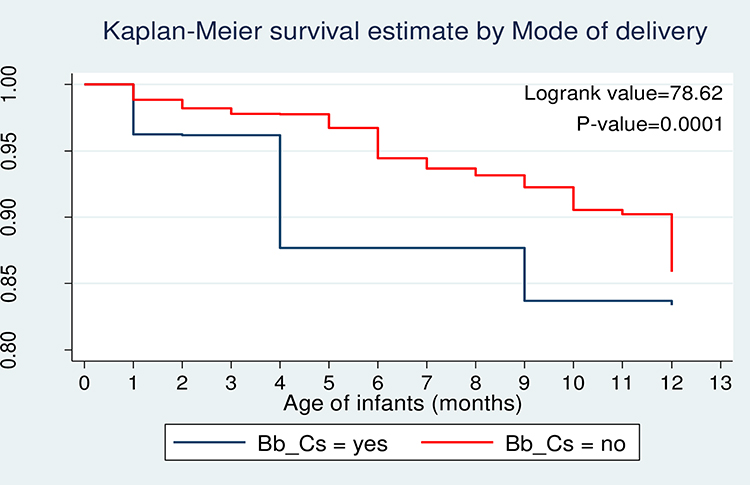 |
Figure 3 Kaplan–Meier survival estimate by mode of delivery. |
Log Rank Tests
There were statistically significant differences across the categories for women’s current pregnancy status, place of delivery, mother’s present age, region, community poverty, community education, community water supply, and community media access. In addition, none of the following factors were significant at the 20% level of significance: roof material, residency, community ANC use, or gender of the infant (Table 2).
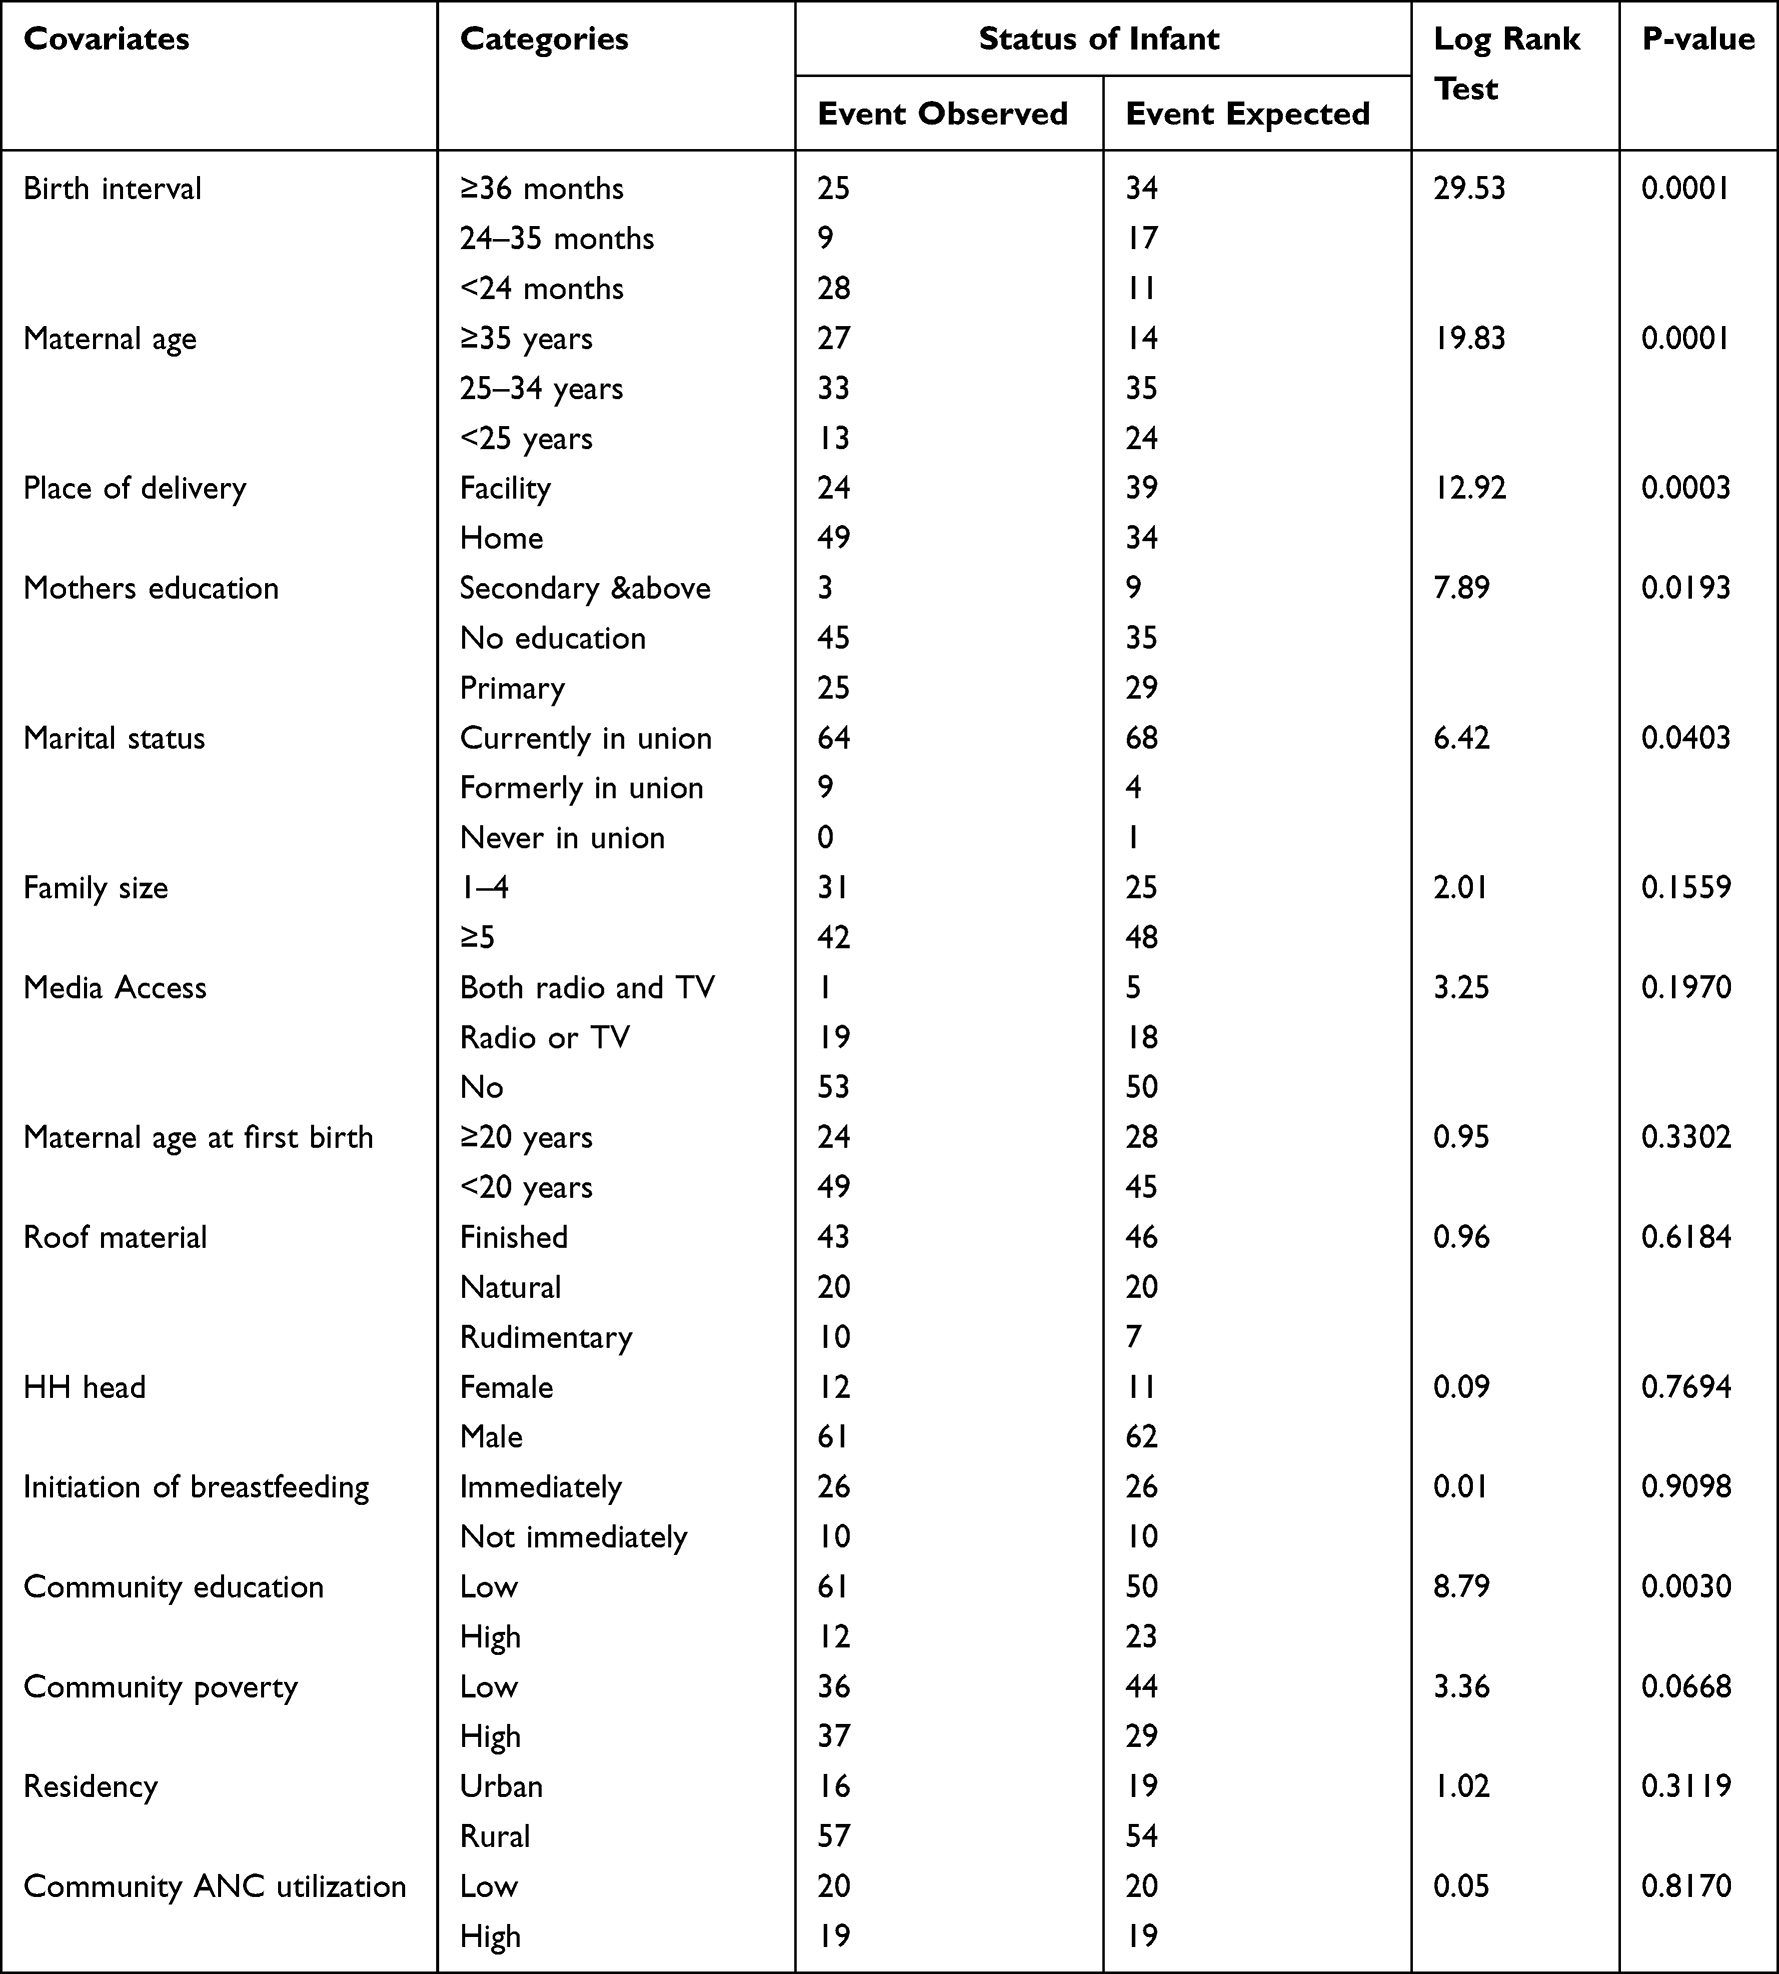 |
Table 2 Comparison of Log Rank Test of Some Individual and Community-Level Factors Among Study Participants (1399), 2022 |
Interpretation of the Multilevel Weibull Model results
The results of the multilevel mixed-effects Weibull survival analysis of predictors of infant mortality are provided in Table 3.
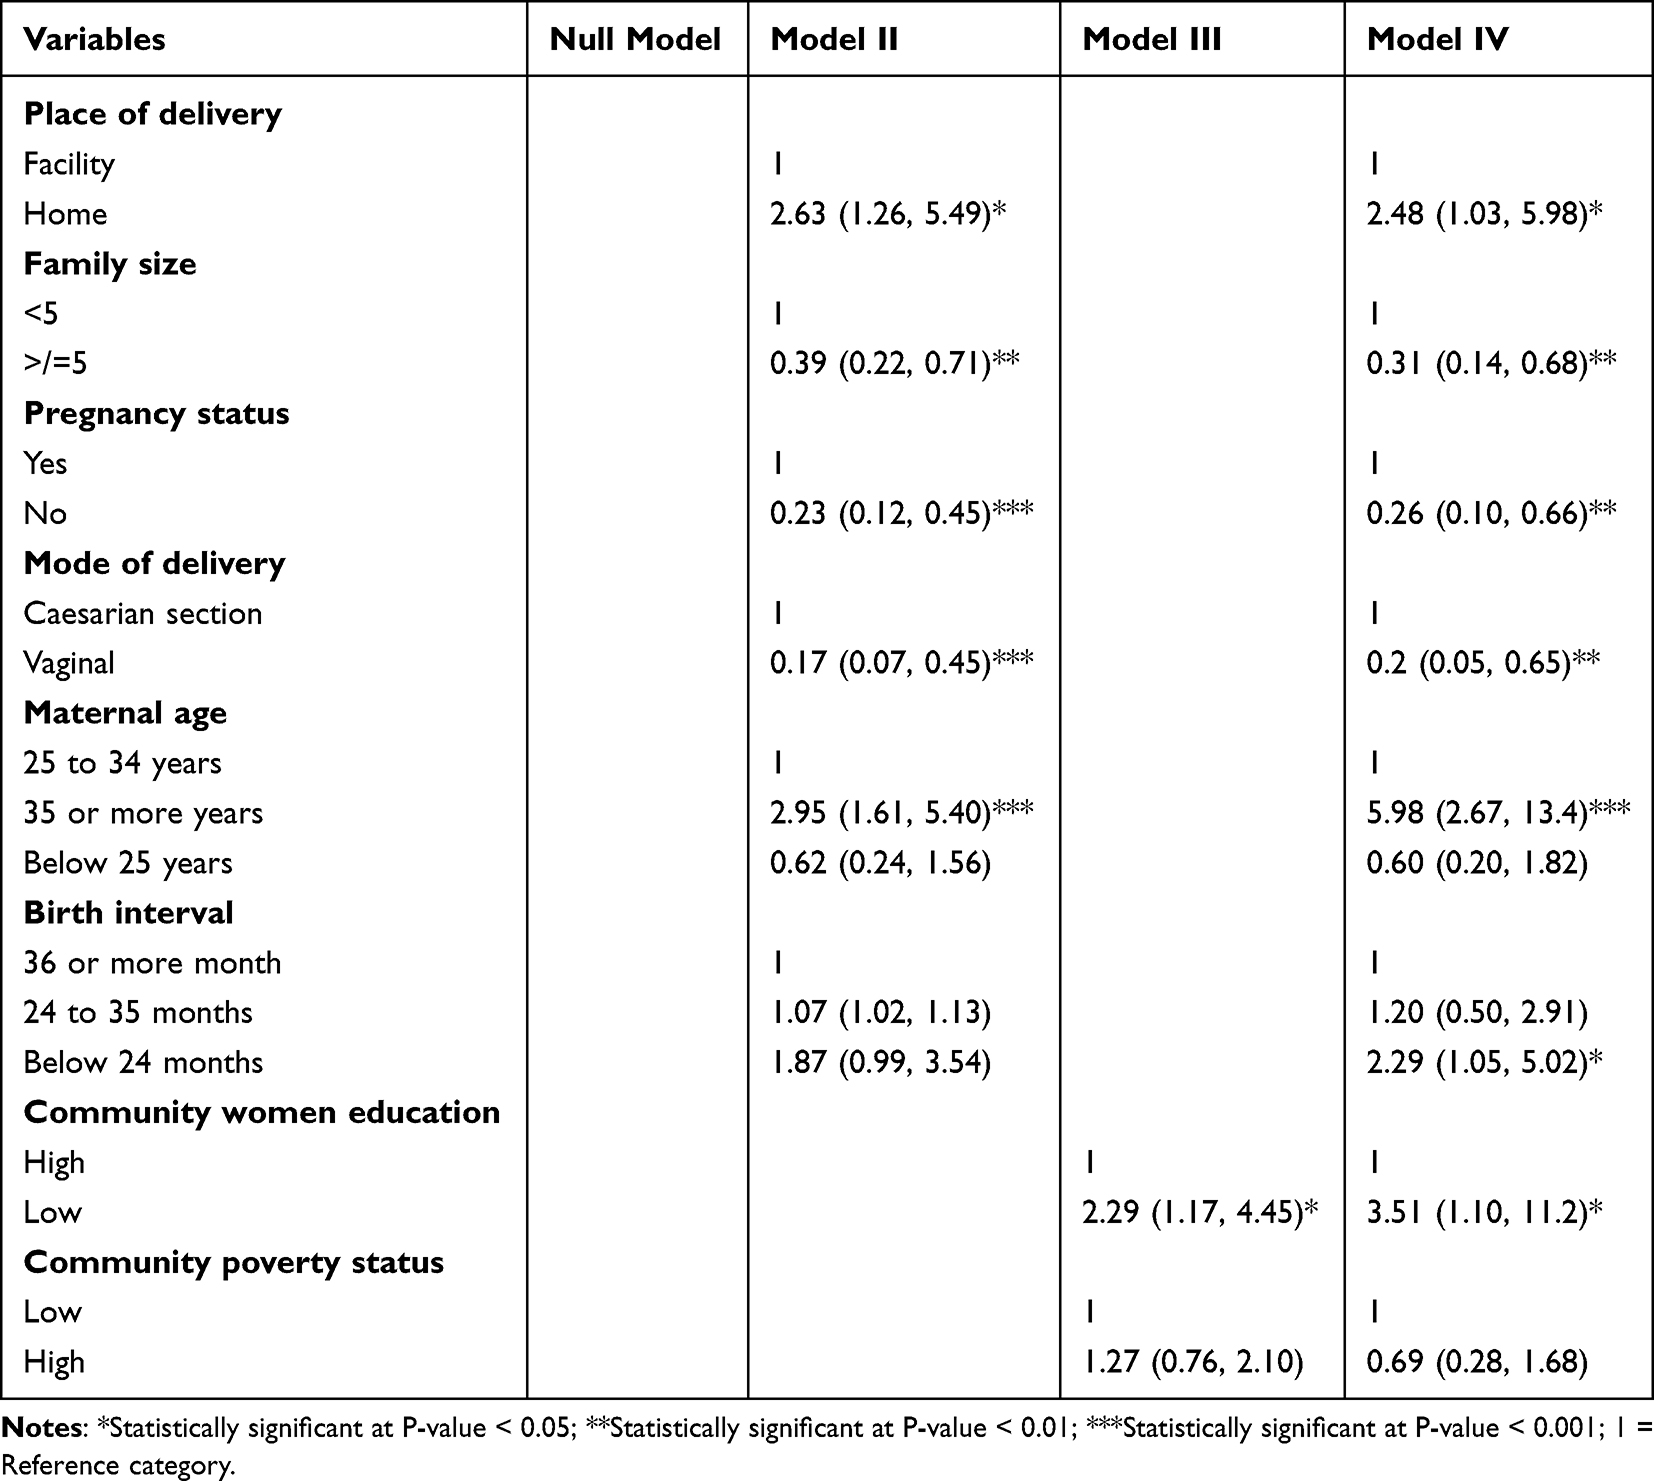 |
Table 3 Multilevel Mixed-Effects Weibull Survival Regression Results Among Study Participants (1399), 2022 |
Preceding birth interval in months was found to be associated with infant death. The estimated risk of death among infants born less than 24 months interval was 2.29 times higher (AHR = 2.29, 95% CI: 1.05, 5.02) than those born 36 and above months interval.
The place of delivery was also associated with infant mortality. The risk of mortality among infants delivered at home was 2.48 times higher compared to infants born in a health facility (AHR = 2.48, 95% CI: 1.03, 5.98).
Maternal age was a strong predictor of infant mortality. The risk of mortality among infants born to mothers of age 35 or more years was 5.98 times higher compared to infants born to mothers whose age is between 25 and 34 years (AHR = 5.98, 95% CI: 2.67, 13.4).
The mortality risk of an infant was found to have an association with a mode of delivery. An infant delivered by the vaginal route had an 80% lowered risk of death relative to those delivered by Caesarean section (AHR = 0.20, 95% CI: 0.05, 0.65). Similarly, the risk of death among infants whose mothers were not pregnant was 0.74 times lower than infants whose mothers were currently pregnant (AHR = 0.26, 95% CI: 0.10, 0.66).
Family size was also a significant predictor of infant mortality. The risk of mortality among infants whose family size was 5 or more was lowered by 69% compared to infants with a family size of 1 to 4 members (AHR = 0.31, 95% CI: 0.14, 0.68).
The adjusted hazard ratio for infants from a community with a low maternal secondary and higher education was 3.51 (95% CI: 1.10, 11.2). Thus, infants born to women from a community with a low maternal secondary and higher education had a 3.51 times higher mortality risk relative to those born to women from a community with high maternal secondary and higher education (Table 3).
Random Effects and Model Comparison
The results presented in Table 4 show that Model I (Null model) revealed statistically significant variation in infant mortality across communities. According to the findings (ICC = 24.8%), community-level factors account for 24.8% of the variation in infant mortality (Table 4).
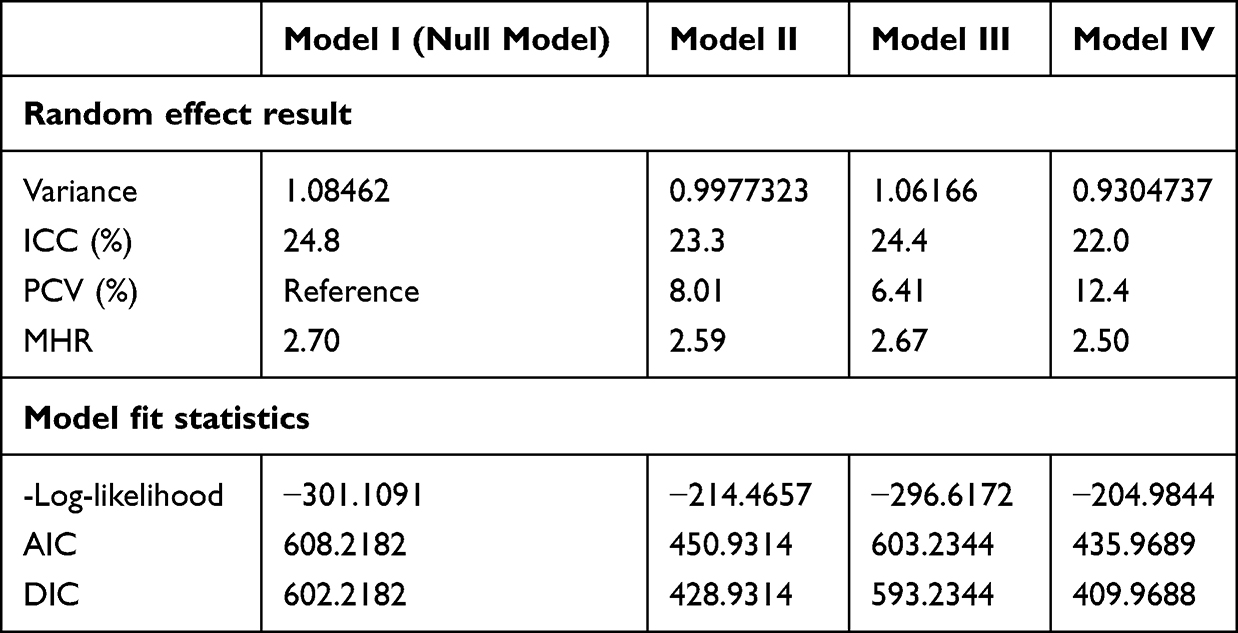 |
Table 4 Measure of Variation and Model Fitness |
The final best-fit model (Model IV) was simultaneously modified for both individual- and community-level factors. Individual and community-level factors together accounted for about 12.4% (PCV = 12.4%) of the variation in infant mortality between clusters. Furthermore, the MHR verified that community-level factors were responsible for infant mortality. The infant mortality disparity between communities that were unexplained in the null model was reduced by 0.20 in the final model by including both individual- and community-level factors. This demonstrated that when a baby moved from a high-risk to a low-risk neighborhood, the risk of infant mortality decreased by 80% (Table 4).
Based on the AIC and DIC, the Multilevel mixed-effects Weibull survival model (Model IV) was found to be the best model to fit the data with minimum AIC and DIC values of 435.97 and 409.97, respectively (Table 4).
Discussion
A multilevel mixed-effects parametric survival model was fitted to identify individual and community factors of infant mortality in Ethiopia. According to this study, the mean survival time was approximately 11.3 months (95% CI: 11.1, 11.4). This is significantly higher when compared to Abate’s study,3 which was done in Ethiopia. The median survival time in Abate’s study was 6 months (SD = 0.11; 95% CI: 6.22–7.78).
About 4.3% of infants in this study died before reaching the age of one. The first few months of life were riskier for infants, usually around the time of birth which is when about 66.9% of infant deaths occurred.
This study found that the infant mortality rate in Ethiopia is lower than the previous study in the country,3 those reported in Nigeria,27 and Pakistan,11 but neonatal survival is still difficult in the country. According to a study conducted in Ethiopia, about 4.8% of infants died before their first birthday, and 65% of infant deaths occurred during the neonatal period.3 In Nigeria, the infant mortality rate was estimated to be as high as 67 deaths per 1000 live births in 2018 and about three of every five infant deaths (59%) occurred before the first month.27 In Pakistan, infant mortality was reported to be 62 deaths per 1000 live births for the recent round of the Pakistan DHS 2017–18.11
Short birth interval is a strong predictor of infant mortality. This evidence concurs with other similar studies.3,8,11,26,28
This evidence might be a result of births being spaced out properly, giving the family more time to build their capacity to give the child the finest care possible on an emotional and financial level. Furthermore, this could be due to the fact that shorter preceding birth intervals are linked to an increased risk of preterm birth, low birth weight, and IUGR for subsequent births.26 Since the World Health Organization recommends waiting 2 years after a live birth for birth spacing29 and the Ministry of Health of Ethiopia recommends waiting at least 3 years before attempting the next pregnancy,30 this finding calls birth spacing in Ethiopia as per the national recommendation.
This study indicated that infants delivered at home had a significantly higher risk of mortality than those delivered in a healthcare facility. Different studies around the world supported this finding. In Pakistan, institutional delivery was shown to be strongly associated with infant mortality.11 A study done in SSA using recent DHS data from 33 SSA nations revealed that the risk of death for infants born at home was much higher than the risk for infants born at a health institution.8 According to a study conducted in rural Ethiopia, infants born at a health institution had lower mortality rates than those born at home.26
Contrary to a study conducted in SSA that found that giving birth in a healthcare facility increased the risk of infant mortality,21 this finding indicated no such association. Some earlier studies on infant survival also revealed no such significant difference in survival rates between infants born at home and in a healthcare facility.3,27,31 This outcome can be attributable to a healthcare facility’s availability of skilled birth attendants and contemporary equipment to lessen birth complications. Additionally, women who give birth in a healthcare facility may acquire plenty about optimal infant feeding practices, appropriate birth spacing recommendations, and the right infant immunization schedule.
Our finding revealed that the mode of delivery was a significant predictor of infant mortality. The risk of infant death is significantly lower among infants of vaginal delivery than in cesarean delivery. A possible explanation for this association could be the increased infant morbidity associated with cesarean delivery, particularly respiratory problems. Additionally, prolonged NICU admission will occur, which may also predispose infants to nosocomial infections. Studies from around the world support this finding.10,32
This study also demonstrated that infants of women who were not pregnant had a reduced risk of death compared to infants of women who were currently pregnant. This might be due to the fact that when a woman gets pregnant, she starts to focus on her unborn child and herself, while giving less attention and care for the born child. Those infants might not be able to protect themselves against infectious diseases and nutritional deficiencies resulting from the early weaning of breast milk observed on them.
This study showed a significantly reduced risk of death in infants whose family size was five or more relative to infants of families with a maximum of four members. The availability of adequate family members might remove the effect related to the lack of personal and timely care of infants born to mothers who were mostly occupied with work.
This finding is contrary to a study conducted in Ethiopia,26 which found an increased likelihood of infant death as family size increased. This might be due to the study design, study setting, and study period discrepancy between the previous study and this study. The previous research only studied infant death in rural parts of Ethiopia using the 2016 EDHS data set applying a multi-level logistic regression model.26 Moreover, this variable is not the exact reflection of the total number of offspring, rather it considers all individuals residing in the household.
In this study, infants of mothers with low secondary or higher level education had a higher risk of infant mortality compared to the reference category. This is supported by previous studies conducted in the USA,10 Brazil,33 Nigeria,27 and Ethiopia3 which found the infant death rate decreased with an increase in the level of education of the mother. This is due to the fact that mothers with a higher level of education tend to be more aware of good childcare practices and their child’s health status.3 Engaging in higher education not only helped women to be better informed but also enabled them to have improved job opportunities and healthier lives.10 Evidence suggests that living in an economically and socially deprived community is associated with an increased risk of infant mortality.22
The age of mothers was also a strong predictor of infant mortality. The risk of mortality among infants born to mothers of age 35 or more years was higher compared to the reference group. This evidence is supported by a study conducted in California, USA10 which revealed that younger and older maternal ages were associated with higher infant mortality.
After fitting a multilevel mixed-effects parametric survival analysis, this study identified both individual-level and community-level predictors of infant mortality. This study also showed that Ethiopia’s infant survival rates have improved.
Strength and Limitations
The major strength of the study is the use of a large sample from nationally representative survey data in Ethiopia. The study results were representative of all regions. Additionally, the study tried to incorporate community-level factors. Another advantage of the study is its sophisticated statistical design, which ensures greater reliability of the findings and control of confounding factors.
Despite this, the present study used retrospective birth history information to analyze infant mortality and is likely to suffer from mothers’ recall bias. The effect of memory bias can limit data quality. Furthermore, the EMDHS survey did not incorporate community-level variables like community norms, culture, and beliefs. Child size at birth and women working status are potential individual factors that were not incorporated in the EMDHS survey, therefore, not explored in this study.
Conclusion
This study demonstrated that the survival time of infants in Ethiopia has increased. The statistically significant individual-level predictors of infant mortality were preceding birth interval, family size, maternal age, pregnancy status, place of delivery, and mode of delivery, whereas women’s education was the statistically significant factor predicting infant mortality at the level of the community.
Notwithstanding the above-mentioned, Ethiopia’s education policy needs to emphasize how important it is for women to continue their education past the first nine years of primary school. Although it will take time, this is the most promising solution to the infant and child mortality problems. Healthcare programs should put a strong emphasis on efforts to space out births and make institutional delivery services more readily accessible to mothers. Home-based infant care visits seemed to be as effective, offering the chance to increase immunization uptake, identify danger signs earlier, treat illnesses in newborns and children, and provide a prompt referral.
Abbreviations
AHR, Adjusted Hazard Ratio; ANC, Antenatal Care; CHR, Crude Hazard Ratio; CI, Confidence Interval; DHS, Demographic and Health Survey; EAs, Enumeration Areas; EMDHS, Ethiopian Mini Demographic and Health Survey; HH, Household; ICC, Intraclass Correlation Coefficient; IMR, Infant Mortality Rate; MHR, Median Hazard Ratio; PCV, Proportional Change in Variance; SDGs, Sustainable Development Goals.
Data Sharing Statement
The data sets recorded and analyzed during this study are available in the Measure DHS program repository to all registered users (https://www.dhsprogram.com/data/dataset_admin).
Ethics Approval and Consent to Participate
Ethics review and participant consent were not required for this study because it used secondary data analysis of publicly available survey data from the Measure DHS program. A written letter of permission was secured from the IRB of Demographic and Health Survey (DHS) program data archivists to download and use the data for this study from https://www.dhsprogram.com. This study was performed in line with the principles of the Declaration of Helsinki. The DHS data were kept confidential, and any identifying information was removed. The data was only used for this particular, authorized research project, and it would not be shared with any researchers.
Acknowledgment
The authors would like to thank the MEASURE DHS Project for their free access to the original data of the 2019 Mini Demographic and Health Survey of Ethiopia.
Author Contributions
All authors made a significant contribution to the work reported, whether that is in the conception, study design, execution, acquisition of data, analysis, and interpretation, or in all these areas; took part in drafting, revising, or critically reviewing the article; gave final approval of the version to be published; have agreed on the journal to which the article has been submitted; and agree to be accountable for all aspects of the work.
Funding
There was no funding for this research.
Disclosure
The authors declare that they have no competing interests.
References
1. United Nations, Department of Economic and Social Affairs PD. World mortality 2019: highlights. World mortality 2019. New York, NY; 2019.
2. World Health Organization. Global health observatory: infant mortality rate [Internet]. 2022. Available from: https://www.who.int/data/gho/data/indicators/indicator-details/GHO/infant-mortality-rate.
3. Abate MG, Angaw DA, Shaweno T. Proximate determinants of infant mortality in Ethiopia, 2016 Ethiopian demographic and health surveys: results from a survival analysis. Arch Public Heal. 2020;78(1):1–10.
4. UNICEF. United Nations Inter-agency Group for Child Mortality Estimation (UN IGME), ‘Levels & Trends in child mortality: report 2018. Estim Dev by United Nations Inter-agency Gr Child Mortal Estim [Internet]; 2018: 1–44. Available from: https://data.unicef.org/wp-content/uploads/2018/09/UN-IGME-Child-Mortality-Report-2018.pdf.
5. FMOH. Ethiopian health sector transformation plan. 2015/16 - 2019/20. Fed Democr Repub Ethiop Minist Heal. 2015;20:50.
6. UNICEF. United Nations Inter-agency Group for Child Mortality Estimation (UN IGME), ‘Levels & Trends in Child Mortality: report 2021. Estim Dev by United Nations Inter-Agency Gr Child Mortal Estim; 2021.
7. World Health Organization. World Health Statistics 2022 (Monitoring Health of the SDGs) [Internet]; Geneva: World Health Organization; 2022:1–131. Available from: http://apps.who.int/bookorders.
8. Tiruneh SA, Zeleke EG, Animut Y. Time to death and its associated factors among infants in sub-Saharan Africa using the recent demographic and health surveys: shared frailty survival analysis. BMC Pediatr. 2021;21(1):1–13. doi:10.1186/s12887-021-02895-7
9. EPHI and ICF. Ethiopia mini demographic and health survey 2019 [Internet]. Addis Ababa, Ethiopia, and Rockville, Maryland, USA; 2019. Available from: www.DHSprogram.com.
10. Ratnasiri AW, Lakshminrusimha S, Dieckmann RA, et al. Maternal and infant predictors of infant mortality in California, 2007 – 2015. PLoS One. 2020;15(8):e0236877. doi:10.1371/journal.pone.0236877
11. Patel KK, Rai R, Rai AK. Determinants of infant mortality in Pakistan: evidence from Pakistan Demographic and Health Survey 2017–18. J Public Heal. 2021;29(3):693–701. doi:10.1007/s10389-019-01175-0
12. Ekholuenetale M, Wegbom AI, Tudeme G, Onikan A. Household factors associated with infant and under-five mortality in sub-Saharan Africa countries. Int J Child Care Educ Policy. 2020;14(1):1–15. doi:10.1186/s40723-020-00075-1
13. Ministry of Health-Ethiopia (MoH). Essential Health Services Package of Ethiopia; Vol. 0397. Ministry of Health-Ethiopia; 2019:1–456.
14. CSA and ICF. Ethiopia demographic and health survey 2016. Addis Ababa, Ethiopia, and Rockville, Maryland, USA; 2016.
15. United Nations. World Population Prospects 2022 [Internet]. United Nations Publication; 2022. Available from: www.unpopulation.org.
16. UNICEF. Children fact sheet 2018; 2018.
17. WHO&UNICEF. Progress on drinking water and sanitation: 2014 UPDATE; 2014.
18. World Health Organization. WHO Recommendations on Antenatal Care for a Positive Pregnancy Experience [Internet]. World Health Organization; 2016. Available from: www.who.int.
19. StataCorp. Survival Analysis Reference Manual Release 17 [Internet]. Stata Press; 2021. Available from: https://www.stata.com/bookstore/survival-analysis-reference-manual/.
20. Kleinbaum DG, Klein M. Survival Analysis: A Self-Learning Text [Internet].
21. Collett D. Modelling Survival Data in Medical Research.
22. Tsegay G, Id K, Chojenta C, Barker D, Loxton D. Individual-, household- and community-level determinants of infant mortality in Ethiopia. PLoS One. 2021;1–19. doi:10.1371/journal.pone.0248501
23. Crowther MJ. Multilevel mixed-effects parametric survival analysis: estimation, simulation, and application. Stata J. 2019;19(4):931–949. doi:10.1177/1536867X19893639
24. StataCorp. Stata Multilevel Mixed-Effects Reference Manual Release 17 [Internet]. Stata Press; 2021. Available from: https://www.stata.com/manuals/me.pdf.
25. Austin PC, Stryhn H, Leckie G, Merlo J. Measures of clustering and heterogeneity in multilevel Poisson regression analyses of rates/count data. Stat Med. 2018;37(4):572–589. doi:10.1002/sim.7532
26. Fenta SM, Ayenew GM, Fenta HM, Biresaw HB, Fentaw KD. Community and individual level determinants of infant mortality in rural Ethiopia using data from 2016 Ethiopian demographic and health survey. Sci Rep. 2022;12(1):16879. doi:10.1038/s41598-022-21438-3
27. Kunnuji M, Eshiet I, Ahinkorah BO, Omogbemi T, Yaya S. Background predictors of time to death in infancy: evidence from a survival analysis of the 2018 Nigeria DHS data. BMC Public Health. 2022;22(1):1–8. doi:10.1186/s12889-021-12424-x
28. Dadi AF, Carlo WA. A systematic review and meta-analysis of the effect of short birth interval on infant mortality in Ethiopia. PLoS One. 2015;10(5):1–11. doi:10.1371/journal.pone.0126759
29. World Health Organization. Report of a WHO technical consultation on birth spacing. Rep WHO Tech Consult Birth Spacing. 2005;13(6):1–44.
30. FMoH. National guideline for family planning federal democratic republic of Ethiopia. Fed Democr Repub Ethiop Minist Heal. 2011;2011:1–69.
31. Naz L, Patel KK. Determinants of infant mortality in Sierra Leone: applying Cox proportional hazards model. Int J Soc Econ. 2020;47(6):711–726. doi:10.1108/IJSE-08-2019-0478
32. Adewuyi EO, Zhao Y, Lamichhane R. Risk factors for infant mortality in rural and urban Nigeria: evidence from the national household survey. Scand J Public Health. 2017;45(1):1–12. doi:10.1177/1403494816683297
33. Anele CR, Hirakata VN, Goldani MZ, da Silva CH. The influence of the municipal human development index and maternal education on infant mortality: an investigation in a retrospective cohort study in the extreme south of Brazil. BMC Public Health. 2021;21(1):1–12. doi:10.1186/s12889-021-10226-9
 © 2023 The Author(s). This work is published and licensed by Dove Medical Press Limited. The
full terms of this license are available at https://www.dovepress.com/terms
and incorporate the Creative Commons Attribution
- Non Commercial (unported, 3.0) License.
By accessing the work you hereby accept the Terms. Non-commercial uses of the work are permitted
without any further permission from Dove Medical Press Limited, provided the work is properly
attributed. For permission for commercial use of this work, please see paragraphs 4.2 and 5 of our Terms.
© 2023 The Author(s). This work is published and licensed by Dove Medical Press Limited. The
full terms of this license are available at https://www.dovepress.com/terms
and incorporate the Creative Commons Attribution
- Non Commercial (unported, 3.0) License.
By accessing the work you hereby accept the Terms. Non-commercial uses of the work are permitted
without any further permission from Dove Medical Press Limited, provided the work is properly
attributed. For permission for commercial use of this work, please see paragraphs 4.2 and 5 of our Terms.