Back to Journals » Clinical Epidemiology » Volume 10
Thyroid function and atrial fibrillation: Is there a mediating role for epicardial adipose tissue?
Authors Bos D, Bano A, Hofman A, VanderWeele TJ, Kavousi M, Franco OH, Vernooij MW, Peeters RP, Ikram MA, Chaker L
Received 15 August 2017
Accepted for publication 23 October 2017
Published 1 March 2018 Volume 2018:10 Pages 225—234
DOI https://doi.org/10.2147/CLEP.S149151
Checked for plagiarism Yes
Review by Single anonymous peer review
Peer reviewer comments 3
Editor who approved publication: Professor Vera Ehrenstein
Daniel Bos,1–3,* Arjola Bano,2,4,5,* Albert Hofman,1,2 Tyler J VanderWeele,1 Maryam Kavousi,2 Oscar H Franco,2 Meike W Vernooij,2,3 Robin P Peeters,2,4,5 M Arfan Ikram,1,2 Layal Chaker,1,2,4,5
1Department of Epidemiology, Harvard T.H. Chan School of Public Health, Boston, MA, USA; 2Department of Epidemiology, Erasmus MC, Rotterdam, The Netherlands; 3Department of Radiology and Nuclear Medicine, Erasmus MC, Rotterdam, The Netherlands; 4Academic Center for Thyroid Diseases, Erasmus MC, Rotterdam, The Netherlands; 5Department of Internal Medicine, Erasmus MC, Rotterdam, The Netherlands
*These authors contributed equally to this work
Background: The underlying mechanism of the association between thyroid function and atrial fibrillation (AF) is poorly understood, but epicardial adipose tissue (EAT) could be a promising mediator.
Methods: In the 1995 participants (mean age 64.5 years) from the population-based Rotterdam Study, we measured thyroid function (thyroid-stimulating hormone, free thyroxine [FT4]) and performed computed tomography to quantify EAT volumes. All participants were followed for the occurrence of AF. We assessed associations of thyroid-stimulating hormone and FT4 with EAT and AF and performed causal mediation analysis to decompose the overall effect of thyroid function on AF with EAT as mediator.
Results: Higher FT4 levels were associated with larger EAT volumes in persons with large waist circumferences, defined by sex-specific cutoffs (0.08 mL more EAT per 1-SD increase in FT4, 95% CI: 0.02, 0.14), but not in persons with a normal waist circumference. In persons with a large waist circumference, higher FT4 levels were associated with a higher AF risk (hazard ratio 1.50, 95% CI: 1.22, 1.83). We found no evidence of a mediating role of EAT in the association of thyroid function with AF (mediated interaction 1.6%, pure indirect effect 3.2%). The estimate of reference interaction of EAT with thyroid function on AF risk was more substantial (10.8%), but statistically nonsignificant.
Conclusions: Higher FT4 levels are associated with larger EAT volumes in persons with abdominal obesity. We report no mediating role of EAT in the association of thyroid function with AF, but found evidence for a suggested interaction of FT4 with EAT volumes on AF risk.
Keywords: thyroid function, epicardial fat, atrial fibrillation, causal mediation analysis
Introduction
The association of high and high-normal thyroid function with atrial fibrillation (AF) has been established in several large studies and meta-analyses.1–3 Possible pathophysiological mechanisms include direct effects of thyroid hormone on the sympathetic nervous system and indirect effects through accumulation of cardiovascular risk factors. However, the link between thyroid function and AF seems largely independent of traditional cardiovascular risk factors such as blood pressure, diabetes, and cholesterol.1,2 This suggests that yet unexplored cardiovascular risk factors or alternative pathways could mediate the association of thyroid dysfunction with AF. Further elucidation of these mediators is not only important for pathophysiological understanding but, possibly, also for future treatment decisions (i.e., treatment targeted at thyroid dysfunction, modifiable mediators, or both).
Against this background, epicardial adipose tissue (EAT) might be of great interest. EAT is a rapidly emerging risk factor for cardiovascular disease, and particularly for AF.4,5 Thyroid hormones may be linked to EAT through several mechanisms. For example, thyroid hormones act on pathways leading to atherogenesis, including endothelial damage and increased procoagulation factors,6 which are in turn closely related to EAT increase. Thyroid hormones may also exert direct effects on EAT by activating adipose tissue, mainly brown adipose tissue. Thyroid hormones are important for energy regulation and thermogenesis. Thyroid hormone excess leads to an increase in basal metabolic rate and thermogenesis, and patients with hyperthyroidism often present with weight loss. However, thyroid hormones have also been shown to play a role in brown adipose tissue activity and white adipose tissue browning.7 In mice, lack of thyroid hormone reduces activity of brown adipose tissue, while hyperthyroidism shows an increase in brown adipose tissue mass.8 EAT is generally perceived as solely consisting of white adipose tissue.4 This concept is under debate since brown adipose tissue-specific genes, UCP1 gene in particular, have been identified in human EAT, suggesting that EAT additionally possesses brown adipose tissue-like characteristics.4
Hence, EAT may represent a potential explanation for the association of high thyroid function with AF. In the past years, several small studies (n<100 participants) have indicated a possible role of hypothyroidism or hyperthyroidism on EAT formation and progression.9–13 This association has neither been explored in larger studies, nor has it been investigated in the full range of thyroid function in the general population. Hence, we aimed to assess the association of thyroid function with EAT measured by computed tomography and to investigate whether EAT is a mediator of the association of thyroid function with AF in a large population-based cohort study.
Methods and materials
Setting and study population
The study was performed in the context of the Rotterdam Study (RS), a prospective population-based cohort study that investigates determinants and occurrence of cardiovascular, neurological, ophthalmologic, psychiatric, and endocrine diseases in the middle-aged and elderly population. The aims and design of the Rotterdam Study have been described in detail elsewhere.14 We included participants from two independent cohorts within the Rotterdam Study. The first subcohort (RSI) includes participants aged ≥55 years, and baseline data were collected during 1990–1993. The second subcohort (RSII) includes participants aged ≥55 years, and baseline data were collected from 2000 to 2001. Between 2003 and 2006, all participants who visited the research center were invited to undergo a multidetector computed tomography (MDCT) examination on which the amount of epicardial fat was assessed. This was part of a larger project on the assessment of vascular calcification. In total, 2524 participants were scanned.
The study protocol was approved by the Medical Ethics Committee of the Erasmus University and by the Ministry of Health, Welfare and Sport of the Netherlands, implementing the “Wet Bevolkingsonderzoek: ERGO (Population Studies Act: Rotterdam Study)”. All included participants provided written informed consent in accordance with the Declaration of Helsinki to participate in the study and to obtain information from their family physicians.
For the current study, we included all participants from the Rotterdam Study, cohort I wave 3 and cohort II wave 1, with available thyroid function measurements, CT EAT measurements (assessed after laboratory measurement in all participants), and data on AF incidence. We excluded participants using thyroid function altering medication (levothyroxine, antithyroid drugs, amiodarone, or corticosteroids) and with prevalent AF at baseline. Eligible participants were followed up for incident AF events from CT EAT measurement onward. Detailed information on the selection of study participants is provided in Figure 1.
 | Figure 1 Flowchart for the selection of study participants. Notes: Baseline measurements for the present study were performed during the cohort I wave 3 and cohort II wave 1 of the Rotterdam Study. Thyroid function was assessed at baseline. Epicardial adipose tissue volumes were measured by CT scans, which were performed in cohort I wave 4 and cohort II wave 2 of the Rotterdam Study. The median time between CT scans and laboratory measurements was 4.6 years. Eligible participants were followed up for incident AF events from CT assessment onward. Abbreviations: AF, atrial fibrillation; CT, computed tomography. |
Assessment of thyroid function
Thyroid function was measured through thyroid-stimulating hormone (TSH) and free thyroxine (FT4) using the same methods and assay for all cohorts (The electrochemiluminescence immunoassay for thyroxine and thyrotropin [ECLIA], Roche Diagnostics International Ltd, Rotkreuz ZG, Switzerland) in serum samples stored at −80°C. We determined the reference values for normal range TSH as 0.4–4.0 mIU/L and for FT4 as 11–25 pmol/L (=0.85–1.95 ng/dL) according to national guidelines as well as our previous studies.1,15
Assessment of epicardial fat volume
Non-contrast MDCT images were acquired using 16-slice (n=593) or 64-slice (n=1402) MDCT scanners (Somatom Sensation 16 or 64, Siemens, Forchheim, Germany). Detailed information on the imaging parameters are described elsewhere.16 We used an ECG-gated cardiac scan to visualize the epicardium, and applied a previously described, fully automatic tool to quantify the amount of epicardial fat in milliliters.17
Assessment of atrial fibrillation
For the assessment of AF during follow-up, three methods are used in the Rotterdam Study and have been described in detail previously.18,19 First, electrocardiograms (ECGs) were recorded at study entry and at each follow-up examination and analyzed with the Modular ECG Analysis System (MEANS).20,21 All ECGs with a diagnosis of AF, atrial flutter, or any other rhythm disorder were reviewed by two independent research physicians who were blinded to the MEANS diagnosis. In case of disagreement, a senior specialist was consulted and the final decision was made. Second, information on AF was obtained through general practitioners’ records, which included their own results as well as hospital discharge letters and outpatient clinic reports. Third, the national medical registry of all hospital discharge diagnoses was linked to the Rotterdam Study database. Any cases detected through linkage were verified by review of the medical records. Participants who developed AF as a consequence of severe systemic illness (e.g., septic shock), resulting in death shortly after the detection of AF, were not considered to have AF. Furthermore, participants with transitory AF during myocardial infarction (MI) or after thoracic surgery were not considered as AF cases. All potential new diagnoses of AF were adjudicated by two independent research physicians, and in case of disagreement, consensus was sought. In case of persistent disagreement, a senior specialist made the final decision. Given that AF and atrial flutter are similar with respect to risk factors and consequences, these conditions were combined into a single composite outcome.22 Follow-up for AF was completed by January 1, 2014.
Assessment of other variables
We collected detailed information on cardiovascular risk factors and medication use in a standardized fashion by interview, physical examination, and blood sampling. Waist circumference was measured and expressed in centimeters. Waist circumference was stratified according to sex-specific clinical cutoffs. For women, normal waist circumference was defined as ≤88 cm, while large waist circumference was defined as >88 cm. For men, normal waist circumference was defined as ≤102 cm, while large waist circumference was defined as >102 cm. Systolic and diastolic blood pressure were measured twice at the right brachial artery using random-zero sphygmomanometer, and the mean of the two measurements was used for analyses. Fasting blood samples were obtained, and serum total cholesterol and high-density lipoprotein (HDL) cholesterol were measured using an automatic enzymatic procedure (Hitachi analyzer, Roche Diagnostics). Information on lipid-lowering and antihypertensive medication use was derived from questionnaires and pharmacy information. Smoking information was derived from baseline questionnaires and categorized into never, previous, and current smokers. Alcohol use information was derived from questionnaires and recorded as grams per day. History of diabetes was defined by a repeated (two measurements within 1 year) impaired fasting glucose ≥7 mmol/L or a non-fasting glucose ≥7 mmol/L (when fasting samples were absent) or use of anti-glycemic medication at baseline. Prevalent coronary heart disease was ascertained as previously described and consisted of a prior MI or revascularization.19
Statistical analyses
We analyzed the association of thyroid function (i.e., FT4 or TSH) with EAT with ordinary least-squared regression models. The association of thyroid function or EAT with AF was investigated by Cox-proportional hazards regression models. We used restricted cubic splines at three knots for all covariates in our analyses to assess and account for possible nonlinearity of the associations, but no evidence of nonlinearity was observed.
All primary analyses were performed for three models. Potential confounders were selected based on biological plausibility and previous literature (Figures S1–S5). The first model was adjusted for age, sex, cohort, smoking, alcohol use, and time between laboratory measurement and CT scan. In the second model, we additionally adjusted for cardiovascular risk factors, including total cholesterol, HDL cholesterol, lipid-lowering medication, systolic blood pressure, diastolic blood pressure, antihypertensive medication prevalent diabetes, and prevalent coronary heart disease. The third model was additionally adjusted for waist circumference (within the waist circumference categories). Of note, the first model was regarded as the primary model for the analyses where thyroid function is the exposure, because all included covariates in the other models are more likely to be possible mediators rather than confounders. For the analyses where EAT is the exposure and AF is the outcome, we additionally adjusted for TSH and FT4 and considered model 2 as the primary model (Figures S1–S4).
Due to the possible differential effect of thyroid function on adiposity in general, in contrast to EAT specifically, we tested interaction of TSH and FT4 with waist circumference on the association with EAT and AF. There was a statistically significant interaction between FT4 and waist circumference on EAT and on the risk of AF, and we therefore stratified the analyses according to sex-specific clinical cutoffs of waist circumference. We considered waist circumference rather than BMI as a marker of obesity, because 1) waist circumference is perceived as a better marker of visceral adiposity as compared to BMI and 2) waist circumference showed better statistical properties as compared to BMI (e.g., statistical significance for the interaction terms while avoiding multicollinearity that occurred when introducing both waist circumference and BMI to the model). The association of thyroid function with waist circumference in our study is provided in Table S1. There was no interaction of thyroid function with sex or age on any of the outcomes.
Given a possible synergic effect of thyroid function and EAT volumes on AF risk, our mediation analysis was based on the approach of a four-way decomposition, which combines methods assessing mediation and interaction. In the four-way decomposition approach, the overall effect of thyroid function on AF with EAT as mediator (with which the thyroid function may interact) is decomposed into four components: 1) the direct effect of thyroid function (i.e., TSH or FT4) on AF in the absence of EAT, 2) the interactive effect when the EAT is at the value it would be in the absence of the thyroid function, 3) a mediated interaction (due to mediation and interaction by EAT), and 4) a pure mediated effect.23 These concepts will be referred to as controlled direct effect, reference interaction, mediated interaction, and pure indirect effect, respectively. The method assumes baseline covariates control for exposure-outcome, mediator-outcome, and exposure-mediator confounding and that there is no mediator-outcome relationship affected by exposure. In order not to violate the final condition, we used the predicted value of these factors on EAT: total cholesterol, HDL cholesterol, lipid-lowering medication, diastolic blood pressure, systolic blood pressure, blood pressure-lowering medication, prevalent CHD, and prevalent diabetes as covariates. We performed a sensitivity analysis including these variables separately in the mediation analysis (Table S2), but no meaningful differences were detected.
We used Z-scores of FT4, TSH, and EAT for all analyses, after log-transformation, when appropriate. Statistical analyses were conducted using R statistical software (rms, Himsc, visreg packages, R-project, Institute for Statistics and Mathematics, R Core Team [2013], Vienna, Austria, version 3.0.2).
Results
We included 1995 participants with valid CT scans, thyroid function measurements, and information on AF follow-up that did not use thyroid-function altering medication (Figure 1). Baseline characteristics of study participants, total and stratified by waist circumference, are shown in Table 1.
 | Table 1 Baseline characteristics of study participantsa Note: aValues are means and (SD) unless otherwise specified. Abbreviations: BMI, body mass index; BP, blood pressure; CHD, coronary heart disease; FT4, free thyroxine; HDL, high-density lipoprotein; IQR, inter-quartile range; TSH, thyroid-stimulating hormone. |
During an overall median follow-up of 12.9 years (interquartile range [IQR] 12.07, 13.70), 109 of 1189 participants with a normal waist circumference and 87 of 806 participants with a large waist circumference developed AF.
Thyroid function and EAT
There was no association of TSH or FT4 with EAT in participants with a normal waist circumference (Table 2). In participants with a large waist circumference, higher values of FT4, but not TSH, were associated with a larger volume of EAT (Beta 0.08 per standardized FT4, 95% CI: 0.02, 0.14; Table 2). This is in contrast to the association of FT4 with waist circumference, where higher FT4 levels were associated with a lower risk of having a large waist circumference (odds ratio 0.84, 95% CI: 0.74, 0.94 per one Z-score increase of FT4; Table S1)
 | Table 2 Association of TSH or FT4 with EAT stratified for waist circumferencea Notes: Model 1 = age, sex, cohort, alcohol, smoking, and time between laboratory measurement and scan; Model 2 = Model 1 + total cholesterol, HDL cholesterol, serum lipid-lowering medication, systolic blood pressure, diastolic blood pressure, blood pressure-lowering medication, prevalent diabetes, prevalent CHD; Model 3 = Model 2 + WC at baseline. aFor both thyroid function parameters and EAT, Z-scores were used in the analysis. WC was stratified according to sex-specific clinical cutoffs. For women, small WC was defined as ≤88 cm, while large WC was defined as >88 cm. For men, small WC was defined as ≤102 cm, while large WC was defined as >102 cm. Abbreviations: CHD, coronary heart disease; EAT, epicardial fat tissue; FT4, free thyroxine; HDL, high-density lipoprotein; TSH, thyroid-stimulating hormone; WC, waist circumference. |
Thyroid function, EAT, and AF
In participants with a normal waist circumference, TSH and FT4 were not associated with incident AF, while larger volumes of EAT were associated with an increased risk of AF with an hazard ratio (HR) of 1.53 per standardized EAT (95% CI: 1.19, 1.97; Table 3). In participants with large waist circumference, TSH was not associated with AF risk. However, FT4 and EAT were both associated with AF risk with HRs of 1.45 (95% CI: 1.20, 1.76) and 1.38 (95% CI: 1.00, 1.89), respectively (Table 3).
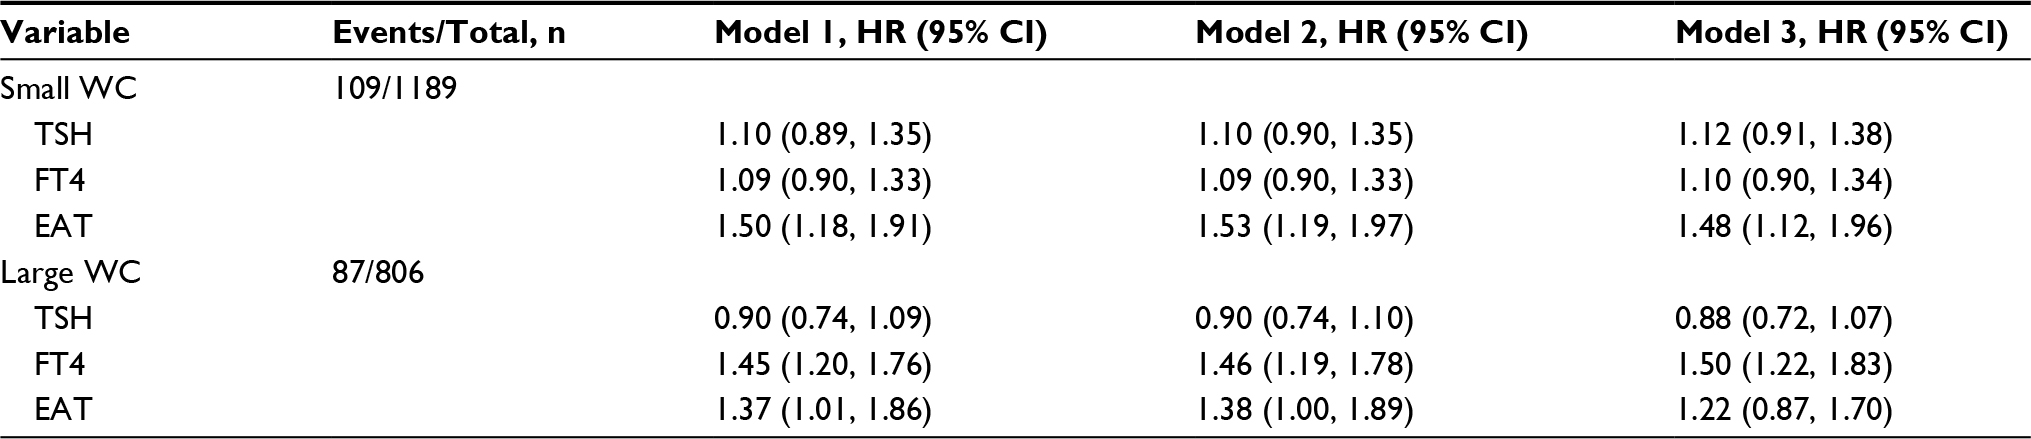 | Table 3 Association of TSH, FT4, and EAT with atrial fibrillation, stratified by waist circumference Notes: Model 1 = age, sex, cohort, alcohol, smoking, and time between laboratory measurement and scan. Model 2 = Model 1 + total cholesterol, HDL cholesterol, serum lipid-lowering medication, systolic blood pressure, diastolic blood pressure, blood pressure-lowering medication, prevalent diabetes, prevalent CHD. Model 3 = Model 2 + WC at baseline. For all EAT analyses models additionally adjusted for TSH and FT4. WC was stratified according to sex-specific clinical cutoffs. For women, small WC was defined as ≤88 cm, while large WC was defined as >88 cm. For men, small WC was defined as ≤102 cm, while large WC was defined as >102 cm. Abbreviations: CHD, coronary heart disease; EAT, epicardial fat tissue; FT4, free thyroxine; HDL, high-density lipoprotein; TSH, thyroid-stimulating hormone; WC waist circumference. |
None of the estimated excess risks of the four components was statistically significant (Table 4). The largest proportion attributable to the effect of FT4 on AF in participants with a large waist circumference was the controlled direct effect (84.4%; excess risk 0.424, 95% CI: −0.065, 0.711; Table 4). The remainder of the overall effect was due to reference interaction (i.e., the interactive effect between FT4 and EAT when the EAT is at the value it would be in the absence of the thyroid function) with a proportion attributable of 10.8% (excess risk 0.054, 95% CI: −0.138, 0.242). The natural indirect effect (i.e., sum of pure indirect effect and mediated interaction) was 0.024 (95% CI: −0.043, 0.063; Table 4).
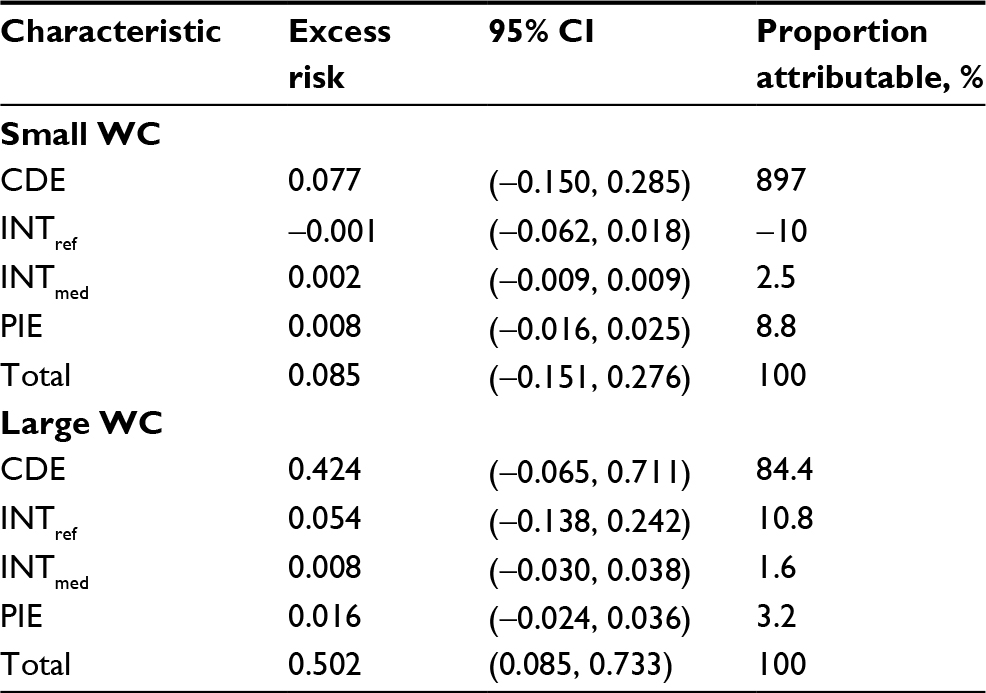 | Table 4 Proportions of the effect of FT4 on AF due to mediation and/or interaction with EAT Notes: WC was stratified according to sex-specific clinical cutoffs. For women, small WC was defined as ≤88 cm, while large WC was defined as >88 cm. For men, small WC was defined as ≤102 cm, while large WC was defined as >102 cm. Analyses for the association of FT4 with EAT and AF were adjusted for age, sex, cohort, alcohol, and smoking. Analyses for the association of EAT with AF were additionally adjusted for total cholesterol, HDL cholesterol, serum lipid-lowering medication, systolic blood pressure, diastolic blood pressure, blood pressure-lowering medication, prevalent diabetes, prevalent CHD, TSH, and FT4 levels. Abbreviations: AF, atrial fibrillation; CDE, controlled direct effect; CHD, coronary heart disease; EAT, epicardial fat tissue; FT4, free thyroxine; HDL, high-density lipoprotein; INTref, reference interaction; INTmed, mediated interaction; PIE, pure indirect effect; TSH, thyroid-stimulating hormone; WC, waist circumference. |
Discussion
In this large sample of community-dwelling middle-aged and elderly subjects, higher FT4 levels among participants with a large waist circumference were associated with larger EAT volumes. Among participants with a normal waist circumference, we observed no association between thyroid function and EAT volumes. The known relationship between higher thyroid function and AF was not mediated by EAT.
Similar to previous studies, we found high and high-normal thyroid hormone levels to be associated with an increased risk of AF.1,24 Prior prospective research has also reported a positive association of EAT volumes with AF risk.25 Interestingly, a thyroid hormone-dependent gene, namely uncoupling protein-1 (UCP1) gene, is highly expressed in EAT,26,27 thus suggesting a potential direct effect of thyroid hormones on mitochondrial uncoupling and in turn on EAT activation. In our study, we indeed describe an association of higher FT4 levels with larger EAT volumes, mainly among participants with a large waist circumference. Therefore, we can speculate that higher FT4 levels among participants with abdominal obesity may additionally increase the likelihood of having larger EAT volumes and the risk of developing AF. Due to the negative feedback mechanism of hypothalamic–pituitary–thyroid axis, one would expect TSH levels to be inversely associated with EAT. However, TSH levels were not associated with EAT volumes in our study. We hypothesize that this may reflect a dysregulation of the hypothalamic–pituitary–thyroid axis by overproduction of leptin in the setting of abdominal obesity.28,29
The relation of thyroid function with obesity is complex.30 As described in previous literature and confirmed in our study, FT4 levels are known to be negatively associated with abdominal obesity, which is in turn linked to increased EAT volumes.30 However, in our study, there was a positive association of FT4 levels with EAT volumes, which remained consistent after additionally adjusting for waist circumference. These results indicate that waist circumference does not explain the link between thyroid hormone and EAT. The opposing association of FT4 levels with EAT volumes as compared to FT4 levels with waist circumference could suggest that the role of thyroid hormones on body fat distribution depends on the location and composition of visceral adipose tissue (e.g., presence of brown adipose tissue-like characteristics or lack thereof). Along with other stimuli, increased thyroid hormones can enhance the transdifferentiation of white adipocytes to brown adipocytes in the EAT of obese patients. However, further research is needed to elucidate the exact mechanisms underlying the association of thyroid function with abdominal obesity and EAT.
Our study suggests that abdominal obesity may potentiate the effect of FT4 on the development of AF. Among our participants with abdominal obesity, we found no evidence that the association between FT4 and AF was mediated by EAT. Alternative mechanisms other than EAT could, therefore, explain the link between thyroid function and AF. For example, thyroid hormones may contribute to the initiation and maintenance of AF via the activation of automatic foci in the pulmonary veins,31,32 the stimulation of sympathetic nervous system,33,34 the elevation of left atrial pressure secondary to ventricular hypertrophy, and atrial ischemia secondary to an increased heart rate,35 among others. On the other hand, we observed a notable proportion of reference interaction (10.8%), which indicates that the occurrence of AF can be partly explained by synergistic effects between thyroid hormones and EAT, though the 95% CI was quite wide. The results of our mediation analyses, however, should be interpreted with caution, as we may have lacked a sufficient sample size to detect statistically significant findings.
To our knowledge, this is the largest population-based cohort study investigating the relationship of thyroid function with EAT volumes. Moreover, this is the first study that explores the potential mediating role of EAT in the association between thyroid function and AF. The mediation analysis was based on the approach of a four-way decomposition, which unifies within a single framework the methods assessing mediation and interaction.23 The detailed information on potential confounders allowed us to perform multivariate-adjusted analyses. Another strength of our study is the comprehensive adjudication of end points. AF cases were extensively evaluated at baseline and during follow-up. EAT was assessed by using a standardized computed tomography-based procedure. Though most previous studies have utilized ultrasound measurements to evaluate EAT, computed tomography is considered superior to the ultrasound in the detection and, particularly, in the quantification of EAT.13,36
Several limitations of our study should also be considered. Thyroid function and EAT volumes were assessed only once and we had no information regarding their changes over time. However, due to the intra-individual variability of TSH and FT4 levels, the lack of repeated measurements would tend to underestimate rather than overestimate the association of thyroid function with EAT and AF.37 EAT volumes were assessed after the thyroid function measurements (median time between CT scans and laboratory measurements was 4.6 years). However, we adjusted all analyses for the time interval between the measurements. Another limitation is the lack of information on serum triiodothyronine levels. However, TSH and FT4 represent the most relevant measurements of thyroid function in clinical practice. The majority of our participants were white middle-aged and older adults, limiting the generalizability of our findings to other populations. Lastly, given the observational study design, we cannot rule out the possibility of residual or unmeasured confounding.
Our findings suggest that in subjects with abdominal obesity, FT4 measurement can help identify those with larger EAT volumes and higher risk of AF. Our results do not suggest EAT as a mediating factor between thyroid function and AF. However, the occurrence of AF may be influenced by potential synergistic effects between thyroid hormones and EAT. Future research is warranted to replicate our results and provide further insight into the relationship between thyroid function and AF.
Acknowledgments
Analyses for the four-way decomposition were conducted using the R-script developed by Dr. Gautam Sajeev (Harvard T.H. Chan School of Public Health, Boston, USA). We are grateful to the study participants, the staff from the Rotterdam Study, and the participating general practitioners and pharmacists. The Rotterdam Study is supported by the Erasmus Medical Center and Erasmus University of Rotterdam; the Netherlands Organization for Scientific Research; the Netherlands Organization for Health Research and Development; the Research Institute for Diseases in the Elderly; the Netherlands Genomics Initiative; the Ministry of Education, Culture and Science; the Ministry of Health Welfare and Sports; the European Commission (DG XII); and the Municipality of Rotterdam. Dr. D. Bos was supported by a grant from Alzheimer Nederland (WE.15-2016-02). Dr. M. Kavousi was supported by the VENI grant from the Netherlands Organization for Scientific Research (VENI 91616079). Professor R.P. Peeters and Dr. L. Chaker were supported by the Netherlands Organization for Health Research and Development Zon-MWTOP grant 91212044 and an Erasmus MC Medical Research Advisory Committee grant. Professor R.P. Peeters has received lecture fees from IBSA and Goodlife Fertility. The contributions of the Fulbright Center and Catharine van Tussenbroek Stichting to Dr. L. Chaker are also acknowledged. Professor O.H. Franco works in Erasmus AGE, a center for aging research across the life course funded by Nestlé Nutrition (Nestec Ltd.) and Metagenics Inc. The funding sources had no involvement in the collection, analysis, writing, interpretation, or in the decision to submit the paper for publication.
Disclosure
The authors report no conflicts of interest in this work.
References
Chaker L, Heeringa J, Dehghan A, et al. Normal thyroid function and the risk of atrial fibrillation: the Rotterdam Study. J Clin Endocrinol Metab. 2015;100(10):3718–3724. | ||
Collet TH, Gussekloo J, Bauer DC, et al; Thyroid Studies Collaboration. Subclinical hyperthyroidism and the risk of coronary heart disease and mortality. Arch Intern Med. 2012;172(10):799–809. | ||
Cappola AR, Arnold AM, Wulczyn K, Carlson M, Robbins J, Psaty BM. Thyroid function in the euthyroid range and adverse outcomes in older adults. J Clin Endocrinol Metab. 2015;100(3):1088–1096. | ||
Iacobellis G. Local and systemic effects of the multifaceted epicardial adipose tissue depot. Nat Rev Endocrinol. 2015;11(6):363–371. | ||
Bos D, Vernooij M, Shahzad R, et al. Epicardial fat volume and the risk of atrial fibrillation in the general population free of cardiovascular disease: the Rotterdam Study. JACC Cardiovasc Imaging. 2017;10(11):1405–1407. | ||
Squizzato A, Romualdi E, Buller HR, Gerdes VE. Clinical review: thyroid dysfunction and effects on coagulation and fibrinolysis: a systematic review. J Clin Endocrinol Metab. 2007;92(7):2415–2420. | ||
Obregon MJ. Adipose tissues and thyroid hormones. Front Physiol. 2014;5:479. | ||
Weiner J, Kranz M, Kloting N, et al. Thyroid hormone status defines brown adipose tissue activity and browning of white adipose tissues in mice. Sci Rep. 2016;6:38124. | ||
Arpaci D, Gurkan Tocoglu A, Yilmaz S, et al. Epicardial adipose tissue thickness in patients with subclinical hypothyroidism and the relationship thereof with visceral adipose tissue thickness. J Clin Med Res.2016;8(3):215–219. | ||
Asik M, Sahin S, Ozkul F, et al. Evaluation of epicardial fat tissue thickness in patients with Hashimoto thyroiditis. Clin Endocrinol (Oxf). 2013;79(4):571–576. | ||
Santos OC, Silva NA, Vaisman M, et al. Evaluation of epicardial fat tissue thickness as a marker of cardiovascular risk in patients with subclinical hypothyroidism. J Endocrinol Invest. 2015;38(4):421–427. | ||
Yazici D, Ozben B, Toprak A, et al. Effects of restoration of the euthyroid state on epicardial adipose tissue and carotid intima media thickness in subclinical hypothyroid patients. Endocrine. 2015;48(3):909–915. | ||
Binnetoglu E, Asik M, Altun B, et al. Evaluation of epicardial fat tissue thickness in patients with hyperthyroidism. Wien Klin Wochenschr. 2014;126(15–16):485–490. | ||
Hofman A, Brusselle GG, Darwish Murad S, et al. The Rotterdam Study: 2016 objectives and design update. Eur J Epidemiol. 2015;30(8):661–708. | ||
Chaker L, van den Berg ME, Niemeijer MN, et al. Thyroid function and sudden cardiac death: a prospective population-based cohort study. Circulation. 2016;134(10):713–722. | ||
Odink AE, van der Lugt A, Hofman A, et al. Association between calcification in the coronary arteries, aortic arch and carotid arteries: the Rotterdam study. Atherosclerosis. 2007;193(2):408–413. | ||
Shahzad R, Bos D, Metz C, et al. Automatic quantification of epicardial fat volume on non-enhanced cardiac CT scans using a multi-atlas segmentation approach. Med Phys. 2013;40(9):091910. | ||
Heeringa J, van der Kuip DA, Hofman A, et al. Prevalence, incidence and lifetime risk of atrial fibrillation: the Rotterdam study. Eur Heart J. 2006;27(8):949–953. | ||
Leening MJ, Kavousi M, Heeringa J, et al. Methods of data collection and definitions of cardiac outcomes in the Rotterdam Study. Eur J Epidemiol. 2012;27(3):173–185. | ||
van Bemmel JH, Kors JA, van Herpen G. Methodology of the modular ECG analysis system MEANS. Methods Inf Med. 1990;29(4):346–353. | ||
Willems JL, Abreu-Lima C, Arnaud P, et al. The diagnostic performance of computer programs for the interpretation of electrocardiograms. N Engl J Med. 1991;325(25):1767–1773. | ||
Lelorier P, Humphries KH, Krahn A, et al. Prognostic differences between atrial fibrillation and atrial flutter. Am J Cardiol. 2004;93(5):647–649. | ||
VanderWeele TJ. A unification of mediation and interaction: a 4-way decomposition. Epidemiology. 2014;25(5):749–761. | ||
Selmer C, Olesen JB, Hansen ML, et al. The spectrum of thyroid disease and risk of new onset atrial fibrillation: a large population cohort study. BMJ. 2012;345:e7895. | ||
Bos D, Vernooij MW, Shahzad R, et al. Epicardial fat volume and the risk of atrial fibrillation in the general population free of cardiovascular disease. JACC Cardiovasc Imaging. 2017;10(11):1405–1407. | ||
Sacks HS, Fain JN, Holman B, et al. Uncoupling protein-1 and related messenger ribonucleic acids in human epicardial and other adipose tissues: epicardial fat functioning as brown fat. J Clin Endocrinol Metab. 2009;94(9):3611–3615. | ||
Bianco AC, McAninch EA. The role of thyroid hormone and brown adipose tissue in energy homoeostasis. Lancet Diabetes Endocrinol. 2013;1(3):250–258. | ||
Fekete C, Lechan RM. Central regulation of hypothalamic-pituitary-thyroid axis under physiological and pathophysiological conditions. Endocr Rev. 2014;35(2):159–194. | ||
Bjorntorp P, Rosmond R. Neuroendocrine abnormalities in visceral obesity. Int J Obes Relat Metab Disord. 2000;24(Suppl 2):S80–S85. | ||
Biondi B. Thyroid and obesity: an intriguing relationship. J Clin Endocrinol Metab. 2010;95(8):3614–3617. | ||
Chen PS, Chen LS, Fishbein MC, Lin SF, Nattel S. Role of the autonomic nervous system in atrial fibrillation: pathophysiology and therapy. Circ Res. 2014;114(9):1500–1515. | ||
Chen YC, Chen SA, Chen YJ, Chang MS, Chan P, Lin CI. Effects of thyroid hormone on the arrhythmogenic activity of pulmonary vein cardiomyocytes. J Am Coll Cardiol. 2002;39(2):366–372. | ||
Alvarez GE, Beske SD, Ballard TP, Davy KP. Sympathetic neural activation in visceral obesity. Circulation. 2002;106(20):2533–2536. | ||
Polikar R, Burger AG, Scherrer U, Nicod P. The thyroid and the heart. Circulation. 1993;87(5):1435–1441. | ||
Bielecka-Dabrowa A, Mikhailidis DP, Rysz J, Banach M. The mechanisms of atrial fibrillation in hyperthyroidism. Thyroid Res. 2009;2(1):4. | ||
Nichols JH, Samy B, Nasir K, et al. Volumetric measurement of pericardial adipose tissue from contrast-enhanced coronary computed tomography angiography: a reproducibility study. J Cardiovasc Comput Tomogr. 2008;2(5):288–295. | ||
van de Ven AC, Netea-Maier RT, Medici M, et al. Underestimation of effect of thyroid function parameters on morbidity and mortality due to intra-individual variation. J Clin Endocrinol Metab. 2011;96(12): E2014–E2017. |
Supplementary materials
 | Table S1 Association of Z-scores of TSH or FT4 with waist circumferencea Notes: Model 1 = age, sex, cohort, alcohol, smoking, and time between laboratory measurement and scan; Model 2 = Model 1 + total cholesterol, HDL cholesterol, serum lipid-lowering medication, systolic blood pressure, diastolic blood pressure, blood pressure-lowering medication, prevalent diabetes, prevalent CHD. aWC was stratified according to sex-specific clinical cutoffs. For women, small WC was defined as ≤88 cm, while large WC was defined as >88 cm. For men, small WC was defined as ≤102 cm, while large WC was defined as >102 cm. Abbreviations: CHD, coronary heart disease; FT4, free thyroxine; HDL, high-density lipoprotein; TSH, thyroid-stimulating hormone; WC, waist circumference. |
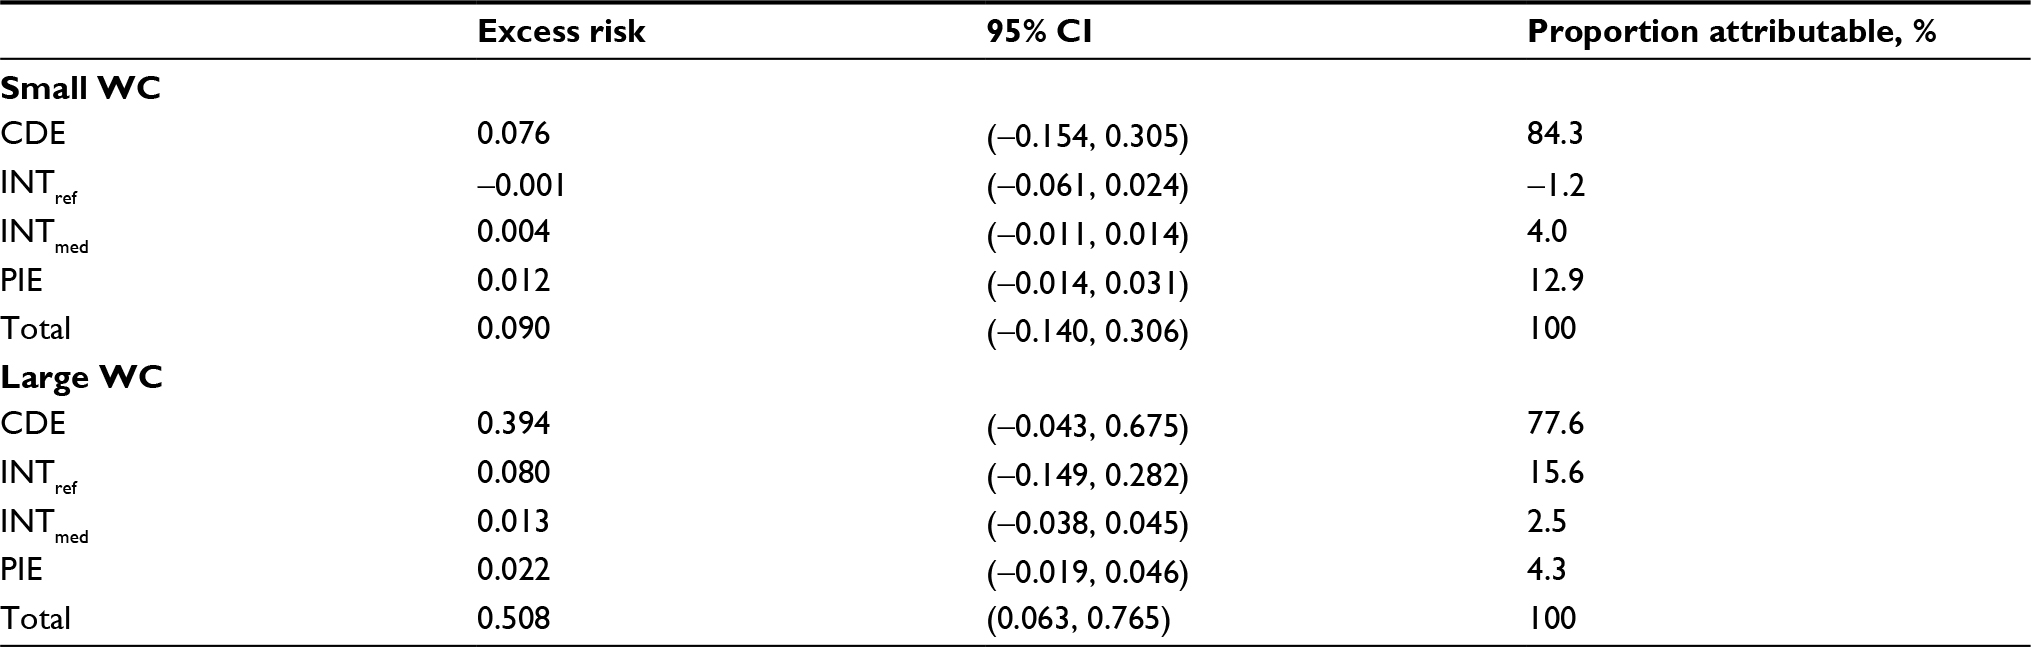 | Table S2 Proportions of the effect of Z-scores of FT4 on AF due to mediation and/or interaction with EAT, using all confounders of M → Y relation separately Notes: WC was stratified according to sex-specific clinical cutoffs. For women, small WC was defined as ≤88 cm, while large WC was defined as >88 cm. For men, small WC was defined as ≤102 cm, while large WC was defined as >102 cm. M →Y refer to mediatior → outcome. Abbreviations: AF, atrial fibrillation; CDE, controlled direct effect; EAT, epicardial fat tissue; FT4, free thyroxine; INTmed, mediated interaction; INTref, reference interaction; PIE, pure indirect effect; WC, waist circumference. |
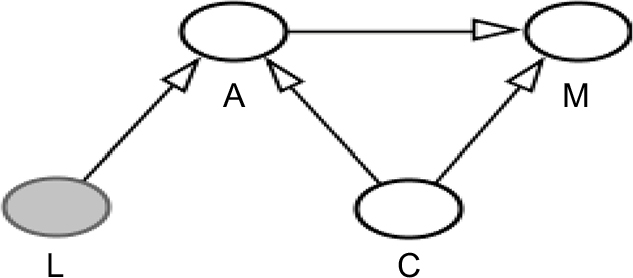 | Figure S1 Directed acyclic graph for the association of free thyroxine (FT4) with epicardial adipose tissue (EAT) corresponds to Table 2, Model 1. Notes: A=FT4, M=EAT, C=Age, sex, cohort, smoking, alcohol, and time between measurements. L=Waist circumference (WC), Effect modification of FT4 by WC (interaction FT4WC P<0.05) on M, not included in the primary model. |
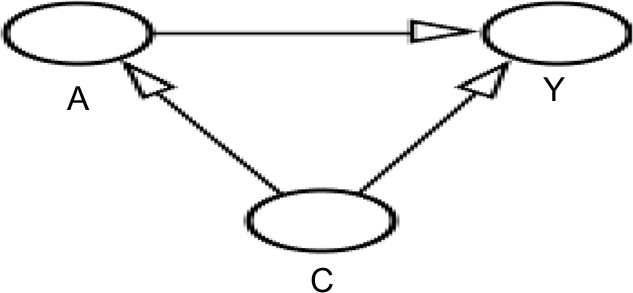 | Figure S2 Directed acyclic graph for the association of FT4 with atrial fibrillation (AF) corresponds to Table 3, model 1. Notes: A=FT4, Y=AF, C=age, sex, cohort, smoking, alcohol, and time between measurements, (large) waist circumference (WC). Effect modification of FT4 by WC (interaction FT4WC P<0.05) on Y. |
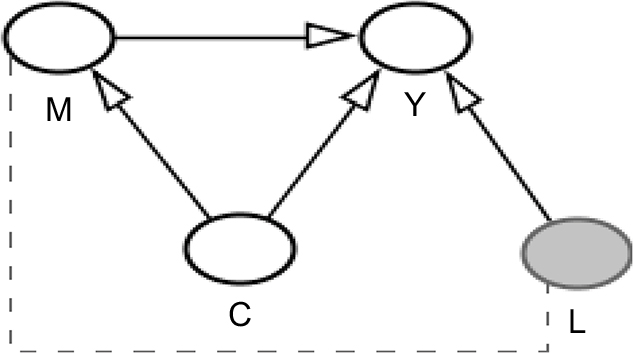 | Figure S3 Directed acyclic graph for the association of EAT with AF corresponds to Table 3, model 2. Notes: M=EAT, Y=AF, C=1 refers to the set of confounders in model 1 of table 3. 2 refers to model 2. Age, sex, cohort, smoking, alcohol, FT4, thyroid-stimulating hormone, and time between measurements. 2. Total cholesterol, high-density lipoprotein (HDL) cholesterol, lipid-lowering medication, diastolic blood pressure, systolic blood pressure, blood pressure-lowering medication, prevalent coronary heart disease (CHD), and prevalent diabetes. L=WC (omitted in this model due to colinearity with M). No interactions observed. Abbreviations: AF, atrial fibrillation; EAT, epicardial adipose tissu; WC, waist circumference. |
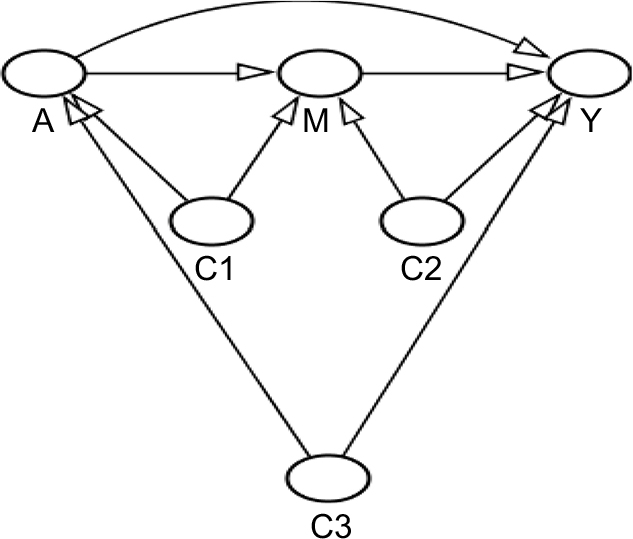 | Figure S4 Final Directed acyclic graph,, stratified by waist circumference dichotomized according to sex-specific clinical cutoffs. Notes: A=FT4, M=EAT, Y=AF, C1=age, sex, cohort, smoking, alcohol, and time between measurements, C2=age, sex, cohort, smoking, alcohol, predicted values using the following variables: total cholesterol, HDL cholesterol, lipid-lowering medication, diastolic blood pressure, systolic blood pressure, blood pressure-lowering medication, prevalent CHD, and prevalent diabetes (sensitivity analysis with original covariates), C3=age, sex, cohort, smoking, and alcohol. Abbreviations: AF, atrial fibrillation; CHD, coronary heart disease; EAT, epicardial fat tissue; FT4, free thyroxine. |
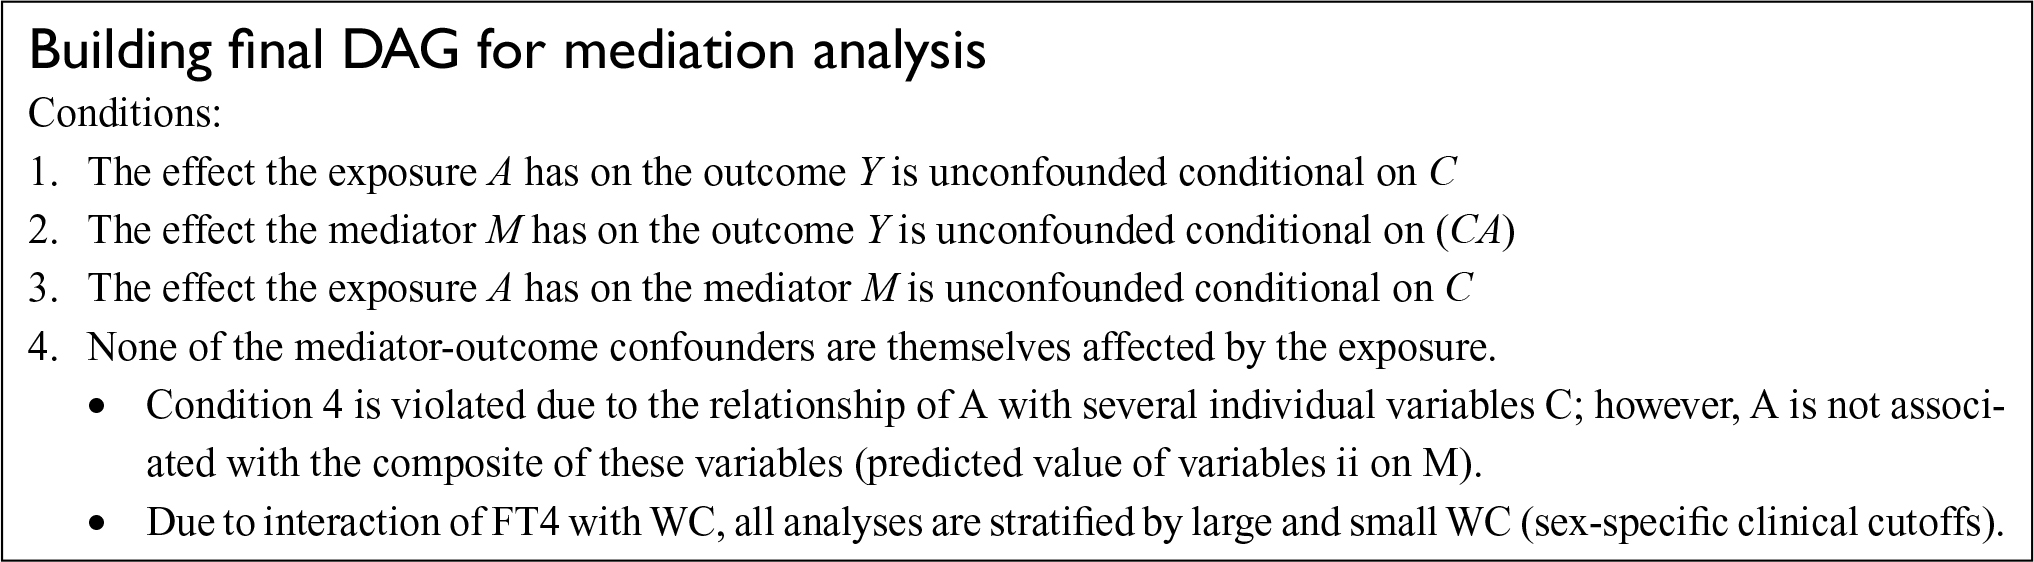 | Figure S5 Building Final DAG. |
 © 2018 The Author(s). This work is published and licensed by Dove Medical Press Limited. The
full terms of this license are available at https://www.dovepress.com/terms
and incorporate the Creative Commons Attribution
- Non Commercial (unported, 3.0) License.
By accessing the work you hereby accept the Terms. Non-commercial uses of the work are permitted
without any further permission from Dove Medical Press Limited, provided the work is properly
attributed. For permission for commercial use of this work, please see paragraphs 4.2 and 5 of our Terms.
© 2018 The Author(s). This work is published and licensed by Dove Medical Press Limited. The
full terms of this license are available at https://www.dovepress.com/terms
and incorporate the Creative Commons Attribution
- Non Commercial (unported, 3.0) License.
By accessing the work you hereby accept the Terms. Non-commercial uses of the work are permitted
without any further permission from Dove Medical Press Limited, provided the work is properly
attributed. For permission for commercial use of this work, please see paragraphs 4.2 and 5 of our Terms.