Back to Journals » Medical Devices: Evidence and Research » Volume 9
Three-dimensional needle-tip localization by electric field potential and camera hybridization for needle electromyography exam robotic simulator
Authors He S ![]() , Gómez-Tames J, Yu W
, Gómez-Tames J, Yu W
Received 24 October 2015
Accepted for publication 30 March 2016
Published 20 June 2016 Volume 2016:9 Pages 143—150
DOI https://doi.org/10.2147/MDER.S99091
Checked for plagiarism Yes
Review by Single anonymous peer review
Peer reviewer comments 2
Editor who approved publication: Dr Scott Fraser
Siyu He,1 Jose Gomez-Tames,1 Wenwei Yu1,2
1Medical System Engineering Department, Graduate School of Engineering, 2Center for Frontier Medical Engineering, Chiba University, Chiba, Japan
Abstract: As one of neurological tests, needle electromygraphy exam (NEE) plays an important role to evaluate the conditions of nerves and muscles. Neurology interns and novice medical staff need repetitive training to improve their skills in performing the exam. However, no training systems are able to reproduce multiple pathological conditions to simulate real needle electromyogram exam. For the development of a robotic simulator, three components need to be realized: physical modeling of upper limb morphological features, position-dependent electromyogram generation, and needle localization; the latter is the focus of this study. Our idea is to couple two types of sensing mechanism in order to acquire the needle-tip position with high accuracy. One is to segment the needle from camera images and calculate its insertion point on the skin surface by a top-hat transform algorithm. The other is voltage-based depth measurement, in which a conductive tissue-like phantom was used to realize both needle-tip localization and physical sense of needle insertion. For that, a pair of electrodes was designed to generate a near-linear voltage distribution along the depth direction of the tissue-like phantom. The accuracy of the needle-tip position was investigated by the electric field potential and camera hybridization. The results showed that the needle tip could be detected with an accuracy of 1.05±0.57 mm.
Keywords: needle-tip localization, needle EMG exam, top-hat transform, tissue-like phantom, voltage distribution simulation
Introduction
Needle electromyography (EMG) exam (NEE) has been widely used to examine the neurological abnormalities in upper and lower limbs.1,2 Neurology interns and novice medical staff need repetitive training to improve their skills to perform the exam. Currently, training for NEE employs normal subjects (usually trainees, fellow students, or colleagues), which cannot reproduce multiple pathological conditions for neurological disorders to simulate real NEE. However, these training sessions are uncomfortable and painful for the subjects.
In recent years, simulators for medical training, such as surgical suture and cardiac surgery,3–5 are attracting more and more research interests, as they are getting more accurate and real, so as to reduce in vivo testing.6–8 However, robotic training tools for NEE have not been addressed earlier in the literature. A robotic NEE simulator could be expected to provide an interface for repeatable practice and a measureable evaluation of performance to improve students’ skills, in a controlled environment. There are three important technology components that need to be realized: physical modeling of upper limb morphological features, position-dependent EMG generation, and needle localization, in which the latter is the focus of this study. Needle localization for different medical treatments has been investigated, such as prostate brachytherapy and needle-guided system,9,10 where needle position could be localized with an accuracy of 2 mm, using ultrasound imaging technology. However, besides its high cost problem, contact area needed for ultrasound probes to detect an inserted needle limits its implementation at least to upper limb robotic simulators.
The ultimate goal is to develop a robotic simulator for NEE with lower cost, higher accuracy (localization error <1 mm to simulate the spatial effect of different nerve pathologies), and less response time. Our idea is to couple two types of sensing mechanisms to acquire the needle-tip position with high accuracy. One is image processing to segment the needle from camera images and calculate its insertion point on the skin surface by a top-hat transform algorithm. The other is voltage-based depth measurement, in which a conductive tissue-like phantom was used to realize both needle-tip localization and physical sense of needle insertion. In the literature, phantom had been used to investigate the thermal effects, antenna applications, and conductivity effect in electrical stimulation,11–14 but it has not been reported for localization proposes. For that, a pair of electrodes was designed to generate a near-linear voltage distribution along the depth direction of the tissue-like phantom, as presented earlier by He et al.15 In a similar hybrid sensor approach for the evaluation of needle manipulation skills in surgery,3 the needle information was obtained on the skin surface from camera images and reflective photo interrupters to sense the movement of the dummy skin. However, a reflective photo interrupter could not get the needle information inside the dummy muscle. This study presents an analysis of the accuracy of the proposed electric field potential and camera hybridization method.
Materials and methods
The electric field potential and camera hybridization was used to localize the needle-tip position in the muscle to calculate penetration depth and detect the needle insertion point on skin surface, respectively. In this section, the hybridized sensing method and the experimental setup to test the sensing method are explained in detail.
The electric field potential and camera hybridization as sensing mechanism for needle localization
Figure 1 shows an overview of the robotic simulator that generates an EMG signal with respect to the position of the needle and training setup. First, the needle insertion point on skin surface (x,y) was estimated by processing the images obtained from a camera (in the implementation, a video camera (HDC-TM90, Panasonic Corporation, Osaka, Japan), with a resolution of 720×480 pixels). Second, a conductive tissue-like phantom was used to measure the penetration depth. A pair of electrodes was designed to generate a near-linear voltage distribution along the depth direction of the tissue-like phantom. The voltage at the needle tip was input to a computer by a digital-to-analog converter device (NI USE-6225, National Instruments Corporation, Austin, TX, USA). The data were analyzed to calculate the needle penetration depth (z).
 | Figure 1 Overview of the robotic stimulator. Notes: Image processing and electro-localization by phantom are used to estimate the 3D needle-tip location. According to the position of the needle and presumed pathological conditions, EMG waveform could be presented to the trainees. Abbreviations: 3D, three dimensional; EMG, electromyography. |
Conductive tissue-like phantom for electro-localization of the needle tip
As shown by He et al,15 a conductive tissue-like phantom could be used as a sensing mechanism to measure the needle penetration depth, while providing physical sense of needle insertion. It was fabricated using the ingredients listed in Table 1. The phantom was homogeneous and isotropic in order to reduce voltage irregularity.
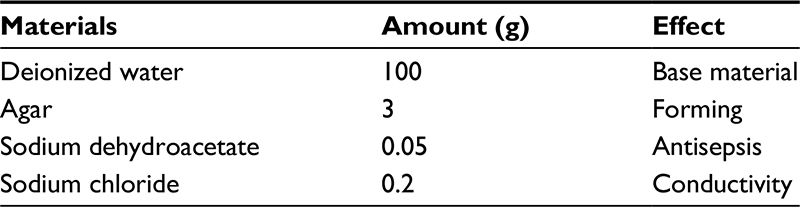 | Table 1 Composition of muscle-equivalent phantom for 100×100×10 mm3 dimension |
A pair of electrodes was designed to generate a near-linear voltage distribution along the depth direction of the conductive tissue-like phantom. Since most part of the top electrode should be open for needle insertion, an upper ring electrode was used for input voltage and a bottom flat electrode as ground. They were made of 0.1 mm thick stainless steel, as shown in Figure 2. The NEE needle (NM-131T, NIHON KOHDEN Corporation, Tokyo, Japan) (0.3 mm diameter and 30 mm length) measured the voltage at its exposed tip to obtain the depth of the needle tip.
 | Figure 2 Experimental setup to evaluate the electric field potential and camera hybridization method to localize the needle tip: robotic hand, camera, and phantom. Note: Purpose-built device is used to locate the needle at the desired position. |
Due to the oxidization process on the contact surface of phantom and electrodes, an alternating current waveform and stainless electrodes were used.15 Thus, a sine wave with amplitude of 2 V at a frequency of 100 Hz was applied to the phantom through the pair of electrodes. In addition, as the voltage distribution is not strictly linear along the z-axis (depth direction) of the phantom, due to the irregular surface of the phantom that mimics the shape of the belly of the human biceps brachii muscle, and use of the ring electrode, we calculated the voltage distribution of the phantom using a finite element method (COMSOL multiphysics 5.1, COMSOL Inc, Stockholm, Sweden), for compensating the voltage nonlinearity. The procedure is shown in Figure 3A.
 | Figure 3 Needle localization method by electric field potential and camera hybridization. Notes: (A) Measurement method of the voltage distribution, (B) segmentation steps to extract the needle. Images Ba and Bb are shown with a different contrast than the original for easier visualization. In image Be needle tip camera position localization method is shown, points A, B, C, and D describe the contour of measured area, points A', B', P and P' describe needle insertion point position information. Image Bc is the subtraction between images Ba and Bb. A gray filter is applied to segment needle in image Bd. |
Image processing to measure insertion point of the needle
First, color images from the camera were converted to grayscale images. For the needle segmentation, foreground and background were distinguished using the top-hat transform algorithm16 to extract small elements and details from the given images. In our program, we obtained the difference between two top-hat transforms: white top-hat transform and black top-hat transform, as shown in Figure 3B.
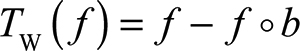
The white top-hat transform and the black top-hat transform are given by Equations 1 and 2:
 (1)
(1)
 (2)
(2)
where f means the input image, ○ means mathematic morphology opening, • means mathematic morphology closing, and b means a grayscale structuring element.
The features obtained from white top-hat and black top-hat were complementary. White top-hat can make the object much brighter than its surroundings (Figure 3Ba). Conversely, black top-hat makes the object much darker than its surroundings (Figure 3Bb). Hence, we calculated the difference to make the needle more salient (Figure 3Bc).
Then, a binary image of the needle was obtained by thresholding (threshold value =20) the grayscale image (Figure 3Bd). The insertion point pixel was acquired by searching the bottom point of the segmented image. To calculate the real position (x,y) based on the pixel information (P’), points A, B, C, and D with known physical coordinate values were selected previously, as shown in Figure 3Be. By drawing lines from P’ parallel to ![]() and
and ![]() and getting their intersection with
and getting their intersection with ![]() and
and ![]() , respectively, the real position (x,y) could be estimated with linear proportionality.
, respectively, the real position (x,y) could be estimated with linear proportionality.
Experimental setup
Figure 2 shows the experimental setup to evaluate the needle-tip localization for our robotic simulator. The region that corresponds to the biceps brachii of the arm mannequin was filled with a conductive tissue-like phantom that has a curved surface to fit with the surrounding contour. A camera was located above the shoulder of the arm simulator. The camera focus was adjusted to the area where the needle is to be inserted. Finally, a purpose-built xyz stage was used to insert the needle perpendicular to the skin surface and locate it at the desired three-dimensional (3D) position.
Calibration and measurement
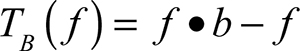
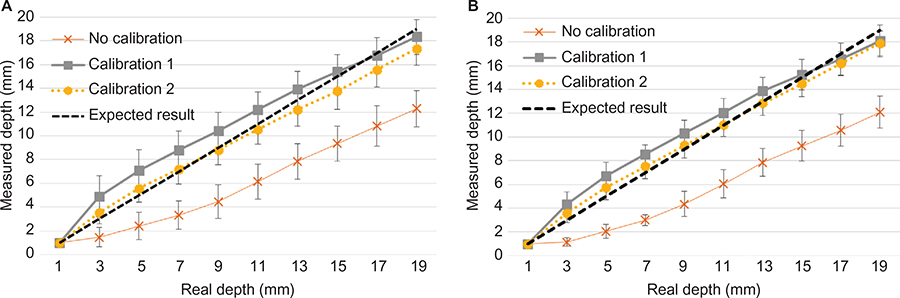
As the voltage distribution along the z-axis is not strictly linear, calibration is necessary. In order to ensure that the estimation with higher accuracy could be achieved after calibration, we simulated the voltage distribution by COMSOL 5.1 to obtain a set of conversion equations from voltage to depth. In Figure 4, no calibration corresponds to an ideal phantom with linear voltage along the z-axis, calibration 1 refers to calibrating depths of all insertion points using simulated voltage only at the center, and calibration 2 refers to calibrating depths of all insertion points using simulation data corresponding to each insertion point.
 | Figure 4 Calibration curves used to improve the estimation of needle penetration distance. Notes: No calibration corresponds to a phantom with linear voltage distribution. Calibration curves are calculated using a simulation model of the phantom. Calibration 1 is generic for all insertion points and calibration 2 is specific for each insertion point (a measurement at x =5 and y =20 is shown as example). |
Figure 5 shows 35 locations where we measured from 1 to 19 mm of depth with a step of 2 mm to investigate the effect of calibration. Furthermore, the accuracy of the needle-tip localization was calculated to evaluate the electric field potential and camera hybridization. We calculated the root-mean-square error for the estimation of the accuracy of this approach. Error value could be calculated as:
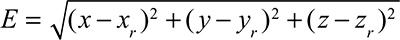 (3)
(3)
where (x,y,z) is the estimated position of the needle by the voltage–camera hybridization and (xr,yr,zr) is the real position.
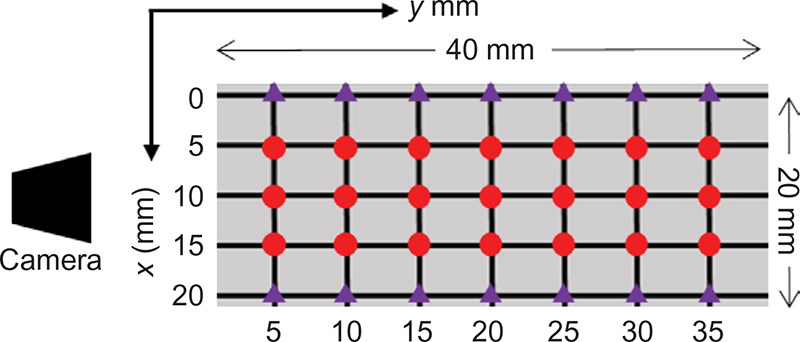 | Figure 5 Measurement locations where needle is inserted to estimate the accuracy of the needle-tip localization. Note: The interval of the measurement points for both x-axis and y-axis is 5 mm. Dots are the center region and triangles the border region on measured area. |
Results
Voltage calibration for needle penetration depth
The estimated needle penetration depth before and after calibration is shown in Figure 6. Before calibration, the results had a huge deviation with respect to the expected values. In Figure 6A, the error of no calibration was 4.11±1.05 mm. In calibration 1, we used the conversion equation from the simulation at the center point to calibrate all insertion points, and the result was 1.36±0.90 mm. In calibration 2, we used conversion equations corresponding to the insertion point, which resulted in 1.08±0.58 mm of error. Figure 6B shows only the result in the center region (circle points denoted in Figure 5) as follows: no calibration, 4.26±0.88 mm; calibration 1, 1.15±0.86 mm; and calibration 2, 0.80±0.68 mm.
 | Figure 6 Average needle-penetration distance (z) from the voltage distribution of the phantom before and after voltage calibration: (A) All measurement results and (B) measurement in center region. |
Surface needle-tip position by camera
High accuracy of image processing is not only used for the measurement of insertion point but also it allows a more accurate calibration. Figure 7 shows the error of camera image processing at 35 different surface positions, the error was 0.67±0.35 mm. Specifically, in the center area, the errors were generally less than 0.5 mm.
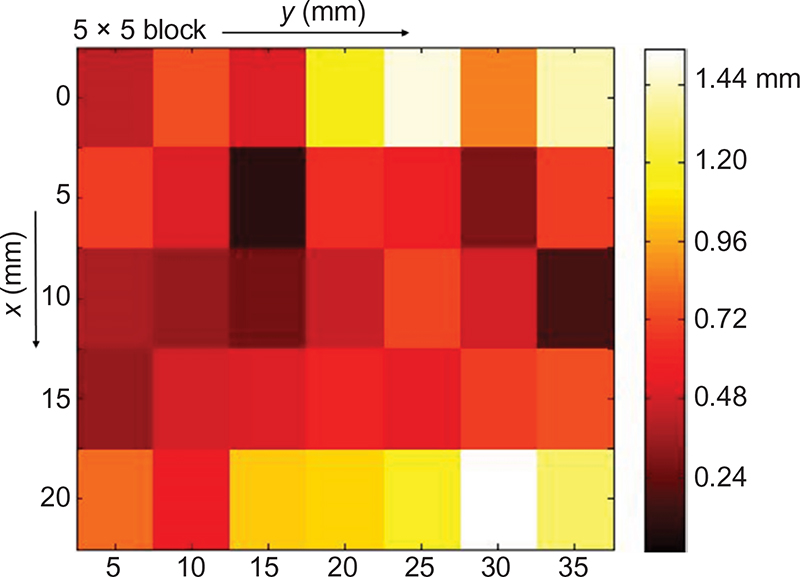 | Figure 7 Image processing error (x,y) using 35 insertion points. Note: Scale bar means the prediction error in mm. |
3D needle-tip localization by electric field potential and camera hybridization
Figure 8 shows the average and standard deviation of the 3D error for different depths for 35 insertion points using electric field potential and camera hybridization method with calibration 2. The error in all the measurements was 1.42±0.62 mm. Especially the error increased markedly after 13 mm (solid line). But if the measurement area was limited to the center region, which is expected to be the most frequently used in the real training, the error was smaller (1.05±0.57 mm). The same results could be viewed from another angle: the error at each horizontal points, averaged for all measured depths, is shown in Figure 9. At the measurement points near the border, the errors were 2.00 and 1.92 mm (x=0 and 20 mm, respectively), but at the measurement points at the center line, the errors were 1.16, 0.78, and 1.21 mm (x=5, 10, and 15 mm, respectively). Along the y-axis, the error tended to get bigger as the distance from the camera increased. The errors were 1.20 and 1.72 mm (y=5 and 35 mm, respectively).
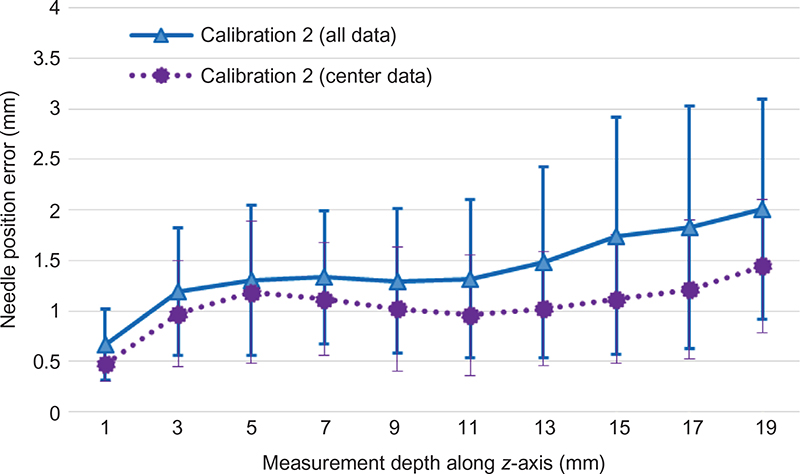 | Figure 8 Needle-tip position error (x,y,z) along z-axis using electric field potential and camera hybridization. Notes: Average and standard deviation are presented from 1 to 19 mm of depth. Solid line represents all measurements and dotted line shows the results of the center area. |
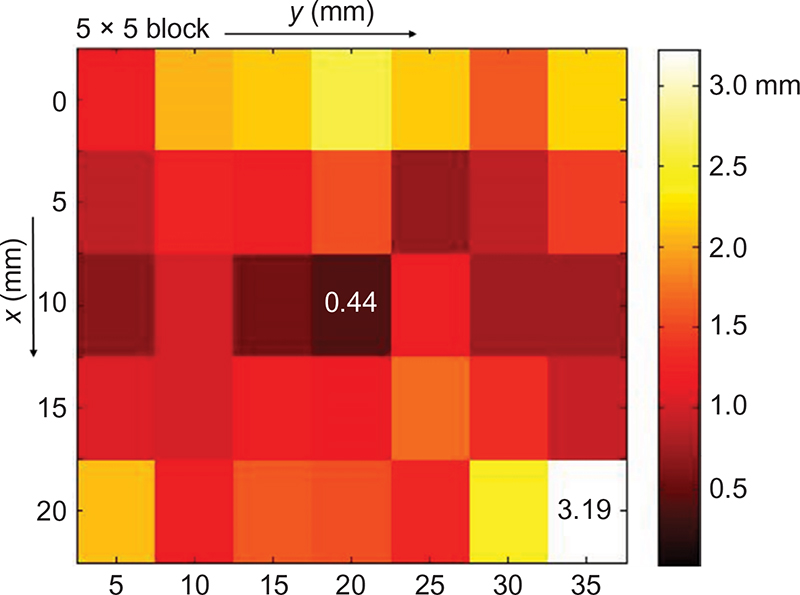 | Figure 9 Needle-tip position error (x,y,z) seen from the surface using electric field potential and camera hybridization. Note: Scale bar is the average of the error of all depths (1–19 mm). |
Discussion
This study used a tissue-like phantom (for voltage measurement) and camera (for image processing) to localize the needle tip. Needle is generally inserted in the biceps brachii; hence, we used its size for the selection of needle insertion area. As the center part is the most frequently used during the real NEE test, we investigated the error of whole plane and the error of central regions.
First, the estimation of needle penetration depth using the phantom depends on how linear the voltage is along the depth direction, which is determined by the electrodes and the shape of the phantom. For that, the dimension of the ring electrode was optimized in a previous study.15 Nevertheless, this effort resulted in an accuracy of 4.11±1.05 mm (Figure 6). In this study, we used voltage calibration to reduce the nonlinear effect by prior information acquired from finite element simulation of the voltage distribution. After calibration 1, needle-penetration distance improved to 1.36±0.90 mm, and the error was reduced more (1.08±0.58 mm) by using calibration 2. Nevertheless, calibration equation for each point was necessary, which can reduce the error significantly. In the center region, the error was 1.15±0.86 mm while using calibration 1 and 0.80±0.68 mm while using calibration 2. This shows that the accuracy of the points near the border was lower than that in the center region, even though conversion equation from the simulation for each point (calibration 2) was used. For example, a relatively high error was presented in the corner (20 and 35 mm; Figure 9). It could be speculated that the simulation did not capture the voltage variation in the corners due to unstable or incomplete poor contact between the electrodes and the phantom. This could be further investigated in near future by embedding the electrodes into the phantom to improve the contact between the phantom and the electrodes.
Second, Figure 7 shows how the top-hat transform segmented the needle image accurately and calculated needle position with high accuracy. It was found that the error increased from lateral to the midline of the camera (in x-axis). During the experiment, the midline of the camera was aligned to x=10 mm, which presented the highest accuracy result (an error of 0.39 mm). The error did not increase dramatically from the points at x= 5 and 15 mm (0.49 and 0.53 mm, respectively); however, the farthest area from midline (x=0 and 20 mm) presented an error of 0.91 and 1.02 mm, respectively; thus the camera focus should be at the center of measurement area. The two measurement methods were combined to investigate the final needle localization accuracy. In order to realize the NEE training for neural pathology under interest, the system needs a localization error <1 mm while keeping low cost and fast time response. The electric field potential and camera hybridization method was evaluated under these requirements. From Figures 8 and 9, the localization error at center was 1.05±0.57 mm with a low cost (web camera is of low cost and fabrication of a phantom unit costs <3 dollars), which is more suitable than other implementations (eg ultrasound5). In particular, the difference between all data and center data was smaller before 9 mm and larger for deeper needle positions, as shown in Figure 8, ie, needle localization at the border has a small error at shallow depth.
The accuracy of the method was reduced due to the double-layer effect between the electrode and phantom and the morphological effects, which produces distorted and uneven voltage distribution with instability. To correct the double-layer effect in the ring electrode, the maximum voltage (input voltage) was applied when the needle was just inserted into the phantom. And, the lowest voltage (not zero due to the double-layer effect in ground electrode) was set to half of maximum voltage after several measurements.
The strategy to improve real-time processing is to parallelize the three modules: image processing, electro-localization, and EMG generation. The three modules run simultaneously and communicate with one another using TCP/IP protocol (R2013a, The MathWorks, Inc, Natick, MA, USA) in Matlab, which reduced the computation time from 1 to 0.3 or 0.4 seconds.
Conclusion
This paper describes the approach to localize the needle-tip position as a first step to build a robotic simulator for NEE. The experiments showed the possibility of accurate estimation of the needle-tip position that is not inferior to ultrasound or other high-precision devices. Although it is still possible to improve the needle-tip localization by refining the voltage-based depth measurement (phantom) and by including the angle information from the camera, the feasibility of the robotic simulator has been shown.
Future work
The voltage drop in the electrode-phantom interface can be monitored continuously instead of a fixed value to improve system stability. Also, as the conductive tissue-equivalent phantom cannot keep same properties for long term due to the moisture loss, we need to characterize the phantom for extended periods.
In this study, only needle perpendicular to the skin surface was considered. However, the insertion angle should not be limited during the training. Currently, one camera can be used to obtain a two-dimensional angle. Two cameras are planned to be used to estimate the 3D angle17 and a gyroscope as a complementary solution.18
Disclosure
The authors report no conflicts of interest in this work.
References
Konrad P. The ABC of EMG. A Practical Introduction to Kinesiological Electromyography. Noraxon INC, USA; 2005:1. | ||
Reaz MBI, Hussain MS, Mohd-Yasin F. Techniques of EMG signal analysis: detection, processing, classification and applications. Biol Proced Online. 2006;8(1):11–35. | ||
Oshima N, Solis J, Ishii H, Matsuoka N, Hatake K, Takanishi A. Acquisition of quantitative data for the detailed analysis of the suture/ligature tasks with the WKS-2R. Information Technology Applications in Biomedicine, 2007 (ITAB 2007), 6th International Special Topic Conference on IEEE; November 2007:107–110. | ||
Basdogan C, De S, Kim J, Muniyandi M, Kim H, Srinivasan M. Haptics in minimally invasive surgical simulation and training. IEEE Comput Graph Appl. 2004;24(2):56–64. | ||
Sørensen TS, Greil GF, Hansen OK, Mosegaard J. Surgical simulation – a new tool to evaluate surgical incisions in congenital heart disease? Interact Cardiovasc Thorac Surg. 2006;5(5):536–539. | ||
Mercer SJ, Howell M, Simpson R. Simulation training for the frontline-realistic preparation for role 1 doctors. J R Army Med Corps. 2010;156(2):87–89. | ||
Torkington J, Smith SG, Rees BI, Darzi A. The role of simulation in surgical training. Ann R Coll Surg Engl. 2000:82(2):88–94. | ||
Ziv A, Wolpe PR, Small SD, Glick S. Simulation-based medical education: an ethical imperative. Acad Med. 2003;78(8):783–788. | ||
Dehghan E, Wen X, Zahiri-Azar R, Marchal M, Salcudean SE. Needle-tissue interaction modeling using ultrasound-based motion estimation: phantom study. Comput Aided Surg. 2008;13(5):265–280. | ||
Adebar TK, Fletcher AE, Okamura AM. 3-D ultrasound-guided robotic needle steering in biological tissue. IEEE Trans Biomed Eng. 2014;61(12):2899–2910. | ||
Fukuhara Y, Gomez-Tames J, Yu W. An experimental study on the effect of fat conductivity on voltage distribution and muscle recruitment using tissue-equivalent phantoms. IEEE E-Health and Bioengineering Conference (EHB); November 2013:1–4. | ||
Uno Y, Saito K, Takahashi M, Ito K. Structure of cylindrical tissue-equivalent phantom for medical applications. Electromagnetics in Advanced Applications (ICEAA), 2010 International Conference on IEEE; September 2010:406–409. | ||
Hagmann MJ, Levin RL, Calloway L, Osborn AJ, Foster KR. Muscle-equivalent phantom materials for 10-100 MHz. IEEE Trans Microw Theory Tech. 1992;40(4):760–762. | ||
Gomez-Tames J, Fukuhara Y, He S, Saito K, Ito K, Yu W. A human-phantom coupling experiment and a dispersive simulation model for investigating the variation of dielectric properties of biological tissues. Comput Biol Med. 2015;61:144–149. | ||
He S, Gomez-Tames J, Yu W. Needle detection by electro-localization for a needle EMG exam robotic simulator. Medical Measurements and Applications (MeMeA), 2015 IEEE International Symposium; May 2015:457–461. | ||
Beucher S, Meyer F. The morphological approach to segmentation: the watershed transformation. Opt Eng. 1992;34:433–481. | ||
Kau CH, Richmond S, Incrapera A, English J, Xia JJ. Three-dimensional surface acquisition systems for the study of facial morphology and their application to maxillofacial surgery. Int J Med Robot. 2007;3(2):97–110. | ||
Piyabongkarn D, Rajamani R, Greminger M. The development of a MEMS gyroscope for absolute angle measurement. IEEE Trans Control Syst Technol. 2005;13(2):185–195. |
 © 2016 The Author(s). This work is published and licensed by Dove Medical Press Limited. The
full terms of this license are available at https://www.dovepress.com/terms
and incorporate the Creative Commons Attribution
- Non Commercial (unported, 3.0) License.
By accessing the work you hereby accept the Terms. Non-commercial uses of the work are permitted
without any further permission from Dove Medical Press Limited, provided the work is properly
attributed. For permission for commercial use of this work, please see paragraphs 4.2 and 5 of our Terms.
© 2016 The Author(s). This work is published and licensed by Dove Medical Press Limited. The
full terms of this license are available at https://www.dovepress.com/terms
and incorporate the Creative Commons Attribution
- Non Commercial (unported, 3.0) License.
By accessing the work you hereby accept the Terms. Non-commercial uses of the work are permitted
without any further permission from Dove Medical Press Limited, provided the work is properly
attributed. For permission for commercial use of this work, please see paragraphs 4.2 and 5 of our Terms.