Back to Journals » International Journal of General Medicine » Volume 14
The Value of Three-Dimensional Speckle-Tracking Echocardiography in the Prediction of Cardiovascular Events in Patients with Hypertension Complicated by Acute Myocardial Infarction: A Long-Term Follow-Up Study
Authors Chen XY, Yang QM, Fang JX, Guo HF
Received 23 July 2021
Accepted for publication 21 September 2021
Published 12 October 2021 Volume 2021:14 Pages 6703—6712
DOI https://doi.org/10.2147/IJGM.S330789
Checked for plagiarism Yes
Review by Single anonymous peer review
Peer reviewer comments 3
Editor who approved publication: Dr Scott Fraser
Xiao-Yan Chen,1,2 Qing-Mei Yang,1,2 Jian-Xiu Fang,1,2 Hai-Feng Guo1,2
1Department of Ultrasound, Shanxi Bethune Hospital, Shanxi Academy of Medical Sciences, Tongji Shanxi Hospital, Third Hospital of Shanxi Medical University, Taiyuan, 030032, People’s Republic of China; 2Department of Ultrasound, Tongji Hospital, Tongji Medical College, Huazhong University of Science and Technology, Wuhan, 430030, People’s Republic of China
Correspondence: Xiao-Yan Chen
Department of Ultrasound, Shanxi Bethune Hospital, Shanxi Academy of Medical Sciences, Tongji Shanxi Hospital, Third Hospital of Shanxi Medical University, No. 99 Longcheng Street, Taiyuan, 030032, People’s Republic of China
Tel +8613934200119
Email [email protected]
Background: Patients with hypertension complicated by acute myocardial infarction (AMI) have a generally poor prognosis. The identification of powerful predictors for recurring cardiovascular events (RCEs) is vital. This study seeks to evaluate the predictive value of three-dimensional (3D) strain parameters for RCEs in patients with hypertension complicated by AMI.
Methods: We successfully followed up patients with hypertension and AMI from April 2015 to December 2015 in this retrospective study. Participants previously underwent 3D echocardiography, one week, and one month after percutaneous coronary intervention (PCI). The left ventricular structural function parameters, as well as 3D strain parameters including 3D global longitudinal strain (3D-GLS), 3D global circumferential strain, 3D global radial strain, and 3D global area strain (3D-GAS), were acquired. A Cox model was used to determine the relationships between these parameters and RCEs.
Results: In total, 62 patients were enrolled in the analysis. During follow-up (41.27 ± 20.45 months), 20 patients (32.3%) had RCEs that were independently predicted one month after PCI by 3D-GLS (HR: 1.481, 95% CI: 1.202– 1.824, P < 0.001) and 3D-GAS (HR: 1.254, 95% CI: 1.093– 1.440, P = 0.001). The optimal cutoffs for 3D-GLS and 3D-GAS in predicting cardiac events were ≥ 12.5% (area under the receiver operating characteristic curve [AUC]: 0.736, 95% CI: 0.611– 0.862, P = 0.003), and > 20.5% (AUC: 0.685, 95% CI: 0.551– 0.818, P = 0.020), respectively.
Conclusion: The assessed values of 3D-GLS and 3D-GAS one month after PCI can predict RCEs in patients with hypertension complicated by AMI.
Keywords: hypertension, acute myocardial infarction, three-dimensional speckle tracking echocardiography, strain, cardiovascular events
Introduction
Acute myocardial infarction (AMI) is a sudden, critical type of coronary heart disease accounting for approximately 40% of all deaths among patients following hospital discharge.1 The relationship between increased blood pressure (BP) and AMI has generally been recognized,2 and it is common for patients with AMI to have a history of hypertension.3 In addition, the mortality rate of patients with hypertension complicated by AMI is almost 2–3 times that of patients with a normal BP.4,5 Establishing methods for evaluating the myocardial activity of patients with hypertension after AMI and predicting their prognosis is thus important.
Various imaging methods have been used to evaluate coronary microcirculation function post-AMI, eg, cardiac magnetic resonance, echocardiography, radionuclide ventriculography, and cardiac computed tomography; these methods have also been applied to review changes observed during follow-up that may have prognostic implications.6–8 However, these approaches are generally limited by their availability, cost, technical operational difficulty, subjective characteristics, or a combination of these factors. Studies showed that the myocardial perfusion state has a good correlation with myocardial strain, and speckle-tracking echocardiography can quantitatively assess myocardial strain and indirectly reflect blood perfusion through changes in myocardial mechanics.9
For decades, two-dimensional (2D) speckle-tracking echocardiography has been employed to quantitatively analyze myocardial strain. However, 2D strain image acquisition is affected by plane motion and perspective, which may misrepresent the true anatomy of the left ventricle (LV).10 Three-dimensional (3D) speckle-tracking imaging (3DSTI) compensates for this disadvantage and can track myocardial trajectory movement in 3D space to acquire the 3D myocardial strain.11,12
In this study, 3DSTI was used to analyze the myocardial mechanics of patients with hypertension complicated by AMI and to evaluate the predictive value of 3D strain parameters for recurring cardiovascular events (RCEs) in these patients after percutaneous coronary intervention (PCI).
Methods
Study Population
This retrospective study included patients with hypertension who were diagnosed with AMI in our hospital from April 2015 to December 2015. The inclusion criteria were as follows: 1) the time of the first episode of AMI, the patient’s clinical manifestations, electrocardiogram results, serum myocardial necrosis marker examination, and coronary angiography confirming the diagnosis of AMI; 2) coronary angiography confirmed that at least one of the three main coronary arteries had a lumen diameter stenosis of ≥75% to complete obstruction; furthermore, emergency treatment with PCI was performed for balloon dilation and stent placement, and the thrombolysis in myocardial infarction value reached level 3 after PCI13 without residual significant stenosis; 3) patients had a diagnosis of primary hypertension including newly diagnosed hypertension, as well as hypertension being treated with antihypertensive medication; 4) patients who provided signed informed consent for inclusion in the study.
We excluded patients who had diabetes, congenital heart disease, cardiomyopathy, organic valvular heart disease, and poor echocardiographic image quality.
The study protocol was approved by the Medical Ethics Committee of Shanxi Baiqiuen Hospital (Shanxi Academy of Medical Science, China, approval number YXLL-2019-026).
Echocardiography
Echocardiographic imaging was performed using a Vivid™ E9 commercial scanner (GE Medical Systems, GE Vingmed Ultrasound AS, Norway) equipped with an M5S probe (frequency 1.5–4.5 MHz), a 4V heart real-time 3D volume probe (frequency 1.5–4.5 MHz), and EchoPAC™ (v.201) analysis software. All participants underwent echocardiography ≤12 h before PCI, one week after PCI, and one month after PCI.
The subjects lay on their left side and breathed calmly, and electrocardiograms were recorded at the same time as the examinations. Two-dimensional echocardiography using a 5S probe was applied to determine the LV end-diastolic volume (LVEDV) and the LV end-systolic volume (LVESV). The LV ejection fraction (LVEF) was measured using Simpson’s biplane method.
Three-dimensional echocardiography using a 4V probe was employed to obtain an apical four-chamber view, and the 4D mode was applied to record the subject’s six consecutive cardiac cycles during a breath-hold. The “store” button was used to store the 3D dynamics. The images required a heart rate with a frame rate >40%.
Three-Dimensional Speckle-Tracking Echocardiographic Image Analysis
The EchoPAC™ software program was used for the analysis of the echocardiographic images. We selected the midpoint of the mitral annulus and the apical endocardium at the end-diastole and end-systole, respectively. The system automatically delineated the endocardium and epicardium and manually adjusted to correctly track the myocardium.
Following this analysis, the software automatically calculated the 3D-LVEDV, 3D-LVESV, 3D-LVEF, 3D global longitudinal strain (3D-GLS), 3D global circumferential strain (3D-GCS), 3D global radial strain (3D-GRS), and 3D global area strain (3D-GAS).
Laboratory Analysis
Biochemical analyses including the measurement of total cholesterol, triglycerides, low-density lipoprotein, creatine kinase isoenzyme-II, myoglobin, troponin-I, and B-type natriuretic peptide were performed using standard laboratory techniques in all subjects within 1 h of hospital admission.
Follow-Up
The patients were routinely treated with aspirin, polyvir, atorvastatin, olmesartan, metoprolol, and other drugs after PCI. We completed follow-up for all patients for five years. During the follow-up, we determined whether they experienced RCEs including cardiac death, severe arrhythmia (arrhythmia combined with hemodynamic alteration inducing a reduction in BP and risk of death), recurrence of myocardial infarction during the follow-up period, and re-hospitalization due to cardiovascular disease. The New York Heart Association classification was judged to be III–IV.14 Concurrently, the time and type of the patient’s RCEs were recorded.
Statistical Analysis
All statistical analyses were performed using the SPSS Statistics 17.0 (Chicago, IL, USA) software program. Kaplan–Meier analysis was performed for the analysis of RCE rates. Normally distributed measurement data were tested for normality using the Shapiro–Wilk test; data that followed the normal distribution were statistically described as the mean ± standard deviation (X ± S), and the difference between the groups with or without RCEs was compared using two independent sample t-tests. Non-normally distributed data were statistically described by the median and interquartile range, and the Wilcoxon rank-sum test was used to compare the differences between the groups. Categorical variables were presented as absolute counts and percentages (n%), and a chi-square (χ2) analysis or Fisher’s exact test was used to compare the differences between the groups. One-way analysis of variance was used to compare the continuous variables before PCI, one week, and one month after PCI.
Univariate and multivariate Cox proportional hazards regression analyses were performed to correlate the RCEs with the echocardiographic parameters. Receiver operating characteristic (ROC) curve analysis was conducted to determine the value of the 3D echocardiographic strain parameters for predicting RCEs. The overall accuracy, sensitivity, specificity, and positive and negative predictive values for optimal cutoff points were calculated. The 3D echocardiographic strain parameter cutoff values for predicting cardiovascular disease were selected using Youden’s index and calculated as sensitivity + specificity − 1. The area under the ROC curve was also estimated.
To ensure the reliability of the echocardiographic results, the intraclass correlation coefficient (ICC) was used to evaluate inter- and intra-observer variability, and 22 subjects were randomly chosen for this analysis. Clinical significance was categorized as follows: good (ICC ≥ 0.75), moderate (0.4 ≤ ICC < 0.75), and poor (ICC < 0.4).
A P-value below 0.05 was considered statistically significant.
Results
Following inclusion and exclusion criteria, 62 of 70 patients with hypertension and AMI were enrolled in this study, the majority of whom were men (87.1%) with an average age of 56.95 ± 6.38 years.
We obtained the complete clinical and echocardiographic data of 62 patients with hypertension complicated with AMI at onset and after PCI. The mean follow-up time was 41.27 ± 20.45 months. During follow-up, 20 patients (32.3%) reached one or more endpoints. There were 2 cases (3.3%) of cardiogenic death, 12 cases (19.4%) of recurrent myocardial infarction, 7 cases (11.3%) of heart failure (including 4 cases of recurrent AMI with heart failure), and 3 cases (4.8%) of severe arrhythmia. The Kaplan–Meier survival curve during the follow-up period is shown in Figure 1. Based on the follow-up results, patients were divided into two groups: the RCE (Group RCE) and the non-cardiovascular event (Group NCE) groups.
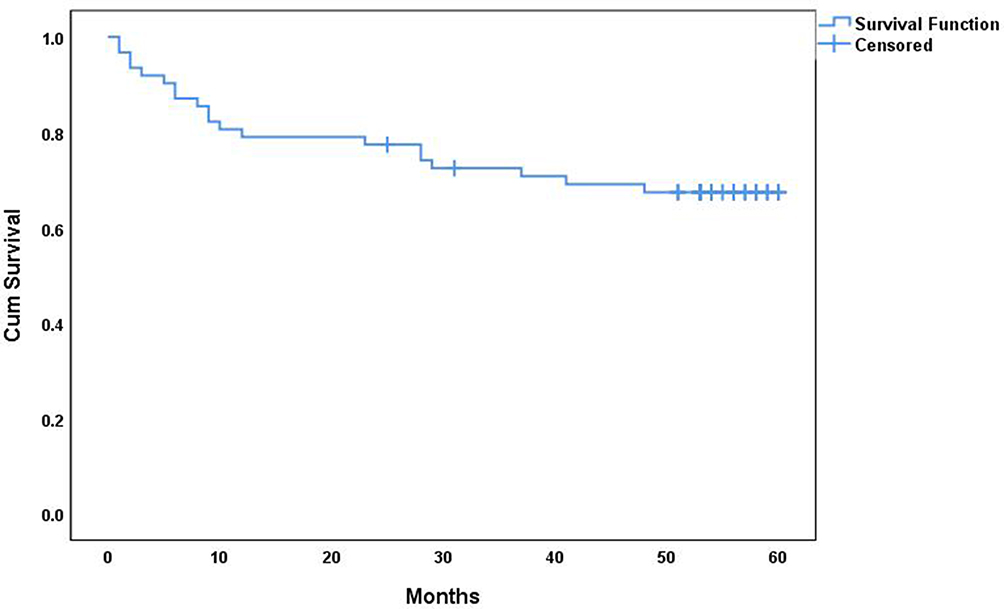 |
Figure 1 Kaplan–Meier survival analysis curve for patients with hypertension accompanied by AMI. The follow-up time was (41.27±20.45) months, and 20 patients had recurrent cardiovascular events during the follow-up period. |
Comparison of the Clinical Data and Echocardiographic Parameters Between the RCE Groups and Non-Cardiovascular Event Groups
Table 1 shows the basic clinical data and analysis results for all patients before PCI. There was no significant difference in the basic clinical data between Group RCE and Group NCE (P > 0.05).
 |
Table 1 Demographic and Clinical Characteristics of Patients in Group NCE and Group RCE |
The analysis of the echocardiographic parameters before and one week after PCI is shown in Table 2, and there was no significant difference between Group RCE and Group NCE (P > 0.05).
 |
Table 2 Echocardiographic Parameters of Patients in Group NCE and Group RCE |
In the comparison of the echocardiographic data one month after PCI, we found that the LVEDV, LVESV, 3D-LVEDV, 3D-LVESV, 3D-GLS, and 3D-GAS of Group RCE were higher than those of Group NCE (LVEDV 137.05 ± 9.26 and 131.20 ± 9.77 mL, LVESV 64.00 ± 6.03 and 60.31 ± 6.34 mL, 3D-LVEDV 146.15 ± 16.34 and 137.83 ± 11.12 mL, 3D-LVESV 70.60 ± 7.69 and 66.36 ± 6.55 mL, 3D-GLS −10.55 ± 2.21% and –12.81±2.48, and 3D-GAS −19.45 ± 3.19% and −21.95 ± 3.59%, respectively; see Table 2), and the differences were statistically significant (P < 0.05).
Analysis of the Echocardiographic Parameters During Follow-Up
Before PCI, one week after PCI, and one month after PCI, the 2D-LVEF and 3D-LVEF of the two groups gradually increased, while the LVESV gradually decreased (P < 0.05). One month after PCI, the 3D-LVESV of the two groups was lower than before PCI and one week after PCI (P < 0.05). These results are shown in Table 2.
In addition, Table 2 and Figure 2 show that in both groups, 3D-GLS, 3D-GCS, and 3D-GAS one month after PCI were all lower than before PCI and one week after PCI, and the 3D-GRS one month after PCI was higher than before PCI and one week after PCI (P < 0.05).
 |
Figure 2 Comparison of 3D strain parameters in patients with hypertension accompanied by AMI during follow-up. Group NCE patients without recurrent cardiovascular event, Group RCE patients with recurrent cardiovascular event; *p value < 0.05 versus Initial echocardiographic findings or one week after PCI. Abbreviations: LV, left ventricle; PCI, percutaneous coronary intervention; 3D-GLS, 3D Global longitudinal strain; 3D-GCS, 3D Global circumferential strain; 3D-GAS, 3D Global radial strain; 3D-GAS, 3D Global area strain. |
Risk Analysis of Recurring Cardiovascular Events in Patients with Hypertension Complicated by Acute Myocardial Infarction
The clinical and echocardiographic variables were determined after univariate analysis using the Cox proportional hazards model in relation to the presence or absence of RCEs (see Table 3). The results showed that the LVEDV, 3D-LVEDV, 3D-LVESV, 3D-GLS, and 3D-GAS one month after PCI were factors related to RCEs (P < 0.05).
 |
Table 3 Univariate and Multivariate Cox Risk Regression Models to Analyze Risk Factors for Recurring Cardiovascular Events in Patients with Hypertension Accompanied by AMI |
According to univariate analysis, LVEDV, 3D-LV LVEDV, 3D-LVESV, 3D-GLS, and 3D-GAS were all factors affecting the recurrence of cardiovascular events. Variables with P < 0.10 values were enrolled in multivariate analysis. There was a strong correlation between LVEDV and 3D-LVEDV and a statistical significance between these two factors (r = 0.89, P < 0.01) (Table 2); therefore, LVEDV was not included in the multivariate analysis. Incorporating the above parameters in the multivariate regression analysis showed that the model likelihood ratio was χ2 = 11.119, P = 0.001, indicating an overall statistically significant model. Finally, the risk factors included in the model were 3D-GLS one month after PCI (HR: 1.481, 95% CI: 1.202–1.824, P < 0.001), and 3D-GAS one month after PCI (HR: 1.254, 95% CI: 1.093–1.440, P = 0.001; see Table 3).
Analysis of the Value of the Three-Dimensional Global Longitudinal Strain and Three-Dimensional Global Area Strain for Predicting Recurring Cardiovascular Events
The areas under the ROC curves of 3D-GLS and 3D-GAS for predicting RCEs were 0.736 (95% CI 0.611–0.862, P = 0.003) and 0.685 (95% CI 0.551–0.818, P = 0.020), respectively. When the 3D-GLS cutoff value was −12.5%, the sensitivity was 80.0%, the specificity was 57.1%, and Youden’s index reached a maximum value of 0.371. When the 3D-GAS cutoff value was –20.5%, the sensitivity was 60.0%, the specificity was 71.4%, and Youden’s index reached a maximum value of 0.314 (see Figure 3).
 |
Figure 3 ROC curves of 3D Global longitudinal strain, 3D Global area strain for predicting recurrent cardiovascular events in patients with hypertension accompanied by AMI. |
Intra- and Interobserver Variability
The variability for strain assessment was measured using 3D echocardiography. Table 4 shows the intra- and interobserver variability for the 3D speckle-tracking echocardiography analysis. The ICCs for intra- and interobserver variability were 0.980–0.993 and 0.855–0.978, respectively, suggesting the consistency of 3D echocardiographic image analysis.
 |
Table 4 Intar-Observer and Inter-Observer Variability of 3D Strain Parameters (n = 22) |
Discussion
Several meaningful and valuable prognostic factors, such as natriuretic peptides, cardiac troponins, galectin 3, soluble suppressor tumorogenicity-2, high-sensitive C-reactive protein, growth differential factor-15, mid-regional pro-adrenomedullin, noncoding RNAs, and other biomarkers exist for predicting the RCEs of patients with AMI after PCI and reconstruction of the myocardium.15 However, tests for these indices are not widely applied in developing countries due to financial constraints; as such, the present study aimed to explore other predictive factors. We collected the clinical data of patients with hypertension complicated by AMI and followed them for an extended time. Concurrently, 3DSTI was used to analyze the degree of LV function impairment in these patients, and longitudinal, circular, and radial wall motion functions were evaluated using 3D-GLS, 3D-GCS, 3D-GRS, and 3D-GAS. The results of this study delivered sensitive indicators that could predict the recurrence of severe cardiovascular events in patients with hypertension complicated by AMI.
The primary findings of our study were as follows. Following PCI, in patients with hypertension complicated by AMI, LV function and 3D strain parameters were gradually improved. The follow-up data of these patients showed that 3D-GLS and 3D-GAS measured one month after PCI could predict RCEs.
The Left Ventricular Structure and Function of Patients with Hypertension Complicated by Acute Myocardial Infarction After Percutaneous Coronary Intervention Were Gradually Improved
Existing studies showed that patients with hypertension complicated by AMI have a poor prognosis,3 which is linked to slow recovery of the myocardial function of the LV. In the current study, one week after PCI, the LVEF showed a slight increase; however, the remaining echocardiographic parameters of the patients in this trial did not improve. This indicated that ischemic myocardial function did not recover significantly in the short term, which may have been related to LV hypertrophy and remodeling.16 Abnormal geometry of the LV affected reperfusion and further impacted the recovery of LV myocardial mechanics. One month after PCI, the LV structure, function, and strain parameters of the participant patients were significantly improved, indicating that cardiac functions had gradually improved over time after myocardial reperfusion. This finding was related to partial ischemic myocardial necrosis after myocardial infarction, known as stunning or hibernation.17
The Predictive Value of Three-Dimensional Strain Parameters for Recurring Cardiovascular Events
Existing studies used echocardiographic parameters to predict the prognosis of patients with AMI undergoing PCI treatment; these studies adopted death or heart failure as combined events because approximately 20% of patients experienced them.18,19 However, the rate of RCEs was significantly higher in our study, in which 20 of 62 patients (32.3%) experienced these events; this indicated antecedent hypertension as being associated with higher rates of death and morbid events during the long-term course of AMI.3
Since the recovery of cardiac function in patients with hypertension complicated by AMI is slow and the prognosis is poor, it is important to evaluate the factors that can predict RCEs. Generally, LV systolic function is considered to be the main predictor of prognosis following an AMI.20 Therefore, analyzing the prognostic value of LV systolic function, combined with the clinical data of patients with hypertension accompanied by AMI, will provide clinically valuable information for predicting RCEs in these patients.
Through the comprehensive analysis of the multifactorial Cox risk regression, this study found that 3D-GLS and 3D-GAS may be independent predictors for adverse events. The results showed that for every 1% increase in 3D-GLS, the risk of RCEs increased by 48.1%, and for every 1% increase in 3D-GAS, the risk of RCEs increased by 25.4%. In addition, these results showed that the diagnostic value of 3D-GLS was higher compared with 3D-GAS, which was consistent with the results of existing studies.18,21,22 Notably, sub-endocardial fibers are more prone to ischemic damage and early alterations during acute ischemia,23 with the longitudinal strain being a marker of sub-endocardial longitudinal shortening;24 as such, the predictive value of 3D-GLS is higher compared with other parameters. Concurrently, our results showed that a 3D-GLS value of −12.5% was an independent predictor of cardiovascular events during follow-up after PCI in patients with hypertension and AMI. In studies comparable to ours, a GLS value of −12% to −14% was independently associated with mortality, heart failure, and stroke.19,25,26 These results may provide valuable information for the clinical treatment of patients with hypertension and AMI.
Limitations
The primary shortcoming of this study was its single-center design, which may have led to bias in the sample selection. Future research should address this problem.
In addition, all patients in the study underwent PCI and overcame the acute onset through an optimized clinical treatment plan. However, it was still difficult to achieve a completely consistent homogeneous treatment as a means for excluding the influence of various treatment factors on patients with RCEs. The main weakness in this regard was that the onset of AMI and the door-to-balloon time of PCI were not included in the analysis. If future research can expand the sample size, reduce the rate of loss to follow-up, and eliminate (as much as possible) the influence of differences in treatment methods on patient prognosis and RCEs it will help improve the accuracy of the analysis results and conclusions of the study.
More importantly, the participants included in the present study were all critically ill, and the image acquisition time was limited. Due to the short acquisition time available for 3D echocardiography, only 3DSTIs (not 2DSTIs) were collected. Accordingly, we did not perform a comparative analysis of the LV 3D and 2D strain parameters.
Conclusions
In the long-term follow-up of patients with hypertension complicated by AMI, the LV structure and function were gradually improved after PCI. Additionally, 3D-GLS and 3D-GAS, measured one month after PCI, were established as predictors of RCEs.
Ethics Approval and Consent to Participate
This study was conducted with approval from the Ethics Committee of Shanxi Academy of Medical Sciences & Shanxi Dayi Hospital (No.YXLL-2019-026). This study was conducted in accordance with the declaration of Helsinki. Written informed consent was obtained from all participants.
Acknowledgments
We would like to acknowledge the hard and dedicated work of all the staff that implemented the intervention and evaluation components of the study.
Funding
Shanxi Province Key Research and Development Plan (Grant Numbers: 201903D321199).
Disclosure
The authors declare that they have no competing interests.
References
1. Adabag AS, Therneau TM, Gersh BJ, Weston SA, Roger VL. Sudden death after myocardial infarction. JAMA. 2008;300(17):2022–2029. doi:10.1001/jama.2008.553
2. Lewington S, Clarke R, Qizilbash N, Peto R, Collins R; Prospective Studies Collaboration. Age-specific relevance of usual blood pressure to vascular mortality: a meta-analysis of individual data for one million adults in 61 prospective studies. Lancet. 2002;360(9349):1903–1913. doi:10.1016/s0140-6736(02)11911-8
3. Pedrinelli R, Ballo P, Fiorentini C, et al. Hypertension and acute myocardial infarction: an overview. J Cardiovasc Med (Hagerstown). 2012;13(3):194–202. doi:10.2459/JCM.0b013e3283511ee2
4. Kannel WB, Sorlie P, Castelli WP, McGee D. Blood pressure and survival after myocardial infarction: the Framingham study. Am J Cardiol. 1980;45(2):326–330. doi:10.1016/0002-9149(80)90654-2
5. Flack JM, Neaton J, Grimm R
6. Osamichi S, Kouji K, Yoshimaro I, et al. Myocardial glucose metabolism assessed by positron emission tomography and the histopathologic findings of microvessels in syndrome X. Circ J. 2004;68(3):220–226. doi:10.1253/circj.68.220
7. Habis M, Capderou A, Ghostine S, et al. Acute myocardial infarction early viability assessment by 64-slice computed tomography immediately after coronary angiography: comparison with low-dose dobutamine echocardiography. J Am Coll Cardiol. 2007;49(11):1178–1185. PMID: 17367662. doi:10.1016/j.jacc.2006.12.032.
8. Shan K, Constantine G, Sivananthan M, Flamm SD. Role of cardiac magnetic resonance imaging in the assessment of myocardial viability. Circulation. 2004;109(11):1328–1334. doi:10.1161/01.CIR.0000120294.67948.E3
9. Moir S, Hanekom L, Fang ZY, et al. Relationship between myocardial perfusion and dysfunction in diabetic cardiomyopathy: a study of quantitative contrast echocardiography and strain rates imaging. Heart. 2006;92(10):1414–1419. doi:10.1136/hrt.2005.079350
10. Truong VT, Phan HT, Pham KNP, et al. Normal ranges of left ventricular strain by three-dimensional speckle-tracking echocardiography in adults: a systematic review and meta-analysis. J Am Soc Echocardiogr. 2019;32(12):1586–97.e5. doi:10.1016/j.echo.2019.07.012
11. Luis SA, Yamada A, Khandheria BK, et al. Use of three-dimensional speckle-tracking echocardiography for quantitative assessment of global left ventricular function: a comparative study to three-dimensional echocardiography. J Am Soc Echocardiogr. 2014;27(3):285–291. doi:10.1016/j.echo.2013.11.002
12. Tops LF, Delgado V, Marsan NA, Bax JJ. Myocardial strain to detect subtle left ventricular systolic dysfunction. Eur J Heart Fail. 2017;19(3):307–313. doi:10.1002/ejhf.694
13. De Luca G, Ernst N, Zijlstra F, et al. Preprocedural TIMI flow and mortality in patients with acute myocardial infarction treated by primary angioplasty. J Am Coll Cardiol. 2004;43(8):1363–1367. doi:10.1016/j.jacc.2003.11.042
14. Dolgin M. Nomenclature and Criteria for Diagnosis of Diseases of the Heart and Great Vessels. The Criteria Committee of the New York Heart Association.
15. Berezin AE, Berezin AA. Adverse cardiac remodelling after acute myocardial infarction: old and new biomarkers. Dis Markers. 2020. 2020:1215802. doi:10.1155/2020/1215802
16. Parodi G, Carrabba N, Santoro GM, et al. Heart failure and left ventricular remodeling after reperfused acute myocardial infarction in patients with hypertension. Hypertension. 2006;47(4):706–710. doi:10.1161/01.HYP.0000210549.47167.db
17. Romero J, Kahan J, Kelesidis I, et al. CMR imaging for the evaluation of myocardial stunning after acute myocardial infarction: a meta-analysis of Prospective trials. Eur Heart J Cardiovasc Imaging. 2013;14(11):1080–1091. doi:10.1093/ehjci/jet040
18. Park YH, Kang SJ, Song JK, et al. Prognostic value of longitudinal strain after primary reperfusion therapy in patients with anterior-wall acute myocardial infarction. J Am Soc Echocardiogr. 2008;21(3):262–267. doi:10.1016/j.echo.2007.08.026
19. Lacalzada J, de la Rosa A, Izquierdo MM. Left ventricular global longitudinal systolic strain predicts adverse remodeling and subsequent cardiac events in patients with acute myocardial infarction treated with primary percutaneous coronary intervention. Int J Cardiovasc Imaging. 2015;31(3):575–584. doi:10.1007/s10554-015-0593-2
20. Møller JE, Hillis GS, Oh JK, Reeder GS, Gersh BJ, Pellikka PA. Wall motion score index and ejection fraction for risk stratification after acute myocardial infarction. Am Heart J. 2006;151(2):419–425. doi:10.1016/j.ahj.2005.03.042
21. Antoni ML, Mollema SA, Delgado V, et al. Prognostic importance of strain and strain rate after acute myocardial infarction. Eur Heart J. 2010;31(13):1640–1647. doi:10.1093/eurheartj/ehq105
22. Stanton T, Leano R, Marwick TH. Prediction of all-cause mortality from global longitudinal speckle strain: comparison with ejection fraction and wall motion scoring. Circ Cardiovasc Imaging. 2009;2(5):356–364. doi:10.1161/CIRCIMAGING.109.862334
23. Mor-Avi V, Lang RM, Badano LP, et al. Current and evolving echocardiographic techniques for the quantitative evaluation of cardiac mechanics: ASE/EAE consensus statement on methodology and indications endorsed by the Japanese Society of Echocardiography. J Am Soc Echocardiogr. 2011;24(3):277–313. doi:10.1016/j.echo.2011.01.015
24. Prastaro M, Pirozzi E, Gaibazzi N, et al. Expert review on the prognostic role of echocardiography after acute myocardial infarction. J Am Soc Echocardiogr. 2017;30(5):431–43.e2. doi:10.1016/j.echo.2017.01.020
25. Abate E, Hoogslag GE, Antoni ML, et al. Value of three-dimensional speckle-tracking longitudinal strain for predicting improvement of left ventricular function after acute myocardial infarction. Am J Cardiol. 2012;110(7):961–967. doi:10.1016/j.amjcard.2012.05.023
26. Bastawy I, Ismail M, Hanna HF, Kilany WE. Speckle tracking imaging as a predictor of left ventricular remodeling 6 months after first anterior ST elevation myocardial infarction in patients managed by primary percutaneous coronary intervention. Egypt Heart J. 2018;70:343–352. doi:10.1016/j.ehj.2018.06.006
 © 2021 The Author(s). This work is published and licensed by Dove Medical Press Limited. The
full terms of this license are available at https://www.dovepress.com/terms
and incorporate the Creative Commons Attribution
- Non Commercial (unported, 3.0) License.
By accessing the work you hereby accept the Terms. Non-commercial uses of the work are permitted
without any further permission from Dove Medical Press Limited, provided the work is properly
attributed. For permission for commercial use of this work, please see paragraphs 4.2 and 5 of our Terms.
© 2021 The Author(s). This work is published and licensed by Dove Medical Press Limited. The
full terms of this license are available at https://www.dovepress.com/terms
and incorporate the Creative Commons Attribution
- Non Commercial (unported, 3.0) License.
By accessing the work you hereby accept the Terms. Non-commercial uses of the work are permitted
without any further permission from Dove Medical Press Limited, provided the work is properly
attributed. For permission for commercial use of this work, please see paragraphs 4.2 and 5 of our Terms.