Back to Journals » International Journal of Chronic Obstructive Pulmonary Disease » Volume 16
The Value of Impulse Oscillometric Parameters and Quantitative HRCT Parameters in Differentiating Asthma–COPD Overlap from COPD
Authors Lu D ![]() , Chen L, Fan C
, Chen L, Fan C ![]() , Zeng W, Fan H, Wu X, Yu H
, Zeng W, Fan H, Wu X, Yu H
Received 30 July 2021
Accepted for publication 5 October 2021
Published 19 October 2021 Volume 2021:16 Pages 2883—2894
DOI https://doi.org/10.2147/COPD.S331853
Checked for plagiarism Yes
Review by Single anonymous peer review
Peer reviewer comments 2
Editor who approved publication: Professor Min Zhang
Dongzhu Lu,* Lichang Chen,* Chaofan Fan, Wenyi Zeng, Huizhen Fan, Xiping Wu, Huapeng Yu
Department of Pulmonary and Critical Care Medicine, Zhujiang Hospital, Southern Medical University, Guangzhou, People’s Republic of China
*These authors contributed equally to this work
Correspondence: Huapeng Yu
Department of Pulmonary and Critical Care Medicine, Zhujiang Hospital, Southern Medical University, Guangzhou, 510220, People’s Republic of China
Tel +86 20 61643175
Fax +86 20 84306143
Email [email protected]
Purpose: To evaluate the value of impulse oscillometry (IOS) and quantitative HRCT parameters for differentiating asthma–COPD overlap (ACO) in COPD patients.
Patients and Methods: We enrolled 44 controls and 66 COPD patients, divided into the pure COPD group (n=40) and the ACO group (n=26). Spearman correlation analysis was utilized to assess the relationship between the quantitative HRCT and IOS parameters. A binary logistic regression analysis was performed to analyze the associations between the different variables and the risk of ACO. Receiver operating characteristic (ROC) curves were employed to identify the optimal cutoff and assess the diagnostic value of relative volume change − 856 HU to − 950 HU (RVC− 856 to − 950), decrease in the resistance from 5 Hz to 20 Hz (R5-R20) and their combination in predicting ACO. Bootstrapping validation was used to evaluate the internal validation. The concordance index (C-index) and calibration plot were calculated to assess the discrimination and calibration of the prediction model.
Results: Binary logistic regression analysis indicated that RVC− 856 to − 950 and the IOS parameters (R5-R20, R5, X5) were independently correlated with a higher risk of developing ACO after adjusting for age, sex, body mass index (BMI), history of smoking, exacerbation and atopy or allergic rhinitis. A correlation analysis showed a good correlation between the pulmonary function parameters and RVC− 856 to − 950, with a weaker correlation with the % area of low attenuation (LAA%) in ACO patients. Combining RVC− 856 to − 950 and R5-R20 to predict ACO, the AUC was 0.909, and the optimal cutoff value was >-0.62 for RVC− 856 to − 950 and > 0.09 for R5-R20. Good calibration and favorable discrimination were displayed with a higher C-index.
Conclusion: More serious small airway impairment exists in ACO patients. The combination of RVC− 856 to − 950 and R5-R20 could be applied to differentiate ACO from COPD patients.
Keywords: relative volume change − 856 HU to − 950 HU, decrease in resistance from 5 Hz to 20 Hz, quantitative HRCT, ROC curve, diagnosis
Introduction
Asthma and COPD are both considered chronic inflammatory disorders of the airway. In clinical practice, it is not easy to distinguish between asthma and COPD. Moreover, a significant proportion of subjects who have overlapping features of the two conditions, termed asthma-COPD overlap (ACO),1–3 makes the diagnosis of obstructive lung diseases more challenging and difficult. Currently, there is a lack of universally accepted criteria and therapeutic information related to ACO, as these patients are often excluded from a majority of large clinical trials; thus, it is easy to misclassify ACO phenotypes in clinical practice, which can cause ineffective treatment with an increased risk of undesired side effects4 and a poor prognosis. Due to the different diagnostic criteria and the sample sizes used, previous studies have reported that approximately 5–20% of patients diagnosed with COPD have ACO.2,3,5,6 Evidence has demonstrated that patients with ACO experience more frequent symptoms, more severe and frequent exacerbations and hospitalizations, more comorbidities, more impaired lung function, a worse quality of life, greater economic burdens and a higher risk of death than those with either COPD or asthma alone.7–10 A combination of inhaled corticosteroids (ICSs), long-acting beta-agonists (LABAs), and long-acting muscarinic antagonists (LAMAs) are commonly recommended for ACO patients. In contrast, the addition of ICS to LABAs and/or LAMAs should only be used when COPD patients still experience frequent or severe exacerbation events despite suitable and adequate maintenance bronchodilator treatment, especially if blood eosinophils are higher than 300 cells·µL−1, but ICS monotherapy is not recommended for COPD patients.11 Although ICS use can reduce acute exacerbation rates and delay declines in lung function, inappropriate use of ICS will increase the risk of respiratory infections.4 As mentioned previously, it is essential to distinguish ACO from COPD and then carry out appropriate and effective clinical management as early as possible.
As the most widely employed pulmonary function test, spirometry is usually used to assess airflow limitation and monitor disease progression in obstructive lung diseases; however, spirometry is insufficient and not precise enough to discriminate between COPD and ACO. Respiratory impedance, measured by the IOS, which is comprised of respiratory resistance and reactance, provides additional valuable information on small airway function12 and is deemed to have greater sensitivity than spirometry in terms of detecting subtle changes in airways in COPD and asthma.13 Respiratory impedance abnormalities have been exhibited even in healthy smokers without airflow limitation (on the basis of spirometry), which indicates that there are structural changes of the small airways in the early period of the disease.14,15 A previous study indicated that the IOS parameters were higher in the ACO group than in the COPD group.16 Thus, IOS measurements could be a useful tool to clarify the features of ACO. Additionally, quantitative HRCT is noninvasive and can be used as an established technique for analyzing the changes in lung morphometry and densitometry in patients with chronic airway disease, which allows for the comparison of the features of airway remodeling, emphysema and air trapping between ACO and COPD. Taken together, the differences in physiology and morphology between ACO and COPD might help to understand and differentiate between these two diseases. Therefore, we hypothesized that IOS parameters coupled with quantitative HRCT parameters would improve the clinical recognition of ACO patients among patients with COPD.
Herein, we aimed to compare the physiological, morphometric and densitometric changes of airways in COPD patients versus ACO patients in a cohort of patients with COPD, which were measured by the IOS and HRCT scans, respectively. Furthermore, we evaluated the diagnostic value of the IOS parameters and quantitative HRCT parameters to provide a basis for identifying ACO among patients with COPD.
Patients and Methods
Participants
In this prospective study, we enrolled 110 participants: 66 patients with COPD and 44 normal control participants who underwent pulmonary function tests (spirometry and IOS tests) and chest HRCT scans from outpatient clinics between August 2017 and December 2018. The diagnosis of COPD was based on the GOLD guidelines.17 The main inclusion criteria were as follows: (1) age ≥40 years old; (2) history of smoking ≥10 pack-years; (3) persistent respiratory symptoms, including productive cough, wheezing, and progressive exertional dyspnea; and (4) persistent airflow limitation (postbronchodilator FEV1/FVC ratio<70%). Among the patients with COPD, those who had (1) variable clinical history compatible with asthma (wheezing, chest tightness, shortness of breath, or cough) and (2) variable expiratory airflow limitation (postbronchodilator improvement in FEV1> 12% and > 200 mL from baseline values) were diagnosed with ACO.11
Therefore, the COPD patients were allocated to the COPD group (n=40) or the ACO group (n=26). All patients were in the stable condition. The exclusion criteria were as follows: 1) medical history of any other pre-existing respiratory diseases (such as interstitial lung disease, pulmonary tuberculosis, bronchiectasis, or lung cancer) or significant cardiovascular comorbidities or a history of surgical lung resection; 2) having received intravenous or oral glucocorticoid therapy in the month preceding enrollment, the use of long-acting β2 agonists or theophylline in the previous 48 hours, the use of inhaled corticosteroids in the previous 24 hours, or the use of short-acting β2 agonists in the previous 4 hours; 3) pregnancy or lactation; and 4) inability to complete pulmonary function tests. The control participants had no respiratory symptoms and no history of other respiratory diseases, including asthma or COPD, and had normal pulmonary function and HRCT imaging. The enrollment flow chart of the study is presented in Figure 1.
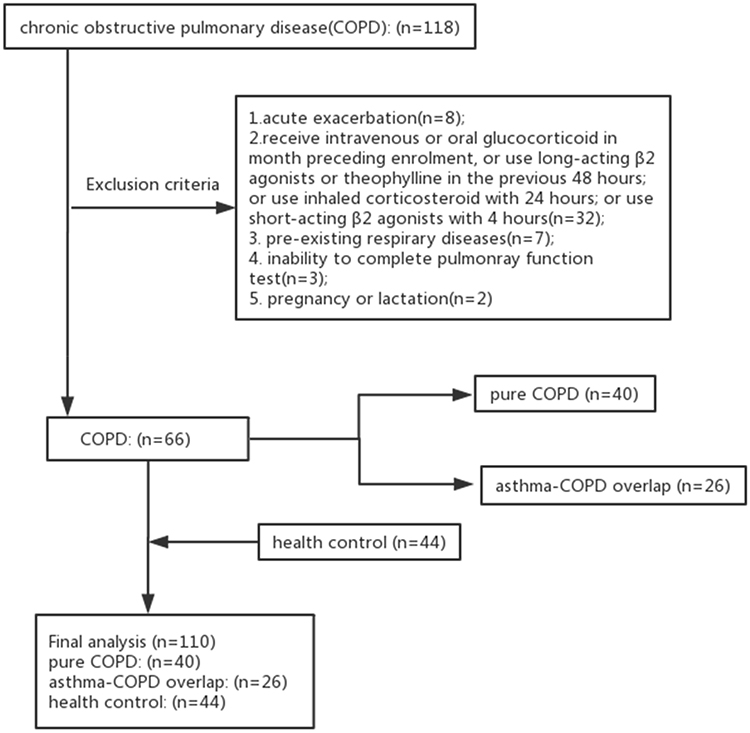 |
Figure 1 Enrollment flow chart of study. |
Pulmonary Function Tests
We performed pulmonary function tests [including spirometry and impulse oscillation (IOS)] using a Jaeger Master Screen IOS-Jaeger (Germany). We measured the following parameters: FEV1/forced vital capacity (FEV1/FVC) (%), FEV1 (%pred), FVC (%pred), forced expiratory flow at 25% of the FVC (FEF25%) (%pred), forced expiratory flow at 50% of the FVC (FEF50%) (%pred) and FEF25-75% (%pred). In addition, IOS was performed according to current standard recommendations18,19 and was calibrated daily. The resistances at 5 Hz (R5) and 20 Hz (R20) reflected the total and central airway resistances, respectively, and peripheral airway resistance was obtained from their difference (R5–R20). The reactance at 5 Hz (X5) represented the resistance to inertia and elasticity within the lung. The elastic and inert properties are equal and opposite between 8 and 12 Hz where reactance at zero is termed the resonant frequency (Fres). The area under the reactance curve (AX) is considered to be associated with the resistance at lower frequencies and reflects the elastic properties of the peripheral lungs.20 A minimum of 3 measurements were performed in each participant.
HRCT Scans
HRCT scans were performed within 24 hours of the pulmonary function tests using a multidetector CT scanner (Brilliance iCT, Philips Healthcare) with the following parameters: collimation at 128×0.625 mm; 120 kVp; 100 mAs; rotation time at 0.5 s; and pitch at 0.915. The scans were performed in the supine position with the arms held over the head at suspended full inspiration. The bronchi images were reconstructed using a high-spatial frequency(bone) algorithm and the ratio of emphysema was evaluated with a soft tissue algorithm. The right upper lobe apical segmental bronchus (RB1) was selected as the target bronchial tube for detailed analysis. The 4th- to 6th-generation airways of RB1 were identified and analyzed.
HRCT Data Analysis
Quantification of Emphysema, Airway Wall Dimensions and Air Trapping
COPD analysis software was employed for the assessment of emphysema, airway wall dimensions and air trapping (Figures 2 and 3). The three lung density parameters were calculated automatically: the % area of low attenuation (LAA%)], relative volume change −856 HU to −950 HU (RVC−856 to −950) and the expiration to inspiration ratio of mean lung density (MLDE/I). LAA% was defined as the percentage of low-attenuation areas lower than −950 Hounsfield units (HU) on inspiratory CT.21 RVC−856 to −950 was calculated by the following formula: RVC−856 to −950 = relative lung volume −856 HU to −950 HU on expiratory CT%−relative lung volume −856 HU to −950 HU on inspiratory CT%.22 MLDE/I was calculated as the ratio of the expiratory to the inspiratory mean lung density in HU.23 Measurement of the RVC−856 to −950 and the MLDE/I values allowed for an indirect quantitative evaluation of air trapping and reflected peripheral airway obstruction regardless of the severity of emphysema, as shown in previous studies.22,24 We also measured and recorded the bronchial parameters [wall thickness (WT), wall area (WA), luminal area (LA), wall area percentage (WA%)] from the 4th-6th generation of RB1 to evaluate the airway wall dimensions. To balance the effect of BSA, WT/BSA, WA/BSA, and LA/BSA were calculated. The WA was calculated as TA (total area)- LA, and the WA% was calculated as [WA/TA×100%]. These quantitative HRCT parameters were measured by two independent radiologists who were blinded to the participants’ clinical histories and diagnoses.
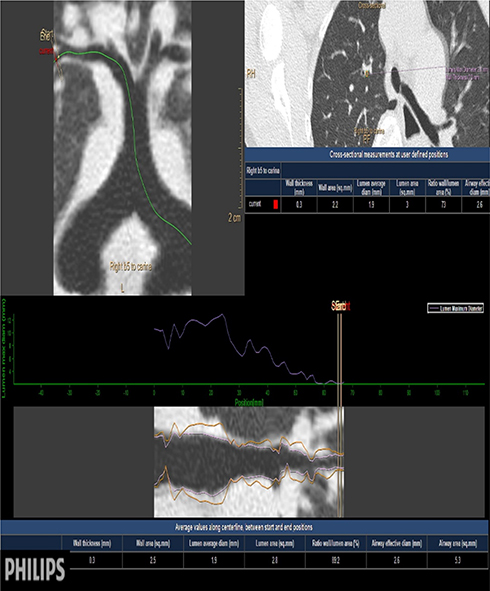 |
Figure 2 Quantitative measurement of airways by HRCT. |
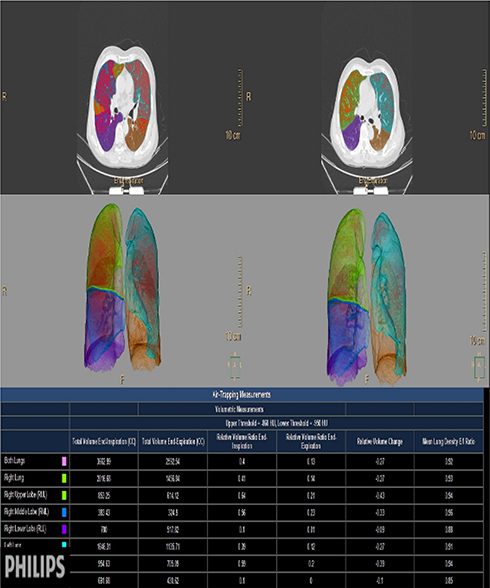 |
Figure 3 Quantitative measurement of emphysema and air trapping by HRCT. |
Statistical Analysis
The distribution of the quantitative data was examined with the Kolmogorov–Smirnov method. Normally distributed data are reported as the mean (SD), while nonnormally distributed data are expressed as the median (range). To compare the differences in the parameters of the COPD group, ACO group and control group, ANOVA and the Kruskal–Wallis test were used for normally and nonnormally distributed variables, respectively. Next, Pearson or Spearman correlation analysis was utilized to assess the relationships between the quantitative HRCT parameters and the pulmonary function indices. Additionally, the associations between the different variables and the risk of ACO were estimated using univariate analysis and a binary logistic regression analysis. Parameters from the univariate analyses with a P < 0.05 were selected for the multivariate logistic regression analyses, and the model was adjusted for age, sex, BMI, history of smoking, exacerbation and atopy or allergic rhinitis. The results are presented as odds ratios (ORs) with 95% confidence intervals (CIs). Finally, the ROC curve was used to evaluate the diagnostic value of a combination of the quantitative HRCT and IOS parameters or either parameter alone, which simultaneously obtained the optimal cutoff values. The differences in the areas under the curves (AUCs) were compared by the DeLong test. P values < 0.05 were considered to be statistically significant. The concordance index (C-index) and calibration plot were calculated to assess the discrimination and calibration of the models, which were established using 1000 bootstrapped resamples.
Results
Participants’ Characteristics
We included 110 participants; 44 participants were enrolled as healthy controls, 40 of the 66 COPD patients were allocated to the pure COPD group and 26 participants were included in the ACO group. Comparisons of the patient demographic information are shown in Table 1. The mean age, sex ratio and BMI were significantly different between the three groups (P=0.019, P=0.004 and P=0.011, respectively). The COPD patients were older than the controls (P=0.004). The male ratio was significantly higher in the COPD group than in the ACO group and the healthy controls (COPD 87.50% versus ACO 61.54%, P=0.009 and COPD 87.50% versus control 54.55%, P=0.001); however, the male to female ratio between the ACO group and the healthy controls was not statistically significant (P=0.660). The ACO subjects had more exacerbations requiring hospitalizations or visits to the emergency department in the year preceding enrollment (P=0.028). There was no significant difference in BSA, smoking history or inhaled medications (LAMA, ICS/LABA or ICS/LABA/LAMA) among the participants in the different groups.
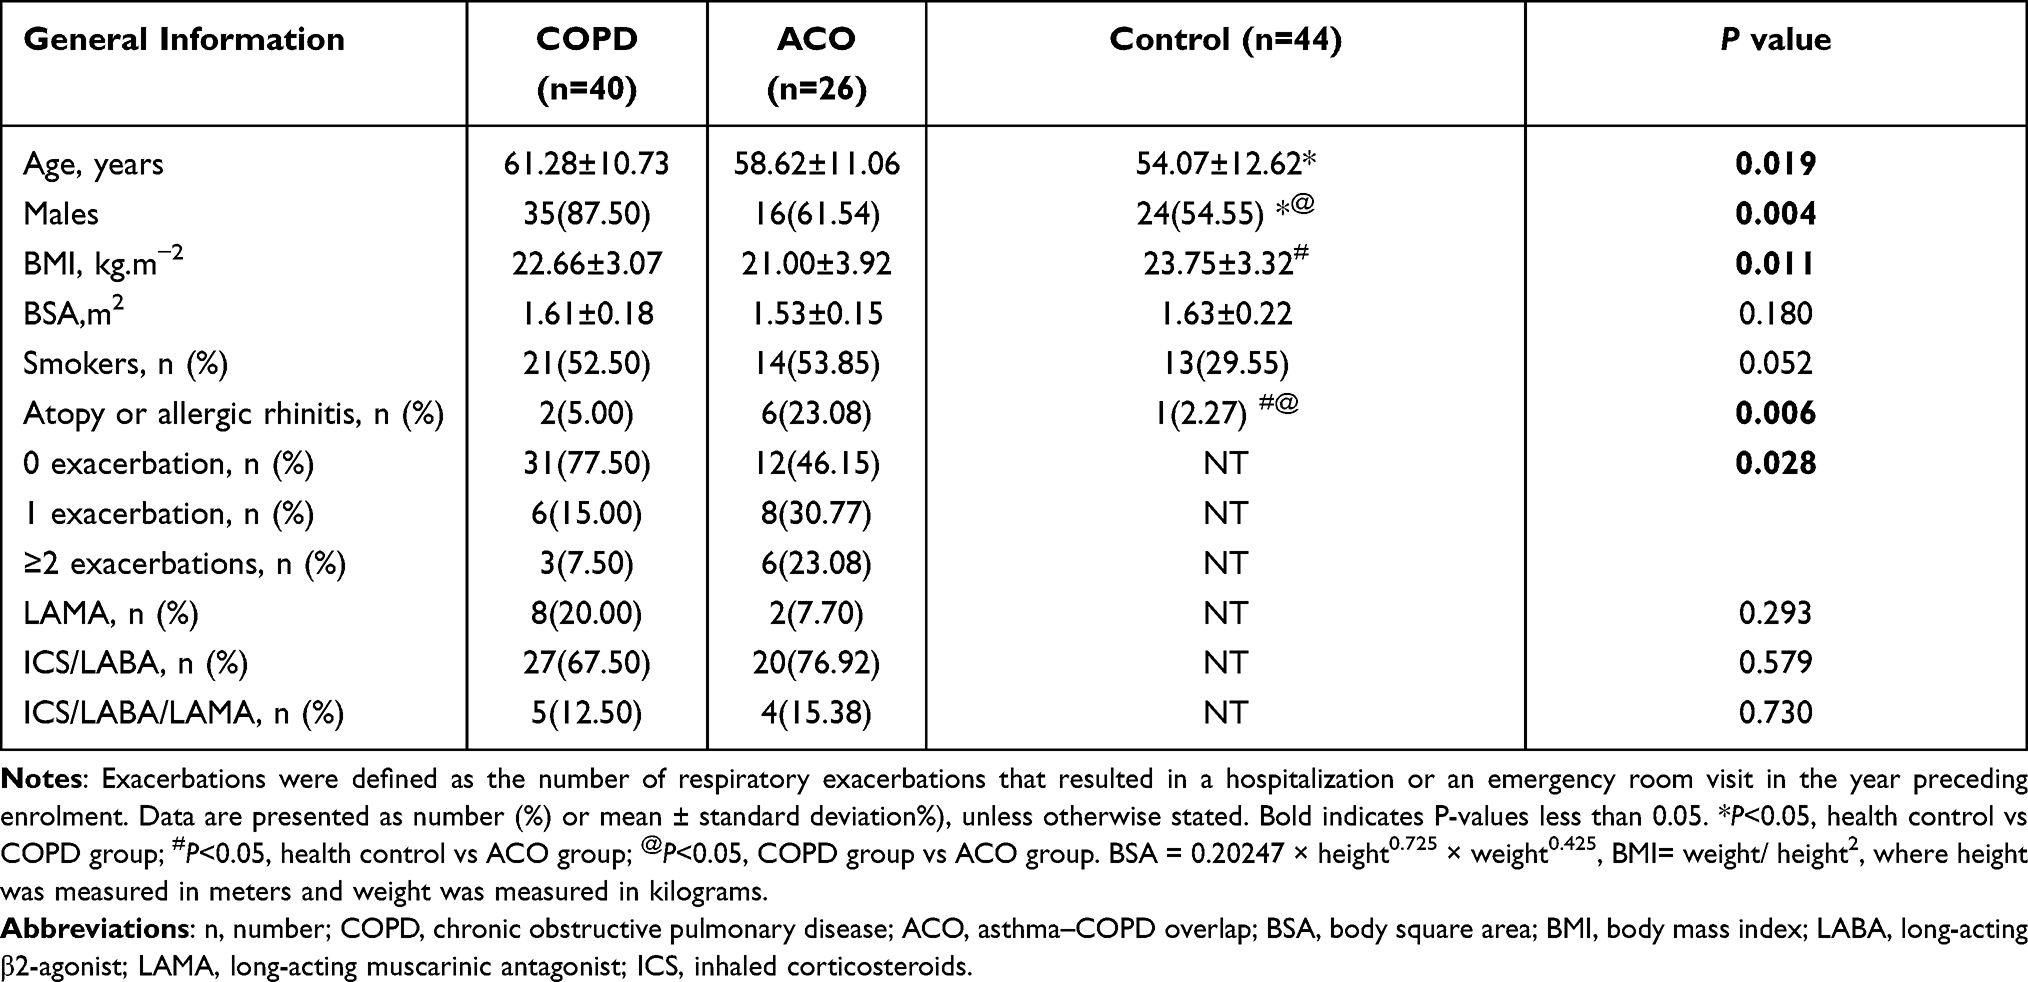 |
Table 1 Comparison of General Information Among the Healthy Control, COPD Patients, and ACO Patients |
Differences in the Spirometry and IOS Indices Among the Healthy Control, COPD Patients, and ACO Patients
The pulmonary function test results (including spirometry and IOS) are presented in Table 2. All spirometry indices were significantly lower in the ACO and COPD groups than in the healthy control group (P<0.001). Except for R20, the IOS values were significantly different between the groups (all P<0.001). The ACO group showed significantly higher R5, R5-R20 and X5 than patients with COPD (P<0.05).
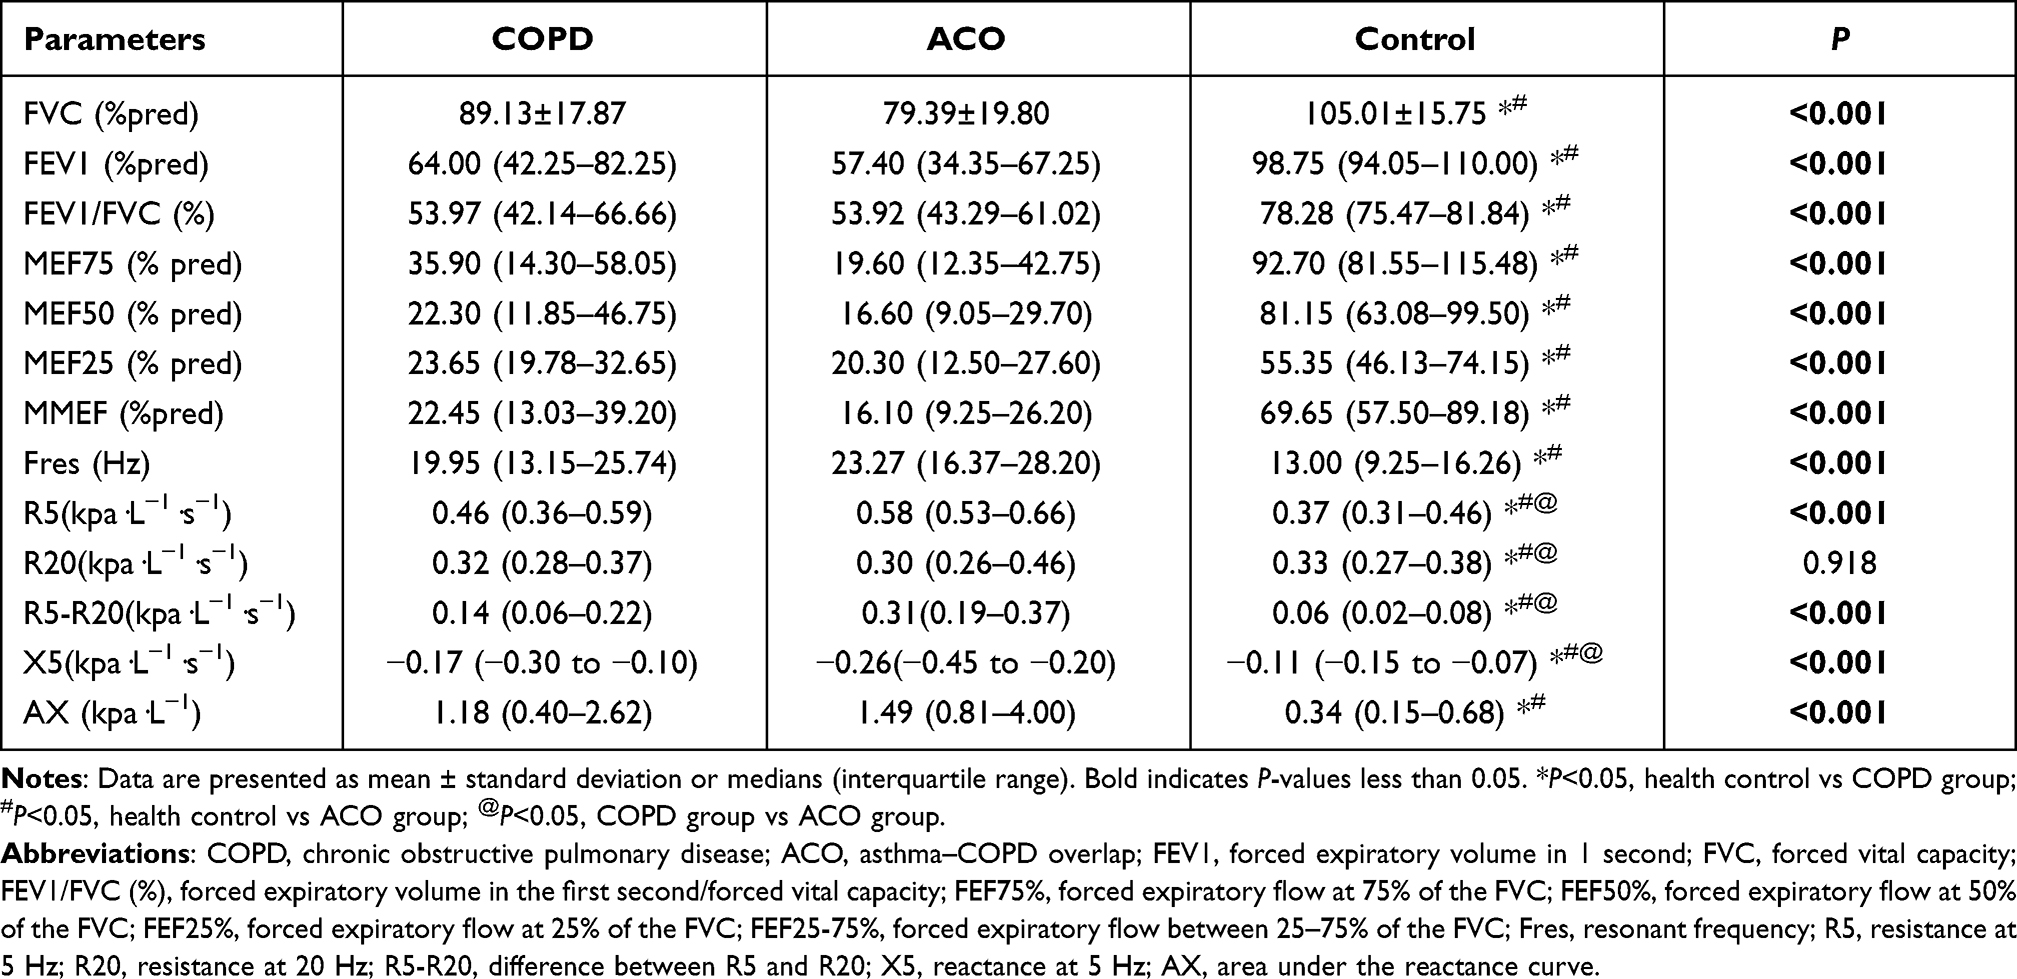 |
Table 2 Pulmonary Function Test Results Among the Healthy Control, COPD Patients, and ACO Patients |
HRCT Differences Among the Healthy Control, COPD Patients, and ACO Patients
The quantitative HRCT results for the healthy control, COPD and ACO patients are shown in Table 3. Significant differences in the bronchial parameters (WT, WA, WA% from the 4th to 6th bronchi) and air trapping parameters (RVC−856 to −950, and MLDE/I) between the groups were observed among the groups, except LA5/BSA and LA6/BSA (P=0.575, P=0.335, respectively). A pairwise comparison showed that the COPD and ACO groups had significantly higher LAA%, WT, WA, WA% and MLDE/I than the control group, although there were no statistically significant differences between the ACO and COPD groups. In contrast, patients with ACO showed a significantly higher RVC−856 to −950 level than the COPD patients (P=0.001).
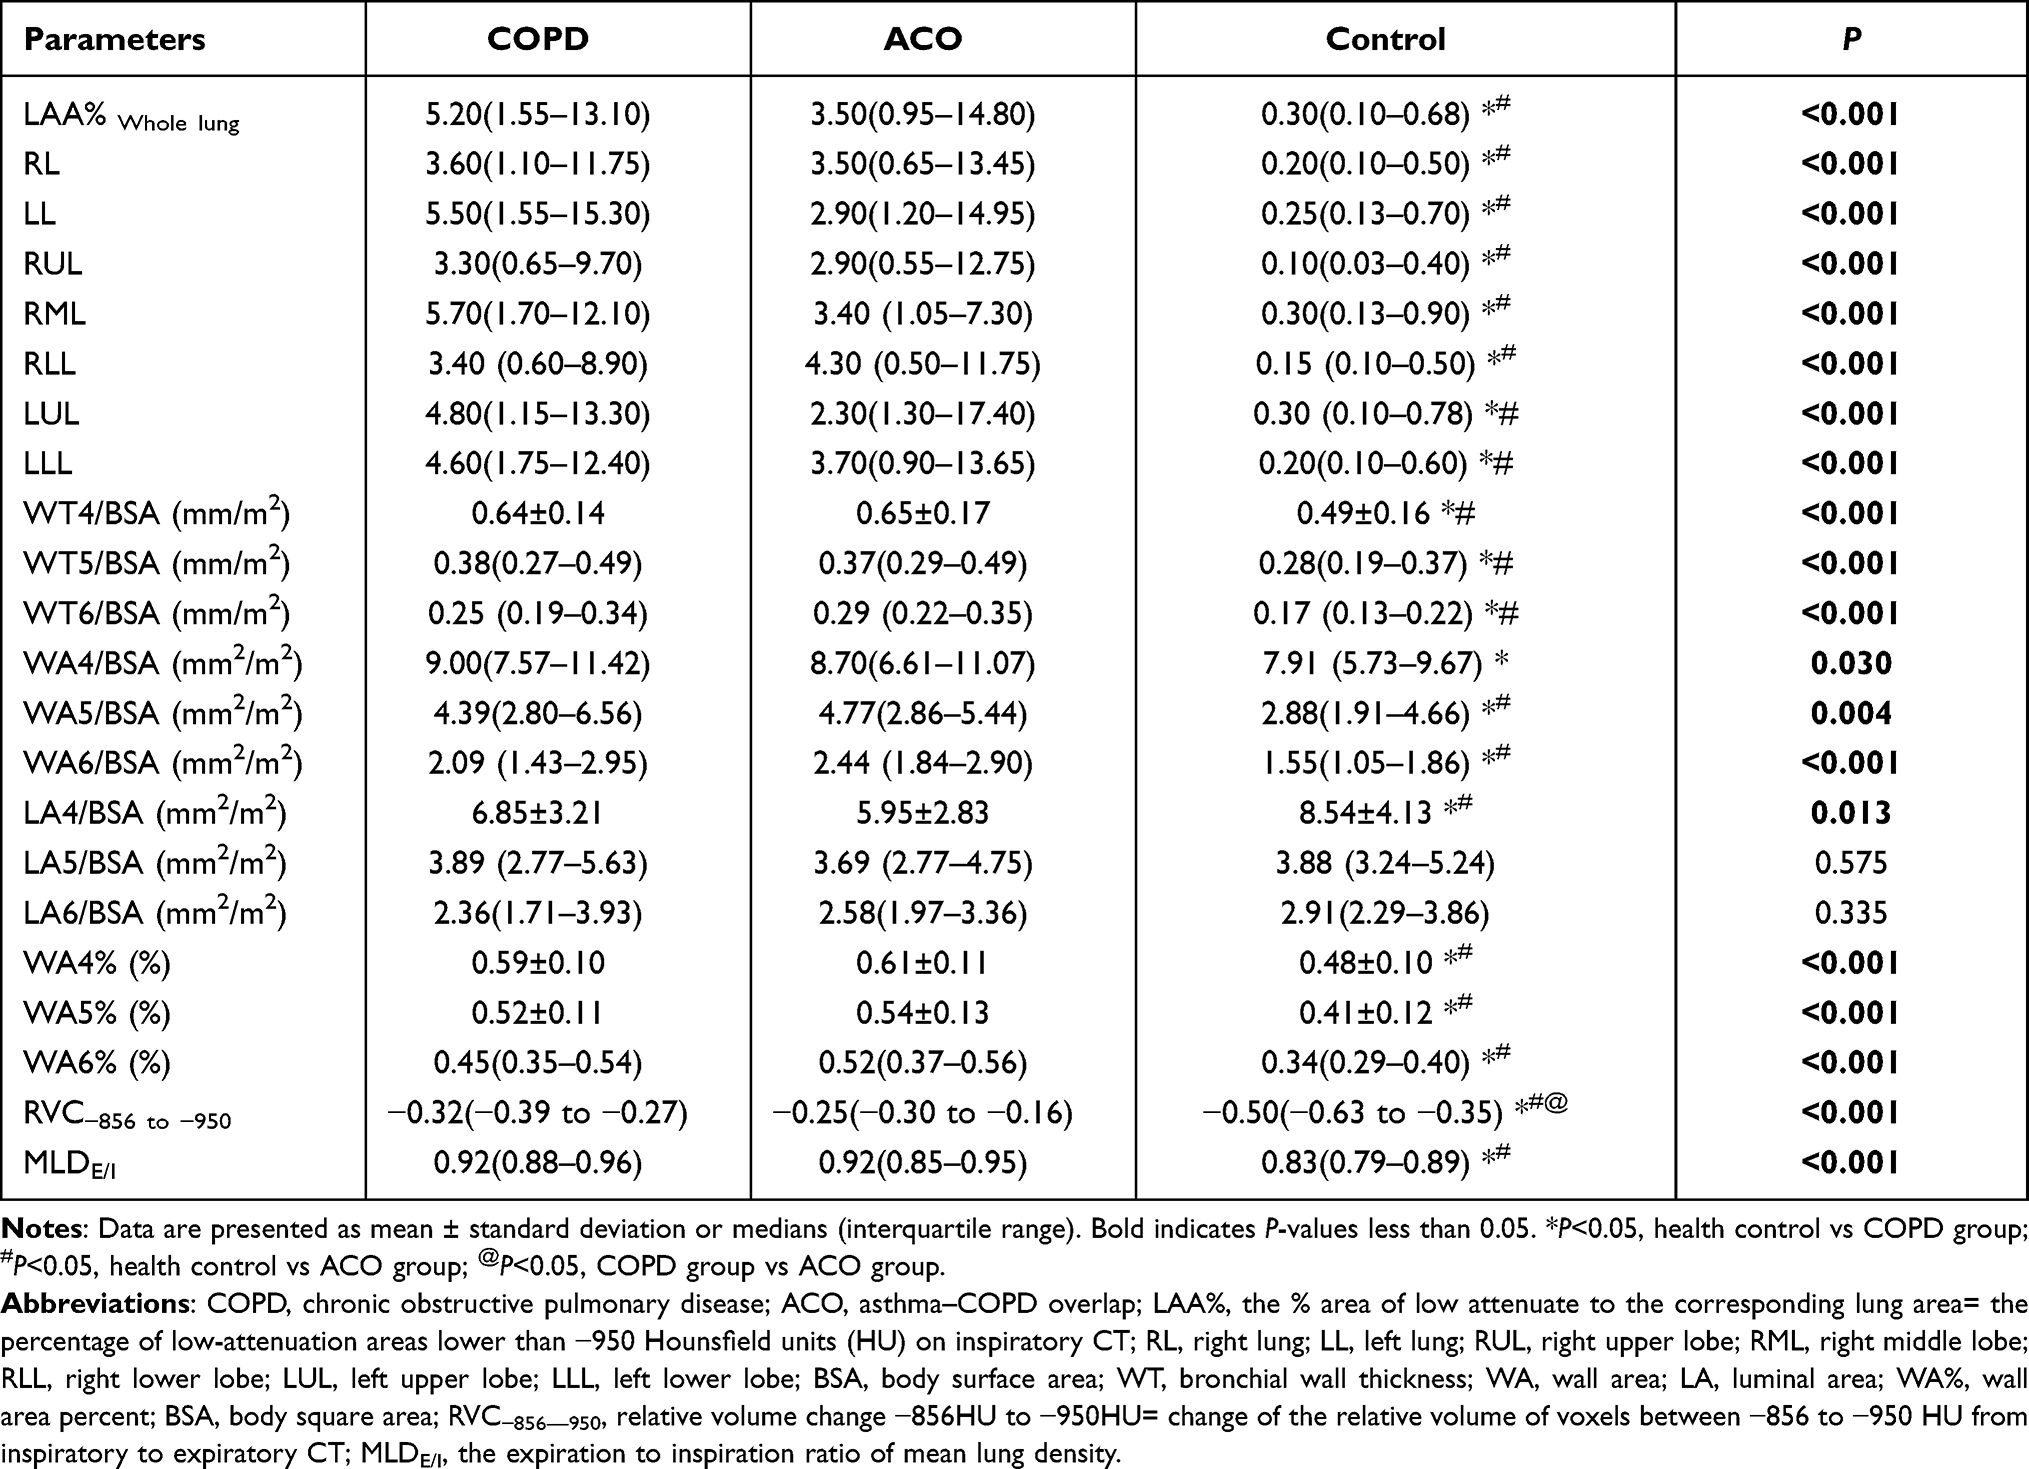 |
Table 3 Quantitative HRCT Parameters Among the Healthy Control, COPD Patients, and ACO Patients |
Correlations Between the Quantitative HRCT Parameters and Pulmonary Function Indices in COPD Patients and ACO Patients
Correlations between the HRCT parameters and the pulmonary function indices are shown in Supplementary Tables S1 and S2. Moderate-to-strong correlations were observed between the emphysema parameters, air trapping parameters and pulmonary function indices in the patients with COPD. However, the WA% values showed no significant correlations with the spirometry indices. Airflow obstruction in the patients with COPD was strongly associated with the LAA% values and, to a lesser extent, the RVC−856 to −950 and MLDE/I values. In contrast, there was a good correlation between airflow limitation and the RVC−856 to −950 and MLDE/I values, with a weaker correlation with LAA% in the patients with ACO.
Univariate Analysis and Multivariate Analysis of the Association of RVC−856 to −950 and IOS Parameters with ACO Among COPD Patients
The results of the univariate analysis showed that patients with RVC−856 to −950 in the higher group (≥-0.41) had a higher risk of developing ACO than patients in the lower group (<-0.41) (odds ratio [OR]: 3.365, 95% confidence interval [CI]: 1.541–7.344, P<0.001). We further performed a binary logistic regression analysis to ensure that the relationship between the disease group and the different parameters could be assessed by adjusting for the participants’ general information (age, sex, BMI, smoking history, exacerbation history and atopy or allergic rhinitis). After adjusting for confounders, we found that the significant difference remained statistically significant (odds ratio [OR]: 3.615, 95% confidence interval [CI]: 1.010–12.940, P=0.048). The same result was also found for R5-R20, R5 and X5 (Table 4).
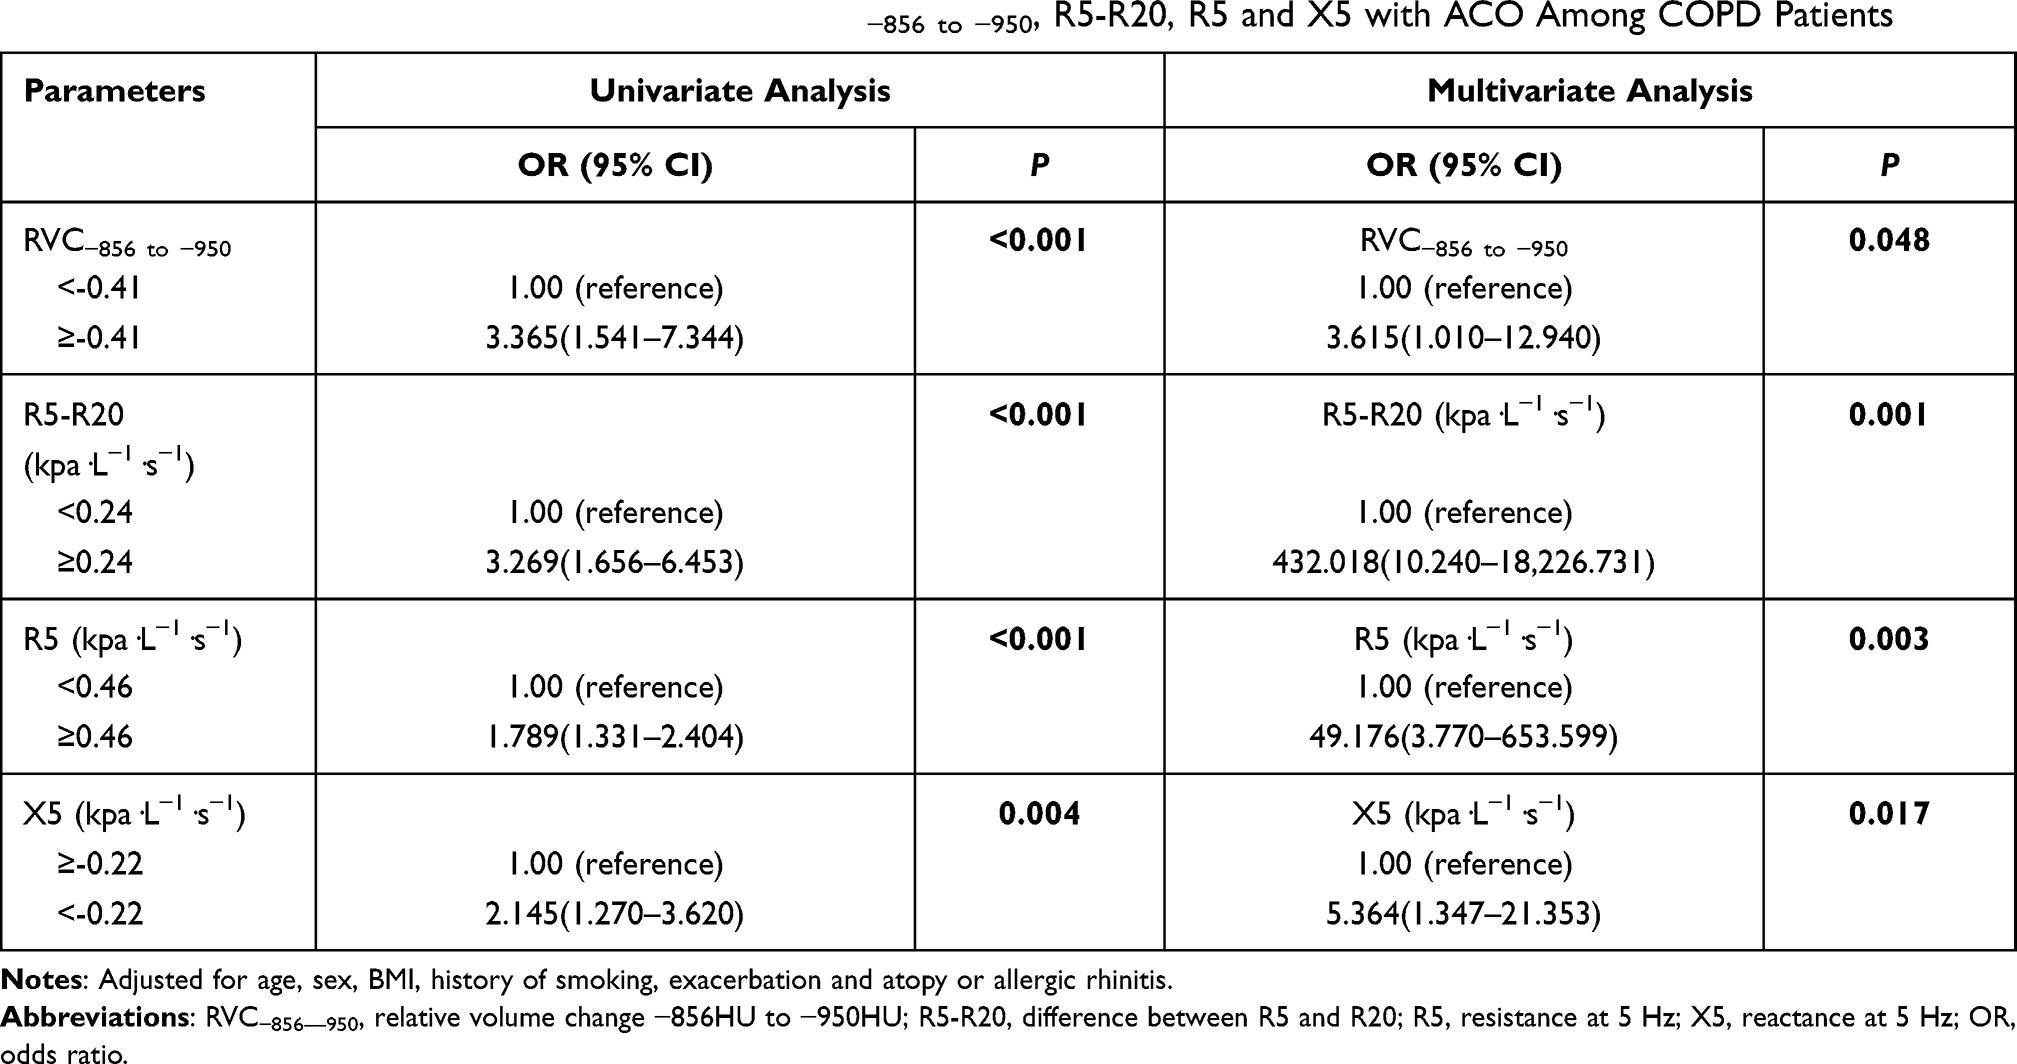 |
Table 4 Multivariate Analysis of the Association of RVC−856 to −950, R5-R20, R5 and X5 with ACO Among COPD Patients |
The Value of RVC−856 to −950 and Small Airway Parameters for Diagnosing ACO
Significant differences were found between the COPD and ACO groups in terms of the following indicators: RVC−856 to −950, R5-R20, R5 and X5. Thus, these are potential diagnostic indicators for distinguishing ACO from COPD. To evaluate the value of the indicators above, we used ROC curves to differentiate ACO patients from COPD patients. The AUCs and the optimal cutoff values are shown in Table 5. The largest AUCs for diagnosing ACO were the RVC−856 to −950 (AUC, 0.803) and the R5-R20 level (AUC, 0.771), along with the optimal cutoff points of −0.41 and 0.24, respectively. Therefore, we combined RVC−856 to −950 and R5-R20 (AUC=0.909) to improve the diagnostic value. The optimal cutoff points for recognizing ACO from COPD were RVC−856 to −950>-0.62 and R5-R20>0.09 with a sensitivity of 76.19% and a specificity of 95.12%, which gives a positive predictive value (PPV) of 88.9% and a negative predictive value (NPV) of 88.6% for ACO (Figure 4).
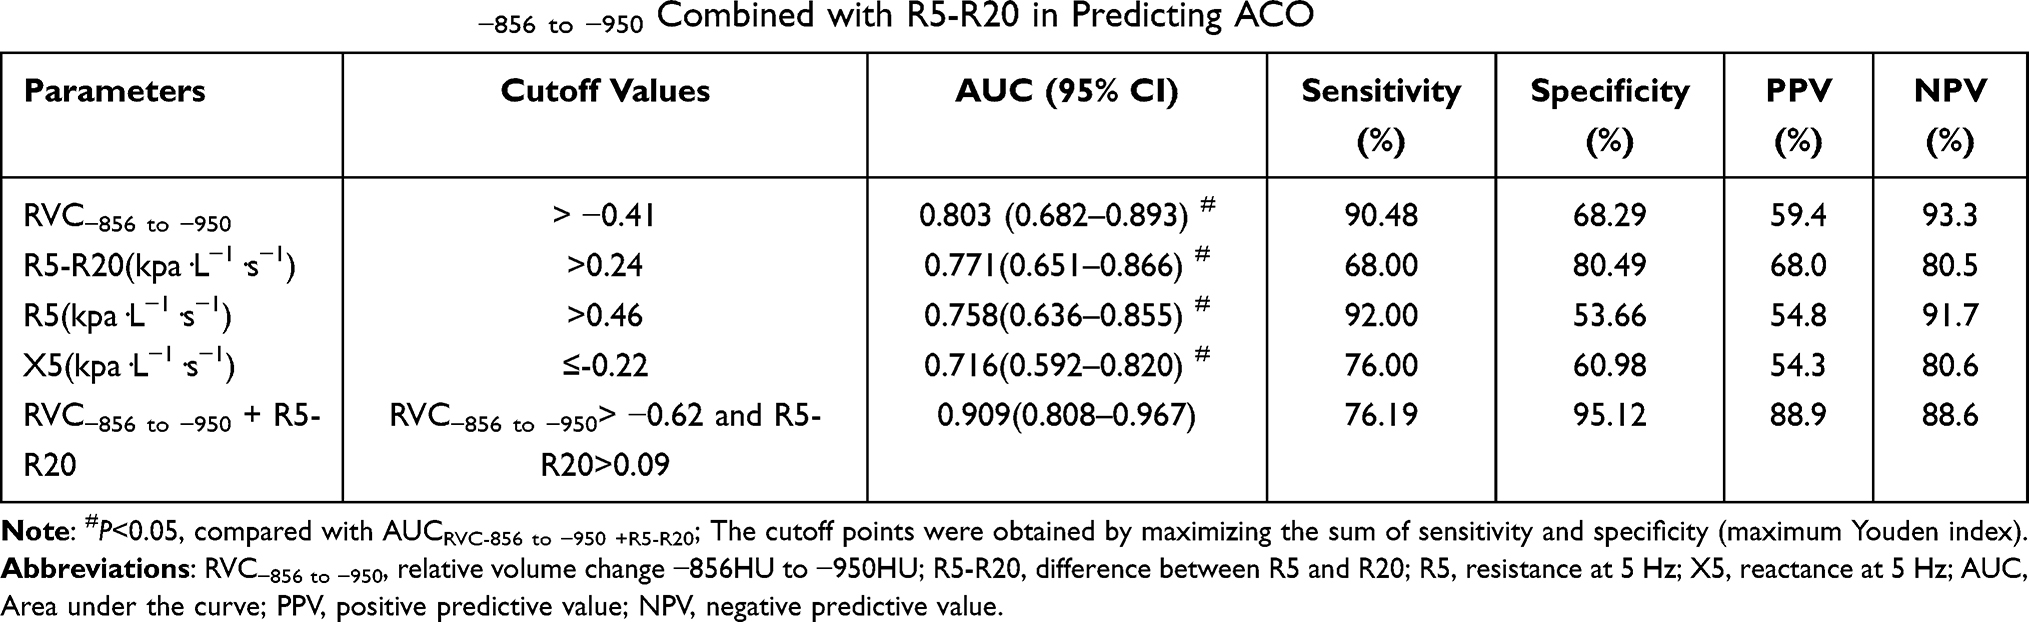 |
Table 5 ROC Curves for RVC−856 to −950 Combined with R5-R20 in Predicting ACO |
 |
Figure 4 ROC curves for RVC−856 to −950 combined with R5-R20 in predicting ACO. Abbreviations: AUC, area under the curve; RVC−856 to −950, relative volume change −856HU to −950HU; R5-R20, difference between R5 and R20. |
Model Validation
The calibration curves of the established model for identifying ACO among COPD patients demonstrated good consistency (Figure 5). The C-index of the model was 0.892 through bootstrapping validation, which revealed good discrimination of the model.
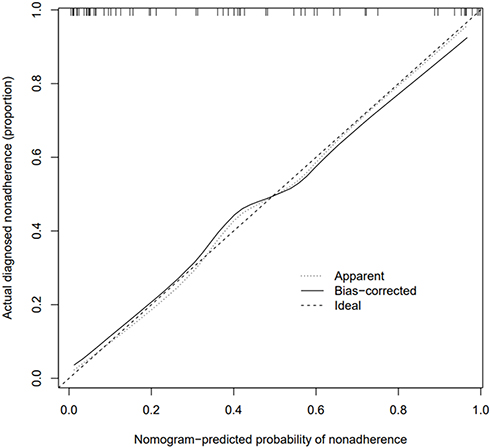 |
Figure 5 Calibration curve of RVC−856 to-950 combined with R5-R20. |
Discussion
To the best of our knowledge, compared with the previous literature, we are the first to explore the value of IOS parameters and quantitative HRCT parameters in differentiating ACO from COPD. Our study shows that RVC−856 to −950 combined with R5-R20 might be promising candidates for the early recognition of ACO among COPD patients.
Our results showed that R5, R5-R20 and the absolute value of X5 in patients with ACO were higher than those in COPD patients and control subjects. Among these IOS parameters, respiratory resistance across frequencies (R5-R20) denotes small airway resistance. A higher respiratory resistance in ACO patients suggests that ACO has greater airway narrowing than COPD, which is supported by our quantitative HRCT analyses of the airways. As proposed by Matsuoka et al,22 RVC−856 to −950 as an HRCT parameter of air trapping can indirectly reflect small-airway impairment in airway disease. In our study, patients with ACO had a significantly higher RVC−856 to −950 than the control and COPD groups, indicating that there was more damage to the small airways in ACO patients than in COPD patients, which then caused more severe air trapping. Moreover, several reports have pointed out that the quantitative HRCT measurements of air trapping had a stronger relationship with the physiological indices for airway disease than the bronchi measurements,25,26 which is similar to the results observed in our study, and this indicates that the evaluation of air trapping can better estimate the degree of airflow obstruction and can reflect the severity of airway disease. Similarly, Hartley et al also demonstrated that air trapping is strongly associated with the impairment of lung function in both COPD and asthma patients.27 As such, the airflow limitation in patients with ACO may be attributed to distinct pathological changes of the small airways, which differ from those patients with COPD alone. Thus, patients with ACO would benefit more from therapy specifically targeting the small airways with extrafine particle inhalers than COPD patients, and this treatment aims to reduce small airway inflammation and alleviate airway narrowing.28 Small airway disease (SAD) is recognized as a pivotal pathology in COPD and asthma patients. Furthermore, studies by McDonough et al showed that narrowing and loss of the small airways may precede the occurrence of emphysema, which can explain the elevated small airway resistance in COPD.29 Thus, a comprehensive description of physiological and HRCT markers of SAD may help to better identify ACO in a COPD cohort, evaluate disease severity and progression, and monitor therapeutic responses between the two diseases.
In our study, we found a strong association of either RVC−856 to −950 ≥-0.41 or R5-R20≥0.24 with an increased in the risk of ACO among COPD patients regardless of adjustment for confounders or not. These data indicated that both RVC−856 to −950 and R5-R20 were effective predictors of ACO, which was independent of the general characteristics (age, sex, BMI, history of smoking, exacerbation and atopy or allergic rhinitis). Currently, the diagnostic value of RVC−856 to −950 for ACO remains unclear. Our study is the first to evaluate the clinical utility of RVC−856 to −950 in the prediction of ACO. At the same time, we attempted to combine RVC−856 to −950 and R5-R20 to obtain a greater accuracy in identifying ACO among patients with COPD. Here, our study demonstrated that the AUC of RVC−856 to −950 used to distinguish ACO was 0.803, with the best cutoff being −0.41, and that the AUC of R5-R20 was 0.771, with an optimal diagnostic cutoff value of 0.24. Here the NPV of ACO for RVC−856 to −950 (93.3%) and R5-R20 (80.5%) was higher than the PPV (RVC−856 to −950: 59.4%; R5-R20: 68.0%), which indicates that lower values of RVC−856 to −950 and lower R5-R20 values are more likely to help clinicians exclude ACO, while patients with higher RVC−856 to −950 and R5-R20 need further examinations to confirm the diagnosis. The combination of RVC−856 to −950 and R5-R20 was superior to a single measurement for identifying ACO from COPD. The AUC was 0.909 (with cutoff points of >-0.62 for RVC−856 to −950 and >0.09 for R5-R20).
Additionally, we also found that individuals with ACO had more frequent severe exacerbations despite similar spirometry results and smoking history compared to patients with COPD alone, which is in accordance with prior studies9,30,31 and provides support for the concept that this is a distinctive clinical condition with a greater morbidity. Additionally, our analysis of quantitative HRCT of the proximal airways showed that the ACO and COPD groups had higher LAA%, WT/BSA, WA/BSA and WA% than the control group. Although the ACO group had a higher median value, no significant difference was seen between the ACO and COPD patients, suggesting that there was no obvious difference in terms of emphysema and proximal airway remodeling between patients with ACO and COPD. In contrast to our study, previous HRCT studies have pointed out the differences in the features of the airways and parenchyma between the ACO and COPD groups. Karayama et al reported that patients with ACO had a greater WT, a smaller LA, and less emphysema than COPD patients.32 Hardin et al showed that patients with ACO had thicker airways in segmental or subsegmental bronchi and less emphysema than patients with COPD alone after adjustment for general information factors in a multivariate regression analysis.31 These discrepancies may be attributed in part to the different methods to measure the quantitative HRCT parameters and the difference in the study populations. Another possible reason may be that, in our study, patients with COPD and ACO had differences in the proportion of women, age and BMI but did not have any differences regarding smoking history, inhaled medications and airflow limitation as measured by spirometry.
There are several limitations in our study that merit mention. First, our study was performed at a single center which resulted in selection bias and thus was not generalizable. The sample size was relatively small so our study was limited to confirming some results in the stratified analysis. Smokers were not divided into current and ex-smoker groups. Hence, future studies should include a greater sample size of patients from multiple centers, and current and ex-smoker groups will be classified for further analysis. Second, there is currently no definitive way to characterize ACO, and therefore different definitions of ACO may demonstrate different results. Third, we only measured 4th- to 6th-generation bronchi of RB1 owing to the resolution limitation of CT; as such, the different morphological and pathological changes in small airways could not be confirmed between the COPD group and the ACO group. Fourth, we were limited in exploring the long-term outcomes of the patients; therefore, further longitudinal follow-up and therapeutic studies are necessary to track disease progression, to demonstrate distinct clinical outcomes and to identify the optimal therapy in this population. Last, it is recognized that ACO comprises two main clinical phenotypes: patients with COPD who have features of asthma; asthmatic patients who develop an irreversible airflow limitation after long-term smoking.8,33 Our cohort included the former only; therefore, some results of our study are not generalizable to the entire ACO population.
Conclusion
In summary, our current study shows that subjects with ACO have a higher respiratory impedance during tidal breathing and more serious air trapping in the HRCT analysis than patients with COPD, which indicates that there exists more serious small airway impairment in patients with ACO than in patients with COPD. Additionally, our results suggest that combined RVC−856 to −950 and R5-R20 values had the highest diagnostic value for differentiating ACO patients among COPD patients. Together, RVC−856 to −950>-0.62 and R5-R20>0.09 can be used in an early diagnosis of ACO and therefore could enable a more accurate and targeted therapeutic protocol to optimize individual patient management and improve clinical outcomes.
Data Sharing Statement
The data used in our study are sourced from the corresponding author on reasonable request.
Ethics and Consent Statements
This study was permitted by the Institutional Ethics Committee of Zhujiang Hospital of Southern Medical University, China (Approval no.2016-HXNK-002). All study participants provided written informed consent before enrolment. Patients’ privacy and personal identity information were well protected, and the study protocol adheres to the recommendations of the Declaration of Helsinki.
Acknowledgments
The study was financially supported by Guangdong Basic and Applied Basic Research Foundation (Grant no. 2020A1515010119).
Disclosure
The authors report no conflicts of interest in this work.
References
1. Woodruff PG, van den Berge M, Boucher RC, et al. American Thoracic Society/National Heart, Lung, and Blood Institute Asthma-Chronic Obstructive Pulmonary Disease Overlap Workshop Report. Am J Resp Crit Care. 2017;196(3):375–381. doi:10.1164/rccm.201705-0973WS
2. Global Initiative for Asthma [webpage on the Internet]. Global strategy for asthma management and prevention. Available from: http://www.ginasthma.org.
3. Global Initiative for Chronic Obstructive Lung Disease (GOLD) 2018 [webpage on the Internet]. The Global Strategy for the Diagnosis, Management and Prevention of COPD. Available from: http://www.goldcopd.org.
4. Agusti A, Fabbri LM, Singh D, et al. Inhaled corticosteroids in COPD: friend or foe? Eur Respir J. 2018;52:6. doi:10.1183/13993003.01219-2018
5. Miravitlles M, Soriano JB, Ancochea J, et al. Characterisation of the overlap COPD-asthma phenotype. Focus on physical activity and health status. Resp Med. 2013;107(7):1053–1060. doi:10.1016/j.rmed.2013.03.007
6. Cosio BG, Soriano JB, López-Campos JL, et al. Defining the asthma-COPD overlap syndrome in a COPD cohort. Chest. 2016;149(1):45–52. doi:10.1378/chest.15-1055
7. Sin DD, Miravitlles M, Mannino DM, et al. What is asthma-COPD overlap syndrome? Towards a consensus definition from a round table discussion. Eur Respir J. 2016;48(3):664–673.
8. Tommola M, Ilmarinen P, Tuomisto LE, et al. Differences between asthma-COPD overlap syndrome and adult-onset asthma. Eur Respir J. 2017;49(5). doi:10.1183/13993003.02383-2016
9. Menezes A, Montes de Oca, M., Pérez-Padilla, R., et al. Increased risk of exacerbation and hospitalization in subjects with an overlap phenotype: COPD-asthma. Chest. 2014;145(2):297–304. doi:10.1378/chest.13-0622
10. Diaz-Guzman E, Khosravi M, Mannino DM. Asthma, chronic obstructive pulmonary disease, and mortality in the U.S. population. COPD. 2011;8(6):400–407. doi:10.3109/15412555.2011.611200
11. Global Initiative for Asthma, Global Initiative for Chronic Obstructive Lung Disease [webpage on the Internet]. Diagnosis and initial treatment of asthma, COPD, and asthma-COPD overlap. Available from: http://ginasthma.org/download/824/.
12. Bickel S, Popler J, Lesnick B, Eid N. Impulse oscillometry: interpretation and practical applications. Chest. 2014;146(3):841–847. doi:10.1378/chest.13-1875
13. Mori K, Shirai T, Mikamo M, et al. Colored 3-dimensional analyses of respiratory resistance and reactance in COPD and asthma. COPD. 2011;8(6):456–463. doi:10.3109/15412555.2011.626818
14. Bhattarai P, Myers S, Chia C, et al. Clinical application of Forced Oscillation Technique (FOT) in early detection of airway changes in smokers. J Clin Med. 2020;9(9). doi:10.3390/jcm9092778
15. Shinke H, Yamamoto M, Hazeki N, et al. Visualized changes in respiratory resistance and reactance along a time axis in smokers: a cross-sectional study. Respir Investig. 2013;51(3):166–174. doi:10.1016/j.resinv.2013.02.006
16. Ling W, Pengbo S, Lihua Z, et al. Diagnostic value of impulse oscillometry system in patients with asthma-chronic obstructive pulmonary disease. Int J Respir. 2020;8:341–348.
17. Singh D, Agusti A, Anzueto A, et al. Global strategy for the diagnosis, management, and prevention of Chronic Obstructive Lung Disease: the GOLD science committee report 2019. Eur Respir J. 2019;53(5). doi:10.1183/13993003.00164-2019
18. Miller MR, Hankinson J, Brusasco V, et al. Standardisation of spirometry. Eur Respir J. 2005;26(2):319–338. doi:10.1183/09031936.05.00034805
19. Oostveen E, MacLeod D, Lorino H, et al. The forced oscillation technique in clinical practice: methodology, recommendations and future developments. Eur Respir J. 2003;22(6):1026–1041. doi:10.1183/09031936.03.00089403
20. Cottini M, Licini A, Lombardi C, et al. Clinical characterization and predictors of IOS-defined small-airway dysfunction in asthma. J Allergy Clin Immunol Pract. 2020;8(3):997–1004.
21. Gevenois PA, de Maertelaer V, De Vuyst P, et al. Comparison of computed density and macroscopic morphometry in pulmonary emphysema. Am J Respir Crit Care Med. 1995;152(2):653–657. doi:10.1164/ajrccm.152.2.7633722
22. Matsuoka S, Kurihara Y, Yagihashi K, et al. Quantitative assessment of air trapping in chronic obstructive pulmonary disease using inspiratory and expiratory volumetric MDCT. AJR Am J Roentgenol. 2008;190(3):762–769. doi:10.2214/AJR.07.2820
23. O’Donnell RA, Peebles C, Ward JA, et al. Relationship between peripheral airway dysfunction, airway obstruction, and neutrophilic inflammation in COPD. Thorax. 2004;59(10):837–842. doi:10.1136/thx.2003.019349
24. Kubo K, Eda S, Yamamoto H, et al. Expiratory and inspiratory chest computed tomography and pulmonary function tests in cigarette smokers. Eur Respir J. 1999;13(2):252–256. doi:10.1034/j.1399-3003.1999.13b06.x
25. Nambu A, Zach J, Schroeder J, et al. Quantitative computed tomography measurements to evaluate airway disease in chronic obstructive pulmonary disease: relationship to physiological measurements, clinical index and visual assessment of airway disease. Eur J Radiol. 2016;85(11):2144–2151. doi:10.1016/j.ejrad.2016.09.010
26. Schroeder JD, McKenzie AS, Zach JA, et al. Relationships between airflow obstruction and quantitative CT measurements of emphysema, air trapping, and airways in subjects with and without chronic obstructive pulmonary disease. AJR Am J Roentgenol. 2013;201(3): W460–W470. doi:10.2214/AJR.12.10102
27. Hartley RA, Barker BL, Newby C, et al. Relationship between lung function and quantitative computed tomographic parameters of airway remodeling, air trapping, and emphysema in patients with asthma and chronic obstructive pulmonary disease: a single-center study. J Allergy Clin Immunol. 2016;137(5):1413–1422. doi:10.1016/j.jaci.2016.02.001
28. Scichilone N, Benfante A, Morandi L, et al. Impact of extrafine formulations of inhaled corticosteroids/long-acting beta-2 agonist combinations on patient-related outcomes in asthma and COPD. Patient Relat Outcome Meas. 2014;5:153–162.
29. McDonough JE, Yuan R, Suzuki M, et al. Small-airway obstruction and emphysema in chronic obstructive pulmonary disease. N Engl J Med. 2011;365(17):1567–1575. doi:10.1056/NEJMoa1106955
30. Barrecheguren M, Pinto L, Mostafavi-Pour-Manshadi SM, et al. Identification and definition of asthma-COPD overlap: the CanCOLD study. Respirology. 2020;25(8):836–849. doi:10.1111/resp.13780
31. Hardin M, Cho M, McDonald ML, et al. The clinical and genetic features of COPD-asthma overlap syndrome. Eur Respir J. 2014;44(2):341–350. doi:10.1183/09031936.00216013
32. Karayama M, Inui N, Yasui H, et al. Physiological and morphological differences of airways between COPD and asthma-COPD overlap. Sci Rep. 2019;9(1):7818. doi:10.1038/s41598-019-44345-6
33. Joo H, Han D, Lee JH, et al. Heterogeneity of asthma-COPD overlap syndrome. Int J Chron Obstruct Pulmon Dis. 2017;12:697–703. doi:10.2147/COPD.S130943
 © 2021 The Author(s). This work is published and licensed by Dove Medical Press Limited. The
full terms of this license are available at https://www.dovepress.com/terms
and incorporate the Creative Commons Attribution
- Non Commercial (unported, 3.0) License.
By accessing the work you hereby accept the Terms. Non-commercial uses of the work are permitted
without any further permission from Dove Medical Press Limited, provided the work is properly
attributed. For permission for commercial use of this work, please see paragraphs 4.2 and 5 of our Terms.
© 2021 The Author(s). This work is published and licensed by Dove Medical Press Limited. The
full terms of this license are available at https://www.dovepress.com/terms
and incorporate the Creative Commons Attribution
- Non Commercial (unported, 3.0) License.
By accessing the work you hereby accept the Terms. Non-commercial uses of the work are permitted
without any further permission from Dove Medical Press Limited, provided the work is properly
attributed. For permission for commercial use of this work, please see paragraphs 4.2 and 5 of our Terms.