")
Back to Journals » Clinical Interventions in Aging » Volume 17
The Validity of Ultrasonographic Measurements of the Rectus Femoris Muscle in Older Adults with Sarcopenia in Thai Population
Authors Sri-on J, Rueanthip S, Vanichkulbodee A , Paksopis T , Chetanasilpin C
Received 19 May 2022
Accepted for publication 5 August 2022
Published 18 August 2022 Volume 2022:17 Pages 1249—1259
DOI https://doi.org/10.2147/CIA.S375419
Checked for plagiarism Yes
Review by Single anonymous peer review
Peer reviewer comments 3
Editor who approved publication: Dr Maddalena Illario
Jiraporn Sri-on,1 Sommapan Rueanthip,2 Alissara Vanichkulbodee,3 Thitiwan Paksopis,1 Chatbhaudin Chetanasilpin2
1Geriatric Emergency Medicine Unit, The Department of Emergency Medicine, Vajira Hospital, Navamindradhiraj University, Bangkok, Thailand; 2The Department of Emergency Medicine, Vajira Hospital, Navamindradhiraj University, Bangkok, Thailand; 3Ultrasound Emergency Unit, The Department of Emergency Medicine, Vajira Hospital, Navamindradhiraj University, Bangkok, Thailand
Correspondence: Jiraporn Sri-on, Geriatric Emergency Medicine Unit, The Department of Emergency Medicine, Vajira Hospital, Navamindradhiraj University, 681 Samsen road, Dusit, Bangkok, 10300, Thailand, Tel +66 896840010, Email [email protected]
Purpose: This study aimed to determine the validity of ultrasonographic measurement of the rectus femoris muscle (RFM) thickness as a screening tool for low appendicular muscle mass (ASM) to diagnose sarcopenia and to determine the cut-off point of RFM thickness in the Thai population.
Patients and methods: We enrolled 857 community-dwelling adults aged 60 years and older who were diagnosed with sarcopenia using the Asian Working Group for Sarcopenia-2019 algorithm. The RFM thickness was measured using ultrasonography and compared with bioelectrical impedance analysis (BIA) data. The sensitivity, specificity, positive predictive value (PPV), and negative predictive value (NPV) were evaluated, and the area under the receiver operating curve (AUROC) was used to determine the accuracy of the test.
Results: A total of 857 participants were included in the study. Overall, when the cut-off values of RFM thickness of ≤ 1.1 cm were used for male and ≤ 1 cm for female, the highest sensitivity for sarcopenia diagnosis was 90.9% and specificity was 92.2%. The PPV was 76.6, and the NPV was the highest at 97.3. The highest sensitivity for the diagnosis of severe sarcopenia was 92.5% and specificity was 97.4%. The AUROC of the cut-off point of RFM thickness for the diagnosis of sarcopenia was 0.92 (95% confidence interval [CI], 0.89− 0.94); for severe sarcopenia, it was 0.95 (95% CI, 0.92− 0.98).
Conclusion: Measuring RFM thickness using ultrasonography is a feasible and reliable screening test for sarcopenia, and the cut-off values of ≤ 1.1 cm for male and ≤ 1 cm for female showed the highest accuracy for confirming low ASM in the Thai population.
Keywords: sarcopenia, rectus femoris muscle, ultrasonography, bioelectrical impedance
Introduction
In 2010, the European Working Group on Sarcopenia in Older People (EWGSOP) defined sarcopenia as an age-related progressive and generalized loss of skeletal muscle mass and muscle function (muscle strength and/or physical performance).1–3 Sarcopenia affects all aspects of life, such as physical disability, poor quality of life, and can increased mortality rate.1 A meta-analysis revealed the pool prevalence of sarcopenia varied from 9.9% to 40.4%.4 Among the Asian population, the Asian Working Group for Sarcopenia (AWGS) updated an algorithm for the diagnosis of sarcopenia in 2019,2 which was similar to that proposed by EWGSOP.5
There were differences in the techniques used to evaluate changes in muscle mass and function. Based on muscle mass measurements, EWGSOP and AWGS recommend magnetic resonance imaging (MRI),6,7 computed tomography (CT),8,9 dual-energy X-ray absorptiometry (DXA),10 and bioelectrical impedance analysis (BIA).11,12 These are considered the gold standards for muscle mass measurements. However, the use of these techniques is limited by availability, cost, and facility.13 Limitations of MRI include the cost, time restraints, and limited ability to use for frail older adults with cognitive impairment. The limitations of CT are that are cost, exposure to radiation, and it is time-consuming. DXA is also expensive, exposes patients to a small dose of radiation, and has limited accessibility. The limitations of BIA are dependence on the hydration status and it cannot be used if patients have electrical device implants.11,12,14 However, ultrasonography15 has been identified as a quick and inexpensive medical tool for muscle mass measurement and does not expose the patients to radiation. Additionally, ultrasound can be used even in medically ill patients and acute care settings. Several studies have demonstrated that ultrasonography can measure muscle mass loss, qualitative changes, and diseases, such as chronic obstructive pulmonary disease,16,17 chronic kidney disease,18 and post-stroke.19 Ultrasonography is more reliable and valid when performed on large muscles.20,21 The studies reveal that ultrasonographic measurements of the quadriceps muscles (the rectus femoris (RF), vastus intermedius, vastus lateralis, and vastus medialis) were highly reproducible in both the sarcopenia and non-sarcopenia groups. The intra-class correlation is between 0.90−0.99.20,21 In addition, another study demonstrated that rectus femoris muscle thickness (RFM) correlated with lean body mass compared with DXA.22 Rustani et al study showed the measurement of RF thickness as a screening tool for sarcopenia and a cut-off point of <0.9 cm for male and <0.7 cm for female.23 The rectus femoris muscle originates from the ilium and moves straight down the leg and attaches to the patellar by the quadriceps femoris tendon. It is easy to use ultrasound measurement in a supine position on the anterior aspect of the thigh.20–22 A study showed good correlation for naïve and experienced ultrasound operators and excellent correlation for experienced operators.16
To date, there has been no validation study on the use of ultrasonography to measure the muscle thickness of the RF to evaluate sarcopenia in the Thai population. Our study aimed to determine the validity of ultrasonographic measurement of RFM21,22 thickness as a screening test for sarcopenia and to fine-tune the cut-off point of RFM thickness in the people in the Thai population. This is an emerging line of research and obtaining cut-off points constitutes an advance for its use in the Thai population and for future comparison with other populations.
Materials and Methods
Study Design
The study was part of a an existing population-based cohort study, the “Bangkok Falls study”, which was conducted from 2019–2021 to identify the factors that contribute to falls among community-dwelling older adults.24 Inclusion criteria were older adults aged 60 years and older who lived in one of five sub-districts in the Dusit District of Bangkok, Thailand, who were able to walk at least 6 m, and were expected to live in the community for at least two years. Exclusion criteria were older adults who had severe cognitive impairment (defined using the six-item cognitive screening test25 with a score of >12 points), taking medications that could affect body composition (eg, steroids and diuretics), inability to lie down, use of electronic devices or metal implants, those who were unable to speak Thai, and were visually and hearing impaired. The study protocol was approved by the Ethics Committee of Vajira Hospital, Navamindradhiraj University, and was conducted in compliance with the principle stated in the Declaration of Helsinki. All participants provided informed consent before inclusion in the study.
Data Collection at the Hospital
Baseline characteristics, such as age, gender, education level, and a history of falls in the previous year, were collected. Body mass index (BMI) (calculated as follows: weight(kg)/height(m)2), activity of daily living, results of the six-items cognitive screening test, Charlson’s comorbidity score (CCI), frailty phenotype, results for the Berg balance test, time up and go, calf circumference measurement, muscle strength testing using handgrip strength, five-time sit to stand test, and the appendicular skeletal muscle mass (ASM) using the BIA (male [M], <7.0 kg/m2; female [F], <5.7 kg/m2) were documented.
Physical examinations, including calf circumference measurement, muscle strength, five-time sit-to-stand test, and BIA, were performed by trained research assistants (RAs) (experienced nurses and three RAs with a bachelor’s degree in health science) after training with a principal investigator and physiotherapist who had experience in caring for older adults for at least 5 years. Two emergency physicians performed ultrasonographic measurement after testing for intra-rater reliability (intra-class correlation coefficient; ICC).
Sarcopenia Definition and Diagnosis
Sarcopenia was defined according to the definition proposed by AWGS-2019,2 which defines it as having a low ASM with either low muscle strength or low physical performance. Severe sarcopenia was defined as having a low ASM with both low muscle strength and low physical performance.
The Process of Sarcopenia Measurements
Screening for cases (possible sarcopenia).
The participants were screened by measuring the calf circumference (male <34 cm and female <33 cm).2
Muscle Strength Measurement
Muscle strength was evaluated using the handgrip strength test. Handgrip strength was measured by trained RAs using the grip dynamometer model TK-1201 (TAKEI KIKI KOGYO, Japan). The RAs asked participants to use their dominant hand to lift the handgrip dynamometer and squeeze it for 10–15 s. The measurements were performed twice, the maximum weight measured from hand grip strength was used (abnormalities were identified as M <28 kg; F <18 kg).
Physical Performance Measurement
Physical performance was evaluated using the five-time sit-to-stand test, which measures the time taken to stand five times from a sitting position without using the arms of a straight-backed armchair.
Measurement of Appendicular Skeletal Muscle Mass
The ASM was measured using the BIA (M, <7.0 kg/m2; F, <5.7 kg/m2) that was performed using the Inbody Dial device (Korea) with a multi-frequency, tetra-polar electrode.
Ultrasonographic Measurement of the Rectus Femoris Muscle (RFM) Thickness
The ultrasonography was performed using a B-mode linear transducer (5.0−7.5 MHz).16 The RFM thickness was assessed on the participant’s right thigh. Patients were laid down in a supine position with their knees relaxed, extended, their toes pointed towards the ceiling, and they rested for 1 min before the measurement. The point of assessment was between the anterior superior iliac spine and the upper lateral epicondyle of the femur.26 The point was marked on the skin to ensure proper transducer placement when repeating the scan. The transducer was placed perpendicular to the transverse axis of the thigh, with minimal pressure to reduce excessive muscle compression. The RFM thickness was defined as the distance between the superficial fascia and deep fasciae of the muscle. The RFM thickness was measured twice, and the average value was reported. The thickness of the RFM was reported in centimeters.
The baseline cut-off points of the thickness of the RFM for male <0.9 cm and <0.7 cm for female followed the study by Rustani et al.23
Statistical Analysis
Demographic and clinical information was described for each participants. Continuous variables are expressed as median (interquartile range [IQR]) and as percentages for categorical variables. Differences in continuous and categorical variables between men and women were assessed using the Wilcoxon rank-sum test, chi-square test or Fisher’s exact test, respectively. The accuracy of ultrasonography RFM thickness measurements in predicting sarcopenia was evaluated using the area under the receiver operating curve (AUROC) analysis. Clinical usefulness at cut-off values was also assessed by sensitivity, specificity, negative predictive value (NPV), and positive predictive value (PPV). Intra-class correlation coefficients were calculated. The intraclass correlation coefficient value for the RFM thickness was 0.95. The Kappa statistic and percentage of agreement were performed to test for the intra-observer reliability between the ultrasound and BIA.
The optimal cut-off was evaluated using the Liu method, which maximizes the product of sensitivity and specificity, and the Youden method, which maximizes their sum. Statistical significance was set at P < 0.05. Stata version 15.1 (Stata Corp., College Station, Texas) was used for the analysis.
Results
A total of 1001 participants were included in the cohort and 902 participants completed the one-month follow-up at the hospital. We excluded 45 participants from the study; eight participants used diuretics and two used steroids, 10 could not lay down due to underlying medical conditions; and 25 participants did not want to wait for the ultrasound examination.
We included 857 participants who underwent the ultrasonography and physical examinations. The median patient age was 70 years (IQR, 66−75 years). Two-thirds of the participants were female; a total of 588 (68.61%) participants. The median BMI was 24.5 (IQR, 22−27.7) kg/m2 (Table 1).
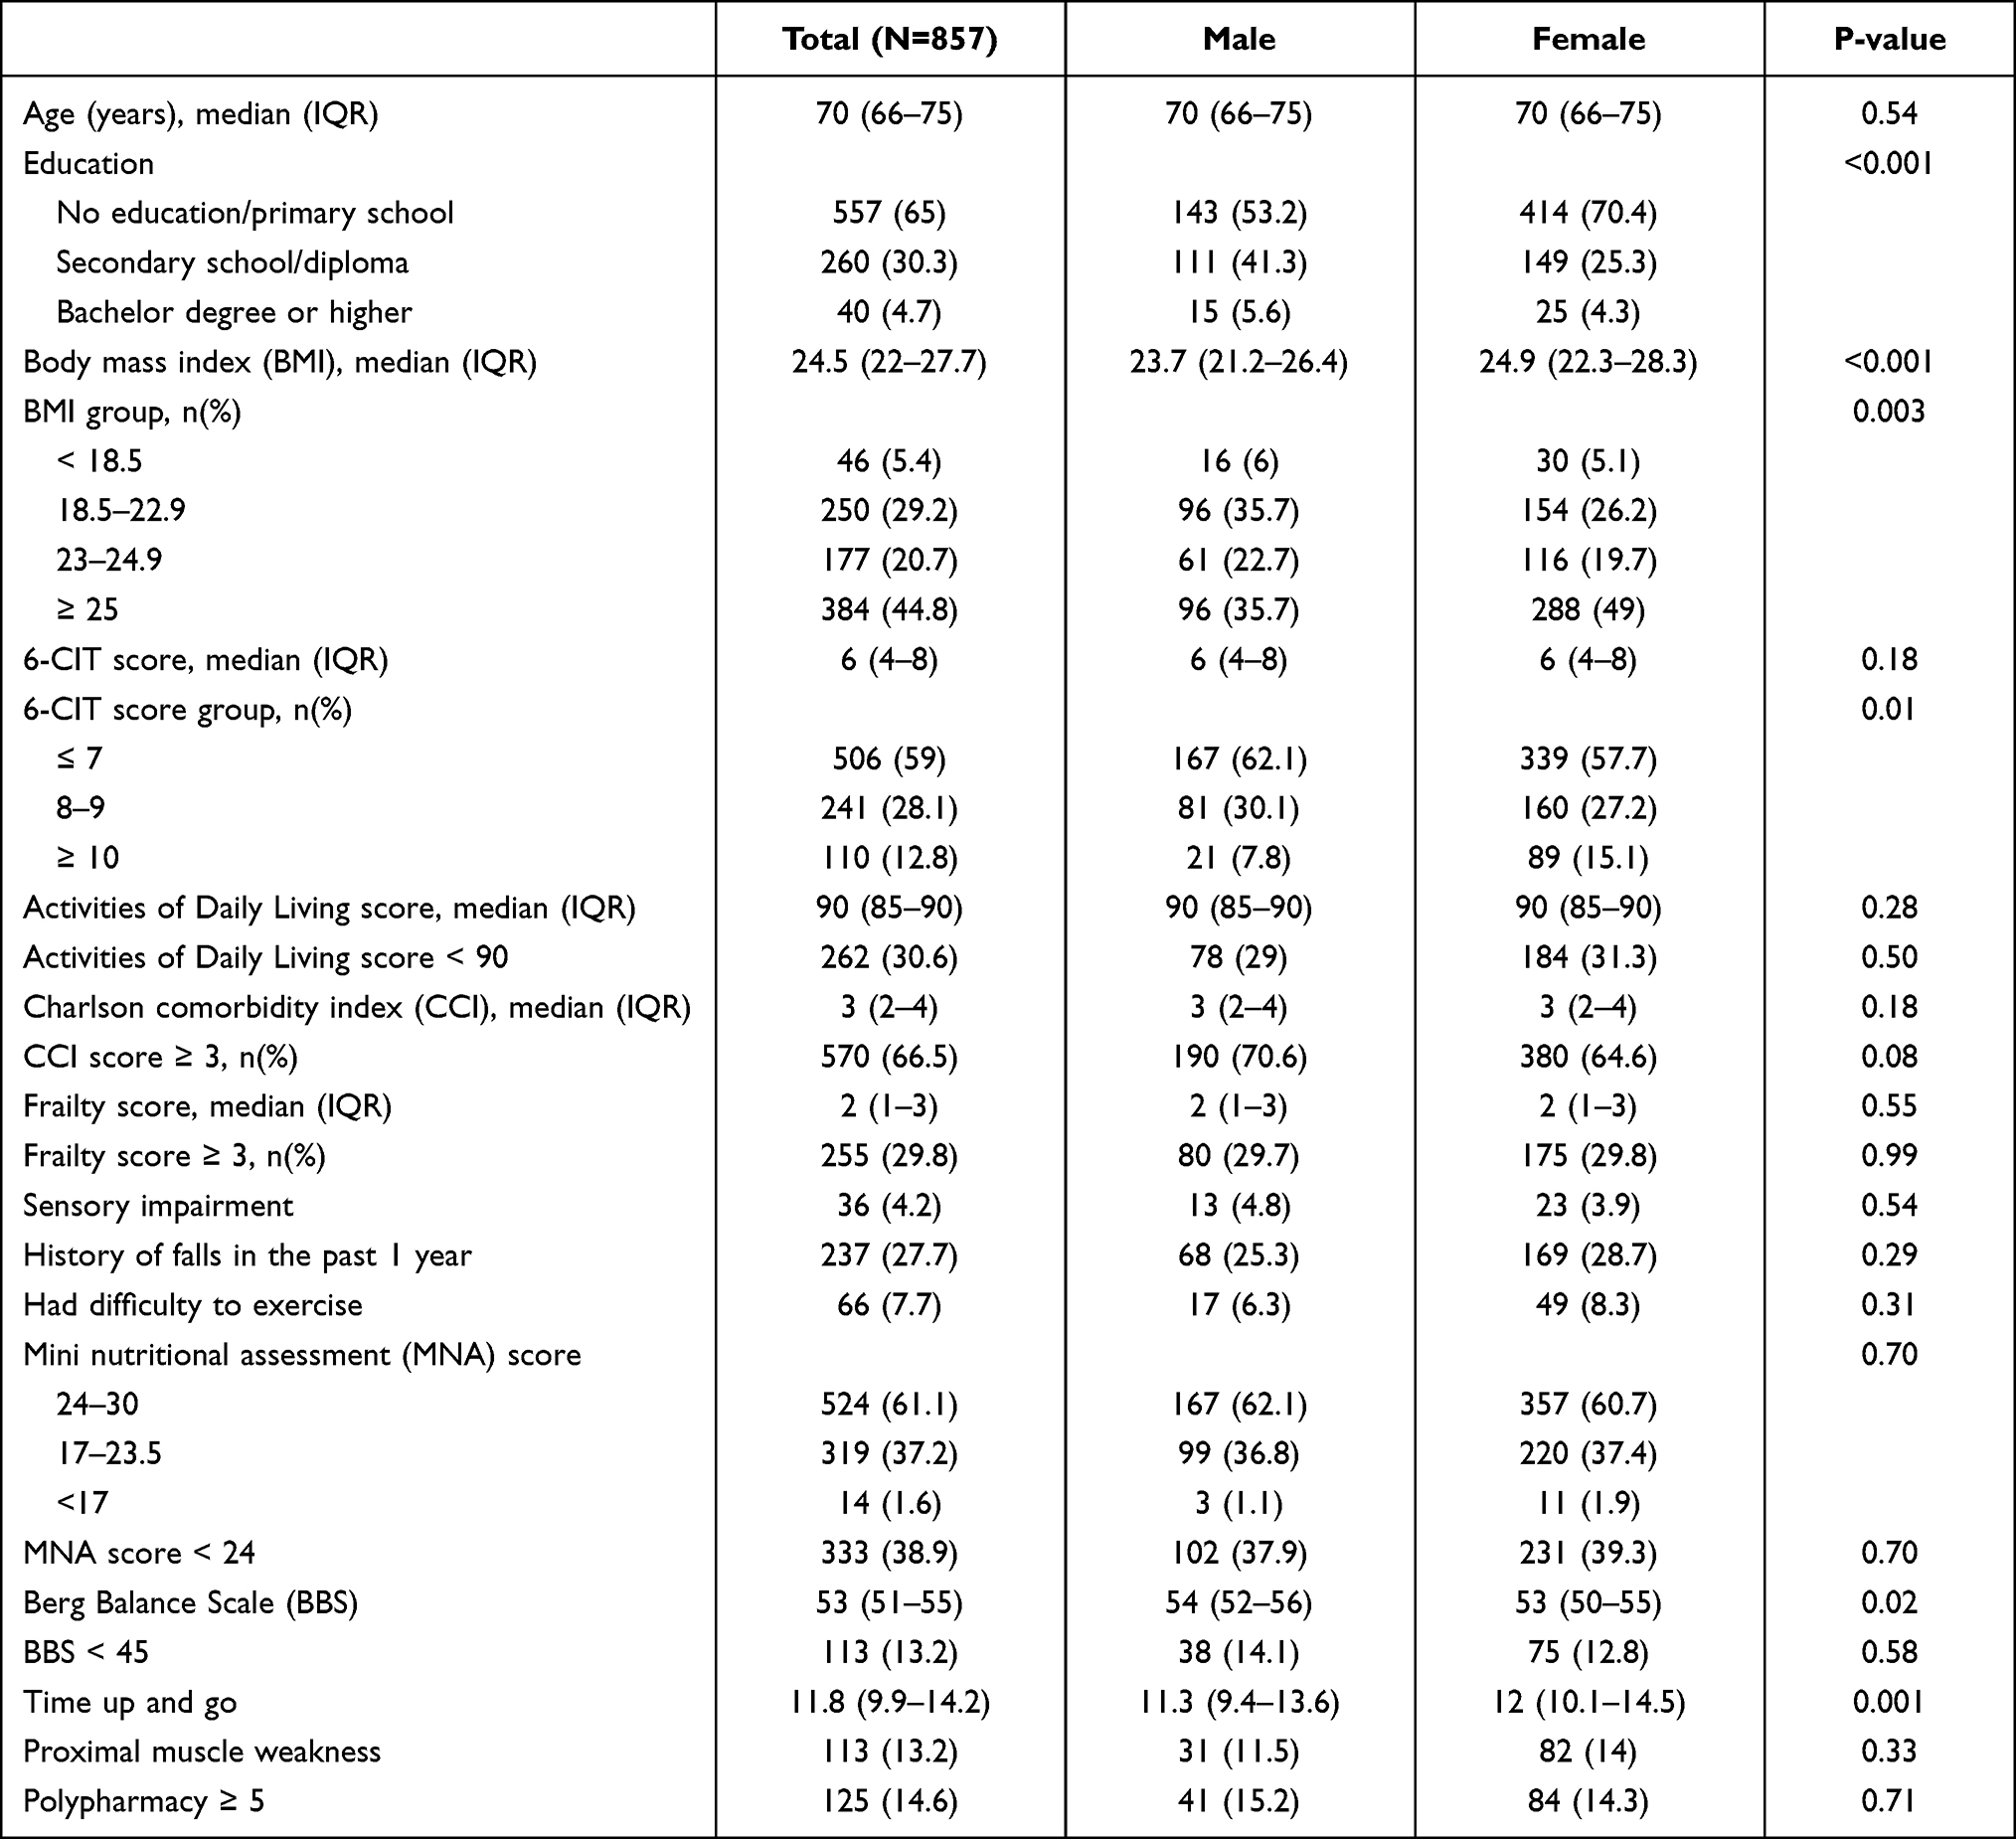 |
Table 1 Characteristics of Participants |
Figure 1. After screening for sarcopenia using the calf circumference measurements, results showed that 318 (37.1%) participants had a calf circumference of <34 cm in male and <33 cm in female. Based on the BIA, handgrip strength, and physical performance evaluations, 198 (22.2%; 95% confidence interval [CI], 25.2−31.2) participants had sarcopenia and 84 (9.4%; 95% CI, 7.5−11.5) participants had severe sarcopenia. Based on the RFM thickness determined using ultrasonography with a cut-off point of <0.9 cm for male and <0.7 cm for female, handgrip strength, and physical performance evaluations, 116 (13.5%; 95% CI, 11.3−16.0) participants had sarcopenia and 50 (5.8%; 95% CI, 4.4−7.6) had severe sarcopenia.
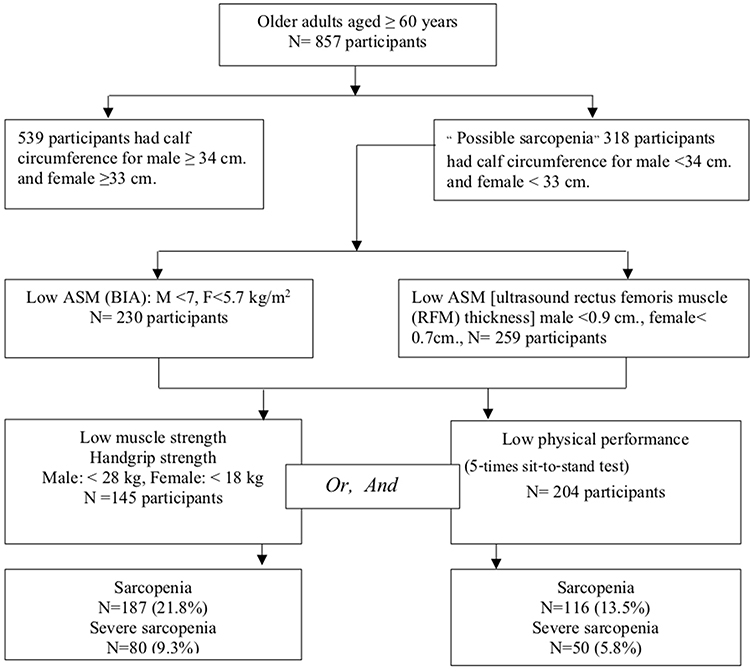 |
Figure 1 Enrollments of subjects and diagnosis for sarcopenia with low appendicular muscle mass (ASM) based on bioelectrical impedance analysis (BIA) and low rectus femoris muscle thickness based on ultrasound. |
We performed an analysis of the RFM thickness stratified by gender. In female, using the cut-off point of <0.7 cm showed the lowest sensitivity of 42.6% (95% CI, 33.7−51.9) for sarcopenia diagnosis. The specificity was highest among the cut-off points of <0.8, ≤ 0.9, and ≤ 1.0 cm at 95.5 (95% CI, 93.2−97.2). The PPV was 71.2 (95% CI, 59.4−81.2), and the NPV was 86.4 (95% CI, 83.1−89.2). Severe sarcopenia showed a diagnosis performance similar to that seen in sarcopenia; it had the lowest sensitivity of 34.7 (95% CI, 21.7−49.6) and good specificity of 89.6 (95% CI, 86.7−92.1). The PPV was 23.3 (95% CI, 14.2−34.6), and the NPV was 86.4 (95% CI, 83.1−89.2). For sarcopenia diagnosis, we found that using the cut-off point of RFM thickness ≤1.0 cm showed the highest sensitivity of 93.4% (95% CI, 87.5−97.1) and good specificity of 91.6% (95% CI, 88.7−94). The PPV was 74.5 (95% CI, 66.8−81.2), and the NPV was highest at 98.2% (95% CI, 96.4−99.2); for severe sarcopenia, it had the highest sensitivity of 93.9% (95% CI, 83.1−98.7), and the highest specificity of 97.4% (95% CI, 95.7−98.6) (Table 2). Additionally, the AUROC for sarcopenia diagnosis was the highest at 0.93 (95% CI, 0.9−0.95), with a cut-off point of RFM thickness of <0.8 cm and of ≤1.0 cm. For severe sarcopenia, the AUROC was the highest at 0.96 (95% CI, 0.92−0.99), with a cut-off point of RFM thickness of ≤1.0 cm (Figure 2).
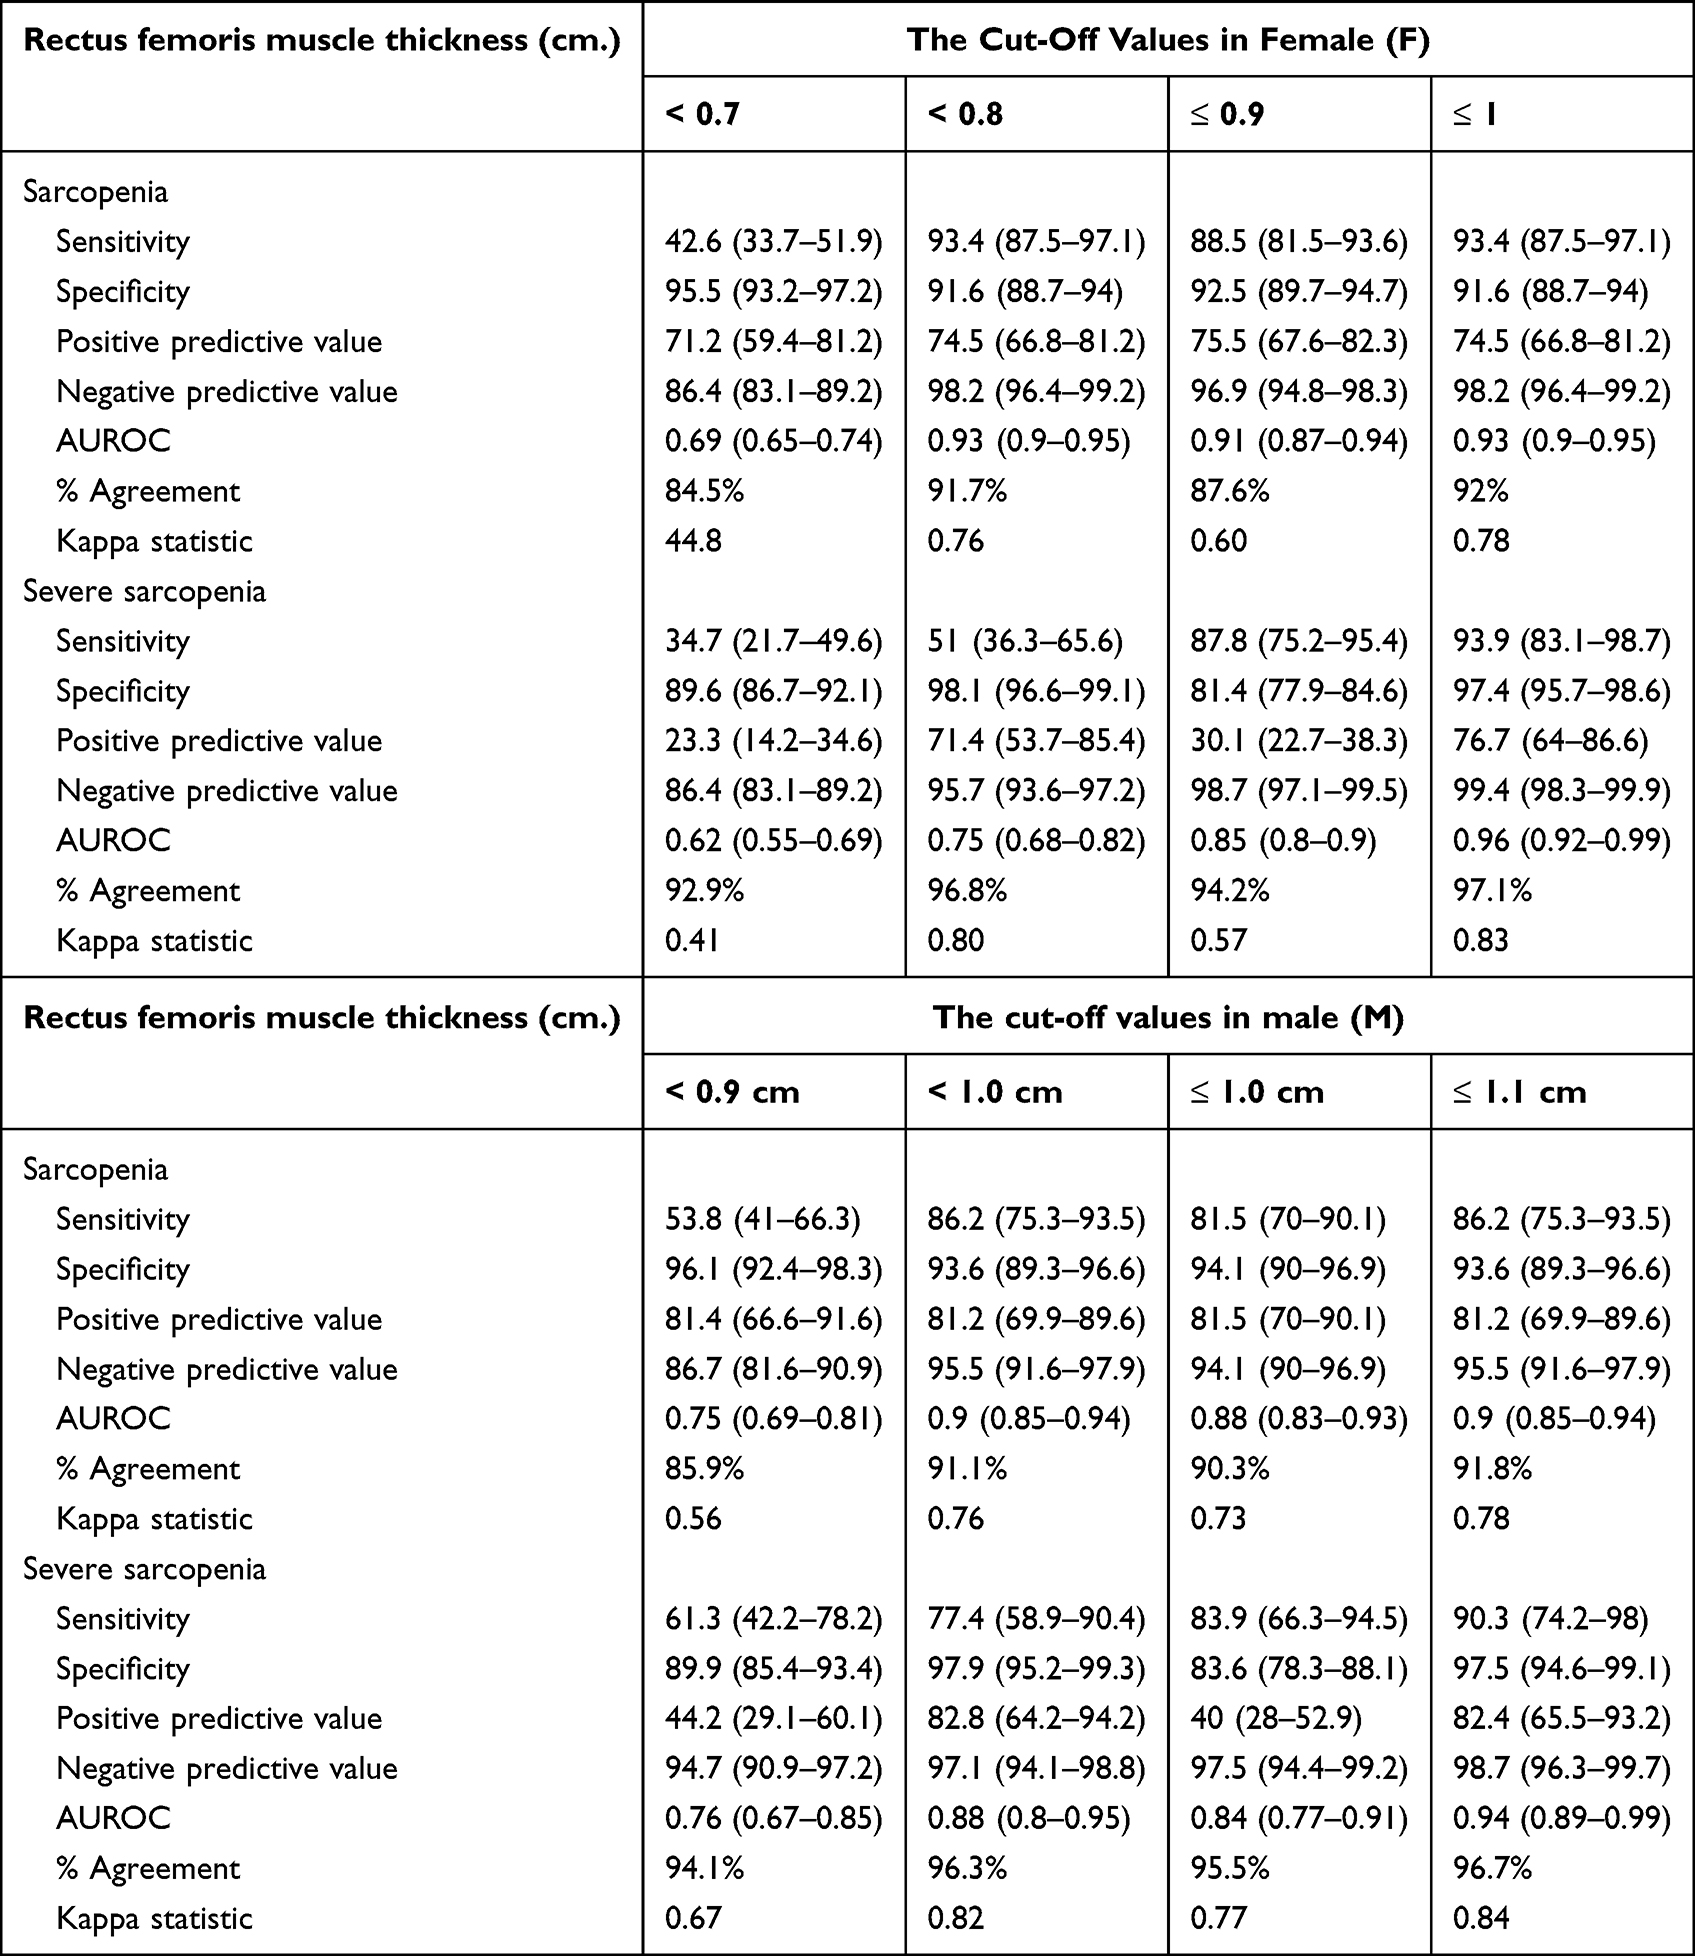 |
Table 2 The Performance of Ultrasound to Detect Low Appendicular Muscle Mass (ASM) in Sarcopenia and Severe Sarcopenia Group (Compared with Bioelectrical Impedance Analysis (BIA) as a Gold Standard for Detection of Low ASM) Separated by Gender |
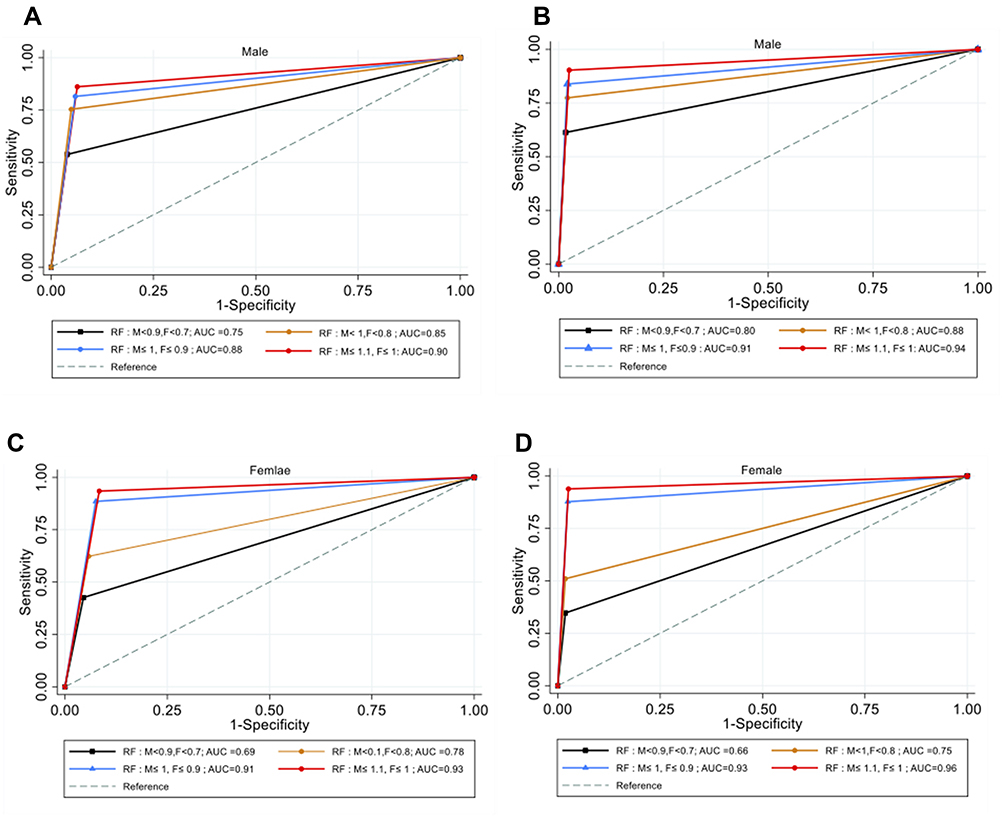 |
Figure 2 The area under the curve (AUROC) of sarcopenia (A) and severe sarcopenia (B) for male and the AUROC of sarcopenia (C) and severe sarcopenia (D) for female. |
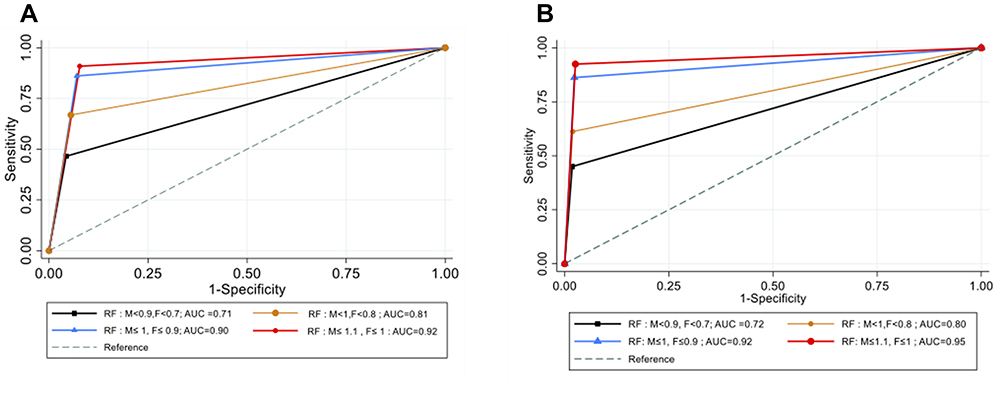 |
Figure 3 The area under the curve (AUROC) of sarcopenia (A) and severe sarcopenia (B). |
In male, using the cut-off point at <0.9 cm, the lowest sensitivity of sarcopenia was 53.8% (95% CI, 41–66.3). The specificity of 96.1 (95% CI, 92.4−98.3) was the highest among the cut-off points of <1.0, ≤1.0, and ≤1.1 cm. The PPV was 81.4 (95% CI, 66.6−91.6), and the NPV was 86.7 (95% CI, 81.6−90.9). Severe sarcopenia showed similar diagnostic performance as sarcopenia; the lowest sensitivity was 61.3% (95% CI, 42.2−78.2) and the specificity of 89.9% (95% CI, 85.4−93.4). The PPV was 44.2 (95% CI, 29.1−60.1), and the NPV was 94.7 (95% CI, 90.9−97.2). For sarcopenia diagnosis, the study showed highest sensitivity of 86.2% (95% CI, 75.3−93.5) and good specificity of 93.6% (95% CI, 89.3−96.6), with a cut-off point of RFM thickness of ≤1.1 cm. The PPV was 81.2 (95% CI, 69.9−89.6), and the NPV was highest at 95.5 (95% CI, 91.6−97.9). For severe sarcopenia diagnosis, the highest sensitivity was 90.3 (95% CI, 74.2−98) and the high specificity of 97.5% (95% CI, 94.6−99.1) (Table 2) were observed. Additionally, for sarcopenia diagnosis, the AUROC was the highest at 0.90 (95% CI, 0.85−0.94) when the cut-off point of RFM thickness was ≤1.1 cm. For severe sarcopenia diagnosis, the AUROC was the highest at 0.94 (95% CI, 0.89−0.99) when the cut-off point of RFM thickness was ≤1.1 cm (Figure 2).
Overall, when we used the cut-off point of RFM thickness of ≤1.1 cm for male and ≤1 cm for female, the sensitivity for sarcopenia diagnosis was highest at 90.9% (95% CI, 85.8−94.6), and the specificity was 92.2% (95% CI, 89.9−94.1). The PPV was 76.6 (95% CI, 70.4−82.0), and the NPV was highest at 97.3 (95% CI, 95.7−98.4). The sensitivity for severe sarcopenia diagnosis was the highest at 92.5% (95% CI, 84.4−97.2) and the specificity was 97.4% (95% CI, 96.1−98.4) (Table 3). The AUROC of the cut-off point of RFM thickness for male was determined to be ≤1.1 cm, and for female, it was determined to be ≤1 cm. For the diagnosis of sarcopenia, it was 0.92 (95% CI, 0.89−0.94), and for the diagnosis of severe sarcopenia, it was 0.95 (95% CI, 0.92−0.98) (Suppl 1 Figure 3). In addition, the prevalence of sarcopenia and severe sarcopenia was determined to be 25.9% (95% CI, 23.0−28.9) and 11% (95% CI, 8.9−13.3), respectively, with the new cut-off point (male at ≤1.1 cm and female at ≤1 cm) (Table 4).
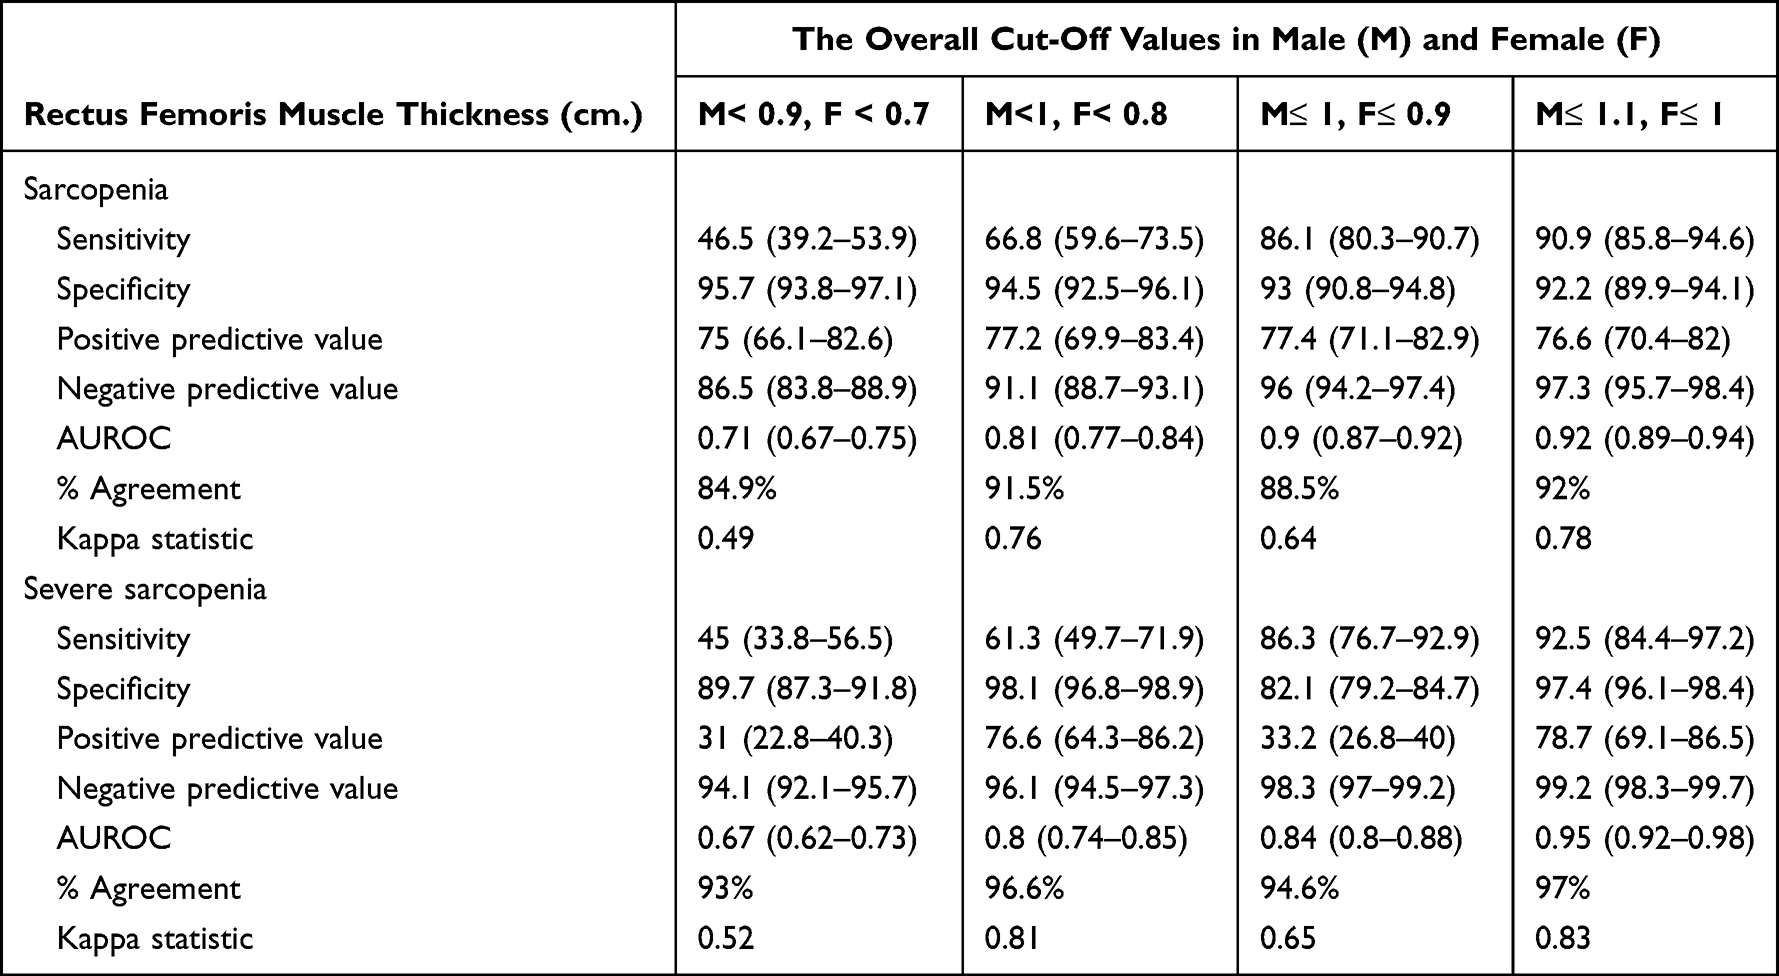 |
Table 3 The Performance of Ultrasound to Detect Low Appendicular Muscle Mass (ASM) in Sarcopenia and Severe Sarcopenia Group (Compared with Bioelectrical Impedance Analysis (BIA) as a Gold Standard for Detection of Low ASM |
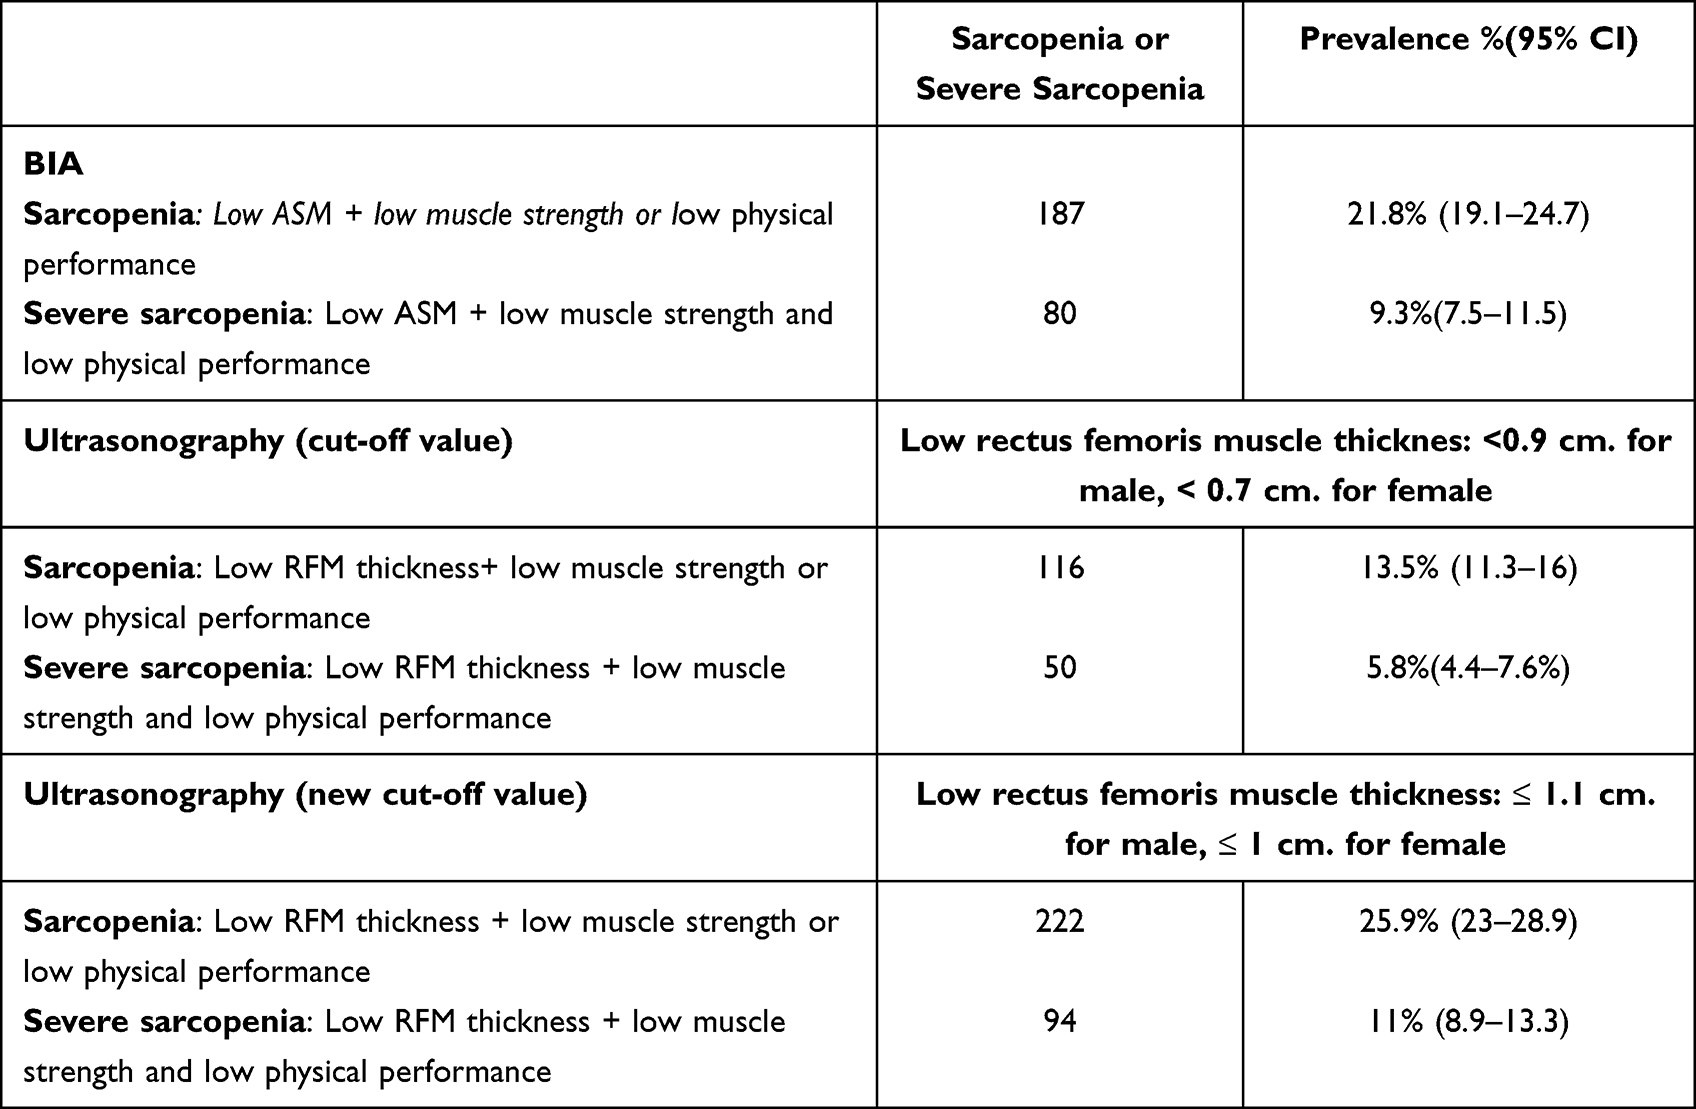 |
Table 4 The Prevalence of Sarcopenia and Severe Sarcopenia Based on bioelectrical impedance analysis (BIA) and Ultrasound Cut-off Values |
Discussion
The present study is the first large population-based study to estimate the use of RFM thickness for sarcopenia screening in a Thai population. The main finding of this study was that RFM thickness evaluated using ultrasonography was a reliable and valid tool for sarcopenia screening in older adults.
We implemented recommended cut-off values or the most appropriate cut-off point according to the Youden index, and followed the methods of RFM thickness measurement by Chang KV.26 The study showed cut-off values of ≤1 cm in female and ≤1.1 cm in male and had the highest sensitivities for both sarcopenia (90.9% [95% CI, 85.8−94.6]) and severe sarcopenia (92.5% [95% CI, 84.4−97.2]). It also showed good specificity. Additionally, the AUROC was the highest among other cut-off values for both sarcopenia (0.92 [95% CI, 0.89−0.94]) and severe sarcopenia (0.95 [95% CI, 0.92−0.98]). The cut-off values were larger than those seen in the study by Rustani et al in Italy.23 With cut-off values of 0.7 cm. for female and 0.9 cm. for male, with 100% sensitivity and 64% specificity. The AUROC for all patients was 0.8966. The explanation for the differences in muscle thickness cut-off values from the study by Rustani et al can be attributed to the use of different methods for the measurement of RFM thickness. The study measured the RFM thickness between the lateral epicondyle and greater trochanter of the femur in a supine position, with the transducer placed on the long axis. In addition, the study showed that total sarcopenia results obtained with BIA had a higher rate of sarcopenia than those obtained using ultrasound measurement of RFM thickness with a cut-off point of < 0.9 cm. for male and <0.7 cm. for female (BIA prevalence 31.1% and ultrasound prevalence 19.3%). The main reasons is that the low cut-off value improve the specificity to detect sarcopenia whereas the sensitivity decline. When using the new cut-off value the prevalence increased to 36.9%.
Our results had lower cut-off values than those reported by Fukumoto et al in Japan. While the present study had more sensitivity and AUROC,21 the study by Fukumoto et al found that in male with low skeletal muscle index, the RFM thickness cut-off value was determined to be 1.51 cm, the sensitivity was 69.2%, specificity was 83.7%, and AUROC was 0.775. For female, the RFM thickness cut-off value was determined to be 1.43 cm, sensitivity was 60%, specificity was 67%, and AUROC was 0.654. This study measured the muscle thickness between the lateral epicondyle and greater trochanter of the femur in a sitting position with the hip flexed at 90°. Isometric contraction of RFM depends on the angulation of the knee and hip joints during knee extension. One study showed that hip flexion close to 90°provided greater torque and electromyography activity of maximal voluntary isometric contraction.27–29
Although EWGSOP and AWGS-2019 provided valid and effective tool for the diagnosis of sarcopenia, there were some limitations in real practice. This was particularly observed in critically ill patients with acute conditions, hospitalized patients who were immobile, patients with cognitive impairment who could not perform handgrip strength or gait and speed tests, and patients with an altered status who could not undergo CT or MRI. Consequently, the demand for a rapid, reliable, and accurate tool for the diagnosis of sarcopenia brings us to the use of ultrasonography for measuring RFM thickness as mentioned previously.21 Ultrasonographic measurement of RFM thickness is a simple and reliable method to detect low muscle mass for sarcopenia and can be used in an occupied clinical setting or screening for a large population. In this manner, ultrasonography can be used as a screening tool when BIA is not available or cannot be performed owing to the presence of a metal or pacemaker implant.
Limitations
This study had several limitations. Ultrasonographic imaging is widely used in clinical practice; however reliability and accuracy are based on the techniques and expertise of the operator. Second, ultrasonographic imaging was performed in the supine position. Thus, the cut-off values obtained in this study may not be fully applied to RFM thickness measured in positions other than the supine position. Third, RFM thickness was not adjusted for any body constitution. A standard, appropriate method for adjusting muscle thickness to body constitution measurements has not yet been established, and raw muscle thickness data have been used in most studies that attempted to estimate cut-off values. We did not evaluate for the actual hydration statuses of the participants, and some of the factors that may affect the BIA results could not be considered such as morbid obesity. Finally, we could not evaluate the long-term outcomes of patients with sarcopenia or severe sarcopenia who were evaluated using ultrasonography as compared to those evaluated using BIA.
Conclusion
In one Asian country, ultrasonographic detection of RFM thickness is feasible and reliable as a screening tool for the diagnosis of sarcopenia. The cut-off value for male was ≤1.1 cm, and for female, it was ≤1.0 cm. It showed the highest accuracy for confirming a low ASM. Future studies should evaluate and validate these findings in different settings, such as ambulatory settings and emergency settings, for the ultrasound detection of sarcopenia and its outcomes.
Acknowledgments
The authors would like to thank Dr. Yupadee Phusakul from the department of rehabilitation centre, Vajira Hospital for her supporting of teaching physical examination.
The authors would also like to thank Editage for the English language editing.
Funding
The study was supported by Thai Health Promotion foundation (Grant number 62-00-1522) and the Navamindradhiraj University Research fund.
Disclosure
The authors declare that they have no conflicts of interest.
References
1. Cruz-Jentoft AJ, Baeyens JP, Bauer JM., et al. Sarcopenia: European consensus on definition and diagnosis: report of the European Working Group on sarcopenia in older people. Age Aging. 2010;39:412–423. doi:10.1093/ageing/afq034
2. Chen KL, Woo J, Assantachai P, et al. Asian Working Group for Sarcopenia: 2019 Consensus update on Sarcopenia diagnosis and treatment. JAMDA. 2020;21:300–307. doi:10.1016/j.jamda.2019.12.012
3. Rosenberg I. Summary comments. Am J Clin Nutr. 1989;50:1231–1233. doi:10.1093/ajcn/50.5.1231
4. Kim H, Hirano H, Edahiro A, et al. Sarcopenia: prevalence and associated factors based on different suggested definitions in community-dwelling older adults. Geriatr Gerontol Int. 2016;16:110–122. doi:10.1111/ggi.12723
5. Cruz-Jentoft AJ, Bahat G, Bauer J, et al. Sarcopenia: revised European consensus on definition and diagnosis. Age Aging. 2019;48(1):16–31. doi:10.1093/ageing/afy169
6. Maden-Wilkinson TM, Degens H, Jones DA, et al. Comparison of MRI and DXA to measure muscle size and age-related atrophy in thigh muscles. J MusculoskeletNeuronal Interact. 2013;13:320–328.
7. Lee SJ, Janssen I, Heymsfield SB, et al. Relation between whole-body and regional measures of human skeletal muscle. Am J Clin Nutr. 2004;80:1215–1221. doi:10.1093/ajcn/80.5.1215
8. Beaudart C, McCloskey E, Bruyere O, et al. Sarcopenia in daily practice: assessment and management. BMC Geriatr. 2016;16:170. doi:10.1186/s12877-016-0349-4
9. Goodpaster BH, Kelley DE, Thaete FL, et al. Skeletal muscle attenuation determined by computed tomography is associated with skeletal muscle lipid content. J Appl Physiol. 2000;89:104–110. doi:10.1152/jappl.2000.89.1.104
10. Kim J, Wang Z, Heymsfield SB, et al. Total-body skeletal muscle mass: estimation by a new dual-energy X-ray absorptiometry method. Am J Clin Nutr. 2002;76:378–383. doi:10.1093/ajcn/76.2.378
11. Yamada Y, Nishizawa M, Uchiyama T, et al. Developing and validating an age-independent equation using multi-frequency bioelectrical impedance analysis for estimation of appendicular skeletal muscle mass and establishing a cutoff for sarcopenia. Int J Environ Res Public Health. 2017;14(7):809. doi:10.3390/ijerph14070809
12. Trevino-Aguirre E, Lopez-Teros T, Gutierrez-Robledo L, et al. Availability and use of dual energy X-ray absorptiometry(DXA) and bio-impedance analysis (BIA) for the evaluation of sarcopenia by Belgian and Latin American geriatricians. J Cachexia Sarcopenia Muscle. 2014;5:79–81. doi:10.1007/s13539-013-0126-6
13. Buckinx F, Landi F, Cesari M, et al. Pitfalls in the measurement of muscle mass: a need for a reference standard. J Cachexia Sarcopenia Muscle. 2018;9:269–278. doi:10.1002/jcsm.12268
14. Kyle UG, Bosaeus I, de Lorenzo AD, et al. Bioelectrical impedance analysis-part II: utilization in clinical practice. Clin Nutr. 2004;23(6):1430–1453. doi:10.1016/j.clnu.2004.09.012
15. Stringer HJ, Wilson D. The role of ultrasound as a diagnosing tool for sarcopenia. J Frailty Aging. 2018;7(4):258–261. doi:10.14283/jfa.2018.24
16. Hammond K, Mampilly J, Laghi FA, et al. Validity and reliability of rectus femoris ultrasound measurements: comparison of curved-array and linear-array transducers. J Rehabil Res Dev. 2014;51(7):1155–1164. doi:10.1682/JRRD.2013.08.0187
17. Seymour JM, Ward K, Sidhu PS, et al. Ultrasound measurement of rectus femoris cross-sectional area and the relationship with quadricep strength in COPD. Therax. 2009;64(5):418–423. doi:10.1136/thx.2008.103986
18. Angelina De Souza V, Oliveira D, Cupolilo EN, et al. Rectus femoris muscle mass evaluation by ultrasound: facilitating sarcopenia diagnosis in pre-dialysis chronic kidney disease stage. Clinics. 2018;73:e392. doi:10.6061/clinics/2018/e392
19. Kim JM, Tay Jie MR, Rajeswaren DK, Tham SL, Lui WL, Kong KH. Changes in muscle architecture on ultrasound in patients early after stroke. Neuro Rehabil. 2021;49(4):565–572. doi:10.3233/NRE-210257
20. Nijholt W, Scafoglieri A, Jager-Wittenaar H, Hobbenlen JSM, van der Schans C. The reliability and validity of ultrasound to quantify muscles in older adults: a systematic review. J Cachexia Sarcopenia Muscle. 2017;8:702–712. doi:10.1002/jcsm.12210
21. Fukumoto Y, Ikezoe T, Taniguchi M, et al. Cut-off values for lower limb muscle thickness to detect low muscle mass for sarcopenia in older adults. Clin Interv Aging. 2021;16:1215–1222. doi:10.2147/CIA.S304972
22. Maza D, Henriquez S, Berger J, et al. Rectus femoris (RF) ultrasound for the assessment of muscle mass in older people. Arch Gerontol Greriatr. 2019;61(2015):33–38.
23. Rustani K, Kundisova L, Capecchi PL, Nante N, Bicchi M. Ultrasound measurement of rectus femoris muscle thickness as a quick screening for sarcopenia assessment. Arch Gerontol Geriatr. 2019;83:151–154. doi:10.1016/j.archger.2019.03.021
24. Sri-on J, Kredarunsooksree T, Paksophis T, et al. Proposal for modifications to the Bangkok urban health system that would improve the quality of health, independent living, and maintenance of older adults with fall-related trauma (Bangkok falls study); 2021.
25. Brooke P, Bullock R. Validation of a 6 item cognitive impairment test with a view to primary care usage. Int J Geriatr Psychiatry. 1999;14(11):936–940. doi:10.1002/(SICI)1099-1166(199911)14:11<936::AID-GPS39>3.0.CO;2-1
26. Change KV, Wu TW, Huang KC, Jan WH, Han DS. Limb muscle quality and quantity in elderly adults with dyspnea but not sarcopenia: an ultrasound imaging study. Exp Gerontol. 2018;108:54–61. doi:10.1016/j.exger.2018.03.019
27. Ema R, Wakahara TG, Kawakami Y. Effect of Hip joint angle on concentric knee extension torque. J Electromyogr Kinesiol. 2017;37:141–146. doi:10.1016/j.jelekin.2017.10.012
28. Lanza MB, Balshaw TG, Folland JP. Do changes in neuromuscular activation contribute to the knee extensor angle-torque relationship? Exp Physiol. 2017;102:962–973. doi:10.1113/EP086343
29. Cini A, Sonda F, de Almeida PAZ I, Zanardi APJ, Gelain GM. Torque and electrical activation of the rectus femoris muscle at distinct joint angles: a case study. Int J Sports Exerc Med. 2020;5:159.
 © 2022 The Author(s). This work is published and licensed by Dove Medical Press Limited. The full terms of this license are available at https://www.dovepress.com/terms.php and incorporate the Creative Commons Attribution - Non Commercial (unported, v3.0) License.
By accessing the work you hereby accept the Terms. Non-commercial uses of the work are permitted without any further permission from Dove Medical Press Limited, provided the work is properly attributed. For permission for commercial use of this work, please see paragraphs 4.2 and 5 of our Terms.
© 2022 The Author(s). This work is published and licensed by Dove Medical Press Limited. The full terms of this license are available at https://www.dovepress.com/terms.php and incorporate the Creative Commons Attribution - Non Commercial (unported, v3.0) License.
By accessing the work you hereby accept the Terms. Non-commercial uses of the work are permitted without any further permission from Dove Medical Press Limited, provided the work is properly attributed. For permission for commercial use of this work, please see paragraphs 4.2 and 5 of our Terms.