Back to Journals » Clinical Ophthalmology » Volume 17
The Significance of Inter-Eye Osmolarity Difference in Dry Eye Diagnostics
Authors Nilsen C, Graae Jensen P ![]() , Gundersen M
, Gundersen M ![]() , Utheim ØA
, Utheim ØA ![]() , Gjerdrum B
, Gjerdrum B ![]() , Gundersen KG
, Gundersen KG ![]() , Jahanlu D, Potvin R
, Jahanlu D, Potvin R ![]()
Received 10 January 2023
Accepted for publication 21 February 2023
Published 11 March 2023 Volume 2023:17 Pages 829—835
DOI https://doi.org/10.2147/OPTH.S402556
Checked for plagiarism Yes
Review by Single anonymous peer review
Peer reviewer comments 2
Editor who approved publication: Dr Scott Fraser
Christian Nilsen,1 Per Graae Jensen,1 Morten Gundersen,1 Øygunn A Utheim,2– 4 Bjørn Gjerdrum,1 Kjell Gunnar Gundersen,1 David Jahanlu,5 Rick Potvin6
1iFocus Øyeklinikk, Haugesund, Norway; 2The Norwegian Dry Eye Clinic, Oslo, Norway; 3Department of Medical Biochemistry, Oslo University Hospital, Oslo, Norway; 4Department of Ophthalmology, Oslo University Hospital, Oslo, Norway; 5Faculty of Health Sciences, Oslo Metropolitan University, Oslo, Norway; 6Science in Vision, Bend, OR, USA
Correspondence: Christian Nilsen, iFocus Øyeklinikk, Strandgaten 203, Haugesund, 5004, Norway, Tel +47-97189598, Email [email protected]
Purpose: The purpose of this study was to evaluate the diagnostic value of inter-eye osmolarity differences in relation to dry eye symptoms and other non-osmolar signs of dry eye disease.
Patients and Methods: One hundred ninety one participants who attended a larger interventional study of dry eye disease prior to and after cataract surgery were analyzed for dry eye disease (DED). Dry eye diagnostics were performed for all subjects according to the DEWS II criteria: tear osmolarity was collected from both eyes with the TearLab system, non-invasive Tear film break up time (NIKBUT) was obtained on the test eye with Keratograph and ocular surface staining (OSS) was evaluated using the Oxford schema. The Ocular Surface Disease Index (OSDI) questionnaire was used to assess symptoms. Inter-eye osmolarity greater than 8, which is considered as a sign of DED according to the TearLab user manual, was evaluated and compared with other non-osmolar signs of DED.
Results: The 191 subjects were divided into three groups according to osmolarity measurements. Sixty-five subjects had normal osmolarity (below 308 mOsmol/L in both eyes and less than 9 mOsmol/L difference between the eyes), 107 had high osmolarity (308 mOsmol/L or higher in one of the eyes) and 19 had an inter-eye difference > 8 mOsmol/L or higher, with neither eye having osmolarity higher than 307 mOsmol/L. Signs and symptoms in this last group were not correlated with the high osmolarity group or the normal group, though they appeared more similar to the normal group.
Conclusion: The diagnostic value of inter-eye osmolarity difference in predicting symptoms or other non-osmolar signs of dry eyes appears weak. Our study suggests that the criterion of an inter-eye difference of 8 mOsmol/L is not a useful cut-off for diagnosing dry eyes based on osmolarity.
Keywords: dry eye disease, osmolarity, DEWS II
Introduction
Dry eye disease (DED) is a worldwide issue, with a prevalence ranging from 5% to 50% if based on signs and symptoms and up to 75% if the diagnosis is based on signs only.1 The most used diagnostic criteria for dry eye disease today are the criteria used by the International Dry Eye Workshop II (DEWS II) from 2017, which include both signs and symptoms.2 The diagnostic criteria for dry eyes are met if a patient has one or more of three signs of an unstable tear film (hyperosmolar tears, significant ocular surface staining or a low tear breakup time) and a symptom score of 13 points or more on the Ocular Surface Disease Index (OSDI) questionnaire.2
The central pathophysiological process in dry eye disease is believed to be a breakdown in the homeostasis of the tear film. Historically, dry eye disease was classified as either evaporative or aqueous deficient, but current understanding is that these two etiologies are overlapping.2
Evaporative dry eye is related to meibomian gland dysfunction (MGD) while aqueous deficiency is related to reduced tear production. Either or both of these would result in a hyperosmolar tear film, with activation of stress kinases and increased inflammation.3
An objective measurement of tear film osmolarity can be made with TearLab system.4 The instructions for the use of the system indicate that a diagnosis of DED should be made if the osmolarity of either eye is >308 mOsmol/L, or if the difference in measured osmolarity between eyes is >8 mOsmol/L. Using these criteria, the system has a reported specificity of 81.3% and sensitivity of 73.2%.5
The reason for measuring both eyes (or making multiple measurements in one eye) and recording the maximum value is that in dry eye subjects there can be significant variability in tear osmolarity.6 This variability is not usually observed in normal eyes.
The rationale for an inter-eye difference of >8 mOsmol/L being diagnostic for dry eye is less clear. The DEWS II reference as to why the inter-eye difference of >8 mOsmol/L can be used as a diagnostic criterion does not appear to be supported with a clinical study.7 It has been observed that the absolute inter-eye difference in osmolarity is positively correlated to the severity of DED, but the correlation appears relatively weak below a difference of 25 mOsmol/L.5 We located three studies that attempted to correlate inter-eye osmolarity differences with DED symptoms and other non-osmolar signs.8–10 None of these studies have studied the inter-eye osmolarity difference as an independent diagnostic criterion.
The purpose of this study was to evaluate the predictive value of an inter-eye osmolarity difference >8 mOsmol/L in relation to dry eye symptoms and signs when osmolarity in both eyes is not indicative of DED.
Materials and Methods
The results here were extracted from a larger perspective interventional study of dry eye disease and cataract surgery (not yet published). Diagnostic data from the first study visit were of interest. The study was conducted at one site in Haugesund, Norway (iFocus Eye Clinic). Tear film osmolarity and results from other diagnostic tests to detect dry eye disease (according to DEWS II) were among the variables.
Inclusion criteria included an indication for cataract surgery and being 18 years or older. Subjects had to be able to give informed consent and follow the study protocol. Exclusion criteria were manifest corneal disease or scarring, lid deformities, corneal ectasia, surgery of eyelids or intraocular surgery in the last six months, macular edema, pregnancy, previous filtering glaucoma surgery, patients with acute blepharitis, chalazion or conjunctivitis, a history of previous herpetic ulcer, the use of contact lenses, inability to follow the study protocol, and current use of ocular medications (eg, for glaucoma, allergy, or cyclosporine for dry eyes).
The study was approved by the Regional Committee for Medical Research Ethics Western Norway (no.65988). The study was conducted in compliance with Good Clinical Practice (GCP), including International Harmonization (ICH) Guidelines, and in general consistent with the 1996 version of the Declaration of Helsinki.
At the first study visit consent was obtained. One eye was randomized to be the study eye. Data collection was conducted in the order below.
First, osmolarity from both eyes was obtained by the TearLab osmolarity system.4 The microchip was placed in the lateral tear meniscus while the patients were instructed to gaze superonasally. The examiner took care not to touch the eye or eye lid with the microchip. Temperature and humidity were noted. Osmolarity was the first of the examinations so it would not be influenced by the other more invasive examinations.
Second, patients were asked to fill out two questionnaires: the Ocular Surface Disease Index and the Standard Patient Evaluation of Eye Dryness Questionnaire (SPEED II). The questionnaires were administered with general information from the researcher and subjects were informed that they should fill out the forms to the best of their abilities. The OSDI is scored from 0 to 100, with normal values under 13. The higher the score, the more symptoms of dry eye the patients have. Only the scores from the OSDI questionnaire were used for purpose of this investigation.
Third, the Non-Invasive Keratographic break-up time (NIKBUT) was obtained from the Oculus Keratograph 5M, OCULUS, Inc. The device was aligned, and the patient was instructed to blink twice. After the second blink, measurement started automatically. Patients were instructed and motivated to keep their eyes open without blinking. Measurement was automatically terminated if the patient blinked, moved strongly, or if the tear film significantly broke up. If necessary, the examination was repeated.
Finally, a routine slit lamp examination of the anterior segment was performed. Evaluation of corneal staining (Ocular Surface Staining, or OSS) was based on the Oxford schema, which is used to estimate surface damage in dry eye.5 A quantified 5 µL of 2% Fluorescein sodium was instilled into the conjunctival sac with a micro-pipette (using a sterile tip). After 30 seconds, the observation was made with a slit lamp with a yellow filter, at 16x magnification. Corneal fluorescein staining was graded from 0 to 5.
Table 1 summarizes the testing order and the cut-off criteria for the individual tests above relative to diagnosing dry eye according to DEWS II. The DEWS II criteria used in the analysis does not include osmolarity, because it is the criterion under investigation.
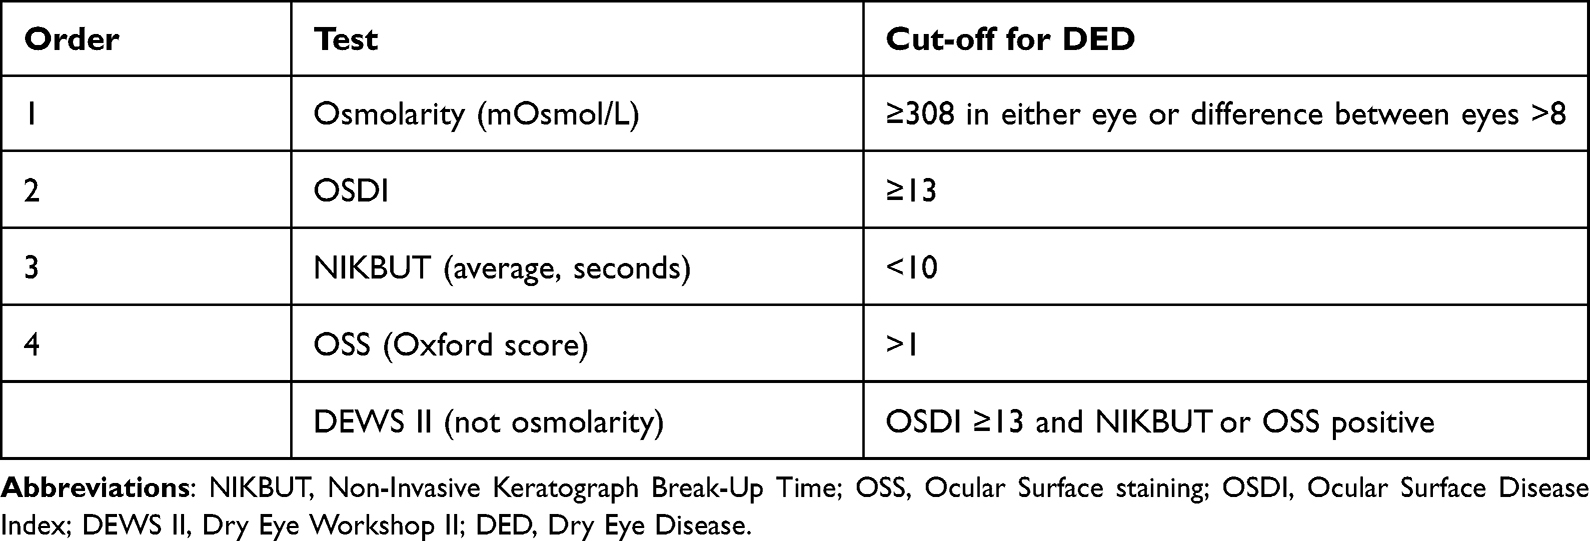 |
Table 1 Summary of Diagnostic Criteria and Order of Testing |
For analytical purposes, the subjects were divided into three groups according to osmolarity measurements.
- Normal osmolarity group (Normal): Both eyes had 307 mOmsol/L or below and the difference between the eyes was 8 or less.
- High osmolarity group (High): At least one of the eyes had an osmolarity of 308 mOsmol/L or higher.
- Inter difference group (ID_only): There was a difference of 9 mOsmol/L or more between eyes, with neither eye having an osmolarity higher than 307.
The three groups were investigated for correlation with symptoms and then with signs of unstable tear film like NIKBUT and staining (OSS). The heteroscedasticity of the variability in inter-eye difference was also tested.
All data was anonymized and kept in a secure database at Oslo Metropolitan University. The relevant data were extracted into an Excel spread sheet and checked for errors. The Statistical Package for the Social Sciences (IBM, SPSS Statistics, version 14.0) was used for data analysis. The Chi-squared test was used to analyze categorical data while a linear regression was used to test heteroscedasticity and correlations. A p value of 0.05 or lower was considered statistically significant.
Results
Two hundred nineteen patients were included in the study. Three patients withdrew and 25 additional patients were missing some of the necessary diagnostic data, primarily due to technical issues with one or more measuring devices at the time of their visit. This left 191 patients with data available for analysis. The subjects were divided into the three groups identified in the Methods section. The subject demographics are listed in Table 2.
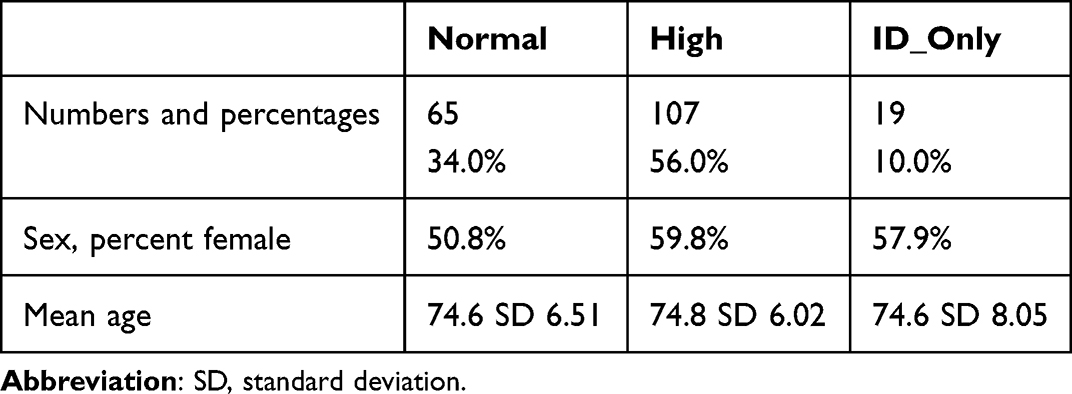 |
Table 2 Age and Gender Distribution in the Three Osmolarity Groups |
There was no statistically significant difference in the ages of the three groups (Kruskal Wallis rank sum test, p = 0.40). There was also no statistically significant difference in the percentages of males/females in each group (Pearson`s Chi-squared test, p = 0.50).
To check for heteroscedasticity of the inter-eye osmolarity difference we plotted it as a function of osmolarity (the maximum value for a given subject). This is shown in Figure 1, where there is an evident linear relationship between the maximum osmolarity measured and the inter-eye difference. The correlation between inter-eye osmolarity difference and maximum osmolarity is statistically significant (r = 0.5, p < 0.05). The inter-eye difference increases with increasing osmolarity.
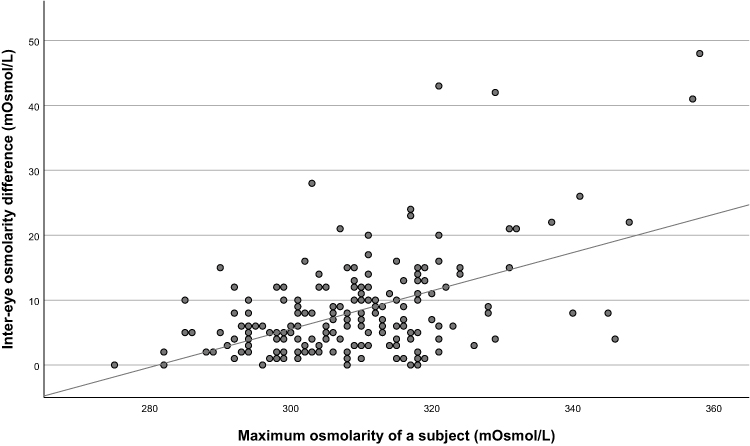 |
Figure 1 Relationship between inter-eye osmolarity difference and maximum osmolarity for all groups. |
To investigate whether the inter-eye osmolarity difference was a good proxy for dry eye disease, we plotted the inter-eye difference values of the ID_only group against their OSDI scores (a measure of dry eye symptoms). Results are shown in Figure 2. As can be seen, 37% (7/19) of the eyes with a high inter-eye difference had a normal OSDI score. Note that all eyes with an inter-eye difference >15 mOsmol/L had an OSDI score indicative of dry eye.
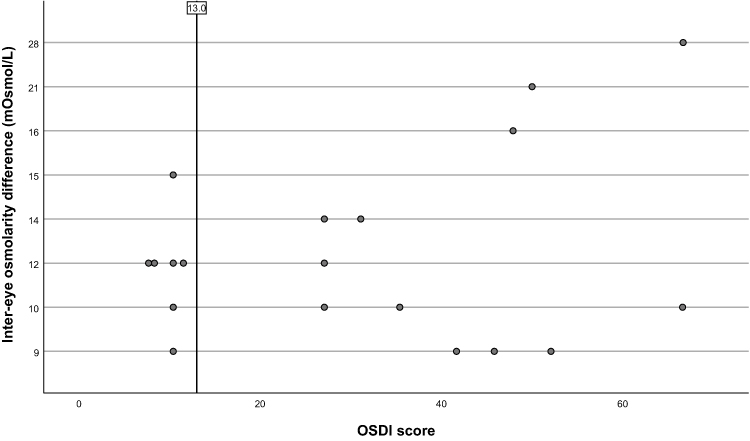 |
Figure 2 Relationship between inter-eye osmolarity difference in the ID_only group and OSDI scores. Abbreviation: OSDI, Ocular Surface Disease Index. |
To investigate whether the ID_only group matched the Normal or High groups, the DEWS II criteria for defining dry eye were evaluated separately and in combination by osmolarity group.
A Chi-square test was performed between the High group and ID_only group and then between the Normal group and the ID_only group to evaluate whether the pairs were statistically significantly different. In addition, a Chi-square test was performed between the High group and the Normal group. Detailed results are summarized in Table 3. The only difference which was statistically significant was between the High group and the ID_only group when looking at NIKBUT and OSS as joint criteria. As for the High group tested against the Normal group, there were statistically significant differences for OSS separately and combined with NIKBUT, but not for OSDI or NIKBUT separately. However, there was a clear trend for the ID_only group to be closer to the Normal group than the High group, based on the higher p-values for the former differences. These results suggest that the ID_only group better matches the Normal group in terms of correlating to dry eye signs and symptoms.
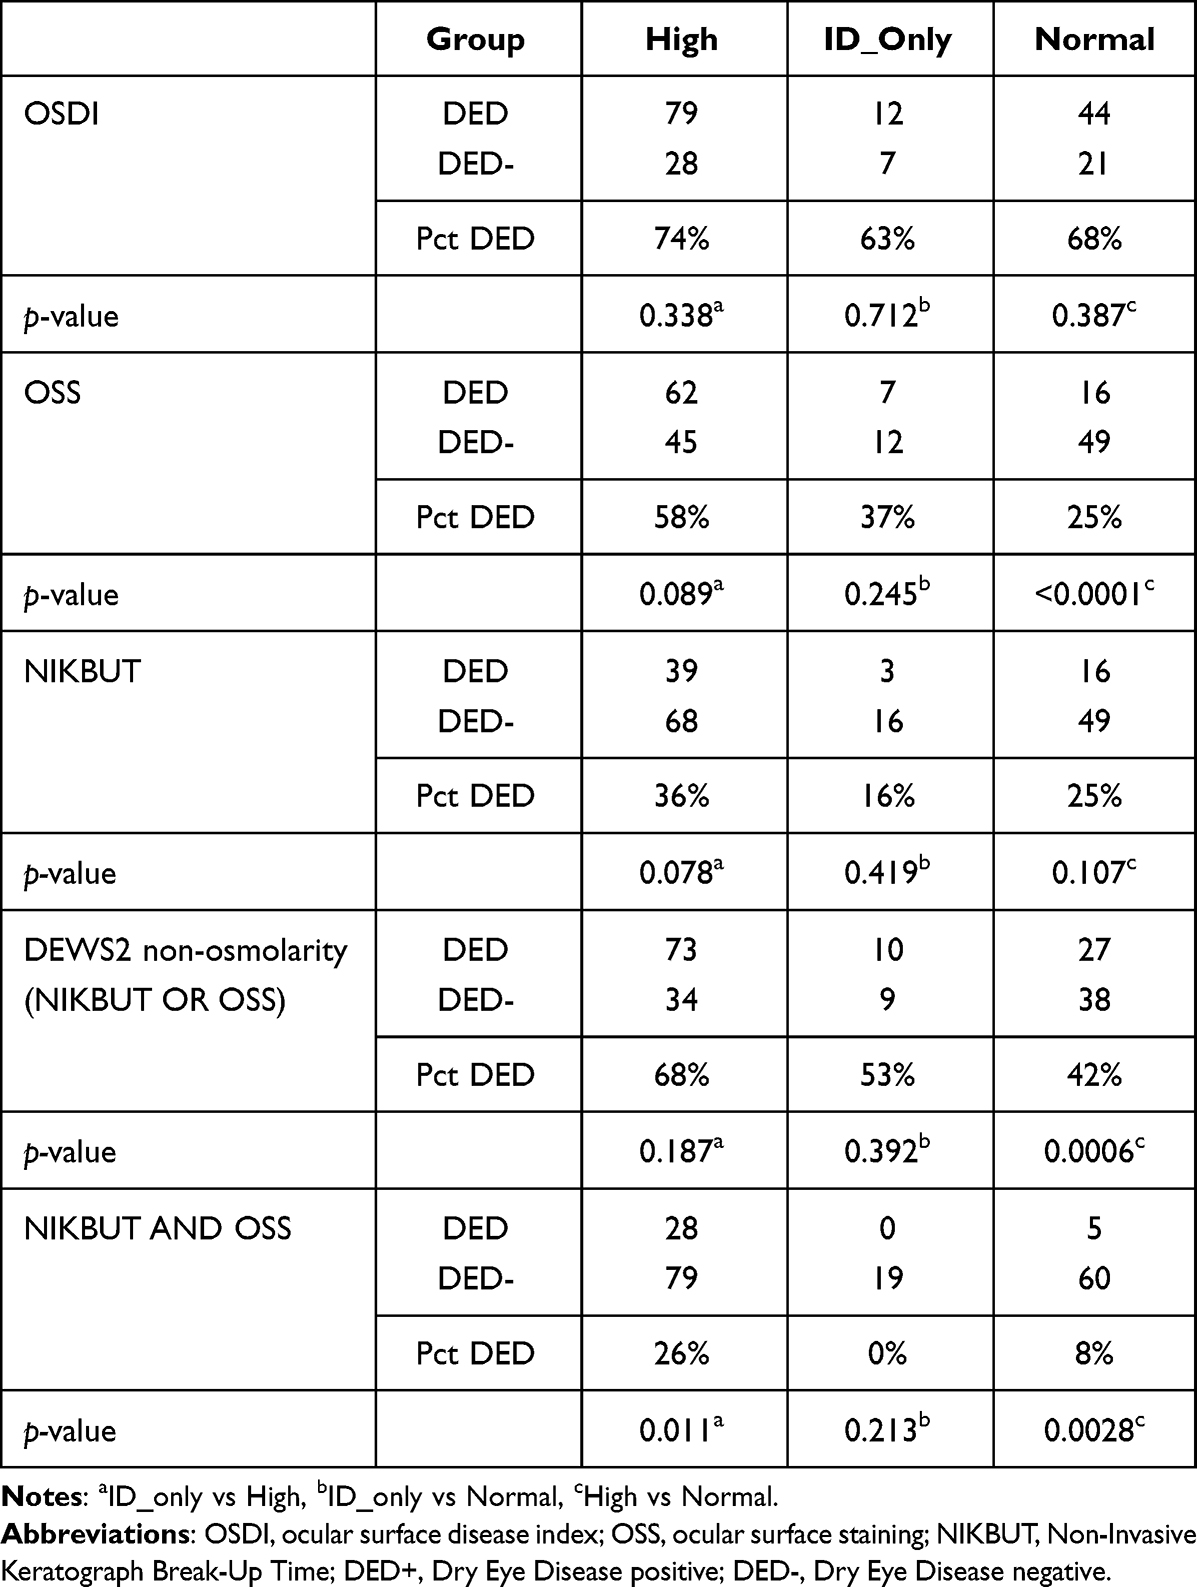 |
Table 3 Dry Eye Disease Diagnoses by Osmolarity Groups |
Discussion
This study was designed to evaluate the diagnostic value of an inter-eye osmolarity difference >8 mOsmol/L in relation to symptoms and signs when osmolarity in both eyes was not indicative of DED. We hypothesized that this diagnostic criterion would not be useful in identifying dry eye patients.
We found that the ID_only group was neither statistically correlated with symptoms nor other non-osmolar signs of DED such as non-invasive tear film break up time (NIKBUT) and ocular surface staining (OSS).
In addition to the above, we found that the percentage of dry eye subjects identified in the ID_only group was not statistically significantly correlated with the percentages of either the High osmolarity group or the Normal osmolarity group. The analysis did indicate a trend for the percentage of patients with DED in the ID_only group to be closer to the percentages in the Normal group versus the High group.
The findings above suggest that the inter-eye difference of 8 mOsmol/L or more between the eyes may not be a valid diagnostic criterion for identifying hyperosmolar patients. To our knowledge, this study is unique because it is the only study to date which has investigated the inter-eye osmolarity difference as a separate diagnostic criterion.
We believe the 8 mOsmol/L criterion was suggested by Tearlab based on the heteroscedastic nature of inter-eye differences; the inter-eye difference increases with increasing osmolarity.11 The heteroscedasticity was clearly demonstrated in our data set, but the 8 mOsmol/L cutoff point appeared below the level where the variability was demonstrably different. This appears consistent with the findings of Lemp et al based on their analysis (ie, Figure 2).6
The importance of inter-eye differences is previously studied Pena-Verdeal et al who looked at the criterion of inter-eye difference independently of high osmolarity.8 However, they looked at inter-eye difference as one group, including the patients with high osmolarity (309 mOsmol/L or higher from either eye). These subjects would have been classified as hyperosmolar on that basis. As such, their conclusion that high inter-eye differences (alone) were statistically important is not supported by their analysis. Wang et al10 showed only a modest discriminative ability for inter-eye difference using a cut-off with 8 mOsmol/l to detect non-osmolar signs or symptoms of DED using the recommendations of TFOS DEWS II. It is unclear if the study analyzed only subjects with normal osmolarity and an inter-eye difference of 8 mOsmol/L. This last study suggested that a cut off higher than 8 might be a better standalone criterion for diagnosing a hyperosmolar patient.
In our study, we looked at inter-eye osmolarity difference as a distinct criterion to diagnose DED as recommended by the manufacturer, as opposed to the previous studies where high inter-eye osmolarity differences were mixed with high osmolarity in either eye. We found that the percentages of DED+ patients based on the inter-eye differences were not statistically different from the percentage of DED- patients when other DED diagnostic criteria were used (OSDI, NIKBUT, OSS) Our data is in line with Wang et al and suggest that an inter-eye osmolarity difference >8 mOsmol/L is not sufficient for diagnosing DED.
Tashbayev et al investigated 757 patients with dry eye disease and 29 healthy controls with TearLab osmometer, along with other diagnostic tests including OSDI, OSS, and Tear film break-up time.9 Statistical differences between the patient group and the control group were observed for all the tests apart from tear osmolarity. This is partly different from our study, where a significant difference between the hyperosmolar and normal groups was found for patients with pathological levels of OSS and combined NIKBUT and OSS, but not for NIKBUT only and OSDI when 308 mOsm/L was used as a cut-off. Our findings suggest that hyperosmolarity plays a role in discriminating dry eye from non-dry eye patients in our cohort of patients scheduled for cataract surgery, but an inter-eye difference >8 mOsm/L as a diagnostic criterion was not supported. Possible explanatory factors to the differences in findings between Tashbayev et al and our study could be that the mean age in our cohort is higher than in Tashbayev et al and the percentage of females was smaller.
The strengths of the study are that we correlated inter-eye osmolarity of >8 mOsmol/L with non-osmolar signs of DED and symptoms as recommended by DEWSII. In addition, the data was collected at a single center, where two experienced ophthalmologists and one optometrist (all with a background in dry eye evaluation) collected the data.
The study has some limitations. One limitation is that the ID_only group could be underpowered because of small sample size. Another limitation, common to all dry eye studies, is that some of the signs of dry eye (eg, ocular staining) are evaluated subjectively and there were three individuals involved in the data collection. Finally, our study has a selection bias in a sense that we study a specific sample of patients scheduled for cataract surgery, so it may not be possible to generalize our findings to all dry eye patients.
In summary, our findings do not support an inter-eye difference of >8 mOsmol/L as a useful cut-off criterion for diagnosing hyperosmolarity. Correlations with symptoms and other signs were weak. Other DED diagnostic results for subjects diagnosed based on inter-eye difference tended to match the results for normal, rather than dry, eyes. Based on this we believe the inter-eye difference cutoff that is diagnostic for dry eye (8 mOsmol/L) should be re-evaluated. Further research would be required to determine a more appropriate cut-off value.
Disclosure
Mr Per Graae Jensen reports receiving 200 bottles of Thealoz duo for use of study purposes from Thea laboratories, grants from Norwegian council of Research, during the conduct of the study. Dr Morten Gundersen reports grants from Forskningsrådet Norge, and 200 samples of Thealoz-Duo (lubricant eye drops) were donated from Thea laboratories, during the conduct of the study. Dr Øygunn Utheim reports grants from the Research Council of Norway, during the conduct of the study and non-financial support from Thea Pharma, outside the submitted work.
Dr Rick Potvin reports personal fees from Alcon, personal fees from Carl Zeiss Meditec, outside the submitted work. The authors report no other conflicts of interest in this work.
References
1. Nelson JD, Craig JP, Akpek EK, et al. TFOS DEWS II introduction. Ocul Surf. 2017;15(3):269–275. doi:10.1016/j.jtos.2017.05.005
2. Craig JP, Nichols KK, Akpek EK, et al. TFOS DEWS II definition and classification report. Ocul Surf. 2017;15(3):276–283. doi:10.1016/j.jtos.2017.05.008
3. Messmer EM. The pathophysiology, diagnosis, and treatment of dry eye disease. Dtsch Arztebl Int. 2015;112(5):71–81;quiz 82. doi:10.3238/arztebl.2015.0071
4. Osmolarity Tests Cards. Instructions for use. TearLab; 2016.
5. Bron AJ, Evans VE, Smith JA. Grading of corneal and conjunctival staining in the context of other dry eye tests. Cornea. 2003;22(7):640–650. doi:10.1097/00003226-200310000-00008
6. Lemp MA, Bron AJ, Baudouin C, et al. Tear osmolarity in the diagnosis and management of dry eye disease. Am J Ophthalmol. 2011;151(5):792–798.e1. doi:10.1016/j.ajo.2010.10.032
7. Keech A, Senchyna M, Jones L. Impact of time between collection and collection method on human tear fluid osmolarity. Curr Eye Res. 2013;38(4):428–436. doi:10.3109/02713683.2013.763987
8. Pena-Verdeal H, García-Resúa C, Vazquez-Sanchez C, Garcia-Queiruga J, Giráldez MJ, Yebra-Pimentel E. Inter-eye osmolarity differences in patients with symptomatic and non-symptomatic dry eyes. Arq Bras Oftalmol. 2020;83(2):103–108. doi:10.5935/0004-2749.20200024
9. Tashbayev B, Utheim TP, Utheim ØA, et al. Utility of tear osmolarity measurement in diagnosis of dry eye disease. Sci Rep. 2020;10(1):5542. doi:10.1038/s41598-020-62583-x
10. Wang MTM, Ormonde SE, Muntz A, Craig JP. Diagnostic profile of tear osmolarity and inter-ocular variability for dry eye disease. Clin Exp Ophthalmol. 2020;48(2):255–257. doi:10.1111/ceo.13688
11. Sullivan B. Challenges in using signs and symptoms to evaluate new biomarkers of dry eye disease. Ocul Surf. 2014;12(1):2–9. doi:10.1016/j.jtos.2013.10.002
 © 2023 The Author(s). This work is published and licensed by Dove Medical Press Limited. The
full terms of this license are available at https://www.dovepress.com/terms
and incorporate the Creative Commons Attribution
- Non Commercial (unported, 3.0) License.
By accessing the work you hereby accept the Terms. Non-commercial uses of the work are permitted
without any further permission from Dove Medical Press Limited, provided the work is properly
attributed. For permission for commercial use of this work, please see paragraphs 4.2 and 5 of our Terms.
© 2023 The Author(s). This work is published and licensed by Dove Medical Press Limited. The
full terms of this license are available at https://www.dovepress.com/terms
and incorporate the Creative Commons Attribution
- Non Commercial (unported, 3.0) License.
By accessing the work you hereby accept the Terms. Non-commercial uses of the work are permitted
without any further permission from Dove Medical Press Limited, provided the work is properly
attributed. For permission for commercial use of this work, please see paragraphs 4.2 and 5 of our Terms.
Recommended articles
Prevalence of Dry Eye Disease Among Individuals Scheduled for Cataract Surgery in a Norwegian Cataract Clinic
Graae Jensen P, Gundersen M, Nilsen C, Gundersen KG, Potvin R, Gazerani P, Chen X, Utheim TP, Utheim ØA
Clinical Ophthalmology 2023, 17:1233-1243
Published Date: 27 April 2023
Evaluation of Perfluorohexyloctane Eyedrops in Habitual Contact Lens Wearers
Geffen DI, Pennell G
Clinical Ophthalmology 2024, 18:3179-3183
Published Date: 7 November 2024