")
Back to Journals » Clinical Ophthalmology » Volume 18
The Significance of Dry Eye Signs on Preoperative Keratometry Measurements in Patients Scheduled for Cataract Surgery
Authors Nilsen C , Gundersen M , Graae Jensen P , Gundersen KG , Potvin R , Utheim ØA , Gjerdrum B
Received 17 November 2023
Accepted for publication 8 January 2024
Published 16 January 2024 Volume 2024:18 Pages 151—161
DOI https://doi.org/10.2147/OPTH.S448168
Checked for plagiarism Yes
Review by Single anonymous peer review
Peer reviewer comments 3
Editor who approved publication: Dr Scott Fraser
Christian Nilsen,1 Morten Gundersen,1 Per Graae Jensen,1 Kjell Gunnar Gundersen,1 Richard Potvin,2 Øygunn A Utheim,3– 5 Bjørn Gjerdrum1
1Ifocus Eye Clinic, Haugesund, Norway; 2Science in Vision, Frisco, TX, USA; 3Department of Medical Biochemistry, Oslo University Hospital, Oslo, Norway; 4Department of Ophthalmology, Oslo University Hospital, Oslo, Norway; 5The Norwegian Dry Eye Clinic, Oslo, Norway
Correspondence: Christian Nilsen, Ifocus Eye Clinic, Strandgaten 203, Bergen, 5004, Norway, Tel +47 97189598, Email [email protected]
Purpose: The primary objective was to investigate if subjects with dry eyes had increased variability of keratometry measurements prior to cataract surgery compared to subjects with non-dry eyes. Secondary objectives were to determine which separate signs affected keratometry.
Patients and Methods: This study was part of a prospective interventional randomized controlled trial. After dry eye diagnostics were performed (signs only) subjects were divided into sign of dry eye (SDE) positive and negative groups. To investigate variability, we performed two keratometry measurements for each subject with three different optical biometers: Anterion (OCT optical biometer), Eyestar (combined OCT and reflection-based optical biometer), and Lenstar (reflection based-optical biometer).
Results: One hundred and thirty-one subjects were available for analysis. The variability of astigmatism was significantly higher for subjects with hyperosmolarity compared to normal eyes for the Lenstar, as was the percentage of eyes with variability of astigmatism greater than 0.25 D. The percentage of eyes with variability of average K greater than 0.25 D was higher for subjects with non-invasive keratograph break-up time < 10 seconds (NIKBUT positive) compared to normal eyes for the Lenstar.
Conclusion: Combined diagnostic criteria (signs only) showed no statistically significant differences for keratometry measurements between SDE positive and negative. Eyes with hyperosmolarity and NIKBUT positive showed statistically higher variability of keratometry measurements compared to normal eyes for Lenstar, but not for the Anterion or Eyestar biometers.
Keywords: cataract surgery, sign of dry eye, non-invasive keratography tear break-up time, ocular surface staining, osmolarity
Introduction
Cataract surgery is one of the most common surgical procedures within the field of ophthalmology.1,2 Prior to the surgery, the refractive power of the intraocular lens (IOL) is calculated based on the biometric measurements, like the corneal curvature, the depth of the anterior chamber, and the axial length of the eye.3 Modern optical biometers and improved cataract surgery techniques have led to good refractive predictability and therefore heightened expectations for achieving precise and desirable refractive outcomes from patients.4 Usually, the aim is emmetropia, where there is no need for distance vision correction after the surgery.5 Moreover, refractive precision is of paramount importance in refractive lens exchange (RLE), an identical procedure to cataract surgery where the crystalline lens is clear.6 Modern cataract (or RLE) surgery can be regarded as a refractive procedure.7
Numerous potential variables can exert an influence on the refractive outcome following a successful cataract surgery.8 Different formulas are used to estimate the appropriate power of the IOL, with no clear gold standard.9,10 For instance, some formulas exhibit superior accuracy for eyes with short axial lengths, and others are better for eyes with longer axial lengths.11 Furthermore, advanced age is associated with reduced refractive precision.4,12 Variability in measurements from the biometers used is another potential source of error.13 Dry eye disease (DED) is known to influence keratometry readings in biometric measurements and thus has been associated with an increased risk of post-surgical refractive error.9,13
In the context of calculating IOL power, corneal power is primarily predicted from keratometry. However, the existing body of research so far regarding DED and variability in the keratometry measurement (and hence, IOL power) is contradictory. For instance, Epitropoulos et al conducted a study where they observed that hyperosmolarity in the tear film significantly affected biometric measurements.13 Conversely, Gjerdrum et al, in their investigation, did not find any influence of tear osmolarity on biometric measurements.14 Furthermore, Dogan et al did not find any influence on the measurements of corneal topography among patients diagnosed with dry eyes.15 This underlines the current need to better understand to what extent DED affects the ocular biometric measurements underpinning IOL power calculation. If it is determined that DED reduces the accuracy of keratometry, treating DED before surgery and before biometric measurements may improve post-operative refractive results and consequently patient satisfaction.16
The primary objective of this study was to assess whether the variability in anterior keratometry measurements from three different optical biometers was higher in patients with dry eyes compared to patients with non-dry eyes. The secondary objective was to investigate which separate signs of dry eyes affected the biometric measurements.
Methods
This study was conducted as part of a broader prospective interventional randomized controlled clinical trial consisting of two arms, with data collected in one private eye clinic in Haugesund, Norway. The trial was prospectively registered at clinicaltrials.gov on 10th August 2020 (NCT05433428). The data is not available for sharing. Study subjects were recruited from among patients scheduled for cataract surgery by several ophthalmologists who were not part of the study. Recruitment and data collection took place from August 2022 to May 2023. The study was approved by the Regional Committee for Medical and Health Research Ethics in Norway (Application no. 64847) and followed the tenets of the Declaration of Helsinki and good clinical practice. Inclusion criteria were indication for age-related cataract surgery, age above 18 years, capability to provide informed consent and the ability to adhere to the study protocol. Exclusion criteria were any eye disease/condition that potentially could confound the results (for example, corneal herpetic ulcer, pterygium, or refractive surgery of the cornea) of this study and regular use of lubricant eye drops. The study comprised a single visit but was within the context of a larger randomized controlled trial that included a total of three visits.
Informed consent was obtained, and all subjects were examined for dry eyes according to the DEWS II criteria (signs only, not symptoms) described below.17 Subjects were identified as sign of dry eye positive (SDE+/group A) if they tested positive for dry eyes based on at least one out of three objective dry eye measurements; tear film osmolarity, Ocular Surface Staining (OSS) and Non-Invasive keratographic break up time (NIKBUT). The rest was categorized as sign of dry eye negative (SDE-/group B). One study eye per subject was selected based on randomization before dry eye diagnostics were performed.
A routine slit lamp examination was conducted prior to any dry eye diagnostics tests. First, tear osmolarity using the TearLab Osmolarity System (Trukera Medical) was performed following the manufacturer`s recommendations.18 Tear osmolarity was obtained from both eyes by placing the microchip in the lateral part of the tear meniscus. Osmolarity was the first test obtained so it would not to be influenced by other tests. Results of 308 mOsmol/L or higher from either eye or an inter-eye osmolarity difference of 9 or higher were regarded as positive.19 Second, to assess ocular surface staining, 5 µL of 2% fluorescein sodium was instilled in the conjunctival sac using a micro-pipette (using a sterile tip). The observation was made under a slit lamp using a yellow filter 30 seconds after installation of the fluorescein sodium. Grading of ocular surface staining was based on the Oxford schema (grade 0–5).20 Third, a noninvasive keratographic break-up time was obtained using the Oculus Keratograph 5M (OCULUS®, Germany).21 The device was aligned, and the patient was instructed to blink twice. After the second blink, measurement started automatically. Measurements were automatically terminated if the patient blinked or moved strongly. If this happened, the test was repeated.21 Eyes with average NIKBUT under 10 seconds was recorded as NIKBUT+, otherwise as NIKBUT-. OSS and NIKBUT were the last tests performed, so they did not affect the biometric measurements. NIKBUT was measured before OSS, which was the last dry eye test performed. Air temperature and humidity were recorded in the rooms where osmolarity and NIKBUT were measured.
In the current study, keratometry was measured using three different optical biometers with different underlying technologies. The first was the Lenstar 900 (Haag-Streit AG, Koeniz, Switzerland), a widely used optical low coherence reflectometry (OLCR) device, where measurements are based on reflection (the Placido principle), which is likely to be affected by tear film quality. The second was the Eyestar 900 (Haag-Streit AG, Koeniz, Switzerland), which has a combined technology based on both reflection and optical coherence tomography (OCT).22 The Eyestar is fully automatic, which reduces potential operating errors.22 It may also be affected by tear film quality. The third was the Anterion (Heidelberg Engineering GmbH, Heidelberg, Germany), which has an OCT-based technology which in theory will be less affected by tear film. The Eyestar and the Anterion are among the newer generation of optical biometers.
The order of use of the optical biometers was randomized for each patient. To investigate variability of keratometry, two measurements were taken for each device. The time between the measurements for any given device was between 10 and 20 minutes. For the Lenstar 900, the patients were requested to focus on a measuring beam with the eye wide open. Each acquisition consists of 5 manually started measurements with an aggregate value calculated by the instrument. If one measurement was of poor quality (marked as red on the software), the test was repeated. The Anterion acquisition is based on one single measurement. There is feedback of the measurement quality in the form of a green (pass), yellow (borderline), or red-light (fail) for fixation, tear film and lid, and movement. If needed, the measurement was repeated until a green light was achieved for fixation and movement. A yellow light for the quality of tear film and lid was accepted. The Eyestar involved a fully automated measurement. The device automatically performs a quality check and repeats measurements if necessary.
The study examinations and order are listed in Table 1.
 |
Table 1 Order of Examinations and Description of Tests |
All data was anonymized and kept digitally in a secure database at Oslo Metropolitan University. Keratometry data were exported using the built-in software for each device. The data was recorded in an Excel spreadsheet (Microsoft Corp.Redmond. USA) and checked for errors. Data analyses were performed with the Statistical Package for the Social Sciences (IBM, SPSS Statistics, version 14).
The primary variables of interest were the absolute difference in average K and the magnitude of vector difference of astigmatism between two repeated measurements per instrument for each subject. The vector difference of astigmatism can be related to differences in magnitude or axis. This is referred to here as the variability of average K or astigmatism.
Sample size calculations were based on an alpha of 0.05 and power of 0.8. With an expected standard deviation of 0.12 D between repeated measurements of average keratometry, 36 eyes in each group would be needed to reliably detect a difference of 0.08 D between groups (we utilized the resource in www.powerandsamplesize.com to calculate the sample size).23
Results
One hundred and thirty-five subjects were recruited for the study. Data from four subjects were not available for analysis because of withdrawal from the study or due to technical problems. This left one hundred and thirty-one subjects available for analysis. Demography is presented in Table 2.
 |
Table 2 Demography |
There were no statistically significant differences in age or sex between the three groups (p > 0.7).
SDE+ and SDE-
Variability of Average K
The variability of average K between the two measurements in SDE+ (Group A) versus SDE- (Group B) was calculated for each instrument and the results are presented in Figure 1. The mean variability of average K was highest in the SDE+ group for both the Eyestar and Lenstar, but not for Anterion. The between-group differences did not reach significant levels (p = 0.42 for Eyestar, p = 0.70 for Anterion and p = 0.19 for Lenstar) (Figure 1 and Table 3).
 |
Table 3 Variability for the Groups SDE+ and SDE |
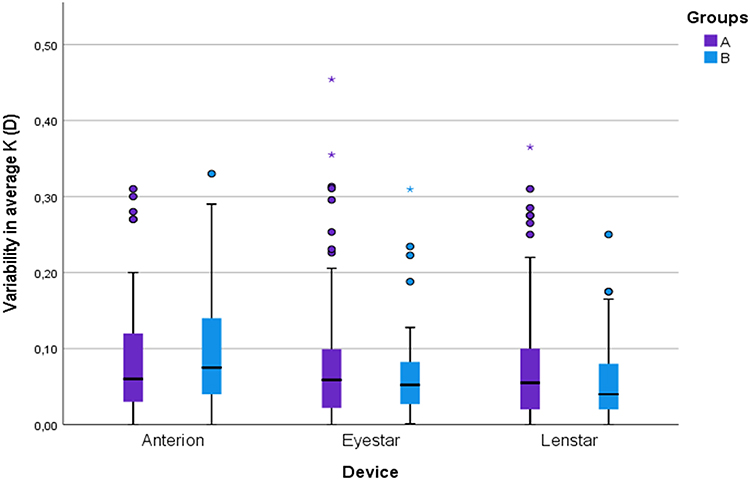 |
Figure 1 Variability in average K compared between the groups SDE+ (group A) and SDE- (group B) for three optical biometers. Notes: Circles indicate data points 1.5 box lengths from the edge of the box, asterisks indicate data points 3 box lengths from the edge of the box. |
The percentages of eyes with variability of average K greater than 0.25 D were higher in the SDE+ group for all three biometers. However, these differences were not statistically significant (Anterion: p = 0.6, Eyestar p = 0.8, and Lenstar: p = 0.3) (Table 3).
Variability of Astigmatism
The magnitude of the vector differences of anterior corneal astigmatism between two measurements were calculated for each instrument the SDE+ (Group A) and SDE- (Group B) groups. There were no statistically significant differences in the mean variability of astigmatism or percentages of eyes with variability of astigmatism greater than 0.25 D or 0.5 D between the groups for any of the three optical biometers (p > 0.1) (Figure 2 and Table 3).
 |
Figure 2 Variability of vector astigmatism between the groups SDE+ (group A) and SDE- (group B) for three optical biometers. Notes: Circles indicate data points 1.5 box lengths from the edge of the box, asterisks indicate data points 3 box lengths from the edge of the box. |
Separate Diagnostic Signs of Dry Eyes
Hyperosmolarity (Criteria According to DEWS II)
Variability in keratometry was compared between subjects with hyperosmolarity according to the DEWS II criteria (308 mOsmol/L or higher in either eye or inter-eye difference of 9 or higher) and subjects with normal osmolarity according to DEWS II. We found no statistically significant differences in mean variability or percentages of eyes with variability greater than 0.25 D or 0.5 D between the groups for any of the three devices (Table 4).
 |
Table 4 Variability for the Groups Hyperosmolar (DEWS II) and Hyperosmolar (Study Eye) |
Hyperosmolarity in the Study Eye
We also analyzed the difference in variability of keratometry between hyperosmolar eyes (308 mOsmol/L or higher in the study eye) and normal eyes (osmolarity of 307 mOsmol/L or less). There was no statistically significant difference in mean variability of average K or percentages of eyes with variability greater than 0.25 D between hyperosmolar and normal eyes for any of the three optical biometers (Table 4).
However, we found statistically significantly higher mean variability of astigmatism in the hyperosmolar eyes compared to the normal eyes for Lenstar (p= 0.01), but not for Anterion and Eyestar (Table 4).
We also found that the percentages of eyes with variability of astigmatism greater than 0.25 D were higher in hyperosmolar eyes for the Eyestar and Lenstar, but this was statistically significant only for the Lenstar (Figure 3 and Table 4). For variability of astigmatism greater than 0.5 D, no statistically significant differences were seen.
 |
Figure 3 Percentages of eyes with variability of astigmatism greater than 0.25 D for hyperosmolar and normal eyes. Notes: *Fisher’s exact test; **Hyperosmolar: 308 mOsmol/L or higher in study eye. |
Temperature in the examination room varied from 22.5 to 25.5 degrees of Celsius and humidity from 19% to 54%. Temperature and osmolarity were very weakly negatively correlated with a p value of 0.047 and a Pearson’s correlation coefficient of −0.171, and R squared of 0.03 Humidity and osmolarity were also weakly negatively correlated with a p-value of 0.01 and a slightly larger Pearson’s correlation coefficient of −0.307, and R squared of 0.09.
Non-Invasive Keratographic Break Up Time
There were no statistically significant differences in the variability of average K between NIKBUT positive (<10 seconds) eyes and normal eyes. Lenstar and Eyestar had higher variability, but this was not statistically significant (p=0.06 for Lenstar and 0.7 for Eyestar) (Table 5).
 |
Table 5 Variability for the Group NIKBUT Positive |
However, the percentages of eyes with average K greater than 0.25 D were statistically significantly higher in eyes with positive NIKBUT for the Lenstar only (Figure 4 and Table 5).
 |
Figure 4 Percentages of eyes with average K greater than 0.25 D with NIKBUT+ and NIKBUT- (normal eyes). Abbreviations: NIKBUT, non-invasive keratography break-up time; NIKBUT+, average NIKBUT < 10 seconds; NIKBUT-, average NIKBUT > 10 seconds. Note: *Fisher’s exact test statistically significant. |
There were no statistically significant differences in mean variability of astigmatism, or percentages of eyes with variability of astigmatism greater than 0.25 D or 0.5 D between eyes with positive NIKBUT and normal eyes (Table 5).
Ocular Surface Staining
The variability of keratometry was compared between normal eyes and eyes with OSS > 1 (mild) or OSS > 2 (marked). None of these comparisons showed any statistical differences for any of the three devices (Table 6).
 |
Table 6 Variability for the Groups OSS Positive (1) and OSS Positive (2) |
Discussion
The main objective of this study was to investigate if the variability of anterior keratometry measurements for three different optical biometers was higher in subjects with dry eyes compared to patients with non-dry eyes. We hypothesized that the variability of keratometry of optical biometric devices that depend on reflections from the tear film would be higher for subjects with dry eyes versus subjects with non-dry eyes. In this study, we used only objective signs to categorize subjects as having dry eye because the signs of dry eye disease directly affect the cornea and tear film (potentially affecting biometry), whereas the subjects’ symptoms are likely of less importance.24 Previous studies have shown that the correlation between symptoms and signs of dry eye is weak.25,26
When the DEWS II diagnostic criteria (signs only) were applied, our findings did not support the hypothesis that dry eyes increased the variability of keratometry for any of the three optical devices.
In addition to the combined signs of dry eyes, we investigated the separate signs of dry eyes and their possible significance on the variability of anterior keratometry.
For hyperosmolarity (according to DEWS II), our findings did not support the hypothesis that keratometry variability increased for any of the three optical devices.
However, we found a statistically significantly higher variability of astigmatism and percentages of eyes with astigmatism greater than 0.25 D in hyperosmolar eyes (hyperosmolarity in the study eye only) with the Lenstar. The reason for this may be that the inter-eye difference of osmolarity could be a weak proxy for both symptoms and other non-osmolar signs of dry eyes.15
There are other studies which are comparable to our study. Epitropoulos et al13 found a statistically significantly higher percentage of subjects with variability of average K greater than 0.5 D or vector differences greater than 1.0 D in their hyperosmolar group. In this earlier study, hyperosmolarity was defined as more than 316 mOsmol/L in either eye (a cut-off higher than the present study), and results from both eyes were analyzed. They used an IOLMaster (Carl Zeiss Meditec AG), which also uses reflection-based keratometry like Lenstar. However, there are some important differences. The IOLMaster measures reflections from six light spots at 2.5 mm diameter and makes 3 automatic sequential measurements to generate a composite value. In contrast, the Lenstar measures thirty-two points on two concentric rings at 1.65 mm and 2.3 mm. There are five separate measurements which each consist of five automatic measurements, taking about 2–4 minutes and generating a composite value. Subjects are allowed to blink between the measurements. In the Epitropoulos et al study some of the measurements were performed with manual keratometry and some of the two measurements were taken on different days, whereas in our study the two measurements were taken on the same day,10–20 minutes apart. The higher variability seen in the Epitropoulos et al study compared to our study could be due to technology differences in the two reflection-based instruments and differences in the two study designs.
Another study which is comparable to our study is Gjerdrum et al.14 The Lenstar was one of the three optical biometers used in that study. Subjects in the hyperosmolar group had 316 mOsmol/L or higher (also a cut-off higher than the present study). The inter-eye criterion of DEWS II was not applied. The main finding was that the variability was not influenced by osmolarity. There were two OCT devices used in the study, the Casia SS-1000 (Tomey Corporation, Nagoya, Japan) and the Anterion, but also one Scheimpflug device, the Pentacam HR (Oculus, Wetzlar, Germany). The Scheimpflug devices as well as OCT-based devices utilize technologies of tomographic images based on elevation maps, which do not rely on reflections from the tear film and are therefore believed to be less dependent on tear film quality. The study showed that the variability of keratometry was higher with the two OCT devices compared to the Lenstar and Pentacam, but this was not influenced by hyperosmolarity. A confounding factor for the comparison of the study of Gjerdrum et al and the present study, is that the average age of the subjects from the study of Gjerdrum et al was 43 years whereas in our study the average age was 75. Increasing age, regardless of DED, has been shown to affect keratometry measurements.27
We also analyzed tear film break-up time and ocular surface staining. There was no evidence that ocular surface staining, either mild (Oxford scale >1, according to DEWS II) or marked (Oxford grade >2), led to increased variability of keratometry for any of the three optical biometers. To our knowledge, OSS in relation to keratometry has not been studied before. For subjects with instability of the tear film (NIKBUT >10 seconds), we found no statistically significant differences in variability of astigmatism, but we did find a statistically significantly higher percentage of subjects with greater than 0.25 D of variability in average K compared to subjects with stable tear film with the Lenstar measurements (Figure 4, Table 3). There is one comparable study to the present study regarding NIKBUT: Dogan et al15 found that differences in NIKBUT did not affect the repeatability of corneal topography measurements (including average simulated keratometry) with a Scheimpflug imaging-based device (Sirius; Costruzione Strumenti Oftalmici, Florence, Italy) between dry eye patients and non-dry eye patients, a result inconsistent with our findings. Dogan et al15 classified the subjects only based on NIKBUT (cut-off 10 seconds on average) measured with the same Scheimpflug device. The Sirius device utilizes a combined technology of reflections from the corneal surface (Placido principle) and Scheimpflug imaging, while the Lenstar utilizes only reflection from the tear film. The results of these studies suggest that measurements with exclusively reflection-based optical biometers like the Lenstar and the IOLMaster may be more sensitive to unstable tear film than measurements with Scheimpflug or OCT-based optical biometers. Additional research would be required to better understand these findings.
The present study suggests that reduced tear film break-up time and hyperosmolarity in the actual eye could be of importance to keratometry measurements in reflection-based optical biometers prior to cataract surgery. Besides the statistically significant results for Lenstar, there was a tendency for more variability among the non-significant results for the Lenstar measurements compared to Anterion and Eyestar. It has been shown that keratometry measurements can account for up to 22% of the error in IOL power calculations.28
There are several limitations inherent to this study. First, the time between the two measurements for each device varied from 10 to 20 minutes for each subject. Extended duration between these two measurements has the potential to stabilize the tear film, potentially influencing the obtained results. Second, there is uncertainty whether the osmolarity we measure in the tear meniscus is actually representative of the central corneal surface,29 which may be an under-estimation.30 Third, differences in temperature and humidity could affect osmolarity measurements, though correlations between osmolarity and temperature/humidity were weak. On the other hand, the R squared values for temperature and humidity in relation to osmolarity were 0.03 and 0.09, respectively. Therefore, fluctuations in temperature and humidity could not account for the variance in osmolarity. Finally, there were only twenty-one subjects for the sub-analyses of positive NIKBUT, so generalizations must be made with caution.
Conclusion
Results in the current study suggest dry eye does not materially affect surgical planning, with the exception that in some dry eye patients, reflection-based keratometry seemed slightly less reliable.
Disclosure
Richard (Rick) Potvin reports consulting fees from Alcon and Hoya. The other authors report no conflict of interest in this article.
References
1. Davis G. The evolution of cataract surgery. Mo Med. 2016;113(1):58–62.
2. Jaycock P, Johnston RL, Taylor H, et al. The cataract national dataset electronic multi-centre audit of 55,567 operations: updating benchmark standards of care in the United Kingdom and internationally. Eye. 2009;23(1):38–49. doi:10.1038/sj.eye.6703015
3. Ferreira TB, Hoffer KJ, Ribeiro F, Ribeiro P, O’Neill JG, Vavvas DG. Ocular biometric measurements in cataract surgery candidates in Portugal. PLoS One. 2017;12(10):e0184837. doi:10.1371/journal.pone.0184837
4. Sella R, Chou L, Schuster AK, Gali HE, Weinreb RN, Afshari NA. Accuracy of IOL power calculations in the very elderly. Eye. 2020;34(10):1848–1855. doi:10.1038/s41433-019-0752-0
5. Behndig A, Montan P, Stenevi U, Kugelberg M, Zetterström C, Lundström M. Aiming for emmetropia after cataract surgery: Swedish National Cataract Register study. J Cataract Refract Surg. 2012;38(7):1181–1186. doi:10.1016/j.jcrs.2012.02.035
6. Alio JL, Grzybowski A, El Aswad A, Romaniuk D. Refractive lens exchange. Surv Ophthalmol. 2014;59(6):579–598. doi:10.1016/j.survophthal.2014.04.004
7. Moshirfar M, Thomson AC, Thomson RJ, Martheswaran T, McCabe SE. Refractive enhancements for residual refractive error after cataract surgery. Curr Opin Ophthalmol. 2021;32(1):54–61. doi:10.1097/icu.0000000000000717
8. Norrby S. Sources of error in intraocular lens power calculation. J Cataract Refract Surg. 2008;34(3):368–376. doi:10.1016/j.jcrs.2007.10.031
9. Kane JX, Chang DF. Intraocular lens power formulas, biometry, and intraoperative aberrometry: a review. Ophthalmology. 2021;128(11):e94–e114. doi:10.1016/j.ophtha.2020.08.010
10. Savini G, Di Maita M, Hoffer KJ, et al. Comparison of 13 formulas for IOL power calculation with measurements from partial coherence interferometry. Br J Ophthalmol. 2021;105(4):484–489. doi:10.1136/bjophthalmol-2020-316193
11. Fam HB, Lim KL. Improving refractive outcomes at extreme axial lengths with the IOLMaster: the optical axial length and keratometric transformation. Br J Ophthalmol. 2009;93(5):678–683. doi:10.1136/bjo.2008.148452
12. Reitblat O, Gali HE, Chou L, et al. Intraocular lens power calculation in the elderly population using the Kane formula in comparison with existing methods. J Cataract Refract Surg. 2020;46(11):1501–1507. doi:10.1097/j.jcrs.0000000000000308
13. Epitropoulos AT, Matossian C, Berdy GJ, Malhotra RP, Potvin R. Effect of tear osmolarity on repeatability of keratometry for cataract surgery planning. J Cataract Refract Surg. 2015;41(8):1672–1677. doi:10.1016/j.jcrs.2015.01.016
14. Gjerdrum B, Gundersen KG, Lundmark PO, Aakre BM. Repeatability of OCT-based versus scheimpflug- and reflection-based keratometry in patients with hyperosmolar and normal tear film. Clin Ophthalmol. 2020;14:3991–4003. doi:10.2147/opth.S280868
15. Doğan A, Gürdal C, Köylü MT. Does dry eye affect repeatability of corneal topography measurements? Turk J Ophthalmol. 2018;48(2):57–60. doi:10.4274/tjo.10179
16. Kieval JZ, Al-Hashimi S, Davidson RS, et al. Prevention and management of refractive prediction errors following cataract surgery. J Cataract Refract Surg. 2020;46(8):1189–1197. doi:10.1097/j.jcrs.0000000000000269
17. Craig JP, Nichols KK, Akpek EK, et al. TFOS DEWS II definition and classification report. Ocul Surf. 2017;15(3):276–283. doi:10.1016/j.jtos.2017.05.008
18. Osmolarity Tests Cards. Instructions for Use. TearLab; 2016.
19. Wolffsohn JS, Arita R, Chalmers R, et al. TFOS DEWS II diagnostic methodology report. Ocul Surf. 2017;15(3):539–574. doi:10.1016/j.jtos.2017.05.001
20. Bron AJ, Evans VE, Smith JA. Grading of corneal and conjunctival staining in the context of other dry eye tests. Cornea. 2003;22(7):640–650. doi:10.1097/00003226-200310000-00008
21. Oculus Optikergerate. Oculus Keratograph 5M User Guide.Wetzlar, Germany;2017.
22. Hagg-Streit Diagnostics. EYESTAR 900¨manual. Available from: https://haag-streit.com/2%20Products/Speciality%20diagnostics/Biometry/Eyestar%20900/Instructions%20for%20use/1500_7220686_04030_IFU_EYESTAR_900_01_en_web.pdf.
23. Gjerdrum B, Gundersen KG, Nilsen C, Gundersen M, Jensen P. Refractive predictability and biometry agreement of a combined swept source optical coherence and reflectometry biometer compared to an optical low coherence reflectometry biometer and an SS-OCT biometer. Clin Ophthalmol. 2023;17:1439–1452. doi:10.2147/opth.S408685
24. Barboza MN, Barboza GN, de Melo GM, et al. [Correlation between signals and symptoms of dry eye in Sjögren’s syndrome patients] Correlação entre sinais e sintomas de olho seco em pacientes portadores da síndrome de Sjögren. Arq Bras Oftalmol. 2008;71(4):547–552. Portuguese. doi:10.1590/s0004-27492008000400015
25. Graae Jensen P, Gundersen M, Nilsen C, et al. Prevalence of dry eye disease among individuals scheduled for cataract surgery in a Norwegian cataract clinic. Clin Ophthalmol. 2023;17:1233–1243. doi:10.2147/opth.S407805
26. Lee JH, Kim CH, Choe CM, Choi TH. Correlation analysis between ocular surface parameters with subjective symptom severity in dry eye disease. Korean J Ophthalmol. 2020;34(3):203–209. doi:10.3341/kjo.2019.0133
27. Hashemi H, Yekta A, Shokrollahzadeh F, et al. The distribution of keratometry in a population based study. J Curr Ophthalmol. 2021;33(1):17–22. doi:10.1016/j.joco.2019.06.004
28. Olsen T. Calculation of intraocular lens power: a review. Acta Ophthalmol Scand. 2007;85(5):472–485. doi:10.1111/j.1600-0420.2007.00879.x
29. Willcox MDP, Argüeso P, Georgiev GA, et al. TFOS DEWS II tear film report. Ocul Surf. 2017;15(3):366–403. doi:10.1016/j.jtos.2017.03.006
30. Bron AJ, de Paiva CS, Chauhan SK, et al. TFOS DEWS II pathophysiology report. Ocul Surf. 2017;15(3):438–510. doi:10.1016/j.jtos.2017.05.011
 © 2024 The Author(s). This work is published and licensed by Dove Medical Press Limited. The full terms of this license are available at https://www.dovepress.com/terms.php and incorporate the Creative Commons Attribution - Non Commercial (unported, v3.0) License.
By accessing the work you hereby accept the Terms. Non-commercial uses of the work are permitted without any further permission from Dove Medical Press Limited, provided the work is properly attributed. For permission for commercial use of this work, please see paragraphs 4.2 and 5 of our Terms.
© 2024 The Author(s). This work is published and licensed by Dove Medical Press Limited. The full terms of this license are available at https://www.dovepress.com/terms.php and incorporate the Creative Commons Attribution - Non Commercial (unported, v3.0) License.
By accessing the work you hereby accept the Terms. Non-commercial uses of the work are permitted without any further permission from Dove Medical Press Limited, provided the work is properly attributed. For permission for commercial use of this work, please see paragraphs 4.2 and 5 of our Terms.