Back to Journals » Diabetes, Metabolic Syndrome and Obesity » Volume 15
The Role of Changes in Cumulative Lipid Parameter Burden in the Pathogenesis of Type 2 Diabetes Mellitus: A Cohort Study of People Aged 35–65 Years in Rural China
Authors Wang Q, Xie T, Zhang T, Deng Y, Zhang Y, Wu Q, Dong M ![]() , Luo X
, Luo X
Received 23 February 2022
Accepted for publication 3 June 2022
Published 16 June 2022 Volume 2022:15 Pages 1831—1843
DOI https://doi.org/10.2147/DMSO.S363692
Checked for plagiarism Yes
Review by Single anonymous peer review
Peer reviewer comments 2
Editor who approved publication: Prof. Dr. Antonio Brunetti
Qi Wang,1,2 Tao Xie,2 Ting Zhang,2 Yuanjia Deng,2 Yuying Zhang,2 Qingfeng Wu,1,2 Minghua Dong,1,2 Xiaoting Luo1– 3
1Key Laboratory of Cardio Cerebrovascular Diseases, Ministry of Education, Gannan Medical University, Ganzhou, People’s Republic of China; 2School of Public Health and Health Management, Gannan Medical University, Ganzhou, People’s Republic of China; 3School of General Medicine, Gannan Medical University, Ganzhou, People’s Republic of China
Correspondence: Xiaoting Luo, Tel +86 13677975578, Fax +86 0797-8169600, Email [email protected]
Purpose: The main purpose of this study was to examine the effect of the cumulative exposure of blood lipid parameters on type 2 diabetes mellitus (T2DM). Another purpose was to explore whether the cumulative burden of blood lipid parameters plays a certain role in the pathogenesis of diet affecting T2DM.
Patients and Methods: A total of 63 cases of diabetes occurred from 2017 to 2020, with an incidence density of 3.71 person-years. The dietary intake of the residents was obtained by using a dietary frequency questionnaire (FFQ). Cumulative lipid parameter burden was calculated according to the number of years (2016– 2020) multiplied by total cholesterol (TC), high density lipoprotein (HDL), low density lipoprotein (LDL) and triglyceride (TG). A Cox proportional hazard model was used to estimate the effect of cumulative lipid burden on T2DM. A mediating analysis of accelerated failure time (AFT) was used to investigate the mediating effects of certain foods, the cumulative lipid parameter burden and T2DM.
Results: A higher cumulative TG load corresponded to a higher risk of T2DM onset (Ptrend=0.021). After adjusting for covariates, the highest quartile cumulative TG burden had a 3.462 times higher risk of T2DM than that in the lowest quartile (HR=3.462, 95% CI: 1.297– 9.243). Moreover, a higher cumulative HDL load corresponded to a lower risk of T2DM onset (Ptrend =0.006). After adjusting for covariates, the risk of T2DM was 0.314-fold lower in the highest quartile of cumulative HDL burden than that in the lowest quartile (HR=0.314, 95% CI: 0.131– 0.753). Cumulative TG burden partially mediated the association between red meat and T2DM.
Conclusion: The increase in cumulative HDL burden and the decrease in cumulative HDL burden are related to the incidence of T2DM. Cumulative TG burden was shown to play a partial mediating role in the pathogenesis of red meat and diabetes.
Keywords: type 2 diabetes mellitus, cumulative lipid parameter burden, diet, cohort study
Introduction
Diabetes mellitus, which is one of the leading risk factors for death worldwide, has a high disability rate and social and economic burden, which has garnered a high degree of global concern.1,2 Diabetes mellitus (mainly type 2 diabetes mellitus, or T2DM) has emerged as a major health challenge, due to the fact that its prevalence has doubled in the past few decades and is still steadily increasing.3 Effective prevention and management of diabetes has become an essential condition for addressing these challenges.4
Numerous studies have shown that patients with T2DM often have lipid metabolism disorders.5,6 However, most of these studies have devoted attention to dyslipidemia in patients with diabetes or the association between the onset of diabetes and baseline lipid levels.7,8 Due to the fact that lipid levels are dynamic, a longitudinal follow-up may be a better indicator of the role of lipids in T2DM progression than the use of baseline lipid levels. However, to our knowledge, there are limited relevant studies in this area of research. Therefore, it is necessary to explore the effect of the cumulative burden of lipid parameters on T2DM.
It is well known that diets such as fruits, vegetables, grains and red meat also play a role in the development of T2DM.9–12 Lipid metabolism is also easily affected by diet. For example, a high-fat diet is considered to be an indispensable factor causing lipid metabolism disorder,13 and excessive sugar intake was also found to have adverse effects.14 Recent studies have shown that mushroom consumption may have beneficial effects on lipid profiles by altering various metabolic markers, such as low density lipoprotein (LDL) cholesterol, high density lipoprotein (HDL) cholesterol, total cholesterol (TC) and triglyceride (TG).15 Consumptions of tea, vegetables and fruits that are rich in dietary polyphenols have also been found to be effective in improving blood lipid parameters.16 Therefore, the issue as to whether blood lipids play a role in the effect of diet on T2DM is another question that we focused on in this study.
Based on the information mentioned above, this study mainly discussed the influence of the cumulative burden of lipid parameters on the incidence of T2DM. The second purpose of this study was to explore the possible role of the cumulative burden of blood lipid parameters in the pathogenesis of diet affecting T2DM. The results of our study can provide clues for the prevention of diabetes.
Materials and Methods
Study Population
The study population included individuals from the Gannan Chronic Disease Cohort Study. The Gannan cohort study is a longitudinal survey designed to investigate the risk factors for chronic disease among the population aged 35 to 65 years in the less economically developed regions of southern China. The economic level of each region was similar, and there was little difference among the occupations and education levels of the research subjects. The cohort began to be studied in 2016, and the participants who entered the cohort received a questionnaire survey, physical examination and blood index tests at a fixed time (from July to August) every year. Written informed consent was obtained from the participants at each stage, and the study protocol was approved by the ethics committee of Gannan Medical University and complied with the Helsinki Declaration.
Demographic and Clinical Characteristics Assessment
Demographic characteristics, medical history, age, smoking status, alcohol use and physical activity of all of the participants were obtained via the baseline questionnaire. Blood sample collection, blood pressure monitoring and anthropometric measurements were evaluated by experienced medical professionals. The blood samples of the participants were collected in the early morning after at least 8 hours of fasting. Glycated hemoglobin (HbA1c), fasting blood glucose (GLU), TG, TC, HDL and LDL levels were measured. Average blood pressure was measured three times in a quiet environment to determine the participants’ systolic and diastolic blood pressure readings (SBP and DBP). Anthropometric measurements were conducted according to the International Society for the Advancement of Kinanthropometry (ISAK) protocol.17 Body mass index (BMI) was calculated according to the formula: BMI = weight/(height)2. According to the Chinese BMI classification standard recommended by the WHO, we classified BMI into three categories: lean (<18.5 kg/m2), normal (18.5–23.9 kg/m2), overweight and obese (≥24.0 kg/m2).18 The study outcome was defined as the first occurrence of T2DM during 2017–2020. T2DM was diagnosed according to the criteria of the World Health Organization (WHO).19
Dietary Assessment
Dietary intake was assessed via a Food Frequency Questionnaire (FFQ). Participants were evaluated for dietary intake at baseline. During the follow-up, they were asked whether their dietary habits had changed, and the unchanged subjects were enrolled. In the face-to-face interview, participants were asked about their intake of seven food groups in the past 12 months, including staple food, red meat, eggs, aquatic products, milk and dairy products, vegetables, legumes and soy products. Subsequently, the reported frequencies of consumption of each food (daily, weekly, monthly and annual) were converted to daily intake.
Cumulative Lipid Parameter Burden Assessment
The cumulative lipid parameter burden was calculated according to the following formula:20 cumulative burden = ([value 2017 + value 2018]/2-cutoff) + ([value 2018 + value 2019]/2-cutoff) + ([value 2019 + value 2020]/2-cutoff). The cutoff points for TC, TG, LDL and HDL were 5.2 mmol/L, 1.7 mmol/L, 2.6 mmol/L and 1.0 mmol/L, respectively.
Statistical Analysis
Numerical data are described as the mean and standard deviation or the median and lower and upper quartiles (M, [P25, P75]) and were compared between groups by using the Student’s t test or the Mann-Whitney U-test, as appropriate. Categorical variables are described as numbers and were tested via the chi-square test. A Cox proportional hazard model was used to estimate the effect of cumulative lipid burden on T2DM. Cumulative TG, cumulative LDL, cumulative HDL and cumulative TC burden were reported as continuous variables, and the classification variable was reported as a quartile in the Cox proportional hazard model. A multiple linear regression analysis was used to examine the relationship between dietary intake and cumulative lipid parameter burden. A mediating analysis of accelerated failure time (AFT)21 was used to investigate the mediating effects of certain foods, the cumulative lipid parameter burden and T2DM. The regression coefficients and 95% confidence intervals (CIs) of the direct effect, intermediary effect and total effect were calculated through 1000 bootstrap iterations, in order to test the significance of the mediation effect. Due to the fact that some of the covariant data are missing, we handled the missing values before the analysis (linear interpolation). When considering that the process may have an impact on the results, we complemented the sensitivity analysis. All of the statistical analyses were conducted by using IBM SPSS version 23.0 (IBM SPSS, Inc., Chicago, IL, USA), except for the mediation analysis. The provided P values are two-tailed, and P<0.05 was considered to be statistically significant. The mediation analysis was performed by using R software (R version 4.1.0) and the mediation effect was considered to be significant if the bootstrap confidence interval of the indirect effect did not include 0.
Results
Baseline Characteristics
A total of 4869 residents were enrolled at baseline from 2017 to 2019. After excluding unqualified subjects and subjects with incomplete data, the number of effective subjects at baseline was 4691. Among the 4691 participants, there were 378 previous T2DM patients, 389 newly detected T2DM patients and 3924 participants without diabetes. A total of 2009 residents without diabetes completed the follow-up, and the average follow-up time was 2.520±1.184 years (Figure 1). During this period, a total of 63 diabetes cases were identified, with an incidence density of 3.71 person-years.
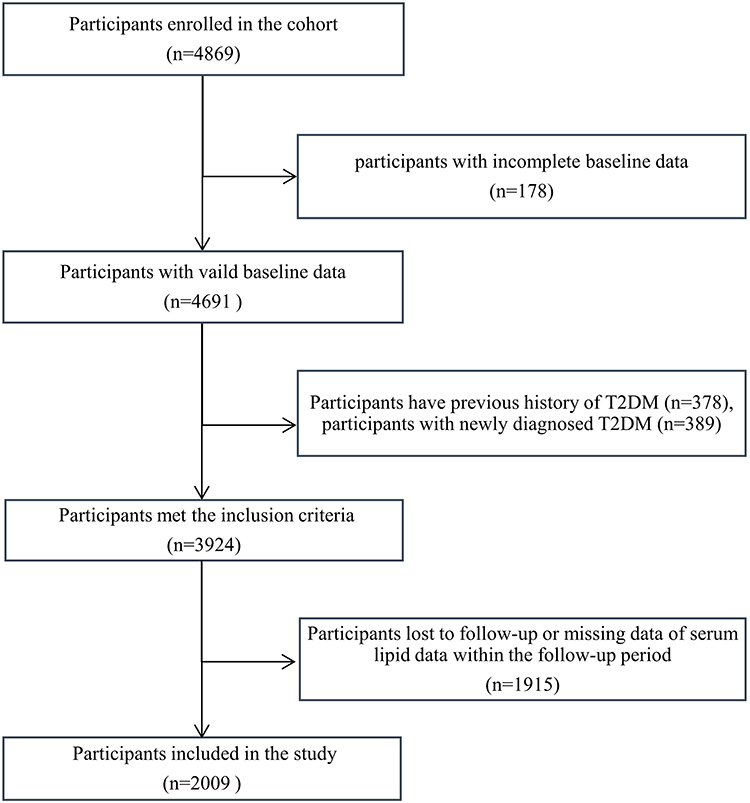 |
Figure 1 Flowchart of participants who were included in the study. A total of 4869 participants were recruited at baseline, of whom 178 had incomplete dietary data, 378 had a family history of T2DM and 389 were newly defined as having T2DM. A total of 1915 patients were lost during follow-up or had incomplete data. After excluding the abovementioned participants, a total of 2009 subjects were included in the study. Abbreviation: T2DM, type 2 diabetes. |
The sociodemographic characteristics of the participants are shown in Table 1. New-onset T2DM patients were older and had a higher BMI than participants without diabetes at baseline. Moreover, males, with a family history of diabetes had a higher incidence of diabetes. There were also differences in the incidence of diabetes among people with different marital statuses. Occupation, education level, current residence years, smoking status, passive smoking, drinking status, sedentary lifestyle, physical activity level and daily sleep time were not found to be statistically significant between the two groups.
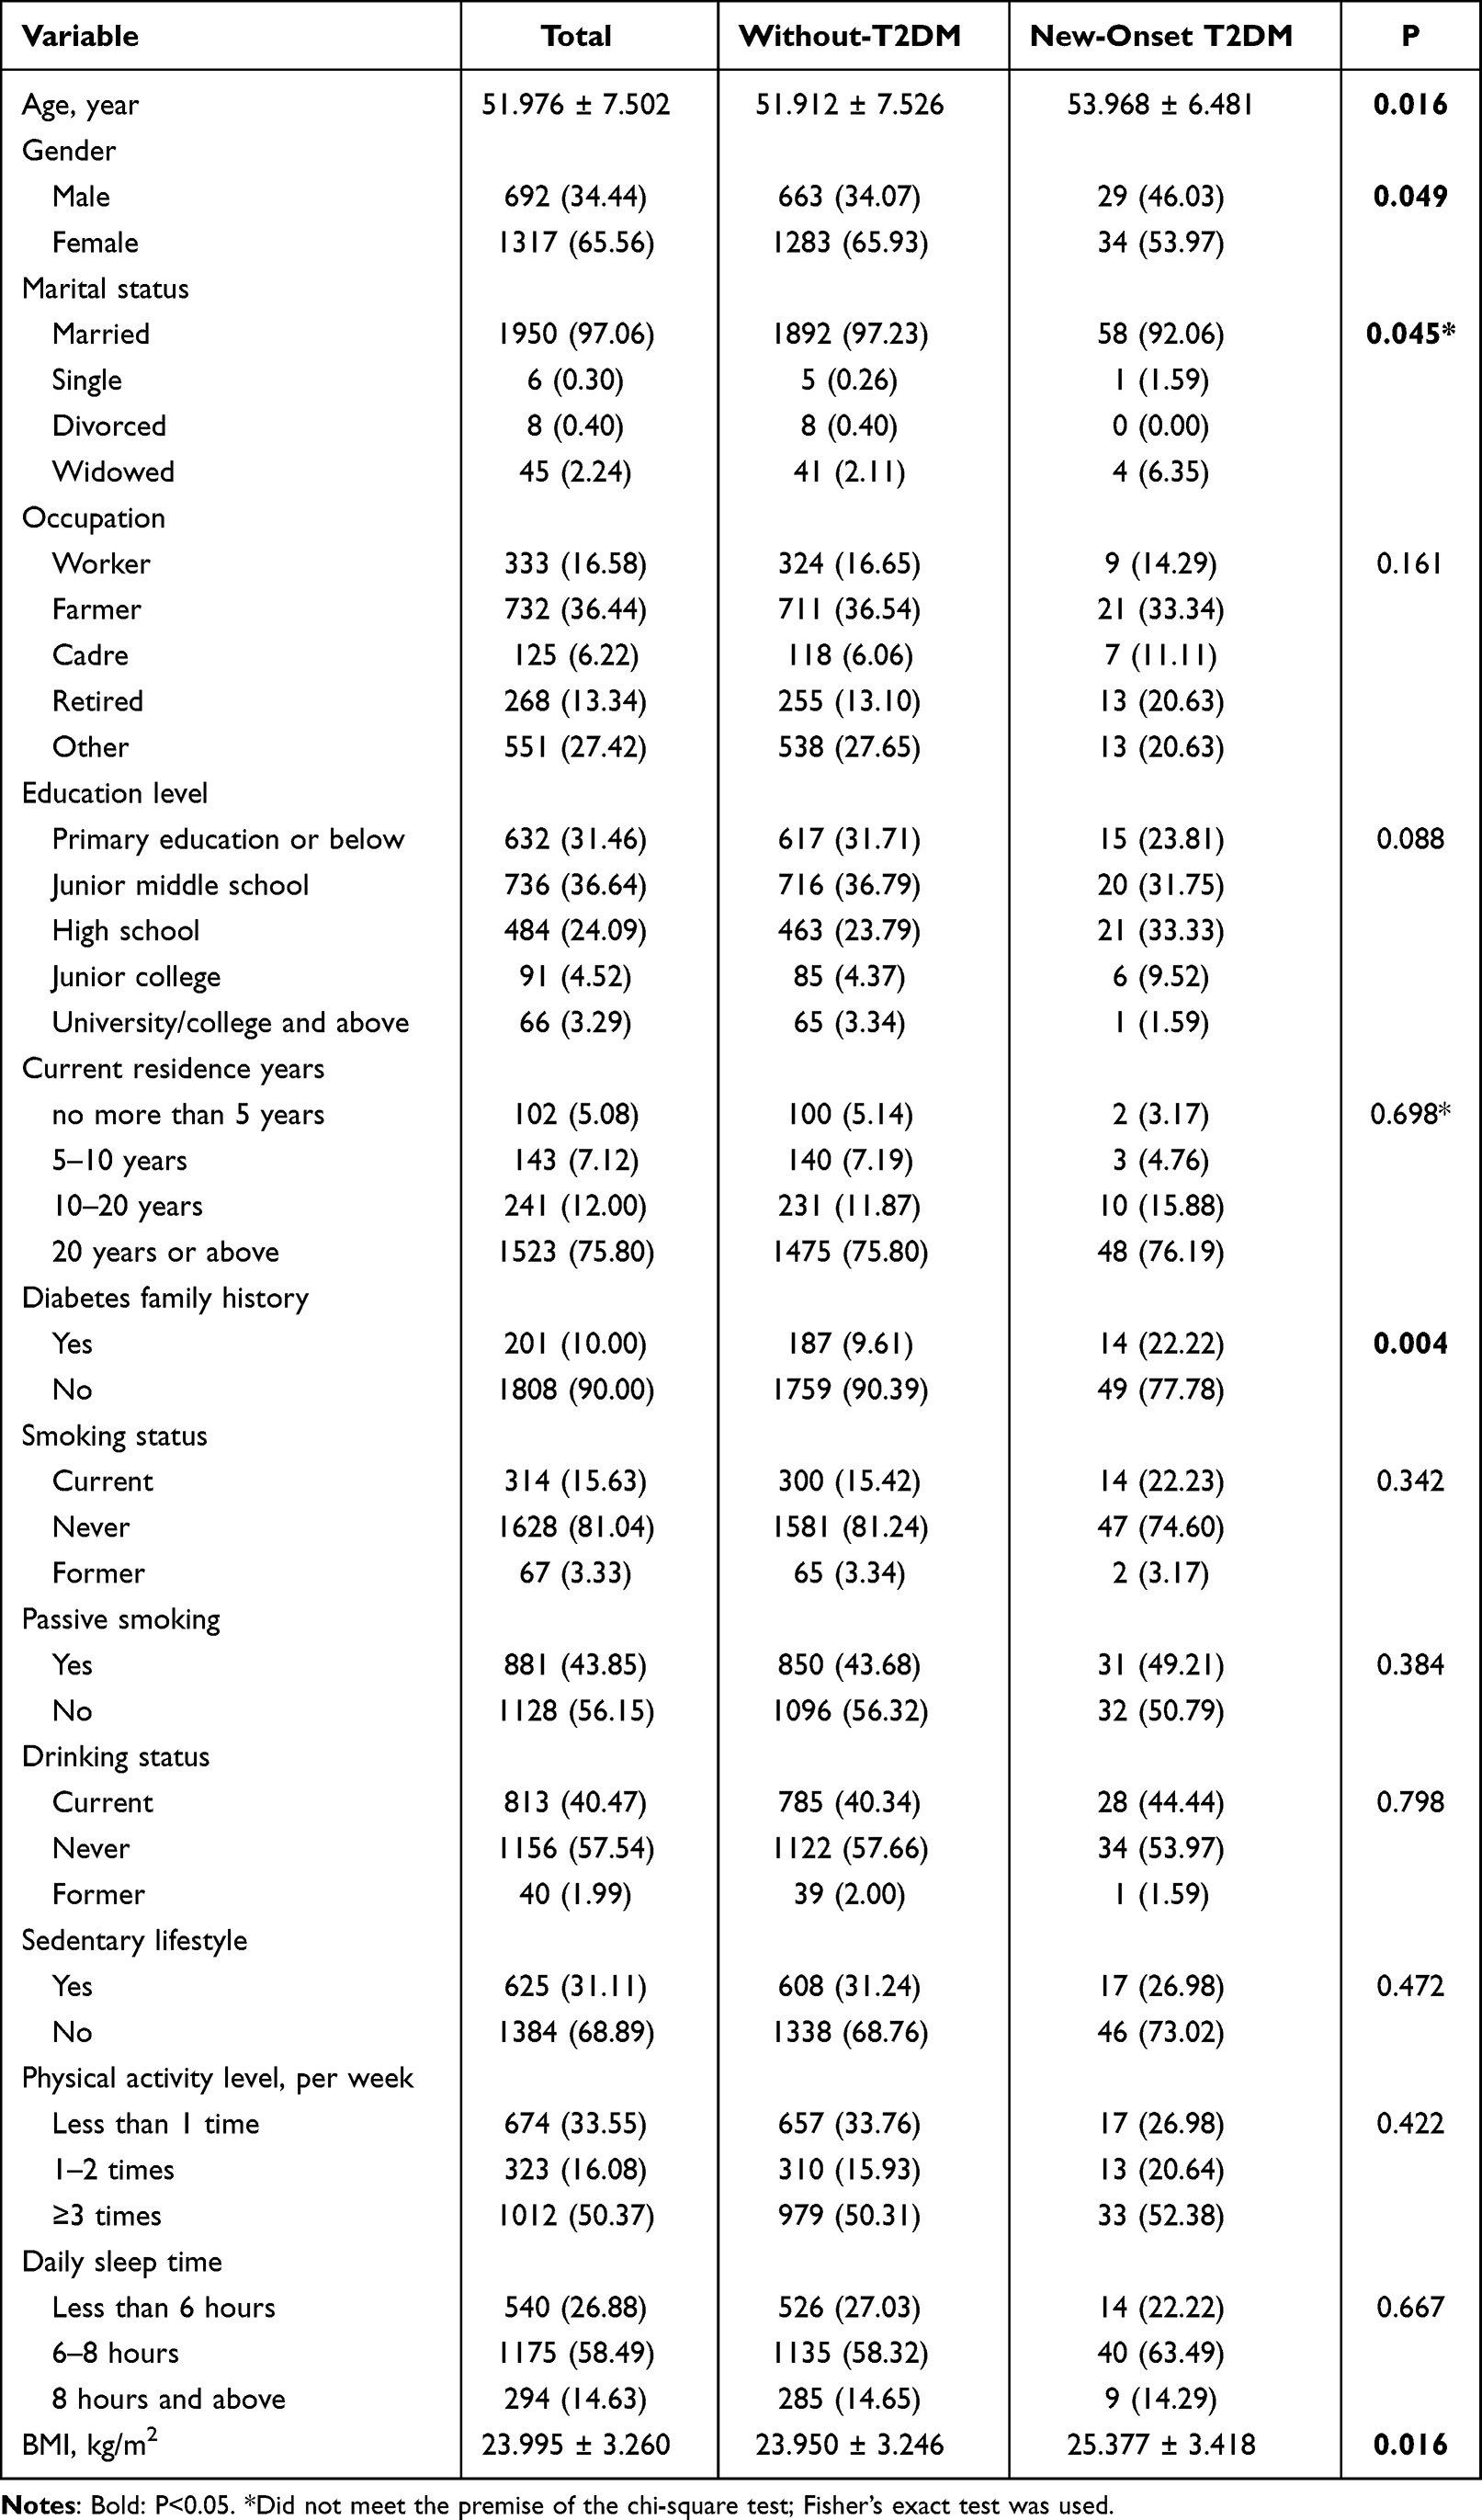 |
Table 1 Sociodemographic Factors of Baseline Participants |
The clinical characteristics of the participants are shown in Table 2. New-onset T2DM patients had higher GLU, HbA1c, SBP, DBP, BMI and TG levels than participants without diabetes at baseline, whereas HDL levels were lower. LDL and TC levels were not found to be statistically significant between the two groups.
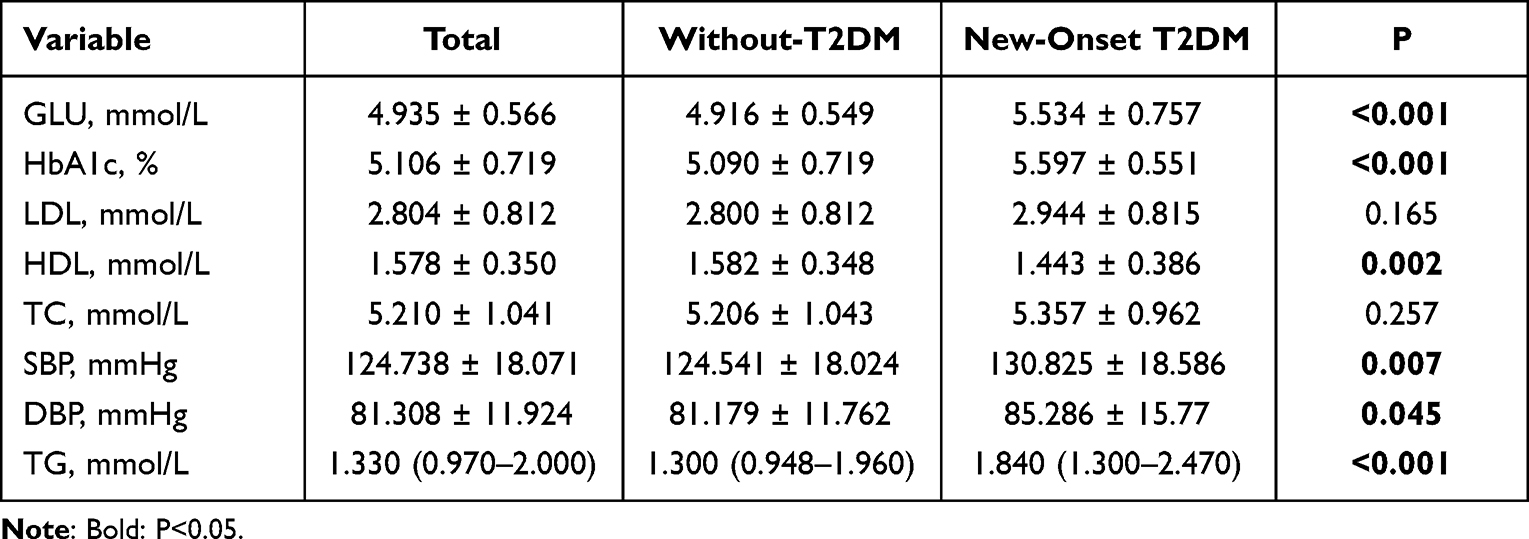 |
Table 2 Laboratory Parameters of Baseline Participants |
Dietary Intake of Participants
In the present study, the food intake per day for each food item is shown in Table 3. Due to the fact that the data of dietary intake did not follow a normal distribution, we expressed the data as the median (P25-P75), and the corresponding analysis between the two groups was performed with the Mann-Whitney U-test. The intake levels of refined grains, red meat and eggs in new-onset T2DM patients were higher than those in participants without diabetes. There was no significant difference in the intake levels of vegetables, milk and dairy products, legumes and soy products between the two groups (Table 3, Figure 2).
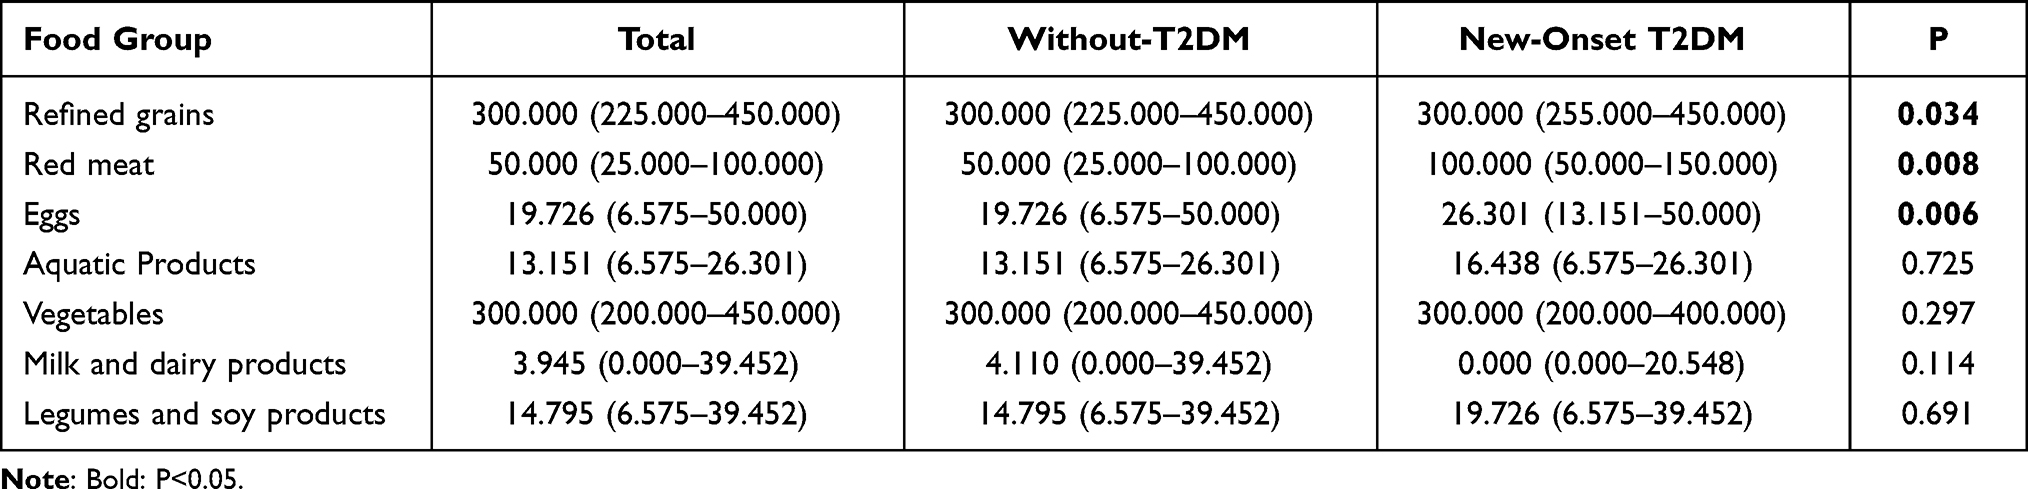 |
Table 3 Dietary Intake of Participants/Day (g) |
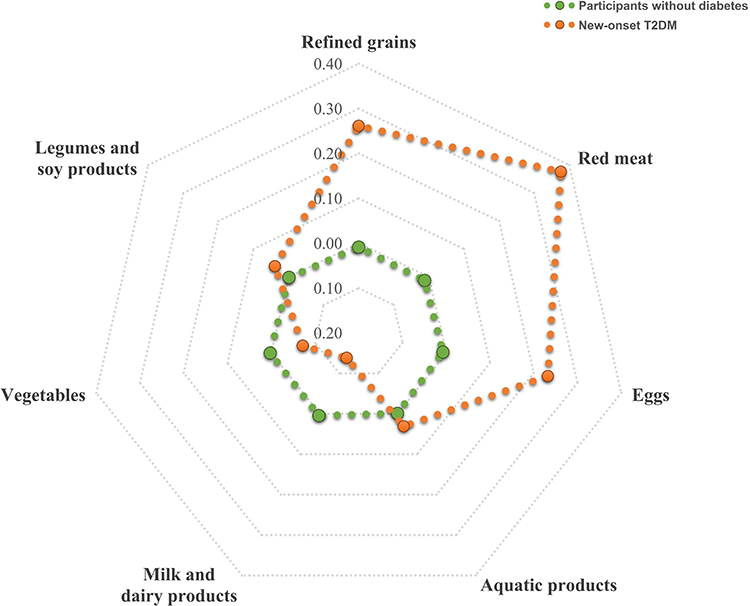 |
Figure 2 Z score radar plot of daily food intake between new-onset T2DM patients and participants without diabetes. The radar plot reflected the Z scores of the intake of 7 food groups between new-onset T2DM and participants without diabetes. The dots represent the Z score value for each food group in the new-onset T2DM (Orange dots) and without diabetes groups (green dots). Patients with new-onset T2DM had a higher intake of refined grains, red meat and eggs. Abbreviation: T2DM, type 2 diabetes. |
Effect of Cumulative Lipid Parameter Burden on the Incidence of T2DM
We analyzed the effect of cumulative lipid parameter burden on the incidence of T2DM during the follow-up period. Figures 3 and 4 show the correlation between the quartile changes in cumulative TG, cumulative LDL, cumulative HDL and cumulative TC burden and the risk of T2DM in the cohort. A higher cumulative TG load corresponded to a higher risk of T2DM onset (Ptrend=0.021). After adjusting for covariates, the highest quartile cumulative TG burden had a 2.235 times higher risk of T2DM than that in the lowest quartile (HR=3.462, 95% CI: 1.297–9.243). Additionally, a higher cumulative HDL load corresponded to a lower risk of T2DM onset (Ptrend =0.006). After adjusting for covariates, the risk of T2DM was 0.314-fold lower in the highest quartile of cumulative HDL burden than in the lowest quartile (HR=0.314, 95% CI: 0.1310–0.753). However, cumulative LDL and cumulative TC burden were not found to be associated with the incidence of T2DM in our study.
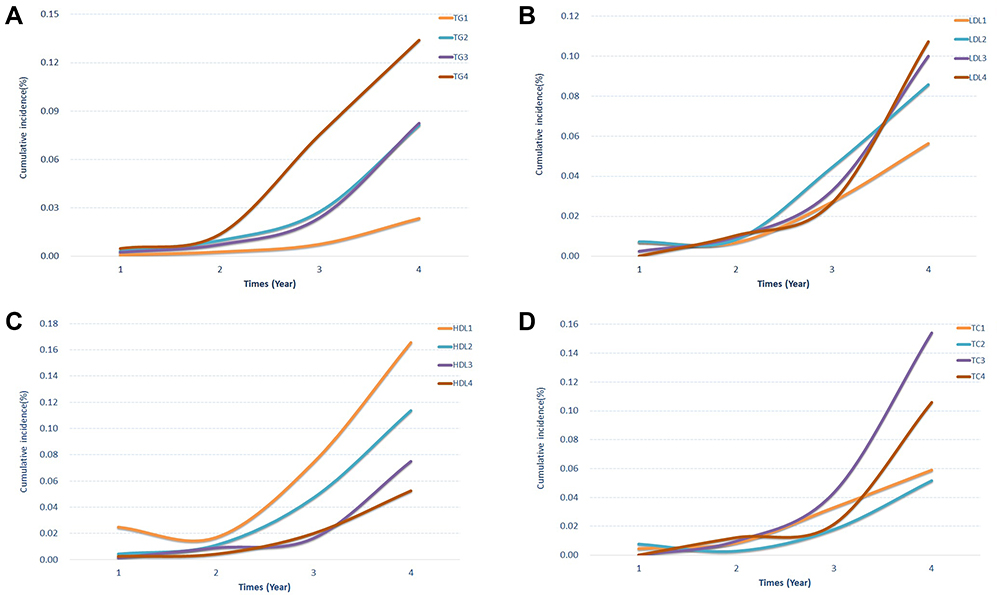 |
Figure 3 Incidence of T2DM with different quartile changes in cumulative lipid parameter burden. The four-line graph representing the incidence of T2DM with different quartile changes in cumulative TG (A), LDL (B), HDL (C) and TC (D) burden. Abbreviations: TG, triglyceride; LDL, low-density lipoprotein; HDL, high-density lipoprotein; TC, total cholesterol. |
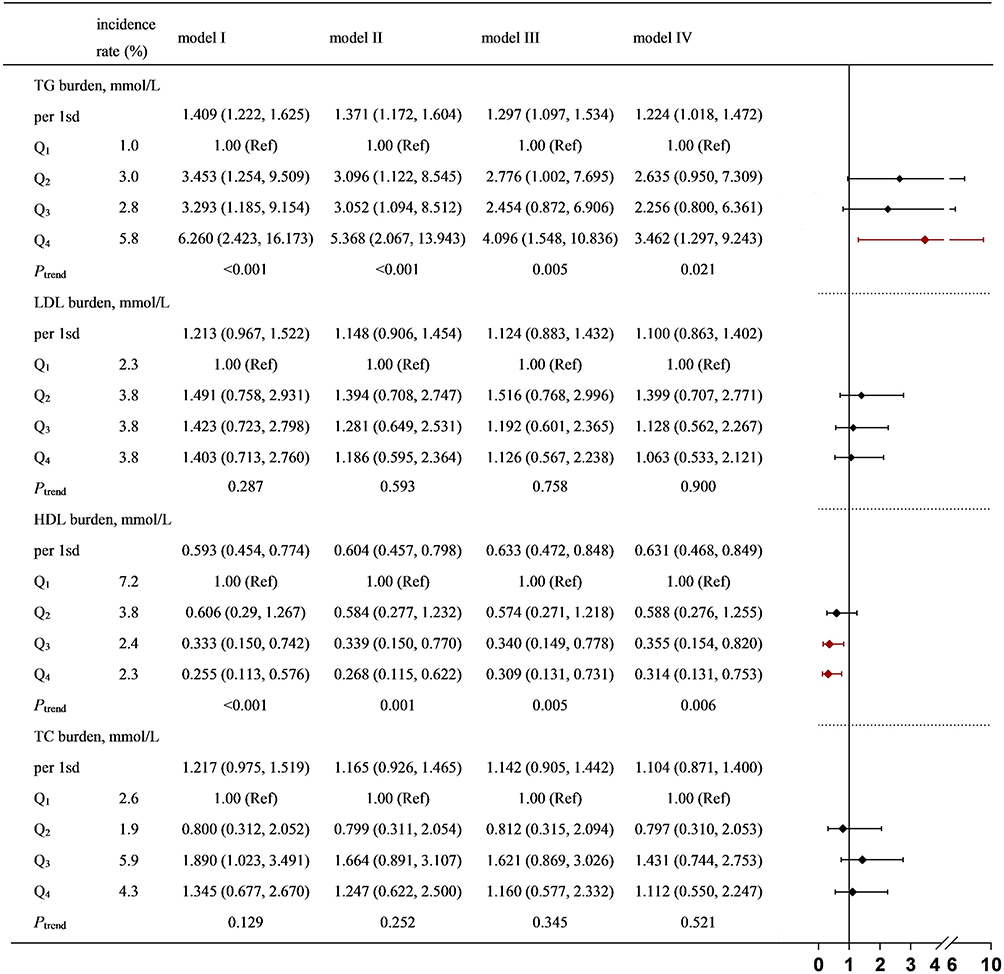 |
Figure 4 HRs (95% CI) and P values for T2DM and ascending quartiles of cumulative lipid parameter burden. Model I: unadjusted. Model II: adjusted for age, sex, marital status and family history of diabetes. Model III: adjusted for age, sex, marital status, family history of diabetes, cumulative SBP burden, cumulative DBP burden and cumulative BMI burden. Model IV: adjusted for age, sex, marital status, family history of diabetes, cumulative SBP burden, cumulative DBP burden, cumulative BMI burden, refined grains and red meat and egg intake. Abbreviations: TG, triglyceride; LDL, low-density lipoprotein; HDL, high-density lipoprotein; TC, total cholesterol; SBP, systolic blood pressure; DBP, diastolic blood pressure. |
Sensitivity Analysis
The results of the sensitivity analysis are presented in Figure 5. After removing data with missing values, we observed that TG significantly increased the risk of T2DM incidence, whereas HDL was observed to decrease the risk. This finding demonstrates that our results were robust.
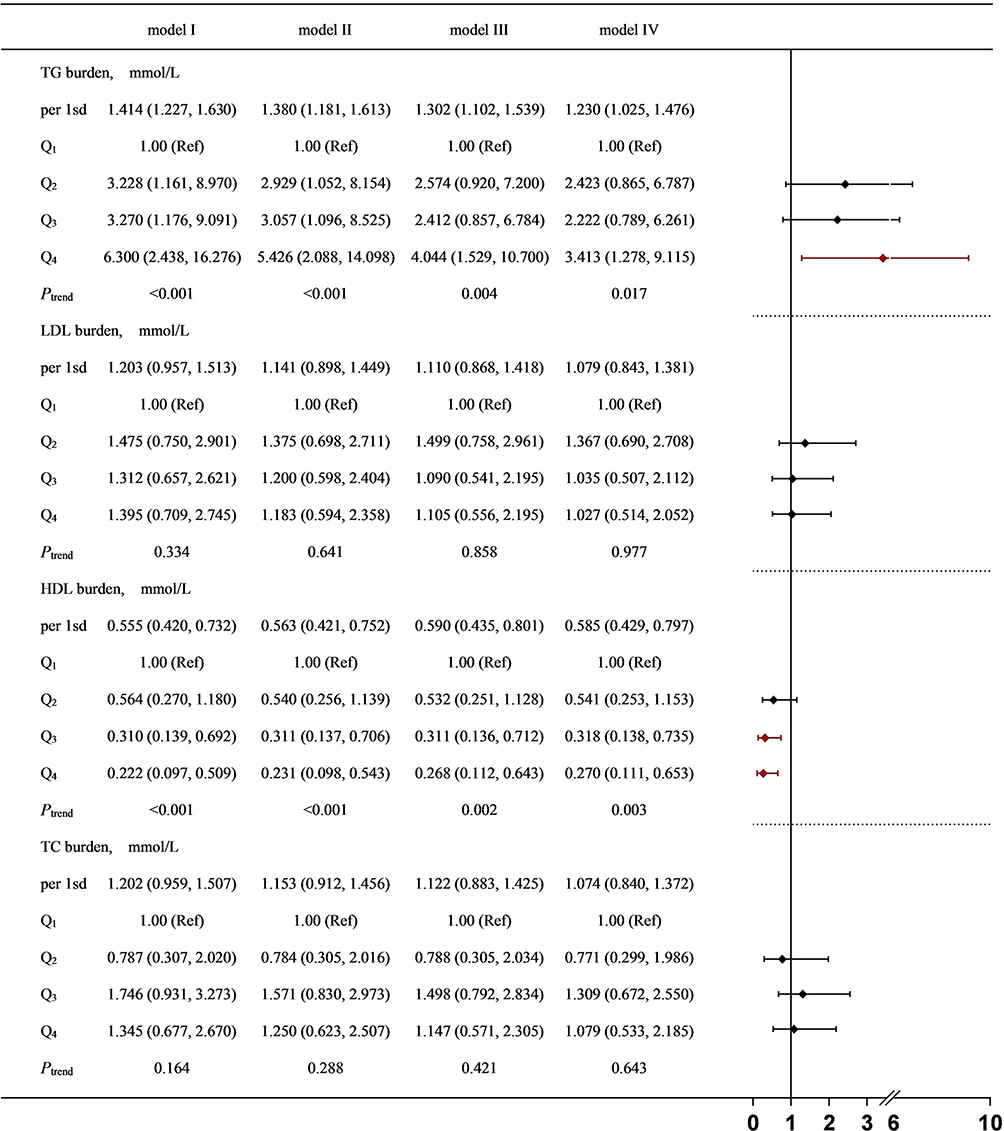 |
Figure 5 Sensitivity analysis for T2DM and cumulative lipid parameter burden. Model I: unadjusted. Model II: adjusted for age, sex, marital status and family history of diabetes. Model III: adjusted for age, sex, marital status, family history of diabetes, cumulative SBP burden, cumulative DBP burden and cumulative BMI burden. Model IV: adjusted for age, sex, marital status, family history of diabetes, cumulative SBP burden, cumulative DBP burden, cumulative BMI burden, refined grains and red meat and egg intake. Abbreviations: TG, triglyceride; LDL, low-density lipoprotein; HDL, high-density lipoprotein; TC, total cholesterol; SBP, systolic blood pressure; DBP, diastolic blood pressure. |
Mediating Analysis of Dietary, Cumulative Lipid Parameter Burden and T2DM
The results of the regression analysis between diet and cumulative lipid parameter burden are shown in Table 4. The regression coefficient and confidence intervals of red meat on cumulative TG and cumulative TC burden were greater than 0, indicating that red meat was positively correlated with cumulative TG and cumulative TC burden.
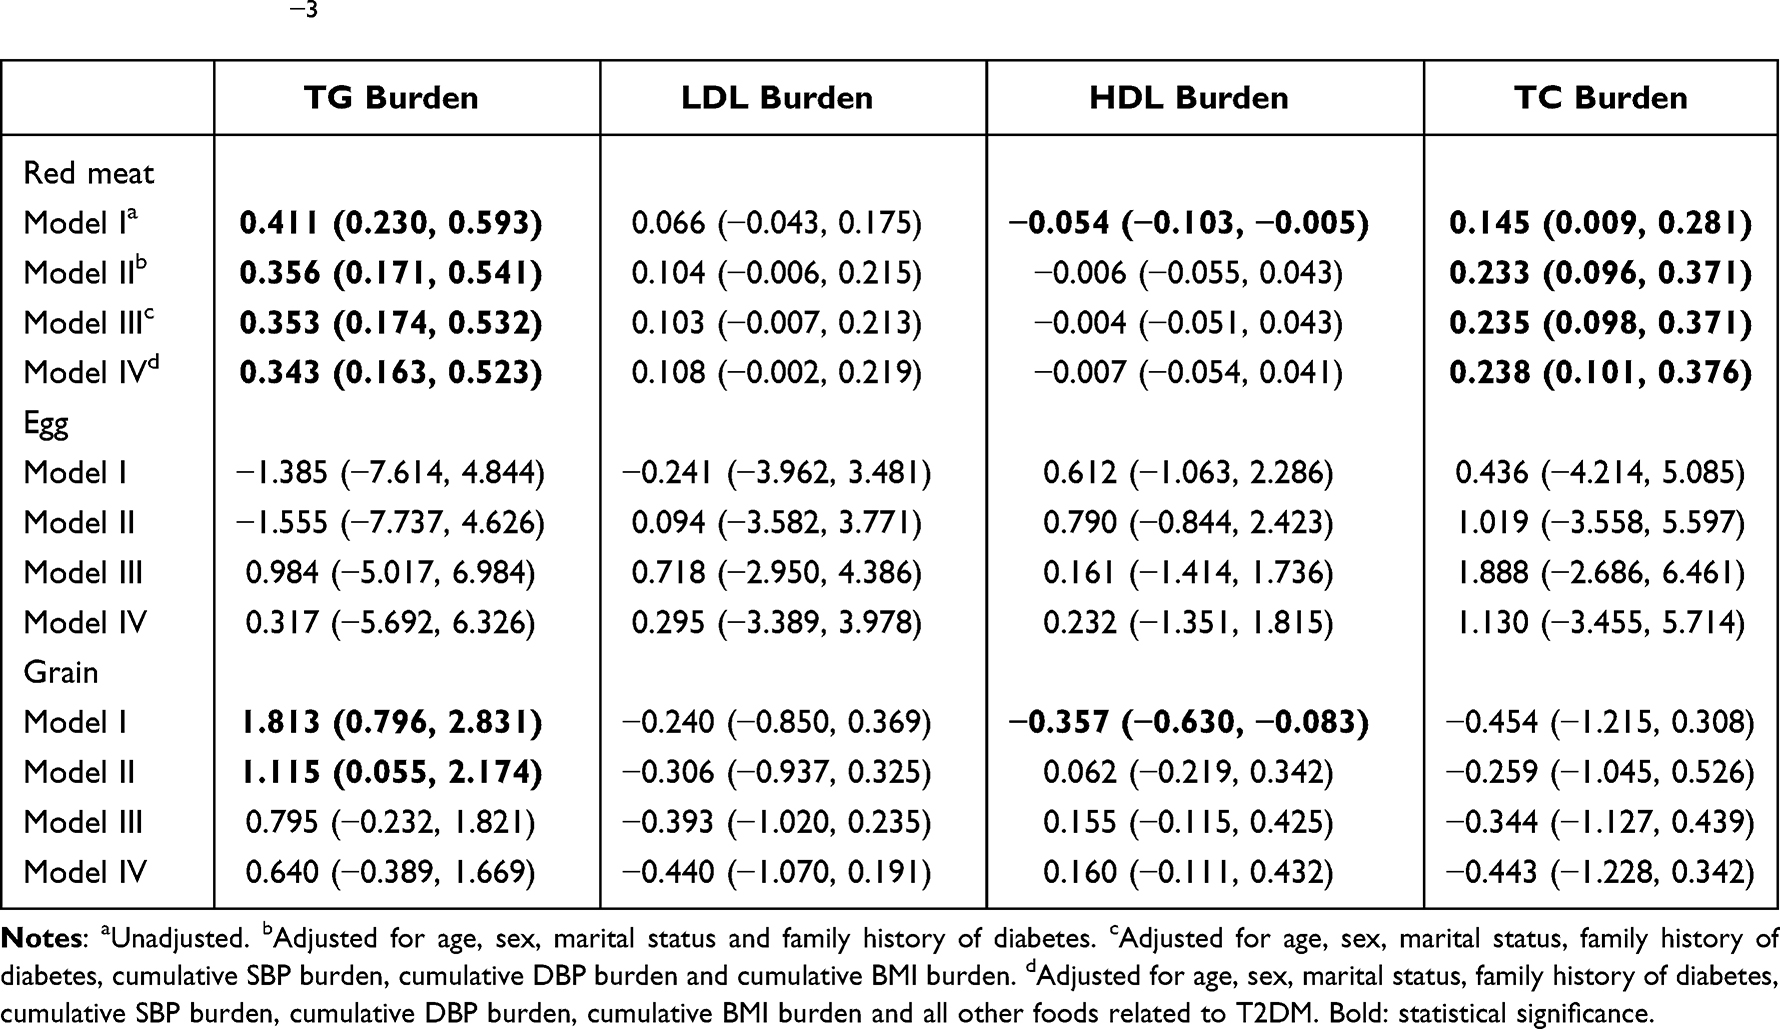 |
Table 4 The Relationship Between Food Related to the Onset of T2DM and Cumulative Lipid Parameter Burden β (95% CI for β) ×10−3 |
When combined with the results of Tables 3 and 4, Figure 4, we speculate that the high risk of T2DM caused by red meat may be mediated by cumulative TG. Therefore, we further explored whether cumulative TG burden plays a certain role in the pathogenesis of red meat affecting T2DM. The mediation analysis of red meat, cumulative TG burden and T2DM showed that the 95% CIs for the direct effect, intermediate effect and total effect did not include 0, thus suggesting that cumulative TG burden plays a partial mediating role in the pathogenesis of T2DM caused by red meat, which indicates that the intake of red meat is partly due to the change in cumulative TG burden leading to the occurrence of T2DM (Table 5).
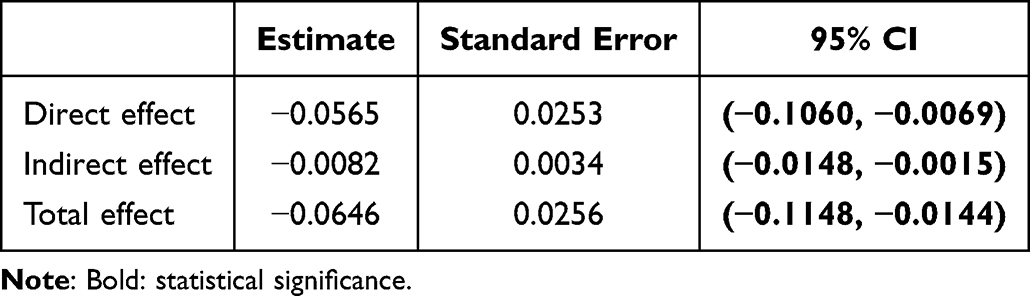 |
Table 5 Mediating Analysis of Dietary and Cumulative Lipid Parameter Burden and T2DM |
Discussion
The cumulative lipid parameter burden includes four indices: TC, TG, LDL and HDL. Our study observed several findings. 1) There is a correlation between the cumulative burden of TG and HDL and the onset of T2DM. Compared with those with a lower cumulative burden of TG, a higher cumulative burden of TG corresponded to a higher likelihood of developing T2DM. Compared with those with a lower cumulative burden of HDL, a higher cumulative burden of HDL corresponded to a lower risk of T2DM. However, cumulative LDL and cumulative TC burden were not found to be associated with the incidence of T2DM. 2) The intake of red meat was positively correlated with the cumulative TG burden and the incidence of T2DM. Cumulative TG burden partially mediated the association between red meat and T2DM. No association was found between cumulative HDL burden and diet.
Many studies have shown that there are differences in TG and HDL at baseline between T2DM patients and non-T2DM residents (including Tables 1 and 2 of our study).22,23 However, the lipid level at a single time point may not fully reflect the effect of blood lipids on T2DM. The cumulative burden that is calculated according to the long-term dynamic changes in blood lipids can better reflect the effects of blood lipids and is more convincing for exploring the relationship between blood lipids and diabetes. Therefore, in our study, we chose the 4-year cumulative lipid parameter burden to explore the association between lipid exposure and the onset of T2DM.
A large amount of research evidence shows that the interaction between dyslipidemia and diabetes is more complex. Dyslipidemia (mainly represented by high TG and low HDL) is not only a consequence of T2DM but is also a cause of glucose metabolism.24,25 During the cohort follow-up time period, we found that patients with new-onset T2DM had a higher cumulative TG burden and lower cumulative HDL burden than healthy participants (as shown in Table 4 and Figure 3). Due to the fact that changes in blood lipids reflect an immediate/rapid response to a changed environment, the cumulative lipid burden reflects cumulative long-term changes, and our results suggested that the blood lipid levels changed before the occurrence of T2DM. In the study by Bizzotto R et al,26 they found that the progression rates of TG and HDL were correlated with the progression of HbA1c, which may be due to the accumulation of excessive lipids through visceral fat, thus resulting in insulin resistance or excessive glucose production and subsequently resulting in the deterioration of HbA1c. This suggests that visceral fat may be involved in the progression of diabetes. Based on the abovementioned results and discussion, it is believed that the cumulative burden of lipids may act as a signal of diabetes.
The pathogenesis of T2DM caused by TG is not fully understood, but the increase in TG can lead to an increase in the level of free fatty acids. Excessive free fatty acids can disrupt or regulate the cascade of insulin receptors and glucose transporters, thus resulting in β-cell dysfunction and insulin resistance.27–31 Moreover, free fatty acids can damage the normal function of β-cells through inflammatory reactions, thus resulting in glucose metabolism disorders.24 HDL is a protective lipoprotein cholesterol. Recent studies have shown that HDL can not only prevent atherosclerotic vascular diseases but can also exert antidiabetic effects.30 The effects of HDL include anti-inflammation, antioxidation and antithrombosis.31–33 In addition, HDL may affect blood glucose homeostasis by promoting insulin secretion, enhancing insulin sensitivity and enhancing the muscle uptake of glucose.30 HDL contain hundreds of lipid species and proteins and exert many potentially antidiabetogenic activities on cells.34,35 Furthermore, hyperglycemia could be decreased or even reverted in several animal models by the transgenic overexpression or exogenous application of Apo lipoprotein A-I (apoA-I), which is the most abundant protein of HDL. Low plasma levels of HDL cholesterol are associated with increased risks of diabetes mellitus type 2 (T2DM).34,35 This result is consistent with the results of this research. When the concentration of TG increases, the lipoprotein rich in TG will increase the catabolism of HDL and lead to low HDL,36,37 thus affecting glucose metabolism and promoting the progression of T2DM.30
Our study found that red meat intake is associated with the onset of T2DM. The results of current studies on the association between red meat intake and diabetes are not consistent. Some cohort studies have found that eating large amounts of unprocessed and processed red meat increased the risk of type 2 diabetes.38–40 Conversely, the results of other random intervention trials have shown inconsistent evidence.41 However, recent studies have found that replacing red meat with other nonmeat protein foods can reduce the risk of T2DM,42,43 which subsequently demonstrates the role of red meat in T2DM. In the present study, we found that the median refined grain intake was the same between the two groups, but the average refined grain intake of T2DM patients was 346.27 g, which was higher than that of participants without diabetes (318.66 g). As the intake of refined grains in T2DM patients above the median intake was higher, the nonparametric test results suggested that there is a significant difference. However, due to the fact that the intake of various foods in Table 3 is expressed by the median (P25, P75), the gap between the two groups is not intuitive.
Our study also found that TG plays a partial mediating role in the increased risk of diabetes associated with red meat. Many studies have confirmed a positive association between red meat consumption and higher serum TG levels.44,45 Red meat is rich in saturated fatty acids and cholesterol. High-fat products and meat can enhance oxidative stress and inflammation, which can lead to excess lipoproteins in the liver and intestines, thus causing hypertriglyceridemia.46,47 In addition, some ingredients in red meat can also increase the risk of diabetes by directly triggering insulin resistance through inflammation.38,48,49 No association between red meat and HDL was found in our study. Based on the possible mechanism of decreased HDL, we speculated that the decrease in HDL levels in T2DM patients in this cohort may be mainly affected by the increase in TG.
Our study had some advantages. 1) Longitudinal studies can be used to determine causal correlations. The members of the cohort were relatively stable 2) With a fixed follow-up time, the fluctuation of seasonal factors to the results can be reduced. 3) We investigated the effect of long-term lipid changes on diabetes mellitus from the perspective of cumulative burden. 4) We associated our data to the possible dietary sources and used the method of mediation analysis to explore the role of lipid parameters in the effect of dietary intake on the incidence of diabetes, which can provide a reference for dietary interventions for reducing the risk of diabetes. As the research subjects originate from less economically developed regions, health awareness is not enough. With the results of this study, we can conduct interventions from behaviors or establish indicators that subjects can change (such as diet and blood lipids), thereby improving the level of health and quality of life.
There were still some limitations in our study. First, due to the fact that our study did not assess dietary intake on a yearly basis, this can potentially lead to some bias in the results. In a follow-up study, we will assess dietary intake on a yearly basis and discuss the function of food more comprehensively. Nevertheless, in our study, we chose experienced investigators to conduct dietary surveys to avoid possible bias as much as possible. Second, our study used a single and small-sized cohort. In the next stage, we will expand the number of participants and use multiple cohorts to verify the results. Third, the follow-up time was short. However, at present, the tracking results have revealed some clues related to T2DM, and we will continue to track the outcomes and explore potential risk factors in the future. Fourth, the pathogenesis of lipid parameters and T2DM remains to be explored. In a future study, we will seek to identify the epigenetic mechanism at the population and animal levels and conduct dietary interventions in the cohort to reduce the incidence of diabetes and to evaluate the effect of the interventions.
In conclusion, the increase in cumulative TG burden and decrease in cumulative HDL burden are related to the incidence of diabetes. In addition, cumulative TG burden was shown to play a partial mediating role in the pathogenesis of red meat and diabetes. Our results may provide evidence for reducing red meat intake and controlling lipid levels to prevent type 2 diabetes.
Acknowledgments
The authors would like to thank all study participants. This study was funded by the National Natural Science Foundation of China (81660566), and the Jiangxi Provincial Department of Education Project (GJJ180825).
Disclosure
The authors report no conflicts of interest in this work.
References
1. Murray CJ, Aravkin AY, Zheng P, et al. Global burden of 87 risk factors in 204 countries and territories, 1990–2019: a systematic analysis for the global burden of disease study 2019. Lancet. 2020;396(10258):1223–1249.
2. Vos T, Lim SS, Abbafati C, et al. Global burden of 369 diseases and injuries in 204 countries and territories, 1990–2019: a systematic analysis for the global burden of disease study 2019. Lancet. 2020;396(10258):1204–1222.
3. WHO. WHO global report on diabetes; 2016. Available from: https://www.who.int/diabetes/global-report/en/.
4. Ley S, Hamdy O, Mohan V, Hu F. Prevention and management of type 2 diabetes: dietary components and nutritional strategies. Lancet. 2014;383(9933):1999–2007. doi:10.1016/S0140-6736(14)60613-9
5. Wright A, Kontopantelis E, Emsley R, et al. Cardiovascular risk and risk factor management in type 2 diabetes mellitus. Circulation. 2019;139(24):2742–2753. doi:10.1161/CIRCULATIONAHA.118.039100
6. Skyler JS. Diabetes mellitus: pathogenesis and treatment strategies. Cheminform. 2010;35(42):4113–4117.
7. Berumen J, Orozco L, Betancourt-Cravioto M, et al. Influence of obesity, parental history of diabetes, and genes in type 2 diabetes: a case-control study. Sci Rep. 2019;9(1):2748. doi:10.1038/s41598-019-39145-x
8. Fernandez C, Surma M, Klose C, et al. Plasma lipidome and prediction of type 2 diabetes in the population-based malmö diet and cancer cohort. Diabetes Care. 2020;43(2):366–373. doi:10.2337/dc19-1199
9. Greenhill C. Dietary factors in the risk of T2DM. Nat Rev Endocrinol. 2020;16(10):537. doi:10.1038/s41574-020-0401-5
10. Zheng J, Sharp S, Imamura F, et al. Association of plasma biomarkers of fruit and vegetable intake with incident type 2 diabetes: EPIC-InterAct case-cohort study in eight European countries. BMJ. 2020;370:m2194. doi:10.1136/bmj.m2194
11. Hu Y, Ding M, Sampson L, et al. Intake of whole grain foods and risk of type 2 diabetes: results from three prospective cohort studies. BMJ. 2020;370:m2206. doi:10.1136/bmj.m2206
12. Du H, Guo Y, Bennett D, et al. Red meat, poultry and fish consumption and risk of diabetes: a 9 year prospective cohort study of the China Kadoorie Biobank. Diabetologia. 2020;63(4):767–779. doi:10.1007/s00125-020-05091-x
13. Sui G, Jia L, Song N, et al. Aberrant expression of HDL-bound microRNA induced by a high-fat diet in a pig model: implications in the pathogenesis of dyslipidaemia. BMC Cardiovasc Disord. 2021;21(1):280. doi:10.1186/s12872-021-02084-5
14. Griffin B. Relevance of liver fat to the impact of dietary extrinsic sugars on lipid metabolism. Proc Nutr Soc. 2015;74(3):208–214. doi:10.1017/S0029665115002050
15. Krittanawong C, Isath A, Hahn J, et al. Mushroom consumption and cardiovascular health: a systematic review. Am J Med. 2021;134(5):637–642.e632. doi:10.1016/j.amjmed.2020.10.035
16. Ma J, Zheng Y, Tang W, et al. Dietary polyphenols in lipid metabolism: a role of gut microbiome. Anim Nutr. 2020;6(4):404–409. doi:10.1016/j.aninu.2020.08.002
17. Norton K, Eston RG. Kinanthropometry and Exercise Physiology.
18. Consultation WHO Expert. Appropriate body-mass index for Asian populations and its implications for policy and intervention strategies. Lancet. 2004;363(9403):157–163.
19. Alberti K, Zimmet P. Definition, diagnosis and classification of diabetes mellitus and its complications. Part 1: diagnosis and classification of diabetes mellitus provisional report of a WHO consultation. Diabet Med. 1998;15(7):539–553. doi:10.1002/(SICI)1096-9136(199807)15:7<539::AID-DIA668>3.0.CO;2-S
20. Dai L, Xu J, Zhang Y, et al. Cumulative burden of lipid profiles predict future incidence of ischaemic stroke and residual risk. Stroke Vasc Neurol. 2021;6(4):581–588. doi:10.1136/svn-2020-000726
21. Fulcher I, Tchetgen Tchetgen E, Williams P. Mediation analysis for censored survival data under an accelerated failure time model. Epidemiol. 2017;28(5):660–666. doi:10.1097/EDE.0000000000000687
22. Qin H, Chen Z, Zhang Y, et al. Triglyceride to high-density lipoprotein cholesterol ratio is associated with incident diabetes in men: a retrospective study of Chinese individuals. J Diabetes Investig. 2020;11(1):192–198. doi:10.1111/jdi.13087
23. Miller M, Stone N, Ballantyne C, et al. Triglycerides and cardiovascular disease: a scientific statement from the American Heart Association. Circulation. 2011;123(20):2292–2333. doi:10.1161/CIR.0b013e3182160726
24. Parhofer K. Interaction between glucose and lipid metabolism: more than diabetic dyslipidemia. Diabetes Metab J. 2015;39(5):353–362. doi:10.4093/dmj.2015.39.5.353
25. Brunzell J, Hokanson J. Dyslipidemia of central obesity and insulin resistance. Diabetes Care. 1999;22(Suppl 3):C10–C13.
26. Bizzotto R, Jennison C, Jones AG, Kurbasic A, Mari A. Processes underlying glycemic deterioration in type 2 diabetes: an IMI DIRECT study. Diabet Care. 2021;44(2):511–518. doi:10.2337/dc20-1567
27. Briaud I, Harmon J, Kelpe C, Segu V, Poitout V. Lipotoxicity of the pancreatic beta-cell is associated with glucose-dependent esterification of fatty acids into neutral lipids. Diabetes. 2001;50(2):315–321. doi:10.2337/diabetes.50.2.315
28. Lee Y, Hirose H, Ohneda M, Johnson J, McGarry J, Unger R. Beta-cell lipotoxicity in the pathogenesis of non-insulin-dependent diabetes mellitus of obese rats: impairment in adipocyte-beta-cell relationships. Proc Natl Acad Sci USA. 1994;91(23):10878–10882. doi:10.1073/pnas.91.23.10878
29. Rachek L. Free fatty acids and skeletal muscle insulin resistance. Prog Mol Biol Transl Sci. 2014;121:267–292.
30. Drew B, Rye K, Duffy S, Barter P, Kingwell B. The emerging role of HDL in glucose metabolism. Nat Rev Endocrinol. 2012;8(4):237–245. doi:10.1038/nrendo.2011.235
31. Barter PJ, Nicholls S, Rye KA, Anantharamaiah GM, Fogelman AM. Antiinflammatory properties of HDL. Rev Endocr Metab Disord. 2004;5(8):351–358. doi:10.1023/B:REMD.0000045107.71895.b2
32. Calkin A, Drew B, Ono A, et al. Reconstituted high-density lipoprotein attenuates platelet function in individuals with type 2 diabetes mellitus by promoting cholesterol efflux. Circulation. 2009;120(21):2095–2104. doi:10.1161/CIRCULATIONAHA.109.870709
33. Li X, Su T, Xiao H, et al. Association of the HDL-c level with HsCRP, IL-6, U-NAG, RBP and Cys-C in type 2 diabetes mellitus, hypertension, and chronic kidney disease: an epidemiological survey. Diabetes Metab Syndr Obes. 2020;13:3645–3654. doi:10.2147/DMSO.S265735
34. Annema W, von Eckardstein A. High-density lipoproteins. Multifunctional but vulnerable protections from atherosclerosis. Circ J. 2013;77(10):2432–2448. doi:10.1253/circj.CJ-13-1025
35. von Eckardstein A, Widmann C. High-density lipoprotein, beta cells, and diabetes. Cardiovasc Res. 2014;103(3):384–394. doi:10.1093/cvr/cvu143
36. Guérin M, Le Goff W, Lassel T, Van Tol A, Steiner G, Chapman M. Atherogenic role of elevated CE transfer from HDL to VLDL(1) and dense LDL in type 2 diabetes: impact of the degree of triglyceridemia. Arterioscler Thromb Vasc Biol. 2001;21(2):282–288. doi:10.1161/01.ATV.21.2.282
37. Berneis K, Krauss R. Metabolic origins and clinical significance of LDL heterogeneity. J Lipid Res. 2002;43(9):1363–1379. doi:10.1194/jlr.R200004-JLR200
38. Bendinelli B, Palli D, Masala G, et al. Association between dietary meat consumption and incident type 2 diabetes: the EPIC-InterAct study. Diabetologia. 2013;56(1):47–59.
39. Wolk A. Potential health hazards of eating red meat. J Intern Med. 2017;281(2):106–122. doi:10.1111/joim.12543
40. Pan A, Sun Q, Bernstein A, Manson J, Willett W, Hu F. Changes in red meat consumption and subsequent risk of type 2 diabetes mellitus: three cohorts of US men and women. JAMA Intern Med. 2013;173(14):1328–1335. doi:10.1001/jamainternmed.2013.6633
41. O’Connor L, Kim J, Clark C, Zhu W, Campbell W. Effects of total red meat intake on glycemic control and inflammatory biomarkers: a meta-analysis of randomized controlled trials. Adv Nutr. 2021;12(1):115–127. doi:10.1093/advances/nmaa096
42. Ibsen D, Jakobsen M, Halkjær J, et al. Replacing red meat with other nonmeat food sources of protein is associated with a reduced risk of type 2 diabetes in a Danish cohort of middle-aged adults. J Nutr. 2021;151(5):1241–1248. doi:10.1093/jn/nxaa448
43. Würtz A, Jakobsen M, Bertoia M, et al. Replacing the consumption of red meat with other major dietary protein sources and risk of type 2 diabetes mellitus: a prospective cohort study. Am J Clin Nutr. 2021;113(3):612–621. doi:10.1093/ajcn/nqaa284
44. Cocate P, Natali A, de Oliveira A, et al. Red but not white meat consumption is associated with metabolic syndrome, insulin resistance and lipid peroxidation in Brazilian middle-aged men. Eur J Prev Cardiol. 2015;22(2):223–230. doi:10.1177/2047487313507684
45. Peng H, Xie X, Pan X, et al. Association of meat consumption with NAFLD risk and liver-related biochemical indexes in older Chinese: a cross-sectional study. BMC Gastroenterol. 2021;21(1):221. doi:10.1186/s12876-021-01688-7
46. Ferramosca A, Zara V. Modulation of hepatic steatosis by dietary fatty acids. World J Gastroenterol. 2014;20(7):1746–1755. doi:10.3748/wjg.v20.i7.1746
47. Adiels M, Olofsson S, Taskinen M, Borén J. Overproduction of very low-density lipoproteins is the hallmark of the dyslipidemia in the metabolic syndrome. Arterioscler Thromb Vasc Biol. 2008;28(7):1225–1236. doi:10.1161/ATVBAHA.107.160192
48. Rocha D, Caldas A, Oliveira L, Bressan J, Hermsdorff H. Saturated fatty acids trigger TLR4-mediated inflammatory response. Atherosclerosis. 2016;244:211–215. doi:10.1016/j.atherosclerosis.2015.11.015
49. Thanopoulou AC, Karamanos BG, Angelico FV, et al. Dietary fat intake as risk factor for the development of diabetes: multinational, multicenter study of the Mediterranean Group for the Study of Diabetes (MGSD). Diabetes Care. 2003;26(2):302–307. doi:10.2337/diacare.26.2.302
 © 2022 The Author(s). This work is published and licensed by Dove Medical Press Limited. The
full terms of this license are available at https://www.dovepress.com/terms
and incorporate the Creative Commons Attribution
- Non Commercial (unported, 3.0) License.
By accessing the work you hereby accept the Terms. Non-commercial uses of the work are permitted
without any further permission from Dove Medical Press Limited, provided the work is properly
attributed. For permission for commercial use of this work, please see paragraphs 4.2 and 5 of our Terms.
© 2022 The Author(s). This work is published and licensed by Dove Medical Press Limited. The
full terms of this license are available at https://www.dovepress.com/terms
and incorporate the Creative Commons Attribution
- Non Commercial (unported, 3.0) License.
By accessing the work you hereby accept the Terms. Non-commercial uses of the work are permitted
without any further permission from Dove Medical Press Limited, provided the work is properly
attributed. For permission for commercial use of this work, please see paragraphs 4.2 and 5 of our Terms.