Back to Journals » Cancer Management and Research » Volume 11
The relevance between the immune response-related gene module and clinical traits in head and neck squamous cell carcinoma
Received 13 January 2019
Accepted for publication 17 July 2019
Published 6 August 2019 Volume 2019:11 Pages 7455—7472
DOI https://doi.org/10.2147/CMAR.S201177
Checked for plagiarism Yes
Review by Single anonymous peer review
Peer reviewer comments 2
Editor who approved publication: Dr Sanjeev K. Srivastava
Yidan Song,* Yihua Pan,* Jun Liu
State Key Laboratory of Oral Diseases, National Clinical Research Center for Oral Diseases, Department of Orthodontics, West China Hospital of Stomatology, Sichuan University, Chengdu, 610041, People’s Republic of China
*These authors contributed equally to this work
Purpose: Head and neck squamous cell carcinoma (HNSCC) is the sixth most prevalent cancer in the world, accounting for more than 90% of head and neck malignant tumors. However, its molecular mechanism is largely unknown. To help elucidate the potential mechanism of HNSCC tumorigenesis, we investigated the gene interaction patterns associated with tumorigenesis.
Methods: Weighted gene co-expression network analysis (WGCNA) can help us to predict the intrinsic relationship or correlation between gene expression. Additionally, we further explored the combination of clinical information and module construction.
Results: Sixteen modules were constructed, among which the key module most closely associated with clinical information was identified. By analyzing the genes in this module, we found that the latter may be related to the immune response, inflammatory response and formation of the tumor microenvironment. Sixteen hub genes were identified—ARHGAP9, SASH3, CORO1A, ITGAL, PPP1R16B, TBC1D10C, IL10RA, ITK, AKNA, PRKCB, TRAF3IP3, GIMAP4, CCR7, P2RY8, GIMAP7, and SP140. We further validated these genes at the transcriptional and translation levels.
Conclusion: The innovative use of a weighted network to analyze HNSCC samples provides new insights into the molecular mechanism and prognosis of HNSCC. Additionally, the hub genes we identified can be used as biomarkers and therapeutic targets of HNSCC, laying the foundation for the accurate diagnosis and treatment of HNSCC in clinical and research in the future.
Keywords: head and neck squamous cell carcinoma, wgcna, co-expression, gene module, hub gene, immune response-related genes
Introduction
Head and neck squamous cell carcinoma (HNSCC) is a common malignant cancer type that originates from squamous cells of the upper respiratory tract1 (eg, the oral cavity, pharynx, and larynx) and upper gastrointestinal tract. HNSCC is the sixth most prevalent cancer in the world,2 accounting for more than 90% of head and neck malignancies. As a heterogeneous disease, HNSCC has different prognoses due to its diverse anatomical locations, disease progression and etiology.3 Smoking, drinking and infection with human papillomavirus (HPV) are all risk factors for the occurrence and development of HNSCC.4,5 Despite surgery, radiotherapy and chemotherapy, approximately half of the patients die from this disease,6 explaining why exploring the molecular mechanism of its tumorigenesis and finding new targets for drug therapy are needed. In recent years, research on the molecular mechanism of HNSCC is in progress, and the discovery of important pathway alterations, such as Notch,7 Ras,8 and VEGF signaling,9 has led to the emergence of some related targeted drugs that are expected to improve the survival and prognosis of HNSCC patients.10 Therefore, it is important to study the molecular mechanism of HNSCC for early diagnosis and optimal treatment. Exploring the molecular mechanism underlying HNSCC invasion and metastasis is of great significance in addressing the issue of identifying new drug targets for future therapy.
From chip technology to high-throughput sequencing technology, biological data have increased exponentially due to the development of biological detection methods.11 An integrated organism is a complex network comprising many genes, RNA and proteins. In the occurrence of various diseases, especially cancer, there are many interactions among these components. Traditional methods are not suitable to this complex interaction network. Therefore, the biological network analysis method based on high-throughput data arises at the historic moment.12 The signaling pathway network, protein interaction network, metabolic network, gene regulation network and gene co-expression network are common biological networks.13 The most representative gene co-expression network is weighted gene co-expression network analysis (WGCNA).14 The aim of this method is to identify synergistic expression gene modules and explore the relationship between gene networks and phenotypes, as well as between hub genes in the network.15 WGCNA emphasizes the change of modules rather than individual genes, greatly alleviating the problem of multiple comparisons.16 Additionally, it links phenotypes with gene expression, which is propitious for further exploration. WGCNA has provided significant results in the gene analysis of many species, such as humans and mice,17 and has become a widely used network analysis tool.
In order to identify mechanistically informative features of HNSCC, in this study, weighted gene co-expression network analysis was used to analyze the gene expression profiles of 270 HNSCC samples from the GSE65858 dataset. Several modules have been obtained that were combined with clinical information of patients to determine the biological significance by further analysis. We identified a significant correlation between the genes in the turquoise module and some clinical traits, leading us to further excavate the genes in this module. Finally, we validate these hub genes in The Cancer Genome Atlas (TCGA) dataset to confirm that these genes do have biological significance in the tumorigenesis of HNSCC. Our study lays the foundation for searching potential biomarkers to treat HNSCC and further experimental verification.
Materials and methods
Data information
The HNSCC tissue samples used in this study were all from the GSE65858 dataset of NCBI Gene Expression Omnibus (https://www.ncbi.nlm.nih.gov/). Two hundred seventy samples were obtained from HNSCC patients. The gene expression data were obtained using the GPL10558 Illumina HumanHT-12 V4.0 expression beadchip sequencing platform. The corresponding clinical information (including age, sex, smoking, alcohol consumption, tumor location, tumor grade, tumor stage, metastasis, and HPV16 infection) was also obtained from the GSE65858 dataset.
Because some data were missing, the use of WGCNA for subsequent analysis required the integrity of the gene expression data. Thus, the missing data needed to be processed to ensure subsequent analysis. The advantage of deleting missing data rows or columns as a processing method is that no errors are introduced. First, we manually removed 20 samples of patients with clinical information deficiency and retained 250 samples with complete information for further follow-up analysis. Eighty-four (33.6%) of the tumors occurred in the oropharynx, 82 (32.8%) occurred in the cavum oris, 48 (19.2%) occurred in the larynx, 32 (12.8%) occurred in the hypopharynx and 4 contained missing information. In 196 samples, the expression of HPV 16 DNA was negative, 19 samples were HPV 16 dna+rna-, and 35 samples were HPV 16 dna+rna+. Number assignment of samples’ clinical traits can be seen in Table S1.
Network module analysis is vulnerable to the influence of outlier samples; thus, removing outlier samples before constructing the network is particularly important to obtain meaningful subsequent analysis results. The goodGeneSample function in WGCNA was used to remove genes and samples with excessive missing values, and then the outlier samples were removed by the method of sample hierarchical clustering-pruning graph. The specific methods were as follows: 1) building a hierarchical clustering tree for all samples and drawing and 2) removing outliers whose leaf node height was significantly higher than other samples.
Co-expression network construction
We used the Affy package (using version 3.5.1 R software) to preprocess and standardize matrix files (RMA standardization). RMA is used to correct background, and impute is used to supplement missing values. According to the order of standard deviation (SD) from large to small, we selected the first five thousand genes to construct WGCNA,18 which not only reduces the size of the whole network and computational load but also maintains a scale-free topological network. WGCNA realizes network construction in the form of a “soft threshold”. The essence of the soft threshold method is to transform the correlation coefficients of similar matrices to adjacent functions in the form of function transformation and then calculate the topological overlap matrix. Next, we used pickSoftThreshold to select the appropriate soft threshold. The scale-free topology fit index, as well as the mean connectivity, serves as a function of the soft-thresholding power. By calculating the scale-free topology fit index and mean connectivity for several powers, we can choose an appropriate soft-thresholding power to build network. WGCNA uses dissimilarity to cluster. The specific algorithm used is the topological overlap dissimilarity measure (TOM)19 to calculate the degree of association between genes. Using hierarchical clustering function, the genes with a similar expression spectrum are classified into TOM-based modules. We used these 5,000 genes to visualize gene networks. Gray refers to the background gene without any module. Different modules are built from dendrograms.
Module preservation across the network
Two hundred forty-five samples clustered after removing outliers were divided into the training and validation sets using the createDataPartition function in R. The advantage of createDataPartition is that it can randomly extract the training set we need from the low-entropy dataset. We calculate the preservation of different modules by calculating the Z value, Z=observed−meanpermuted/sdpermuted. This is a permutation test. It repeatedly permutes the gene labels in the test network to estimate the mean and standard deviation under the hypothesis of null preservation. If Z is greater than 10, the module indicates strong preservation; if Z is less than 10 and greater than 2, the module is weakly preserved; if less than 2, the module is not preserved. Statistical significance is evaluated by bootstrapping (N=200 permutations).20
Identification of clinically significant modules
In the analysis, we combined modules with a various nontime dependent variables. First, we calculate the eigengene (module Eigengenes, ME) of the module, which is defined as the first principal component of all gene expression level vectors in the module. Next, for an optional gene, we defined its gene significance (GS) as the correlation coefficient between its expression level and dependent variable level. Continuous dependent variables are calculated by the Pearson correlation coefficient. For a module, the modular significances (MSs) relative to a dependent variable are defined as the correlation coefficients between its characteristic genes and level of dependent variables. The module membership (MM) of any gene in a module is defined as the correlation coefficient between the gene and characteristic gene of the module. It measures the degree of subordination of a gene in the module that can be used to screen the important genes in the module. In the module analysis, if a module and a dependent variable have a high-significance MS, the gene in the module may be an important factor affecting the dependent variable Y. Under this condition, it is necessary to carry out in-module analysis to screen the important genes in the module. The specific methods are as follows: For gene i in the module, a scatter plot of the module membership degree (MM) relative to the gene significance (GS) is made, and the genes with high MM and GS are selected as the objects for further analysis.
Function enrichment analysis
In the postgenomic era, knowledge about gene functional pathways is increasing daily. Kyoto University and Tokyo University jointly developed the Kyoto Encyclopedia of Genes and Genomes (KEGG) database, which integrates a large amount of knowledge about gene, protein, biological pathways and other interactive networks to facilitate the use of gene information.21 The Gene Ontology (GO) database is a platform for standardized description or interpretation of the terminology of gene and gene product characteristics. It is a platform for bioinformatics researchers to unify the induction, processing,interpretation and sharing of gene and gene product data.22 In this study, “clusterProfiler”23 and “org.Hs.eg.db” packages in R software were used to analyze GO and KEGG, annotate the genes of interest in the modules, and try to identify the enrichment pathway of the genes in the modules. We set p-valueCutoff =0.01 and qvalueCutoff =0.05.
Identification of hub genes in the key module
We believe that genes that are highly interconnected with other nodes in the module are functionally important. In this study, key modules were selected and visualized by cytoscape, and hub genes in key module networks were screened according to degree. First, we selected the weight value of more than 0.3 by weight ranking, and then identified the top 30 genes by degree. We believe that these genes are highly interconnected with other genes and have biological significance.
Validation and exploration of hub genes
TCGA is a joint project initiated by NCI and NHGRI in the United States that provides a complete atlas related to all changes in the cancer genome. CBioPortal (http://www.cbioportal.org/) acts as a web page for cancer genome research that can be used to browse, visualize and analyze multidimensional cancer genome data. It provides graphical information aggregation, network analysis and survival analysis at the gene level on multiple platforms. GEPIA(http://GEPIA.cancer-pku.cn/) is a web server to analyze the RNA sequencing expression data of 9,736 tumors and 8,587 normal samples from the TCGA and The Genotype-Tissue Expression (GTEx) projects using a standard processing pipeline. GEPIA was used to analyze the survival rate of 30 candidate genes. According to similar literatures,24,25 the genes with logrank p-value less than 0.05 were identified as real hub genes. Those genes can affect prognosis. Next, we used GEPIA to check the differences in the expression of hub genes between normal and tumor tissues. In this study, we used CBioPortal to verify the related genetic changes in the hub genes identified in HNSCC samples in the TCGA database and explore the correlation between the hub genes and other genes and drugs. We hope to uncover relevant drug targets and provide direction for further research.
Results
Expression value analysis of microarray data
We downloaded the gene expression matrix files of 270 HNSCC samples from GSE65858 (https://www.ncbi.nlm.nih.gov/) and manually deleted 20 samples for which clinical information is missing. Finally, 250 samples were retained to carry out in subsequent analysis. The background was corrected, and the data were normalized by R software. The visualization results of normalization are shown in Figure S1. Gene annotations were carried out using R package, and probes corresponding to multiple genes were removed. The average value of genes corresponding to multiple probes was taken as the expression level of the gene. After obtaining the genes, we selected the first 5,000 genes in SD descending order to construct a co-expression network. We used the hclust function of the WGCNA packages to cluster 250 samples. As shown in Figure 1A, we can see the sample clustering tree. The samples are divided into two clusters. We chose 60 as the cutoff value; after 5 outliers were removed, 245 samples were retained for subsequent WGCNA analysis. Next, we reclustered the 245 samples and corresponded them with clinical traits to obtain the sample tree and characteristic heat map (Figure 1B).
 |
Figure 1 Construction of the co-expression network using the WGCNA package in R. Notes: (A) Sample clustering to detect outliers. Five outliers were removed after clustering—GSM1607776, GSM1607734, GSM1607907, GSM1607816 and GSM1607849. cutHeight =60. (B) Recluster samples and clinical traits dendogram. The color intensity was proportional to the gender, age, packyears, alcohol consumption, tumor type, tumor site, u1cc stage, t category, n category, distant metastasis and HPV16 infection. Abbreviations: WGCNA, weighted gene co-expression network analysis; HPV, human papillomavirus. |
Construction of the weighted co-expression network and preservation
To determine the optimal value of the soft threshold, it is necessary to search the power value that can make the adjacent function suit the scale-free condition in a certain range. As shown in Figure 2A and B, we chose 4 as the power value when the Scale-free topology fit index nearly equals to 0.9 and the mean connectivity is also close to 0. We constructed the co-expression matrix using the expression matrix and the estimated optimal power value. The connectivity between genes was calculated, and similarity between genes was calculated accordingly. Next, the coefficient of dissimilarity among genes was deduced, and the hierarchical clustering gene dendrogram was obtained accordingly. According to the standard of dynamicTreecut, the number of genes was set to 30 as the minimum number of each module. Here, we used different colors to represent all the modules, among which gray, by default, represented the genes that could not be classified into any module. Sixteen modules were finally obtained, and the visualization results are shown in Figure 3A. There were 229 genes in the black, 645 in the blue, 456 in the brown, 54 in the cyan, 393 in the green, 138 in the magenta, 50 in the midnightblue, 165 in the pink, 124 in the purple, 319 in the red, 66 in the salmon, 75 in the tan, 1092 in the turquoise, 413 in the yellow, and 601 in the gray modules. Detailed information of these genes can be found in Table S2. We verified the module preservation by randomly selecting test sets and training sets in the dataset and found that all modules had high preservation, especially the turquoise module (Figure 3B).
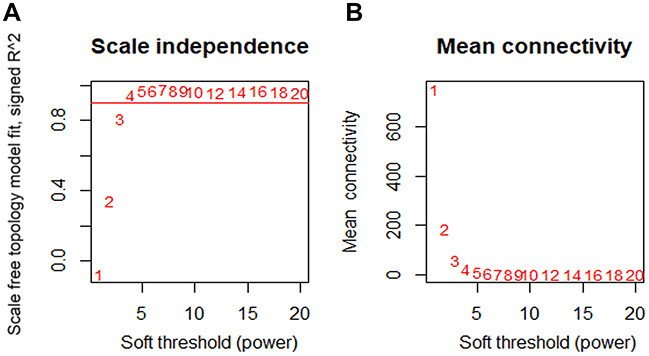 |
Figure 2 Determination of the soft-thresholding power. Notes: (A) Analysis of the scale-free fit index for various soft-thresholding powers (β). (B) Analysis of the mean connectivity for various soft-thresholding powers. The best fit power value was 4. |
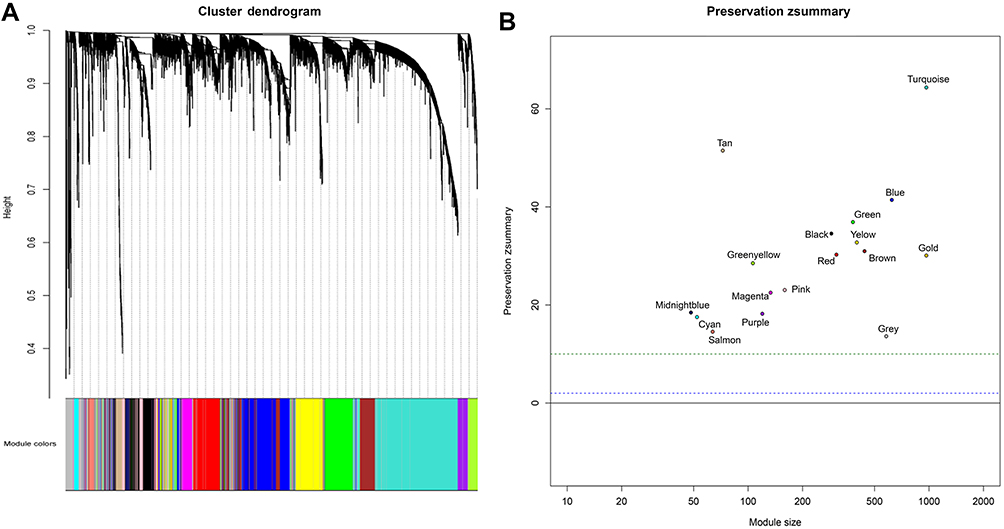 |
Figure 3 (A) Cluster dendrogram of genes. Each branch in the figure represents one gene, and every color below represents one co-expression module. (B) Zsummary statistics of module preservation. The figure shows the preservation Zsummary statistic (y-axis) as a function of the module size. The blue (low) and green (high) lines are thresholds indicating the 2< Z <10 region corresponding to moderate/high preservation. |
Relating clinical traits to modules and correlation between modules
The Pearson correlation coefficients of the module Eigengenes and corresponding variables represent the correlation between the modules and clinical traits. The results are shown in Figure 4. Among the clinical information included in the study, gender, age, smoking, alcohol consumption, tumor type, site, grade, stage, metastasis and infection of HPV16 were nontime-related variables. We found that the absolute correlation coefficients of each module with gender, tumor type and metastasis were small, and the correlation was almost insignificant. Age, smoking and alcohol consumption were weakly correlated with some modules. The site, grade, stage of tumors and infection of HPV16 are strongly correlated with some modules. It was obvious that the brown module, green module and turquoise module show a significant correlation with clinical traits. As illustrated in Figure 4, to further analyze genes in these modules, we found a strong correlation between the Gene Significance for the tumor site and Module Membership in the turquoise module (cor =0.58, p=3.6e−99), and the turquoise module was negatively correlated with the tumor site (cor =−0.23, p=(3e−4)) (Figure 5A). There is a negative correlation between genes in the brown module and N category, as shown in Figure 5B. Additionally, GS for the infection status of HPV16 was negatively correlated with MM in the green module, as shown in Figure 5C. Additionally, we constructed a hierarchical clustering tree based on WGCNA module eigengenes and the heat map of adjacency between modules. The colors are from low adjacency (green) to high adjacency (red) to show the relationship between the eigengenes of the WGCNA module (Figure 5D).
 |
Figure 4 Heatmap of the correlation between the module eigengenes and clinical traits. Turquoise, green and brown modules are three most closely related modules to clinical traits. |
 |
Figure 5 (A) Scatter plot of gene significance for the tumor site and module membership in the turquoise module. (B) Scatter plot of gene significance for the n category and module membership in the brown module. (C) Scatter plot of gene significance for HPV16 infection and module membership in the green module. (D) Eigengene dendrogram and eigengene adjacency heatmap. |
Identification of key modules
We constructed a network heatmap plot with these 5,000 genes, as shown in Figure S2. The different colors of the horizontal axis and vertical axis represented different modules, and the color differences of each block could be clearly seen. Among them, the turquoise module had the darkest yellow color. At the same time, we found that the turquoise module has a significant correlation with many clinical features in Figure 4. Thus, this module was identified as a key module. Next, we will further analyze the genes in this module.
Function enrichment analysis in the turquoise module
We performed enrichment analysis to explore the GO database and KEGG pathway in which the turquoise module genes are involved. The main results are shown in Tables 1 and 2. The enrichment results showed that the biological process of turquoise module genes mainly involved inflammation-related and immune responses, such as T-cell activation, leukocyte cell-cell adhesion, positive regulation of T cells, and lymphocyte and leukocyte activation. The cell components associated with it included the Major Histocompatibility Complex (MHC) class II protein complex, MHC protein complex, membrane raft, and T-cell receptor complex, which are spatially related to the surface and extracellular space of immune cells. Simultaneously, the molecular function of the module was related to MHC class II receptor activity and nonmembrane spanning protein tyrosine kinase activity (see Tables S3 and S4 for more information). More specifically, pathway enrichment analysis of the module indicated that inflammation and the tumor microenvironment evolution mechanisms are related to these genes. Important pathways such as Th1 and Th2 cell differentiation, Th17 cell differentiation, hematopoietic cell lineage, and intestinal immune network for IgA production were enriched. Other pathways such as Staphylococcus aureus infection,viral myocarditis,Epstein-Barr virus infection,and human T-cell leukemia virus 1 infection also showed enrichment. The visualization of the enrichment results is shown in Figure 6. The characteristic information may further promote our research on the pathogenesis and tumorigenesis of HNSCC.
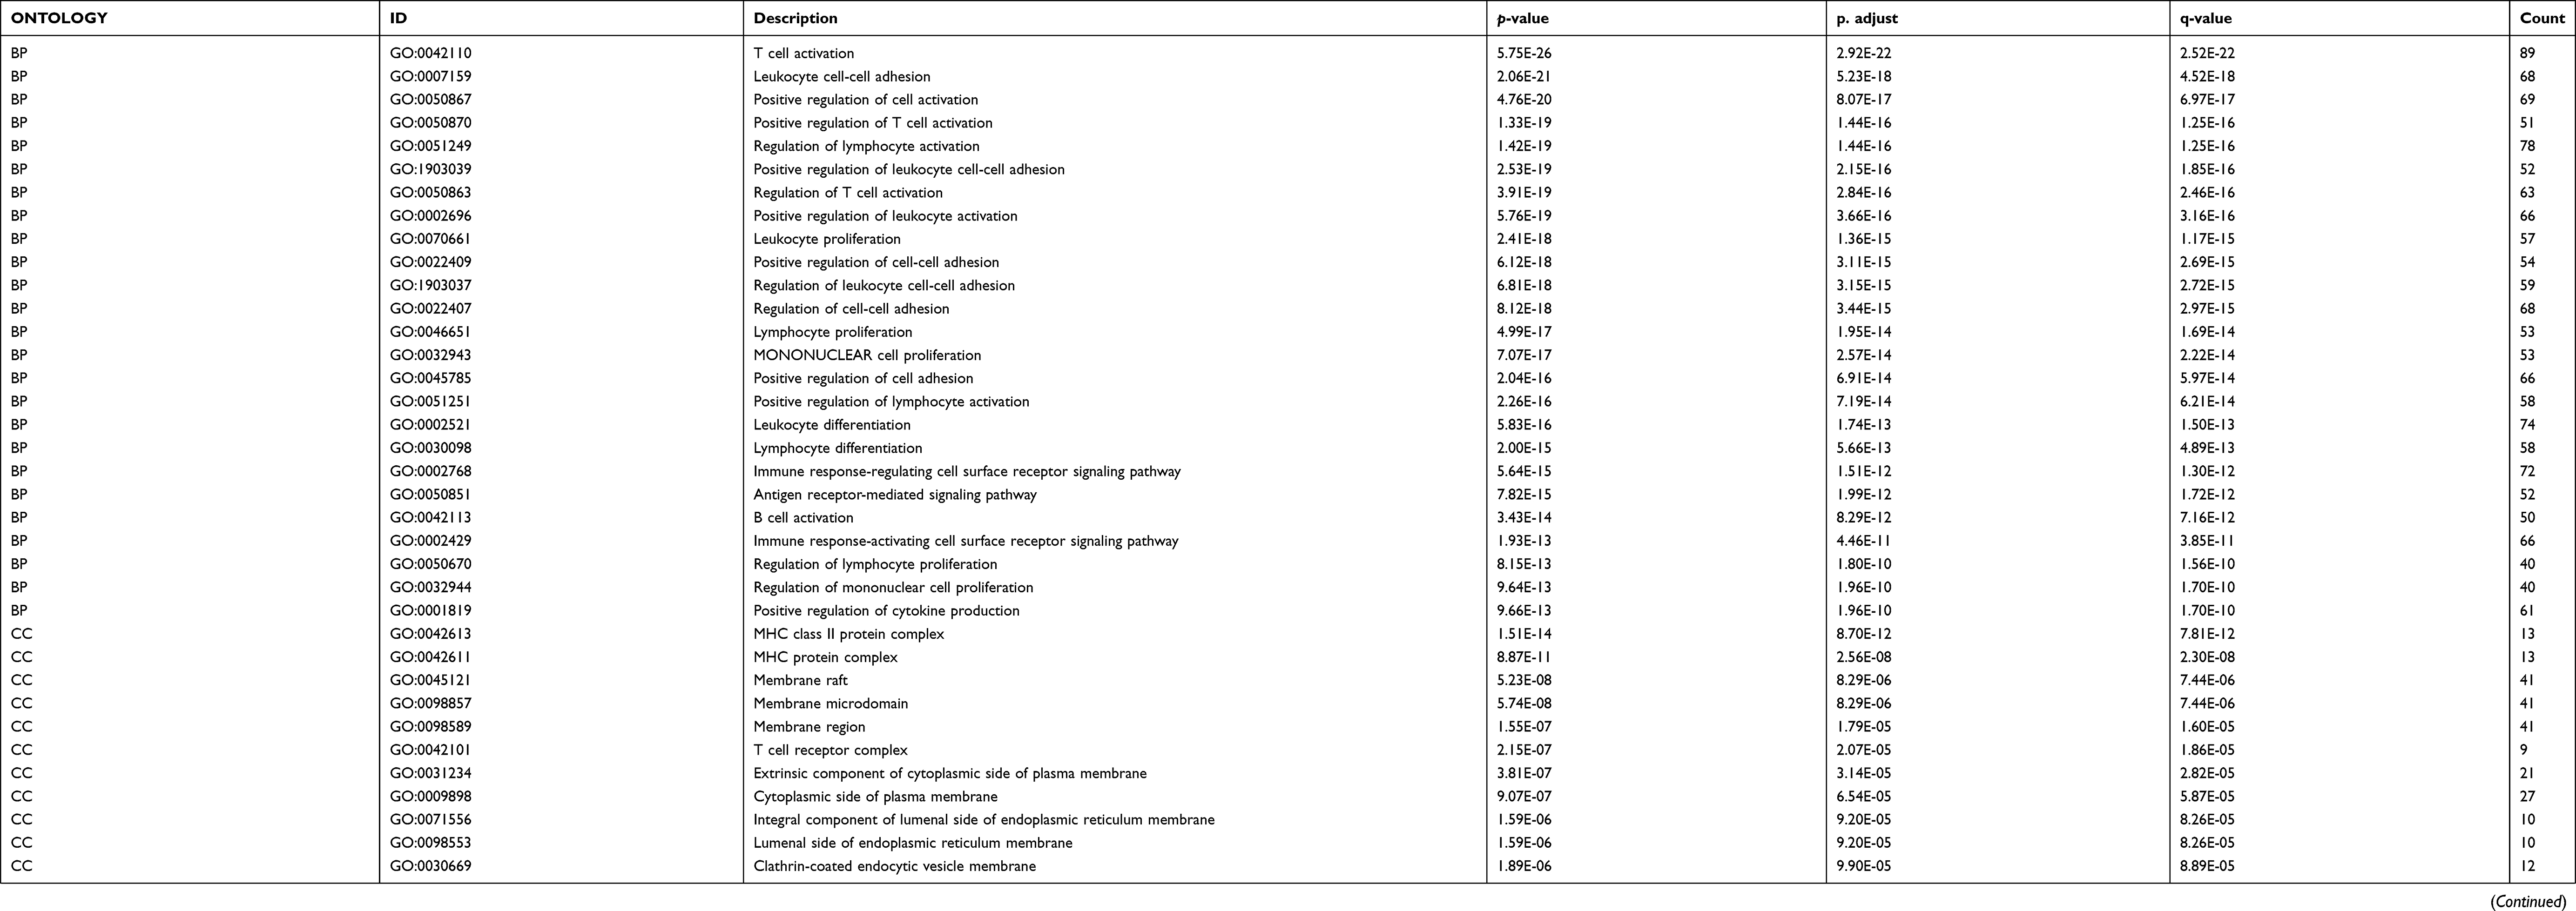 |
Table 1 GO analysis of genes in turquoise module |
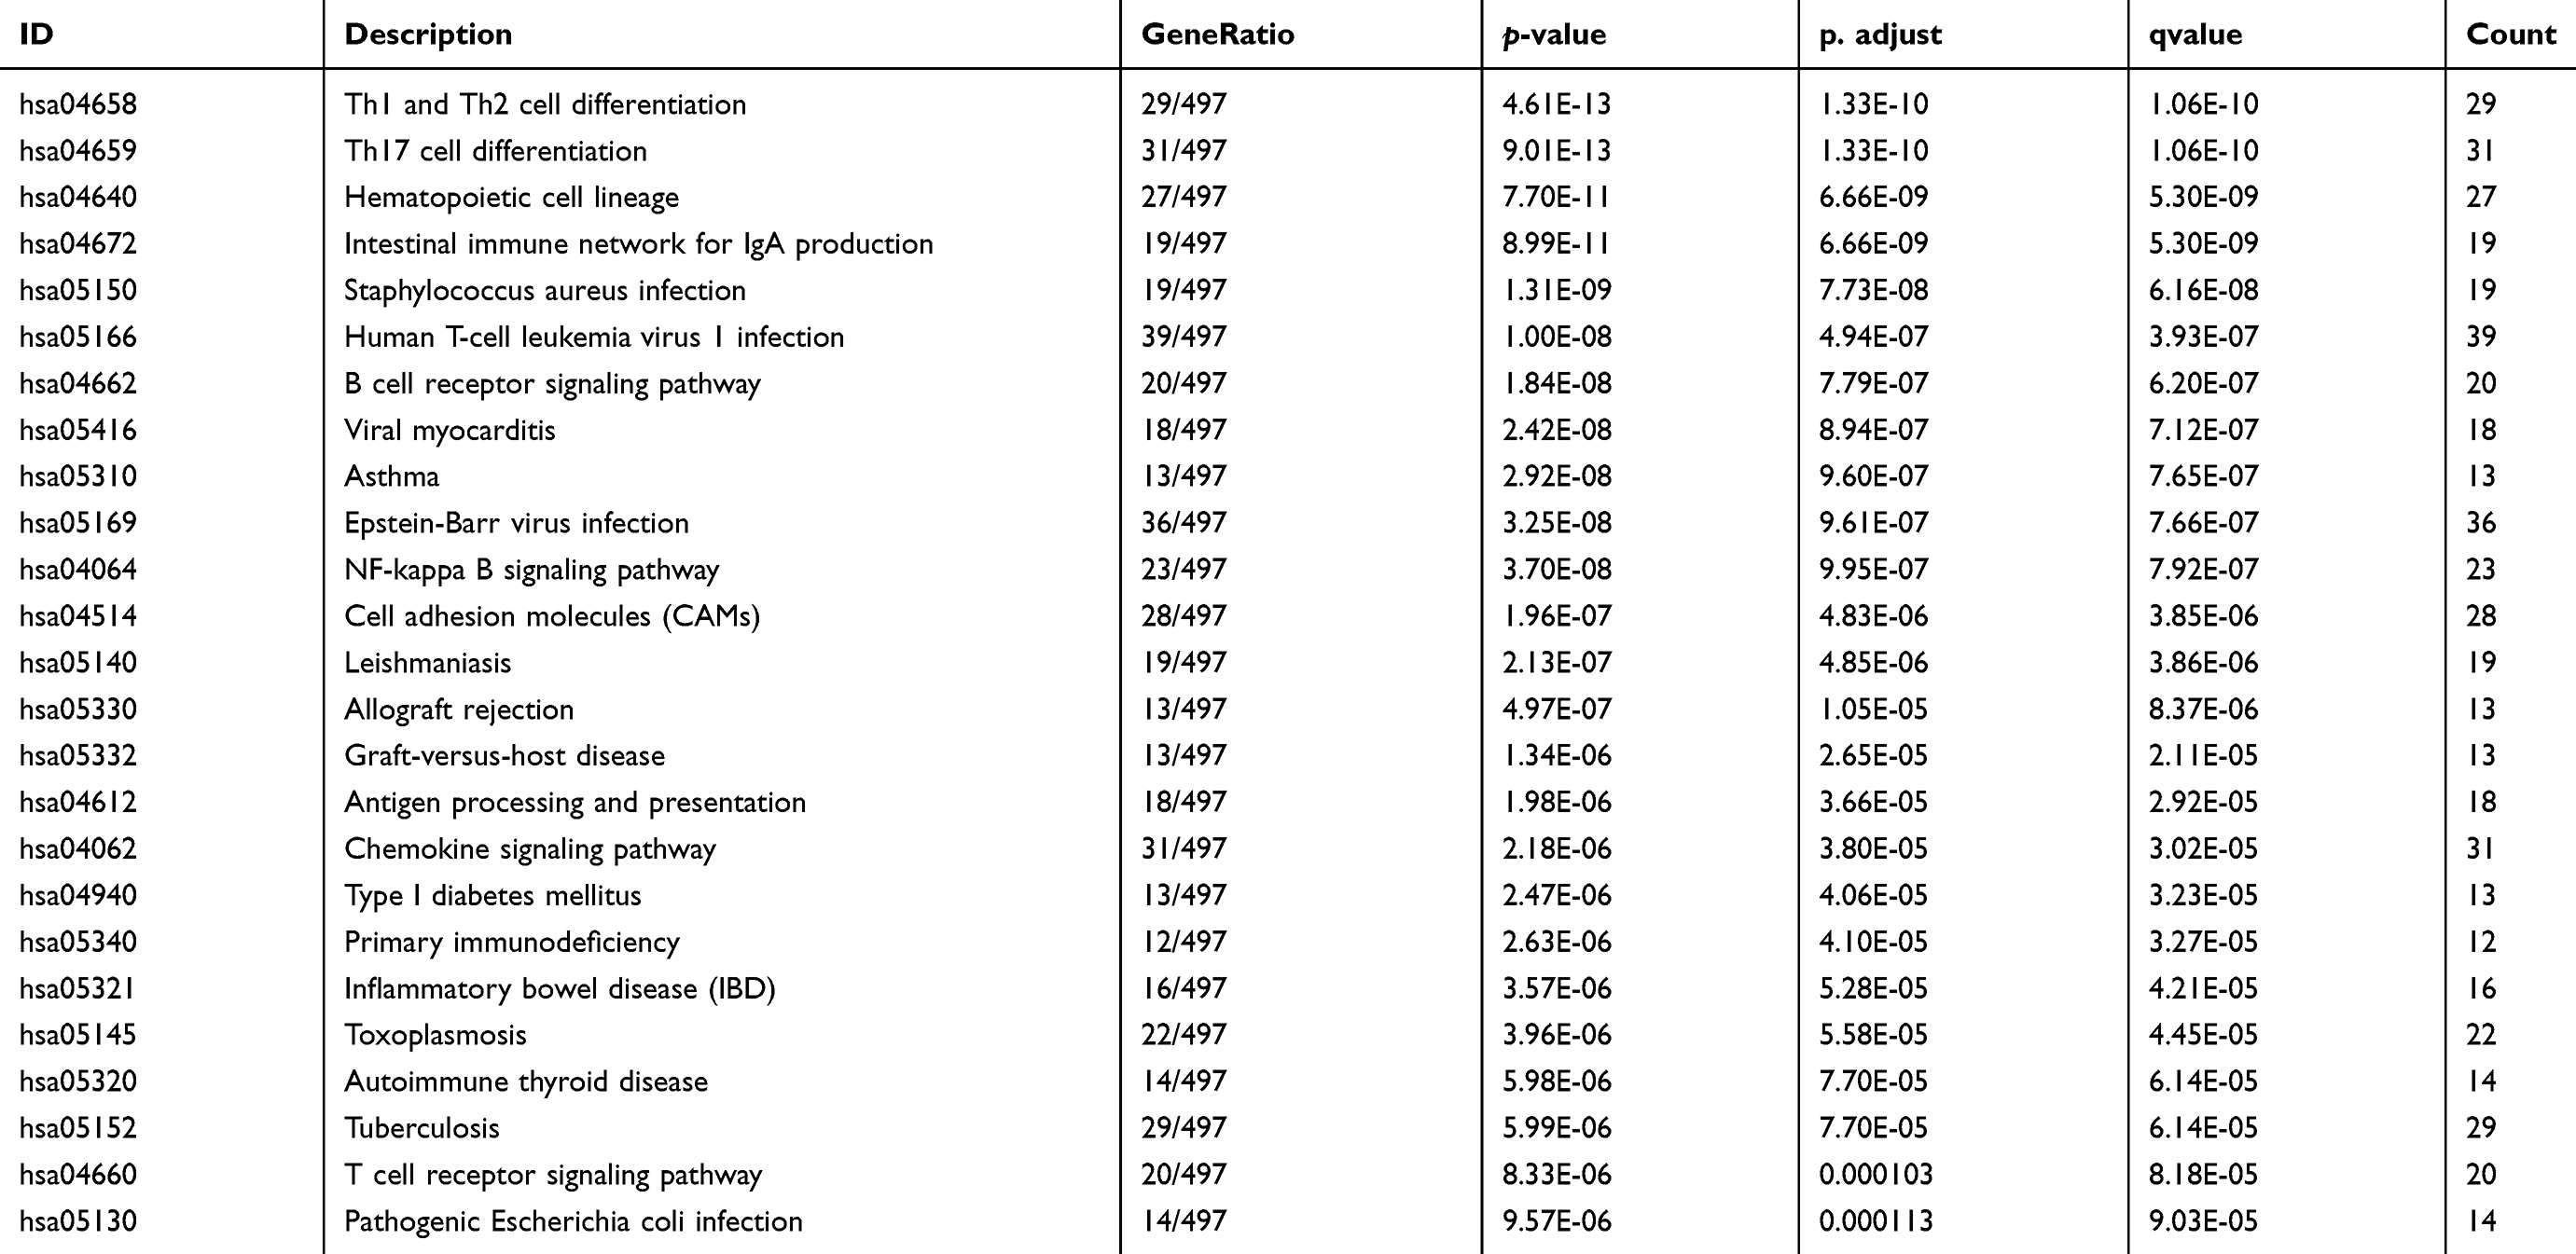 |
Table 2 KEGG pathway analysis of turquoise module |
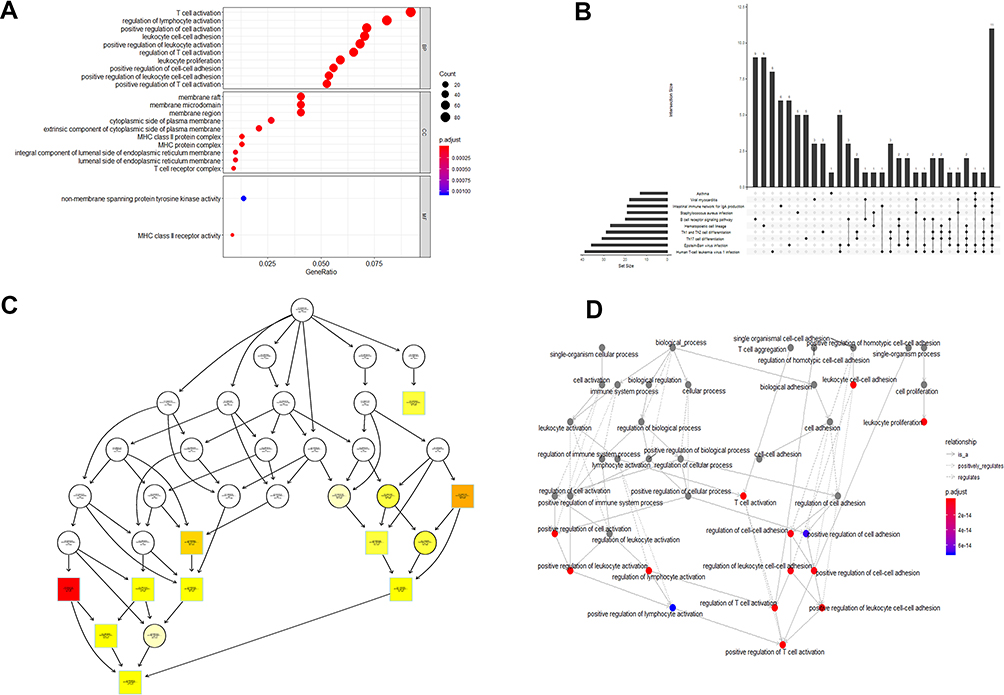 |
Figure 6 GO and KEGG pathway enrichment analyses of turquoise module genes. (A) Dotplot of GO analysis divided into three functional groups: biological processes, cell composition and molecular function. (B) UpSet plot of KEGG pathway enrichment, visualizing the complex association between genes and different pathways. It emphasizes the genes overlapping among different pathways. (C) plotGOgraph of Biological Processes depicting tree-like relationships between different processes. (D) The terms of Biological Processes are organized as a directed acyclic graph. An insightful way to view the results of the analysis is to investigate how the significant Biological Processes are distributed over the GO graph. The goplot function shows the subgraph induced by the most significant terms. Abbreviations: GO, Gene Ontology; KEGG, Kyoto Encyclopedia of Genes and Genomes. |
Identification of hub genes in the turquoise module
We used the Matthews correlation coefficient (MCC) algorithm and degree to rank the genes in the turquoise module (see Tables S5 and S6 for more information). The first 30 genes were selected and intersected with 18 hub genes selected by HNSCC data from the TCGA database by WGCNA.26 The results are shown in Figure S3A (Detailed results are shown in Table 3). Figure S3B is a plot of the connectivity among the first 30 genes selected by degree sequencing (see Table S7 for more information). We screened these genes and identified 16 genes that have an impact on survival in patients with HNSCC by GEPIA.27 The results are shown in Figure 7, and these genes are considered as hub genes.
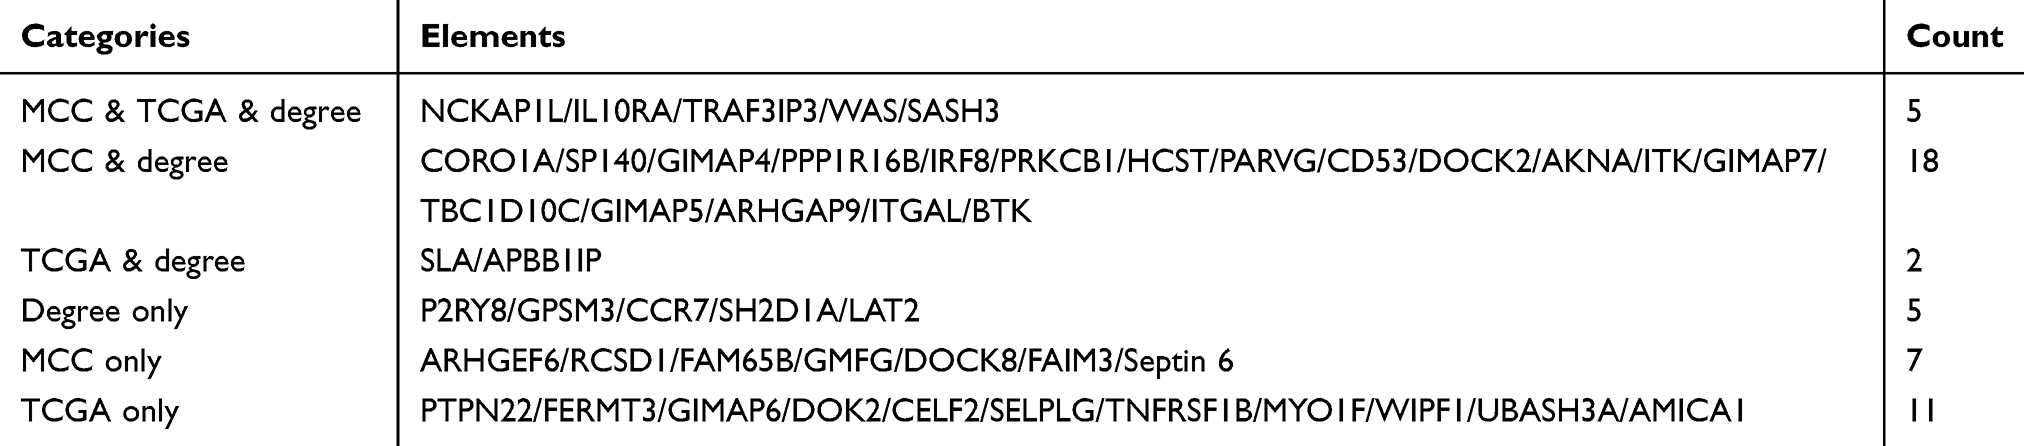 |
Table 3 Common genes between different algorithms and the hub gene obtained from TCGA |
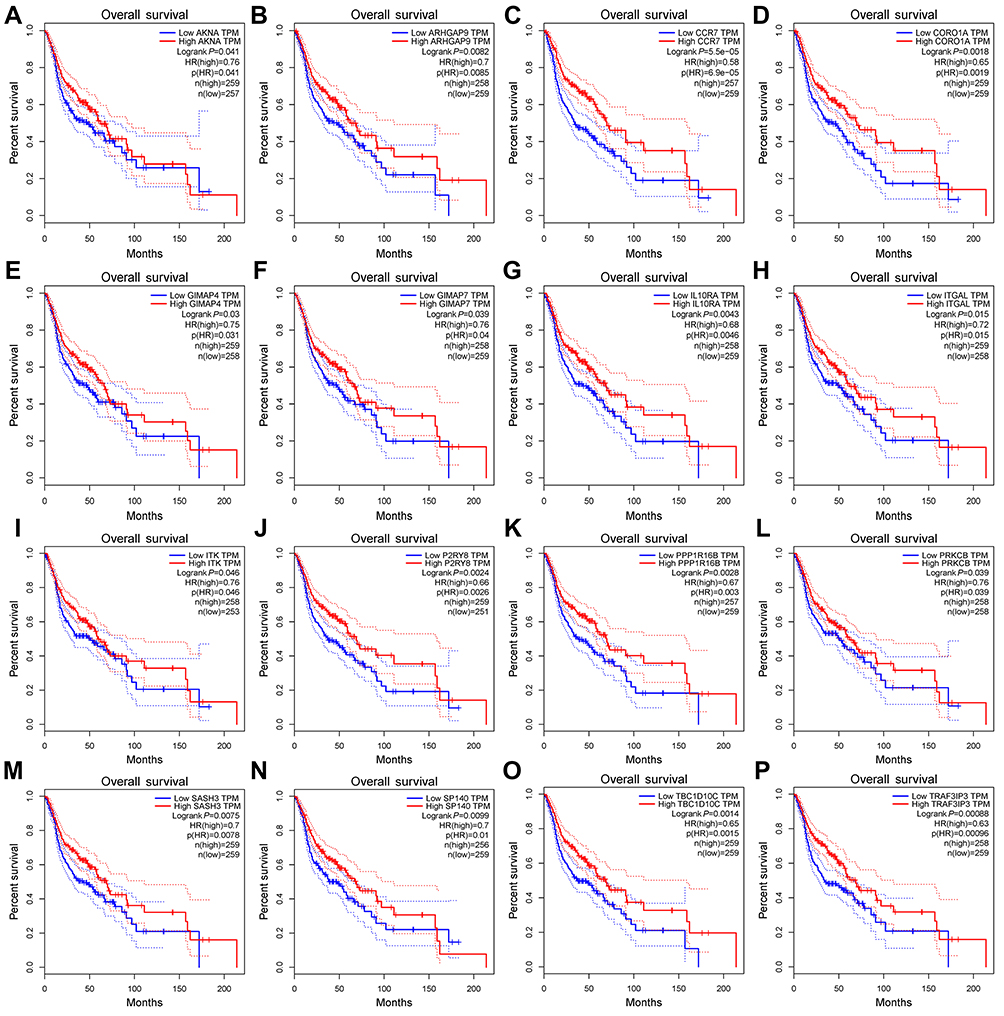 |
Figure 7 Survival analysis of 16 hub genes from the turquoise module. They are ARHGAP9, SASH3, CORO1A, ITGAL, PPP1R16B, TBC1D10C, IL10RA, ITK, AKNA, PRKCB, TRAF3IP3, GIMAP4, CCR7, P2RY8, GIMAP7 and SP140. P<0.05 was regarded as significant. |
Validation and exploration of hub genes
GEPIA was used to validate the changes in these 16 hub genes in normal and tumor tissues. Figure 8 shows the expression difference of these genes between normal and tumor tissues in HNSCC. The expression of most genes in tumors was higher than that in normal tissues. Except for PPP1R16B, there was no significant difference between tumors and normal tissues. GIMAP7 expression in normal tissues was higher than that in tumors. CBioPortal28,29 was used to further explore these genes, and queried genes were altered in 183 (37%) patients. The frequency of change of each hub gene in HNSCC is shown in Figure 9A, and TBC1D10C is altered the most (10%). We can tell that the upregulation and amplification of these genes are the main changes in HNSCC. Figure 9B shows 16 queried genes and the 50 most frequently changed neighbor genes, which also introduces the relationship between central genes and cancer drugs. ITK and ITGAL are the targets of cancer drugs. Figure S4 is the relationship between the methylation and gene expression of these genes in HNSCC explored in CBioPortal. ARHGAP9, SASH3 and P2RY8 have no methylation information. The expression of other genes is negatively correlated with the degree of methylation, indicating that the upregulation of these genes may be caused by hypomethylation.
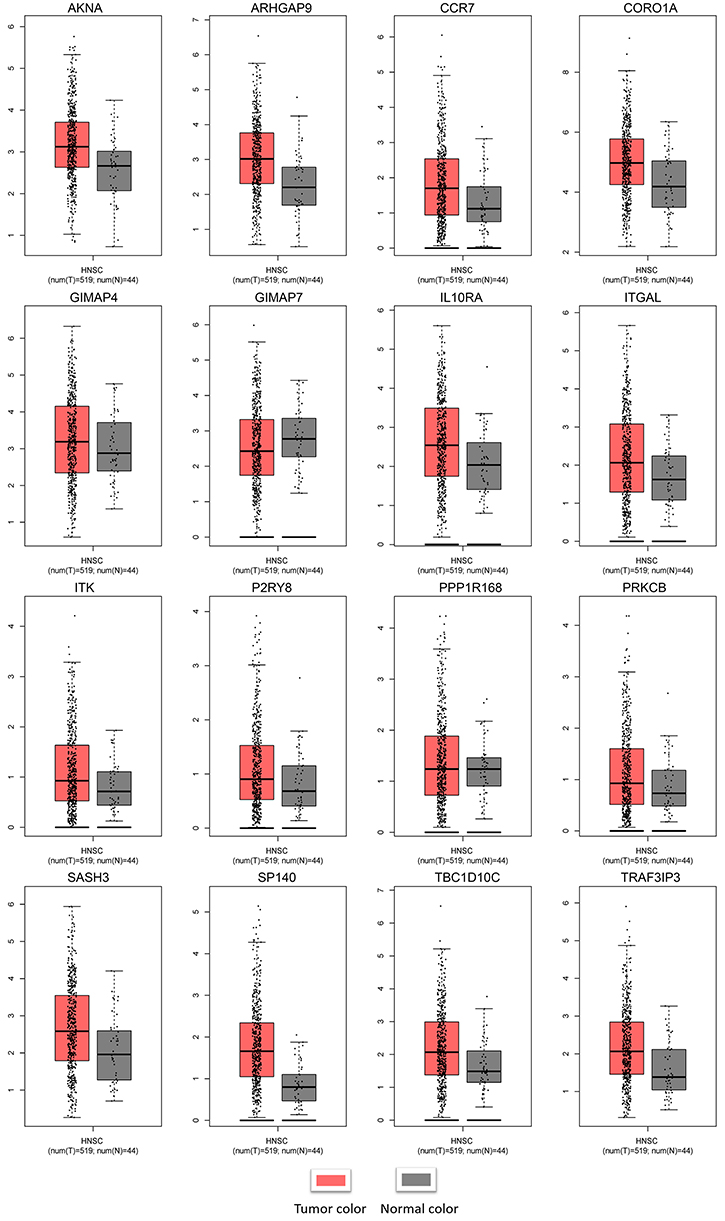 |
Figure 8 Validation of the hub genes at the transcriptional level. Notes: Validation of the hub genes by the TCGA HNSCC dataset in GEPIA. The expression of most genes in tumors was higher than that in normal tissues. Except for PPP1R16B, there was no significant difference in expression between tumors and normal tissues. GIMAP7 expression in normal tissues was higher than that in tumors. Abbreviations: TCGA, The Cancer Genome Atlas; HNSCC, Head and neck squamous cell carcinoma. |
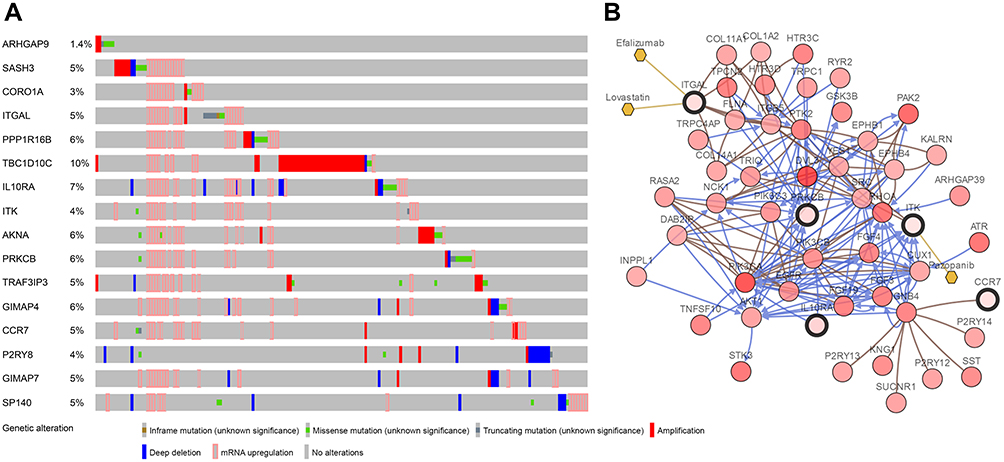 |
Figure 9 (A) The alteration frequency of 16 hub genes in the TCGA HNSCC dataset is illustrated. (B) Gene network and tumor drugs associated with the hub genes in the TCGA HNSCC dataset. Abbreviation: TCGA, The Cancer Genome Atlas. |
Discussion
HNSCC is a common malignant tumor caused by squamous cell abnormalities. The 5-year survival rate of patients with early HNSCC is 40–60%. However, for patients with local recurrence and distant metastasis, the median survival time after palliative chemotherapy is only 6–9 months. The survival time of advanced patients with chemotherapy tolerance has decreased to 3–6 months.30 Therefore, studying the development of HNSCC at the molecular level and formulating effective measures to prevent and suppress the metastasis of HNSCC are of great significance for the prevention and treatment of HNSCC.
Weighted network analysis can be used to provide a holistic view of disease dynamics, while also enabling us to reduce complexity to a direct relationship. This method may reveal new discoveries of the disease status and mechanism of tumor evolution. It has been used to analyze the molecular mechanisms of many diseases, such as breast cancer31 and inflammatory bowel disease.32 In this study, we used this important tool to analyze HNSCC samples in the GSE65858 dataset. We used this method to transform the expression data from 5,000 genes to 16 modules. Next, we combined them with various clinical information. In these modules, we further focused on gene pivots highly related to various clinical features. Functional enrichment of key module genes was analyzed by R software. Sixteen hub genes significantly related to the survival rate were identified in key modules and were further validated in TCGA to verify the reliability of the results. We also compared the hub genes obtained by WGCNA from the TCGA data of HNSCC,33 and found a high degree of overlap, indicating that this module is highly preservative, and these genes are indeed related to the pathogenesis of HNSCC. CBioPortal was used to explore hub genes and their genetic alteration. Based on the measurable changes in network analysis, more samples were analyzed. These gene changes provide new insights into the molecular explanation of the pathogenesis of HNSCC, and the hub genes may be used as biomarkers and therapeutic targets for the accurate diagnosis and treatment of HNSCC in the future, providing an early warning to clinicians about patients at risk for progressive disease development. Current advances in cancer treatment are focused on precise/personalized approaches based on detectable molecular abnormalities in patients’ tumors, which can then be utilized in a targeted manner.
HNSCC evades immune responses through multiple resistance mechanisms. It is characterized by an immunosuppressive environment which includes the release of immunosuppressive factors,34 activation, expansion of immune cells with inhibitory activity and the reduction of tumor immunogenicity.35,36 This is why HNSCC has long been considered an immunosuppressive disease. Patients often show a low absolute lymphocyte count, spontaneous apoptosis of cytotoxic T lymphocytes (CTLs), deficiencies in NK cell activity and antigen presentation dysfunction. The key module selected by WGCNA also confirms this view. The preservation of this module is very strong, indicating that the genes in it are closely related and highly correlated. Moreover, its gene function enrichment analysis is mainly focused on immune-related pathways, suggesting that the pathogenesis of HNSCC may be related to immune disorders. The survival analysis of hub genes reveals that the expression of immune-related genes may affect the prognosis of patients with HNSCC. Survival analysis in HNSCC patients showed that patients with high expression of these genes had a higher survival rate (p<0.05), with biological significance. To further explore the expression differences of these genes in normal and tumor tissues, we found that the expression of many genes in tumors was higher than that in normal tissues, indicating that these immune-related genes were activated in HNSCC and played roles such as inhibiting the process of tumorigenesis and formation of the local tumor microenvironment. These data also provide us with a new idea for the treatment of HNSCC.
Ideally, the immune system can play an active immune killing role by recognizing the relevant or specific antigens of tumors. If the immunogenicity of tumor cells is weakened, they can grow and spread without the control and establish a local immunosuppressive microenvironment.37 Among all malignant tumors, head and neck squamous cell carcinoma has a high mutation rate,38 and the establishment of an immunosuppressive microenvironment is the key to tumorigenesis and development.39 In recent years, tumor immunotherapy has gradually become one of the hotspots in clinical and basic research of cancer and has made breakthroughs in the treatment of melanoma, lung cancer and other tumors.40 Immunotherapy of tumors is mainly aimed at curing tumors by improving the patient’s own immune system and inducing an anti-tumor immune response.41 Cytokines are often in a state of imbalance in the tumor microenvironment of head and neck squamous cell carcinomas—that is, immunosuppressive cytokines are more than immunostimulatory cytokines, thus promoting the immune escape of head and neck squamous cell carcinomas. Compared with healthy people, HNSCC patients have fewer absolute T lymphocyte counts in peripheral blood and more inhibited regulatory T cells.42 At the same time, the tumor and its surrounding stromal cells can secrete many cytokines such as IL10 and tumor growth factor to form an immunosuppressive tumor microenvironment, which can avoid killing by reducing the expression of tumor antigen and promoting the apoptosis of cytotoxic T lymphocytes.43 Additionally, the inhibition of natural killer cell activity and damage of the dendritic cell antigen-presenting function are also important mechanisms to avoid epidemic surveillance of head and neck tumors.44 Therefore, immunotherapy for head and neck squamous cell carcinoma has great potential.
We analyzed the hub genes screened in this study. ARHGAP9 (Rho GTPase Activating Protein 9), a member of the RhoGAP family, has been identified as a RhoGAP for Cdc42 and Rac1.45 RhoGAP proteins promote the hydrolysis of GTP-bound Rho GTP enzymes, thus inactivating Rho GTP enzymes and inhibiting various cellular processes, such as gene transcription, cytoskeleton tissue, cell proliferation, migration and invasion.46 Recent studies have found that ARHGAP9 inhibits the migration and invasion of hepatocellular carcinoma cells by upregulating FOXJ2/E-cadherin.47 We speculate that ARHGAP9 may play a similar role in the genesis of HNSCC. GTPase, a family of immuno-related proteins (GIMAP), is most widely expressed in the immune system and is differentially regulated during early human Th-cell differentiation.48 The highly conserved human GIMAP gene region consists of seven functional genes and one pseudogene.49 Although they are likely to be regulated similarly, subcellular localization and structural differences indicate that each gene has a specific function.50 GIMAP4 plays a role in Th-cell secretion.51 But there is little research on GIAMP7, and the expression of GIMAP7 in normal tissues is higher than that in tumor tissues. This also indicates that there are different functions of genes in this family. We speculate that GIMAP7 may play a regulatory role in the regulation of the immune response in coordination with other molecules. It can be used as a potential molecular target for future exploration. SASH3 was also found to have associated changes in oligodendroglioma,52 and methylation of the PPP1R16B locus was reported in patients with colorectal cancer.53 CORO1A is an actin regulatory protein mainly expressed in hematopoietic cells that is essential for the development of T cells and homeostasis.54 These genes have not yet been reported to play a role in HNSCC and warrant further exploration. The role of IL10 in the regulation of the immune response during tumorigenesis has been widely described,55 which corresponds to what we found in this study that the higher expression of IL10RA in HNSCC than in normal samples. Our study also found that the expression of IL10RA affect the prognosis of HNSCC, presumably related to the different expression of IL10. TBC1D10C was previously proven to bind and inhibit Ras and Calcineurin proteins. It has been proven that TBC1D10C exhibits a physical interaction with H-Ras and CaN in T cells, inhibits the Ras/MAPK signaling pathway and is a negative feedback inhibitor of the CaN signaling pathway.56 It was hypothesized that human AKNA is encoded by a single gene located in the FRA9E region of chromosome 9q3257 that is associated with functional deletion mutations and often leads to inflammatory and neoplastic diseases.58 Recent findings that single-nucleotide polymorphisms (SNPs) in the AT-hook domain of human AKNA increase the risk of cervical cancer support this hypothesis.59 Overall, these genes play an important role in HNSCC tumorigenesis. However, the primary limitation of the present study was that these important hub genes remain to be verified by experiments; therefore, further analyses are required to determine the mechanisms underlying the growth of HNSCC cells. Further research is required to fully explore their roles in HNSCC.
In general, the innovative use of a weighted network to analyze HNSCC samples provides new insights into the molecular mechanism and prognosis of HNSCC. We can combine more information in future research, such as SNPs, leading to better understanding of HNSCC.
Acknowledgments
This study was supported by grants from the National Natural Science Foundation of China (81870743 and 81470722) and the Creative Spark Fund of Sichuan University (2018SCUH0007).
Disclosure
The authors report no conflicts of interest in this work.
References
1. Marur S, Forastiere AA. Head and neck squamous cell carcinoma: update on epidemiology, diagnosis, and treatment. Mayo Clin Proc. 2016;91(3):386–396. doi:10.1016/j.mayocp.2015.12.017
2. Cancer Genome Atlas Network. Comprehensive genomic characterization of head and neck squamous cell carcinomas. Nature. 2015;517(7536):576‐582. doi:10.1038/nature14129
3. Pan Y, Song Y, Cheng L, et al. Analysis of methylation-driven genes for predicting the prognosis of patients with head and neck squamous cell carcinoma. J Cell Biochem. 2019. doi:10.1002/jcb.29252
4. Stephen JK, Divine G, Chen KM, et al. Significance of p16 in site-specific HPV positive and HPV negative head and neck squamous cell carcinoma. Cancer Clin Oncol. 2013;2(1):51–61. doi:10.5539/cco.v2n1p51
5. Sepiashvili L, Bruce JP, Huang SH, et al. Novel insights into head and neck cancer using next-generation “omic” technologies. Cancer Res. 2015;75(3):480–486. doi:10.1158/0008-5472.can-14-3124
6. Vermorken JB, Mesia R, Rivera F, et al. Platinum-based chemotherapy plus cetuximab in head and neck cancer. N Engl J Med. 2008;359(11):1116–1127. doi:10.1056/nejmoa0802656
7. Sun W, Gaykalova DA, Ochs MF, et al. Activation of the NOTCH pathway in head and neck cancer. Cancer Res. 2014;74(4):1091–1104. doi:10.1158/0008-5472.CAN-13-1259
8. Rothenberg SM, Ellisen LW. The molecular pathogenesis of head and neck squamous cell carcinoma. J Clin Invest. 2012;122(6):1951–1957. doi:10.1172/JCI59889
9. Lucas JT, Salimath BP, Slomiany MG, et al. Regulation of invasive behavior by vascular endothelial growth factor is HEF1-dependent. Oncogene. 2010;29(31):4449–4459. doi:10.1038/onc.2010.185
10. Simanshu DK, Nissley DV, McCormick F. RAS proteins and their regulators in human disease. Cell. 2017;170(1):17–33. doi:10.1016/j.cell.2017.06.009
11. Chen Y, Zhu J, Lum PY, et al. Variations in DNA elucidate molecular networks that cause disease. Nature. 2008;452(7186):429–435. doi:10.1038/nature06757
12. Kallioniemi OP, Kononen J, Sauter G. Tissue microarrays for high-throughput profiling in molecular oncology. Breast Cancer Res. 2000;2(Suppl 1):
13. D’Haeseleer P, Liang S, Somogyi R. Genetic network inference: from co-expression clustering to reverse engineering. Bioinformatics. 2000;16(8):707–726. doi:10.1093/bioinformatics/16.8.707
14. Zhang B, Horvath S. A general framework for weighted gene co-expression network analysis. Stat Appl Genet Mol Biol. 2005;4:Article17. doi:10.2202/1544-6115.1128
15. Ivliev AE, Hoen PAC, Sergeeva MG. Coexpression network analysis identifies transcriptional modules related to proastrocytic differentiation and sprouty signaling in glioma. Cancer Res. 2010;70(24):10060–10070. doi:10.1158/0008-5472.can-10-2465
16. Clarke C, Madden SF, Doolan P, et al. Correlating transcriptional networks to breast cancer survival: a large-scale coexpression analysis. Carcinogenesis. 2013;34(10):2300–2308. doi:10.1093/carcin/bgt208
17. Ghazalpour A, Doss S, Zhang B, et al. Integrating genetic and network analysis to characterize genes related to mouse weight. PLoS Genet. 2006;2(8):e130. doi:10.1371/journal.pgen.0020130
18. Langfelder P, Horvath S. WGCNA: an R package for weighted correlation network analysis. BMC Bioinformatics. 2008;9:559. doi:10.1186/1471-2105-9-559
19. Li A, Horvath S. Network neighborhood analysis with the multi-node topological overlap measure. Bioinformatics. 2007;23(2):222–231. doi:10.1093/bioinformatics/btl581
20. Langfelder P, Luo R, Oldham MC, et al. Is my network module preserved and reproducible? PLoS Comput Biol. 2011;7:e1001057. doi:10.1371/journal.pcbi.1001057
21. Kanehisa M, Goto S. KEGG: kyoto encyclopedia of genes and genomes. Nucleic Acids Res. 2000;28(1):27–30. doi:10.1093/nar/28.1.27
22. Gene Ontology Consortium. The Gene Ontology (GO) project in 2006. Nucleic Acids Res. 2006;34(Database issue):D322–D326. doi:10.1093/nar/gkj021
23. Yu G, Wang L-G, Han Y, et al. clusterProfiler: an R package for comparing biological themes among gene clusters. OMICS. 2012;16(5):284–287. doi:10.1089/omi.2011.0118
24. Zhou Z, Cheng Y, Jiang Y, et al. Ten hub genes associated with progression and prognosis of pancreatic carcinoma identified by co-expression analysis. Int J Biol Sci. 2018;14:124–136. doi:10.7150/ijbs.22619
25. Shang J, Wang F, Chen P, et al. Co-expression network analysis identified COL8A1 is associated with the progression and prognosis in human colon adenocarcinoma. Dig Dis Sci. 2018;63(5):1219–1228. doi:10.1007/s10620-018-4996-5
26. Sanati N, Iancu OD, Wu G, et al. Network-based predictors of progression in head and neck squamous cell carcinoma. Front Genet. 2018;9:183. doi:10.3389/fgene.2018.00183
27. Tang Z, Li C, Kang B, et al. GEPIA: a web server for cancer and normal gene expression profiling and interactive analyses. Nucleic Acids Res. 2017;45(W1):W98–W102. doi:10.1093/nar/gkx247
28. Gao J, Aksoy BA, Dogrusoz U, et al. Integrative analysis of complex cancer genomics and clinical profiles using the cBioPortal. Sci Signal. 2013;6:pl1. doi:10.1126/scisignal.2004088
29. Cerami E, Gao J, Dogrusoz U, et al. The cBio cancer genomics portal: an open platform for exploring multidimensional cancer genomics data. Cancer Discov. 2012;2(5):401–404. doi:10.1158/2159-8290.CD-12-0095
30. Song Y, Pan Y, Liu J. Functional analysis of lncRNAs based on competitive endogenous RNA in tongue squamous cell carcinoma. PeerJ. 2019;7:e6991. doi:10.7717/peerj.6991
31. Gildener-Leapman N, Ferris RL, Bauman JE. Promising systemic immunotherapies in head and neck squamous cell carcinoma. Oral Oncol. 2013;49(12):1089–1096. doi:10.1016/j.oraloncology.2013.09.009
32. Mirza AH, Berthelsen CH, Seemann SE, et al. Transcriptomic landscape of lncRNAs in inflammatory bowel disease. Genome Med. 2015;7:39. doi:10.1186/s13073-015-0162-2
33. Ren Z-H, Lin C-Z, Cao W, et al. CD73 is associated with poor prognosis in HNSCC. Oncotarget. 2016;7(38):61690–61702. doi:10.18632/oncotarget.11435
34. Jie HB, Gildener-Leapman N, Li J, et al. Intratumoral regulatory T cells upregulate immunosuppressive molecules in head and neck cancer patients. Br J Cancer. 2013;109(10):2629–2635. doi:10.1038/bjc.2013.645
35. Mahadevan D, Spier C, Della Croce K, et al. Transcript profiling in peripheral T-cell lymphoma, not otherwise specified, and diffuse large B-cell lymphoma identifies distinct tumor profile signatures. Mol Cancer Ther. 2005;4(12):1867–1879. doi:10.1158/1535-7163.mct-05-0146
36. Mittal D, Gubin MM, Schreiber RD, et al. New insights into cancer immunoediting and its three component phases–elimination, equilibrium and escape. Curr Opin Immunol. 2014;27:16–25. doi:10.1016/j.coi.2014.01.004
37. Alexandrov LB, Nik-Zainal S, Wedge DC, et al. Signatures of mutational processes in human cancer. Nature. 2013;500(7463):415–421. doi:10.1038/nature12477
38. Moskovitz J, Moy J, Ferris RL. Immunotherapy for head and neck squamous cell carcinoma. Curr Oncol Rep. 2018;20:22. doi:10.1007/s11912-018-0654-5
39. Dogan V, Rieckmann T, Münscher A, et al. Current studies of immunotherapy in head and neck cancer. Clin Otolaryngol. 2018;43(1):13–21. doi:10.1111/coa.12895
40. Dillman RO. Cancer immunotherapy. Cancer Biother Radiopharm. 2011;26(1):1–64. doi:10.1089/cbr.2010.0902
41. Ghiringhelli F, Menard C, Puig PE, et al. Metronomic cyclophosphamide regimen selectively depletes CD4+CD25+ regulatory T cells and restores T and NK effector functions in end stage cancer patients. Cancer Immunol Immunother. 2007;56(5):641–648. doi:10.1007/s00262-006-0225-8
42. Takahashi H, Sakakura K, Kawabata-Iwakawa R, et al. Immunosuppressive activity of cancer-associated fibroblasts in head and neck squamous cell carcinoma. Cancer Immunol Immunother. 2015;64(11):1407–1417. doi:10.1007/s00262-015-1742-0
43. Ferris RL, Whiteside TL, Ferrone S. Immune escape associated with functional defects in antigen-processing machinery in head and neck cancer. Clin Cancer Res. 2006;12(13):3890–3895. doi:10.1158/1078-0432.ccr-05-2750
44. Furukawa Y, Kawasoe T, Daigo Y, et al. Isolation of a novel human gene, ARHGAP9, encoding a rho-GTPase activating protein. Biochem Biophys Res Commun. 2001;284(3):643–649. doi:10.1006/bbrc.2001.5022
45. Tcherkezian J, Lamarche-Vane N. Current knowledge of the large RhoGAP family of proteins. Biol Cell. 2007;99(2):67–86. doi:10.1042/bc20060086
46. Zhang H, Tang Q-F, Sun M-Y, et al. ARHGAP9 suppresses the migration and invasion of hepatocellular carcinoma cells through up-regulating FOXJ2/E-cadherin. Cell Death Dis. 2018;9:916. doi:10.1038/s41419-018-0976-0
47. Filén -J-J, Filén S, Moulder R, et al. Quantitative proteomics reveals GIMAP family proteins 1 and 4 to be differentially regulated during human T helper cell differentiation. Mol Cell Proteomics. 2009;8(1):32–44. doi:10.1074/mcp.M800139-MCP200
48. Krücken J, Schroetel RMU, Müller IU, et al. Comparative analysis of the human gimap gene cluster encoding a novel GTPase family. Gene. 2004;341:291–304. doi:10.1016/j.gene.2004.07.005
49. Schwefel D, Arasu BS, Marino SF, et al. Structural insights into the mechanism of GTPase activation in the GIMAP family. Structure. 2013;21(4):550–559. doi:10.1016/j.str.2013.01.014
50. Heinonen MT, Kanduri K, Lähdesmäki HJ, et al. Tubulin- and actin-associating GIMAP4 is required for IFN-γ secretion during Th cell differentiation. Immunol Cell Biol. 2015;93(2):158–166. doi:10.1038/icb.2014.86
51. Erdem-Eraslan L, Heijsman D, de Wit M, et al. Tumor-specific mutations in low-frequency genes affect their functional properties. J Neurooncol. 2015;122(3):461–470. doi:10.1007/s11060-015-1741-1
52. Galamb O, Kalmár A, Barták BK, et al. Aging related methylation influences the gene expression of key control genes in colorectal cancer and adenoma. World J Gastroenterol. 2016;22(47):10325–10340. doi:10.3748/wjg.v22.i47.10325
53. Mugnier B, Nal B, Verthuy C, et al. Coronin-1A links cytoskeleton dynamics to TCR alpha beta-induced cell signaling. PLoS One. 2008;3(10):e3467. doi:10.1371/journal.pone.0003467
54. Föger N, Rangell L, Danilenko DM, et al. Requirement for coronin 1 in T lymphocyte trafficking and cellular homeostasis. Science. 2006;313(5788):839–842. doi:10.1126/science.1130563
55. Bruchhage K-L, Heinrichs S, Wollenberg B, et al. IL-10 in the microenvironment of HNSCC inhibits the CpG ODN induced IFN-α secretion of pDCs. Oncol Lett. 2018;15(3):3985–3990. doi:10.3892/ol.2018.7772
56. Pan F, Sun L, Kardian DB, et al. Feedback inhibition of calcineurin and Ras by a dual inhibitory protein Carabin. Nature. 2007;445(7126):433–436. doi:10.1038/nature05476
57. Sims-Mourtada JC, Bruce S, McKeller MR, et al. The human AKNA gene expresses multiple transcripts and protein isoforms as a result of alternative promoter usage, splicing, and polyadenylation. DNA Cell Biol. 2005;24(5):325–338. doi:10.1089/dna.2005.24.325
58. Savas S, Liu G. Genetic variations as cancer prognostic markers: review and update. Hum Mutat. 2009;30(10):1369–1377. doi:10.1002/humu.21078
59. Perales G, Burguete-García AI, Dimas J, et al. A polymorphism in the AT-hook motif of the transcriptional regulator AKNA is a risk factor for cervical cancer. Biomarkers. 2010;15(5):470–474. doi:10.3109/1354750x.2010.485332
 © 2019 The Author(s). This work is published and licensed by Dove Medical Press Limited. The
full terms of this license are available at https://www.dovepress.com/terms
and incorporate the Creative Commons Attribution
- Non Commercial (unported, 3.0) License.
By accessing the work you hereby accept the Terms. Non-commercial uses of the work are permitted
without any further permission from Dove Medical Press Limited, provided the work is properly
attributed. For permission for commercial use of this work, please see paragraphs 4.2 and 5 of our Terms.
© 2019 The Author(s). This work is published and licensed by Dove Medical Press Limited. The
full terms of this license are available at https://www.dovepress.com/terms
and incorporate the Creative Commons Attribution
- Non Commercial (unported, 3.0) License.
By accessing the work you hereby accept the Terms. Non-commercial uses of the work are permitted
without any further permission from Dove Medical Press Limited, provided the work is properly
attributed. For permission for commercial use of this work, please see paragraphs 4.2 and 5 of our Terms.